verka vk kirchliche vorsorge vvag · 2018-11-09 · assessment report | 2016 5 assessment...
TRANSCRIPT

VERKA VK Kirchliche Vorsorge VVaG

SHARING THIS REPORT
The PRI will not publish the assessment reports in 2016 however signatories can publish or share
this report. Should they choose to share/publish, they must:
■ Refer to the PRI assessment methodology;
■ Refer to their full Assessment Report if only a section is published;
■ Refer to their Transparency Report; and
■ Take every care not to represent scores out of context.
PRI DISCLAIMER
This document is based on information reported directly by signatories. Moreover, the underlying
information has not been audited by the PRI or any other party acting on its behalf. While every
effort has been made to produce a fair representation of performance, no representations or
warranties are made as to the accuracy of the information presented, and no responsibility or liability
can be accepted for damage caused by use of or reliance on the information contained within this
report.
ASSESSMENT REPORT | 2016
3 ASSESSMENT
INTRODUCTION
Thank you for participating in the
annual PRI Reporting and
Assessment process.
The Assessment report is designed to
provide feedback to signatories to support
ongoing learning and development.
A brief description of the information
presented in each section of this report and
how it should be interpreted is provided
below. Further information about the high-
level assessment methodology can be found
here and a companion document explaining
the assessment of each indicator can be
found here.
ORGANISATIONAL OVERVIEW
This section provides an overview of the main
characteristics of your organisation. This
information determined which modules and
indicators you reported on and determines
your peer groups.
SUMMARY SCORECARD
This section provides an overview of your
aggregate score for each module and the
median score. These bands range from ‘A+’
(top band) to ‘E’ (lowest band).
ASSESSMENT BY MODULE
For each module you reported on, you will
see a section that shows your:
■ Indicator scorecard
■ Section scores
■ Comparison to peer groups
INDICATOR SCORECARD AND MODULE
SCORES
Your indicator scorecard summarises the
scores you achieved for each core and
additional assessed indicator within each
module.
These will range from to . It
also provides basic information about the
performance of your organisation compared
with other signatories that responded to that
indicator. The number of stars determines
your overall module score. Please refer to the
assessment methodology summary for
additional information about how these
scores are calculated.
SECTION SCORES
Each module is divided into several sections.
The total number of stars you can achieve in
each section are added together and
presented in a spider chart.
PEER COMPARISON
Your total aggregated performance band for
each module will be compared against your
peer groups in a series of distribution charts.
CONFIDENTIALITY
The results of signatory's assessments can
be shared and published externally if the
signatory wishes to do so. PRI will not publish
the assessment reports in 2016. Please see
a full explanation on Page 2 of this report.
For more information, please contact the
PRI’s Reporting and Assessment Team on
[email protected] or +44 (0) 20 3714 3185

ASSESSMENT REPORT | 2016
4 ASSESSMENT
SUMMARY
ASSESSMENT REPORT | 2016
5 ASSESSMENT
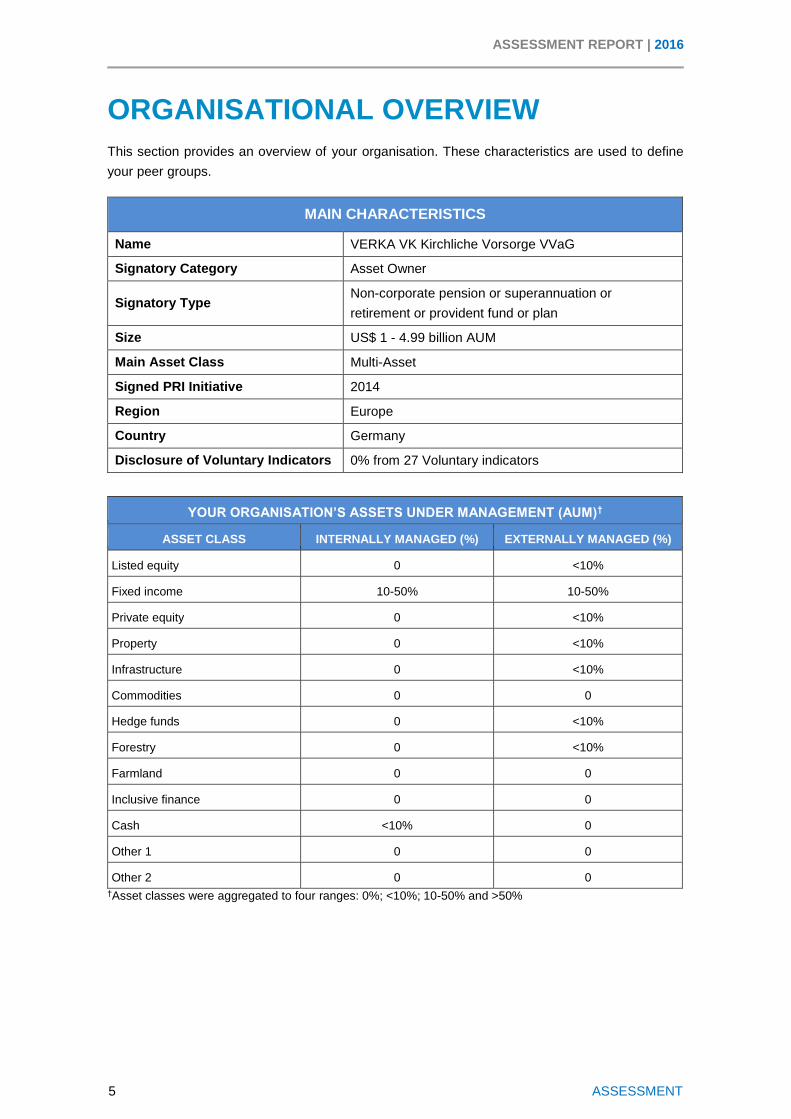
ORGANISATIONAL OVERVIEW
This section provides an overview of your organisation. These characteristics are used to define
your peer groups.
MAIN CHARACTERISTICS
Name VERKA VK Kirchliche Vorsorge VVaG
Signatory Category Asset Owner
Signatory Type Non-corporate pension or superannuation or
retirement or provident fund or plan
Size US$ 1 - 4.99 billion AUM
Main Asset Class Multi-Asset
Signed PRI Initiative 2014
Region Europe
Country Germany
Disclosure of Voluntary Indicators 0% from 27 Voluntary indicators
YOUR ORGANISATION’S ASSETS UNDER MANAGEMENT (AUM)†
ASSET CLASS INTERNALLY MANAGED (%) EXTERNALLY MANAGED (%)
Listed equity 0 <10%
Fixed income 10-50% 10-50%
Private equity 0 <10%
Property 0 <10%
Infrastructure 0 <10%
Commodities 0 0
Hedge funds 0 <10%
Forestry 0 <10%
Farmland 0 0
Inclusive finance 0 0
Cash <10% 0
Other 1 0 0
Other 2 0 0
†Asset classes were aggregated to four ranges: 0%; <10%; 10-50% and >50%
ASSESSMENT REPORT | 2016
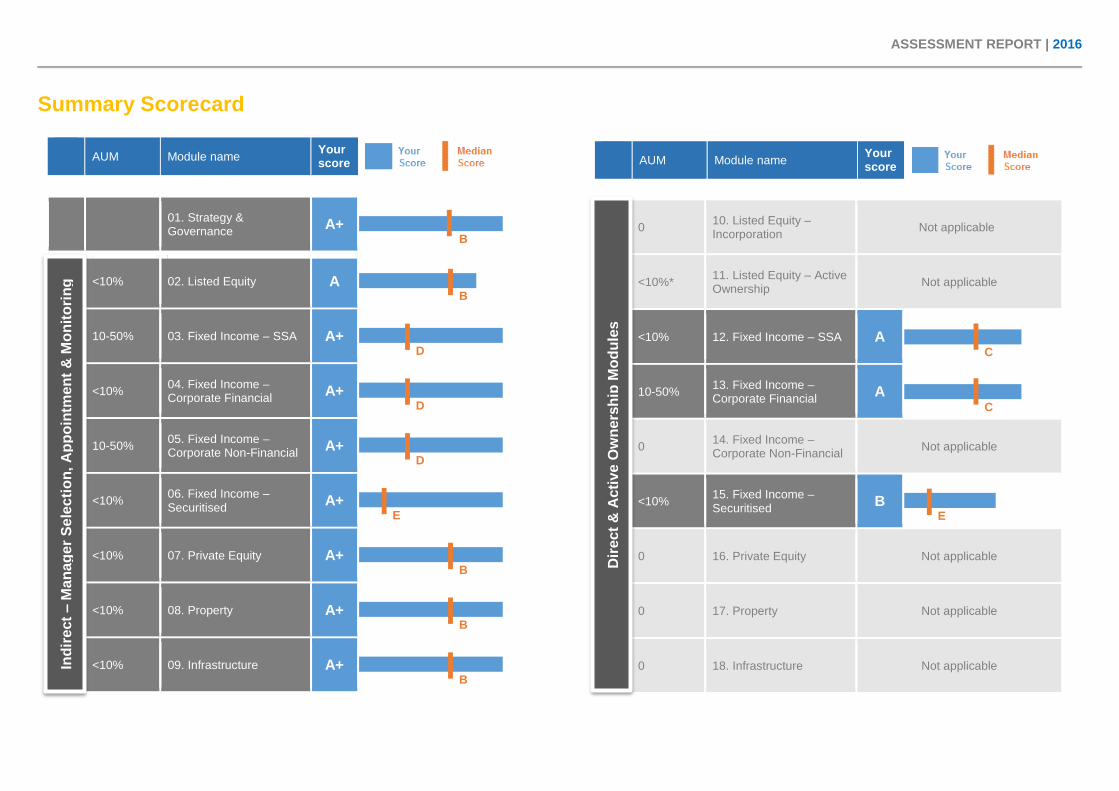
Summary Scorecard
AUM Module name
Your score
01. Strategy & Governance
A+
B
<10% 02. Listed Equity A
B
10-50% 03. Fixed Income – SSA A+
D
<10% 04. Fixed Income – Corporate Financial
A+
D
10-50% 05. Fixed Income – Corporate Non-Financial
A+
D
<10% 06. Fixed Income – Securitised
A+
E
<10% 07. Private Equity A+
B
<10% 08. Property A+
B
<10% 09. Infrastructure A+
B
0 10. Listed Equity – Incorporation
Not applicable
<10%* 11. Listed Equity – Active Ownership
Not applicable
<10% 12. Fixed Income – SSA A
C
10-50% 13. Fixed Income – Corporate Financial
A
C
0 14. Fixed Income – Corporate Non-Financial
Not applicable
<10% 15. Fixed Income – Securitised
B
E
0 16. Private Equity Not applicable
0 17. Property Not applicable
0 18. Infrastructure Not applicable
Dir
ec
t &
Ac
tiv
e O
wn
ers
hip
Mo
du
les
Ind
ire
ct
– M
an
ag
er
Se
lecti
on
, A
pp
oin
tme
nt
& M
on
ito
rin
g
AUM Module name
Your score

ASSESSMENT REPORT | 2016
Your company year-on-year performance See how your module scores have performed across years
“Strategy & Governance” & “Indirect - Manager Sel., App. & Mon.” modules
“Direct and Active Ownership” modules
Average year-on-year trends The average performance of other signatories across years
“Strategy & Governance” & “Indirect - Manager Sel., App. & Mon.” modules
Direct and Active Ownership modules
A+
A
B
C
D
E
A+
A
B
C
D
E
A+
A
B
C
D
E
A+
A
B
C
D
E

ASSESSMENT REPORT | 2016
8 ASSESSMENT
ASSESSMENT BY
MODULE

ASSESSMENT REPORT | 2016
9 ASSESSMENT
Strategy and Governance
INDICATOR SCORECARD
This module covers your organisation’s overall approach to responsible investment, including
governance, responsible investment policy, objectives and targets, the resources allocated to
responsible investment and the approach to collaboration on responsible investment and public
policy-related issues.
If your organisation did not respond to an applicable indicator, you will see a score of .
Module STRATEGY AND GOVERNANCE
Total Score 29 (out of a maximum 30 from 10††† indicators including the
following additionally assessed indicators: SG 07a, SG 07b, SG 10)
Band A+
SECTION INDICATOR MEDIAN
PEER SCORE (# peers)
YOUR
SCORE
NUMBER TYPE TOPIC
RI POLICY
SG 01 CORE RI Policy and coverage
(1061)
SG 02 CORE
Publicly available RI policy or guidance documents
(1061)
SG 03 CORE Conflicts of interest
(1061)
OBJECTIVES &
STRATEGIES SG 04 CORE RI goals and
objectives
(1061)
GOVERNANCE
& HUMAN
RESOURCES
SG 06 CORE RI roles and responsibilities
(1061)
SG 07a ADDITIONAL
RI in performance management & rewards
(1061)
SG 07b ADDITIONAL RI in personal development / training
(1061)
PROMOTING RI
SG 08 CORE Collaborative organisations / initiatives
(1061)
SG 09 CORE Promoting RI independently
(1061)
SG 10 ADDITIONAL Dialogue with public policy makers
(1061)
ASSURANCE
OF
RESPONSES
SG 18 ADDITIONAL Internal / external review of responses
(1061)
†††The total number of indicators used to determine your score may be less than the full set of indicators above
as the assessment methodology discards your lowest scoring additional assessed indicators.
ASSESSMENT REPORT | 2016
10 ASSESSMENT
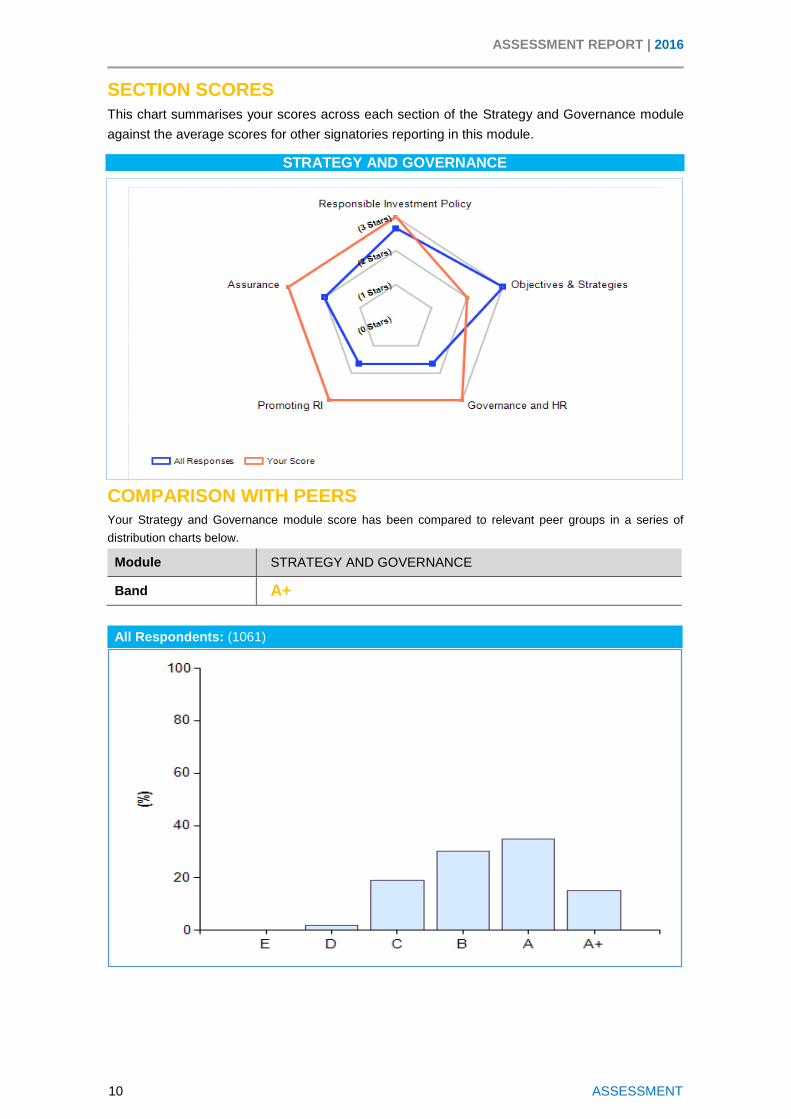
SECTION SCORES
This chart summarises your scores across each section of the Strategy and Governance module
against the average scores for other signatories reporting in this module.
STRATEGY AND GOVERNANCE
COMPARISON WITH PEERS Your Strategy and Governance module score has been compared to relevant peer groups in a series of
distribution charts below.
Module STRATEGY AND GOVERNANCE
Band A+
All Respondents: (1061)

ASSESSMENT REPORT | 2016
11 ASSESSMENT
COMPARISON WITH PEERS Your Strategy and Governance module score has been compared to relevant peer groups in a series of
distribution charts below.
Module STRATEGY AND GOVERNANCE
Band A+
Category: Asset Owner (271)
Size: US$ 1 - 4.99 billion AUM (57 Asset Owners)
ASSESSMENT REPORT | 2016
12 ASSESSMENT
COMPARISON WITH PEERS Your Strategy and Governance module score has been compared to relevant peer groups in a series of
distribution charts below.
Module STRATEGY AND GOVERNANCE
Band A+
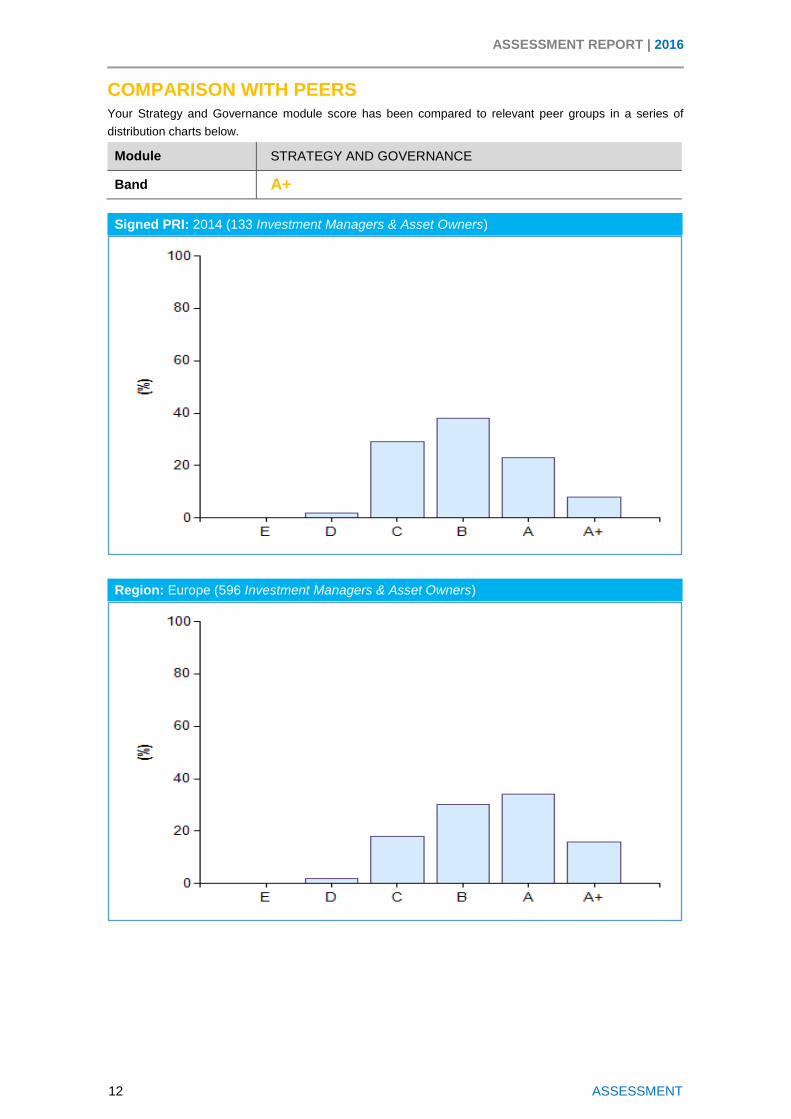
Signed PRI: 2014 (133 Investment Managers & Asset Owners)
Region: Europe (596 Investment Managers & Asset Owners)
ASSESSMENT REPORT | 2016
13 ASSESSMENT
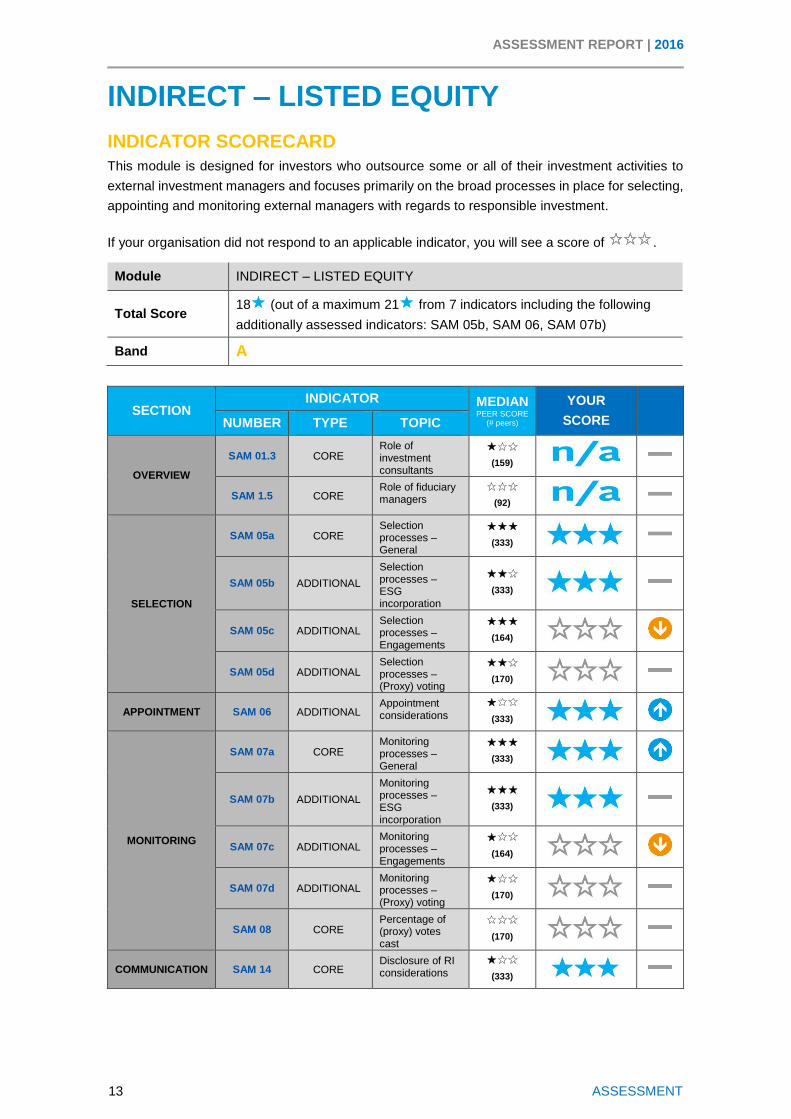
INDIRECT – LISTED EQUITY
INDICATOR SCORECARD
This module is designed for investors who outsource some or all of their investment activities to
external investment managers and focuses primarily on the broad processes in place for selecting,
appointing and monitoring external managers with regards to responsible investment.
If your organisation did not respond to an applicable indicator, you will see a score of .
Module INDIRECT – LISTED EQUITY
Total Score 18 (out of a maximum 21 from 7 indicators including the following
additionally assessed indicators: SAM 05b, SAM 06, SAM 07b)
Band A
SECTION INDICATOR MEDIAN
PEER SCORE (# peers)
YOUR
SCORE
NUMBER TYPE TOPIC
OVERVIEW
SAM 01.3 CORE Role of investment consultants
(159)
SAM 1.5 CORE Role of fiduciary managers
(92)
SELECTION
SAM 05a CORE Selection processes – General
(333)
SAM 05b ADDITIONAL
Selection processes – ESG incorporation
(333)
SAM 05c ADDITIONAL Selection processes – Engagements
(164)
SAM 05d ADDITIONAL Selection processes – (Proxy) voting
(170)
APPOINTMENT SAM 06 ADDITIONAL Appointment considerations
(333)
MONITORING
SAM 07a CORE Monitoring processes – General
(333)
SAM 07b ADDITIONAL
Monitoring processes – ESG incorporation
(333)
SAM 07c ADDITIONAL Monitoring processes – Engagements
(164)
SAM 07d ADDITIONAL Monitoring processes – (Proxy) voting
(170)
SAM 08 CORE Percentage of (proxy) votes cast
(170)
COMMUNICATION SAM 14 CORE Disclosure of RI considerations
(333)
ASSESSMENT REPORT | 2016
14 ASSESSMENT
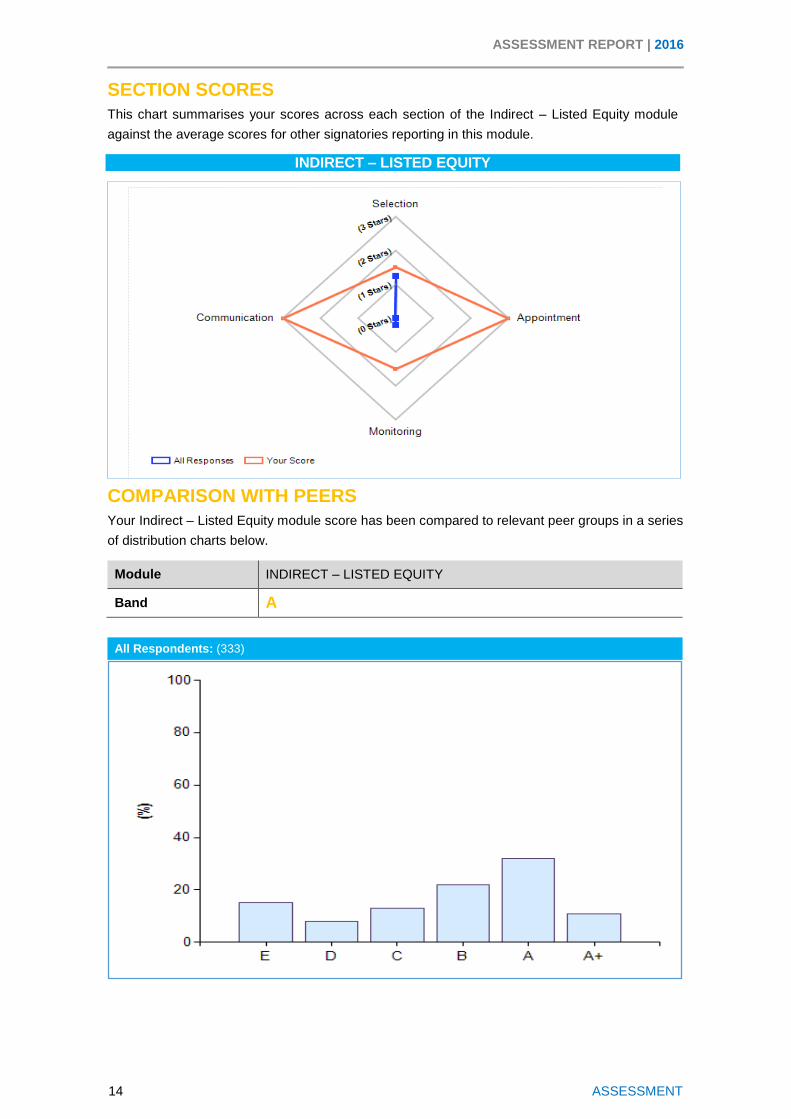
SECTION SCORES
This chart summarises your scores across each section of the Indirect – Listed Equity module
against the average scores for other signatories reporting in this module.
INDIRECT – LISTED EQUITY
COMPARISON WITH PEERS
Your Indirect – Listed Equity module score has been compared to relevant peer groups in a series
of distribution charts below.
Module INDIRECT – LISTED EQUITY
Band A
All Respondents: (333)

ASSESSMENT REPORT | 2016
15 ASSESSMENT
COMPARISON WITH PEERS Your Indirect – Listed Equity module score has been compared to relevant peer groups in a series
of distribution charts below.
Module INDIRECT – LISTED EQUITY
Band A
Category: Asset Owner (217)
Size: US$ 1 - 4.99 billion AUM (48 Asset Owners)

ASSESSMENT REPORT | 2016
16 ASSESSMENT
COMPARISON WITH PEERS
Your Indirect – Listed Equity module score has been compared to relevant peer groups in a series
of distribution charts below.
Module INDIRECT – LISTED EQUITY
Band A
Signed PRI: 2014 (33 Investment Managers & Asset Owners)
Region: Europe (184 Investment Managers & Asset Owners)

ASSESSMENT REPORT | 2016
17 ASSESSMENT
INDIRECT – FIXED INCOME SSA
INDICATOR SCORECARD
This module is designed for investors who outsource some or all of their investment activities to
external investment managers and focuses primarily on the broad processes in place for selecting,
appointing and monitoring external managers with regards to responsible investment.
If your organisation did not respond to an applicable indicator, you will see a score of .
Module INDIRECT – FIXED INCOME SSA
Total Score 15 (out of a maximum 15 from 5 indicators including the following
additionally assessed indicators: SAM 05b, SAM 05c)
Band A+
SECTION INDICATOR MEDIAN
PEER SCORE (# peers)
YOUR
SCORE
NUMBER TYPE TOPIC
OVERVIEW
SAM 01.3 CORE Role of investment consultants
(167)
SAM 1.5 CORE Role of fiduciary managers
(146)
SELECTION
SAM 05a CORE Selection processes – General
(258)
SAM 05b ADDITIONAL
Selection processes – ESG incorporation
(258)
SAM 05c ADDITIONAL Selection processes – Engagements
(258)
APPOINTMENT SAM 06 ADDITIONAL Appointment considerations
(258)
MONITORING
SAM 07a CORE Monitoring processes – General
(258)
SAM 07b ADDITIONAL
Monitoring processes – ESG incorporation
(258)
SAM 07c ADDITIONAL Monitoring processes – Engagements
(258)
COMMUNICATION SAM 14 CORE Disclosure of RI considerations
(258)
ASSESSMENT REPORT | 2016
18 ASSESSMENT
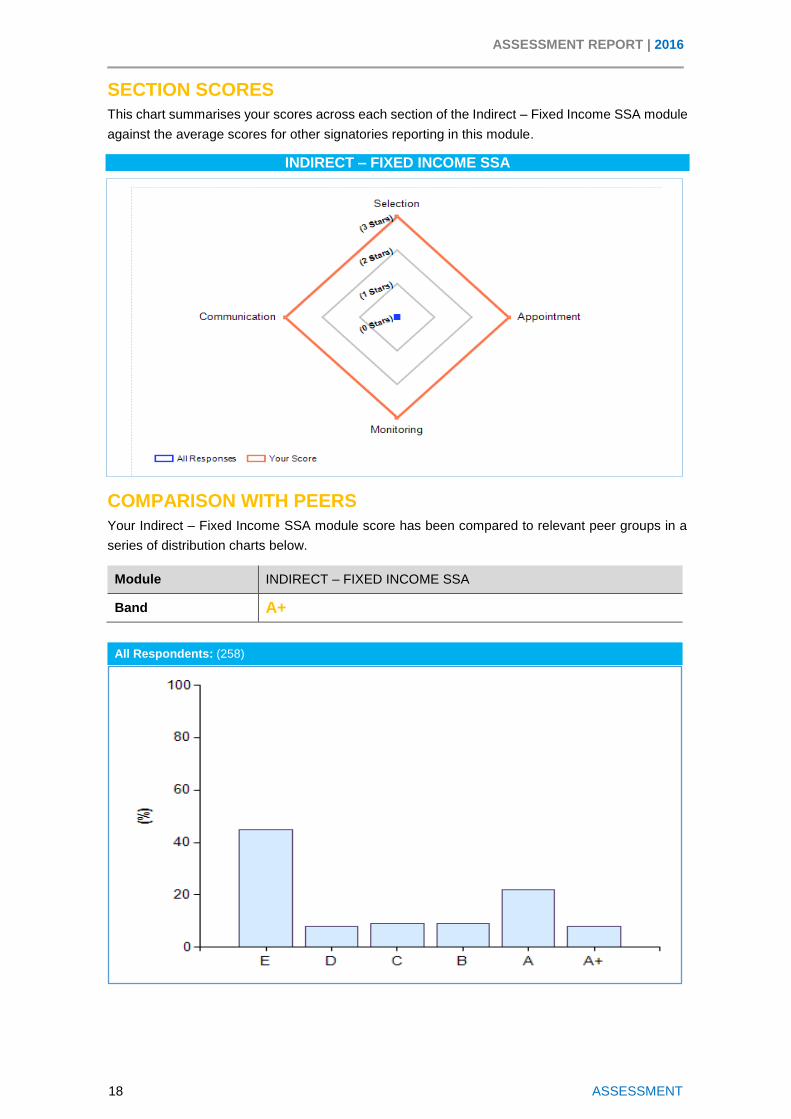
SECTION SCORES
This chart summarises your scores across each section of the Indirect – Fixed Income SSA module
against the average scores for other signatories reporting in this module.
INDIRECT – FIXED INCOME SSA
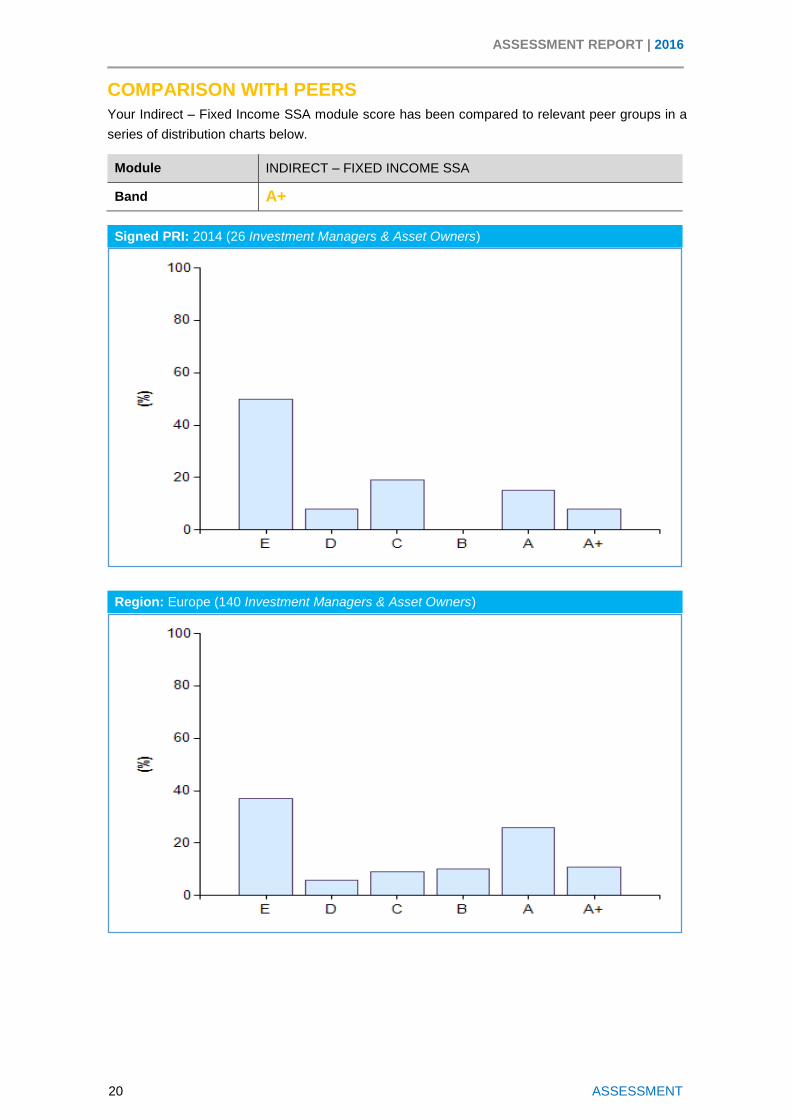
COMPARISON WITH PEERS
Your Indirect – Fixed Income SSA module score has been compared to relevant peer groups in a
series of distribution charts below.
Module INDIRECT – FIXED INCOME SSA
Band A+
All Respondents: (258)

ASSESSMENT REPORT | 2016
19 ASSESSMENT
COMPARISON WITH PEERS
Your Indirect – Fixed Income SSA module score has been compared to relevant peer groups in a
series of distribution charts below.
Module INDIRECT – FIXED INCOME SSA
Band A+
Category: Asset Owner (170)
Size: US$ 1 - 4.99 billion AUM (41 Asset Owners)
ASSESSMENT REPORT | 2016
20 ASSESSMENT
COMPARISON WITH PEERS
Your Indirect – Fixed Income SSA module score has been compared to relevant peer groups in a
series of distribution charts below.
Module INDIRECT – FIXED INCOME SSA
Band A+
Signed PRI: 2014 (26 Investment Managers & Asset Owners)
Region: Europe (140 Investment Managers & Asset Owners)

ASSESSMENT REPORT | 2016
21 ASSESSMENT
INDIRECT – FIXED INCOME CORPORATE (FINANCIAL)
INDICATOR SCORECARD
This module is designed for investors who outsource some or all of their investment activities to
external investment managers and focuses primarily on the broad processes in place for selecting,
appointing and monitoring external managers with regards to responsible investment.
If your organisation did not respond to an applicable indicator, you will see a score of .
Module INDIRECT – FIXED INCOME CORPORATE (FINANCIAL)
Total Score 15 (out of a maximum 15 from 5 indicators including the following
additionally assessed indicators: SAM 05b, SAM 05c)
Band A+
SECTION INDICATOR MEDIAN
PEER SCORE (# peers)
YOUR
SCORE
NUMBER TYPE TOPIC
OVERVIEW
SAM 01.3 CORE Role of investment consultants
(147)
SAM 1.5 CORE Role of fiduciary managers
(125)
SELECTION
SAM 05a CORE Selection processes – General
(237)
SAM 05b ADDITIONAL
Selection processes – ESG incorporation
(237)
SAM 05c ADDITIONAL Selection processes – Engagements
(237)
APPOINTMENT SAM 06 ADDITIONAL Appointment considerations
(237)
MONITORING
SAM 07a CORE Monitoring processes – General
(237)
SAM 07b ADDITIONAL
Monitoring processes – ESG incorporation
(237)
SAM 07c ADDITIONAL Monitoring processes – Engagements
(237)
COMMUNICATION SAM 14 CORE Disclosure of RI considerations
(237)
ASSESSMENT REPORT | 2016
22 ASSESSMENT
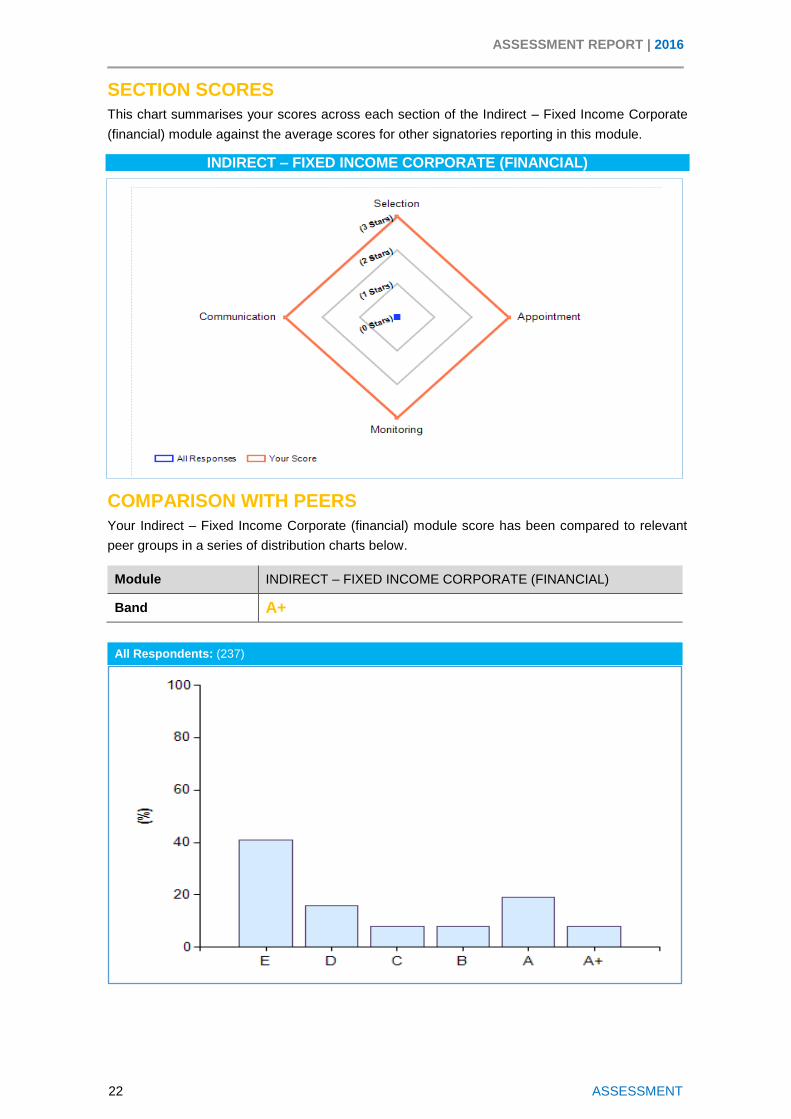
SECTION SCORES
This chart summarises your scores across each section of the Indirect – Fixed Income Corporate
(financial) module against the average scores for other signatories reporting in this module.
INDIRECT – FIXED INCOME CORPORATE (FINANCIAL)
COMPARISON WITH PEERS
Your Indirect – Fixed Income Corporate (financial) module score has been compared to relevant
peer groups in a series of distribution charts below.
Module INDIRECT – FIXED INCOME CORPORATE (FINANCIAL)
Band A+
All Respondents: (237)

ASSESSMENT REPORT | 2016
23 ASSESSMENT
COMPARISON WITH PEERS
Your Indirect – Fixed Income Corporate (financial) module score has been compared to relevant
peer groups in a series of distribution charts below.
Module INDIRECT – FIXED INCOME CORPORATE (FINANCIAL)
Band A+
Category: Asset Owner (154)
Size: US$ 1 - 4.99 billion AUM (36 Asset Owners)
ASSESSMENT REPORT | 2016
24 ASSESSMENT
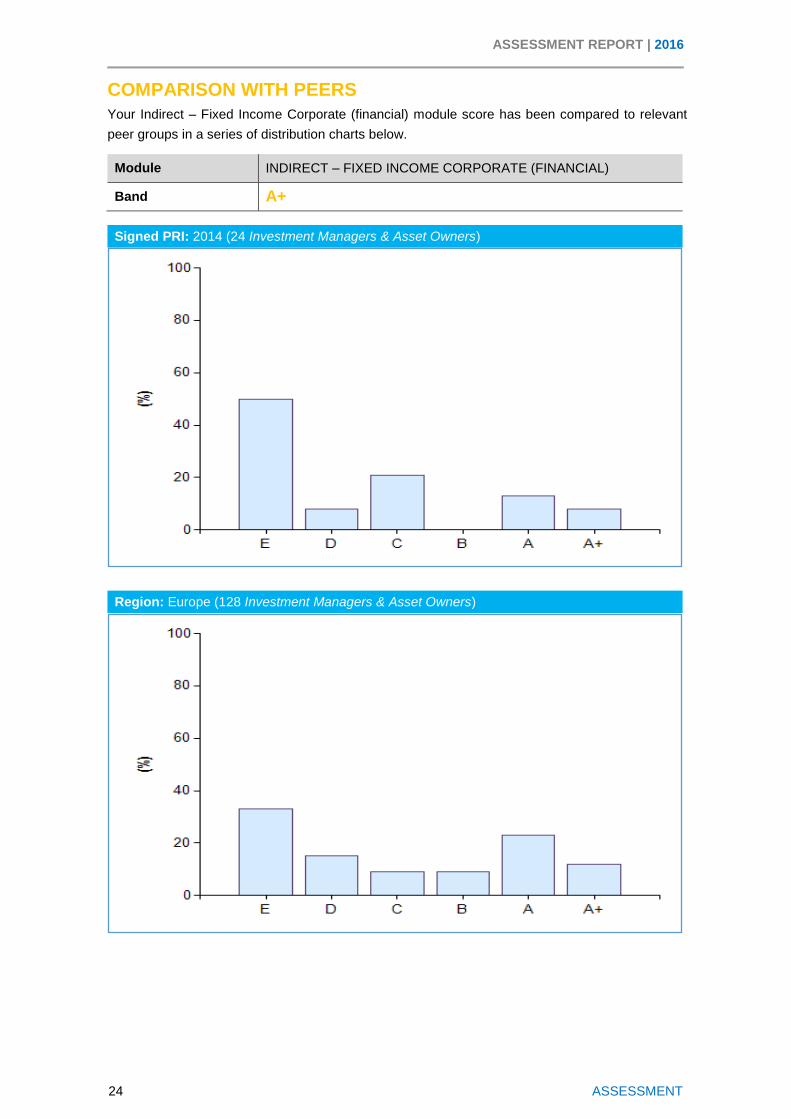
COMPARISON WITH PEERS
Your Indirect – Fixed Income Corporate (financial) module score has been compared to relevant
peer groups in a series of distribution charts below.
Module INDIRECT – FIXED INCOME CORPORATE (FINANCIAL)
Band A+
Signed PRI: 2014 (24 Investment Managers & Asset Owners)
Region: Europe (128 Investment Managers & Asset Owners)
ASSESSMENT REPORT | 2016
25 ASSESSMENT
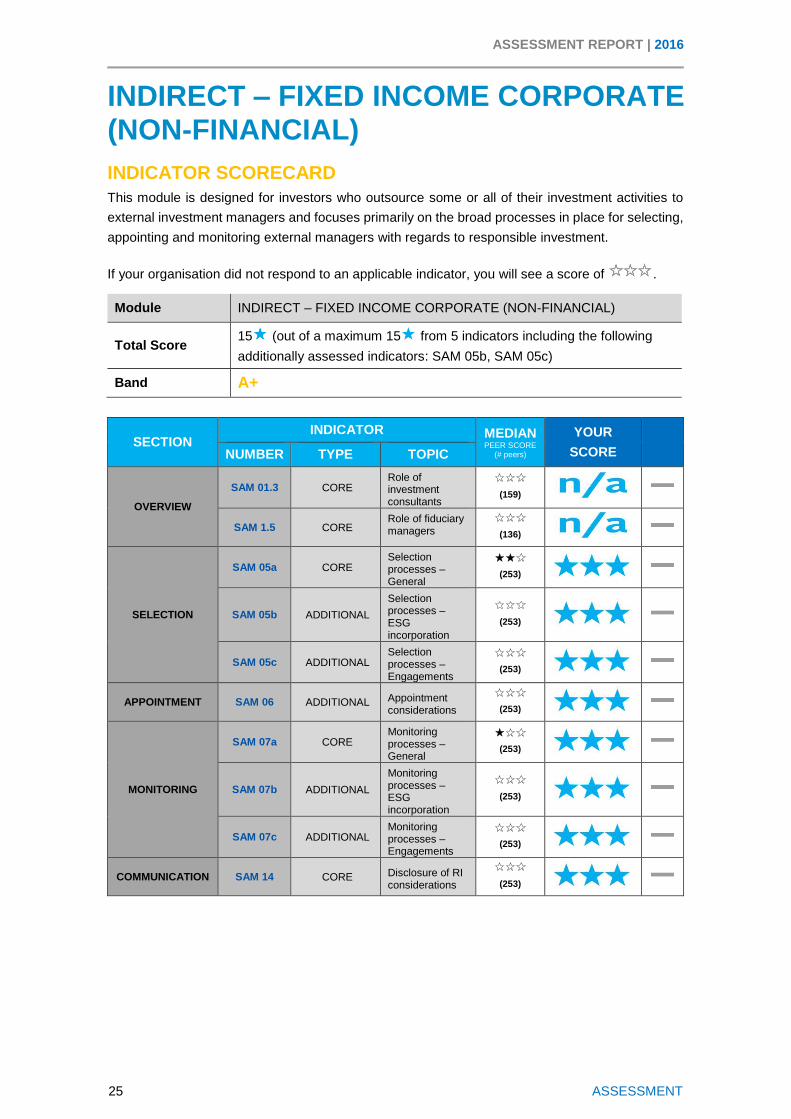
INDIRECT – FIXED INCOME CORPORATE (NON-FINANCIAL)
INDICATOR SCORECARD
This module is designed for investors who outsource some or all of their investment activities to
external investment managers and focuses primarily on the broad processes in place for selecting,
appointing and monitoring external managers with regards to responsible investment.
If your organisation did not respond to an applicable indicator, you will see a score of .
Module INDIRECT – FIXED INCOME CORPORATE (NON-FINANCIAL)
Total Score 15 (out of a maximum 15 from 5 indicators including the following
additionally assessed indicators: SAM 05b, SAM 05c)
Band A+
SECTION INDICATOR MEDIAN
PEER SCORE (# peers)
YOUR
SCORE
NUMBER TYPE TOPIC
OVERVIEW
SAM 01.3 CORE Role of investment consultants
(159)
SAM 1.5 CORE Role of fiduciary managers
(136)
SELECTION
SAM 05a CORE Selection processes – General
(253)
SAM 05b ADDITIONAL
Selection processes – ESG incorporation
(253)
SAM 05c ADDITIONAL Selection processes – Engagements
(253)
APPOINTMENT SAM 06 ADDITIONAL Appointment considerations
(253)
MONITORING
SAM 07a CORE Monitoring processes – General
(253)
SAM 07b ADDITIONAL
Monitoring processes – ESG incorporation
(253)
SAM 07c ADDITIONAL Monitoring processes – Engagements
(253)
COMMUNICATION SAM 14 CORE Disclosure of RI considerations
(253)

ASSESSMENT REPORT | 2016
26 ASSESSMENT
SECTION SCORES
This chart summarises your scores across each section of the Indirect – Fixed Income Corporate
(non-financial) module against the average scores for other signatories reporting in this module.
INDIRECT – FIXED INCOME CORPORATE (NON-FINANCIAL)
COMPARISON WITH PEERS
Your Indirect – Fixed Income Corporate (non-financial) module score has been compared to relevant
peer groups in a series of distribution charts below.
Module INDIRECT – FIXED INCOME CORPORATE (NON-FINANCIAL)
Band A+
All Respondents: (253)

ASSESSMENT REPORT | 2016
27 ASSESSMENT
COMPARISON WITH PEERS
Your Indirect – Fixed Income Corporate (non-financial) module score has been compared to relevant
peer groups in a series of distribution charts below.
Module INDIRECT – FIXED INCOME CORPORATE (NON-FINANCIAL)
Band A+
Category: Asset Owner (167)
Size: US$ 1 - 4.99 billion AUM (35 Asset Owners)

ASSESSMENT REPORT | 2016
28 ASSESSMENT
COMPARISON WITH PEERS
Your Indirect – Fixed Income Corporate (non-financial) module score has been compared to relevant
peer groups in a series of distribution charts below.
Module INDIRECT – FIXED INCOME CORPORATE (NON-FINANCIAL)
Band A+
Signed PRI: 2014 (28 Investment Managers & Asset Owners)
Region: Europe (146 Investment Managers & Asset Owners)

ASSESSMENT REPORT | 2016
29 ASSESSMENT
INDIRECT – FIXED INCOME
SECURITISED
INDICATOR SCORECARD
This module is designed for investors who outsource some or all of their investment activities to
external investment managers and focuses primarily on the broad processes in place for selecting,
appointing and monitoring external managers with regards to responsible investment.
If your organisation did not respond to an applicable indicator, you will see a score of .
Module INDIRECT – FIXED INCOME SECURITISED
Total Score 15 (out of a maximum 15 from 5 indicators including the following
additionally assessed indicators: n/a)
Band A+
SECTION INDICATOR MEDIAN
PEER SCORE (# peers)
YOUR
SCORE
NUMBER TYPE TOPIC
OVERVIEW
SAM 01.3 CORE Role of investment consultants
(91)
SAM 1.5 CORE Role of fiduciary managers
(78)
SELECTION
SAM 05a CORE Selection processes – General
(118)
SAM 05b ADDITIONAL
Selection processes – ESG incorporation
(118)
SAM 05c ADDITIONAL Selection processes – Engagements
(118)
APPOINTMENT SAM 06 ADDITIONAL Appointment considerations
(118)
MONITORING
SAM 07a CORE Monitoring processes – General
(118)
SAM 07b ADDITIONAL
Monitoring processes – ESG incorporation
(118)
SAM 07c ADDITIONAL Monitoring processes – Engagements
(118)
COMMUNICATION SAM 14 CORE Disclosure of RI considerations
(118)
ASSESSMENT REPORT | 2016
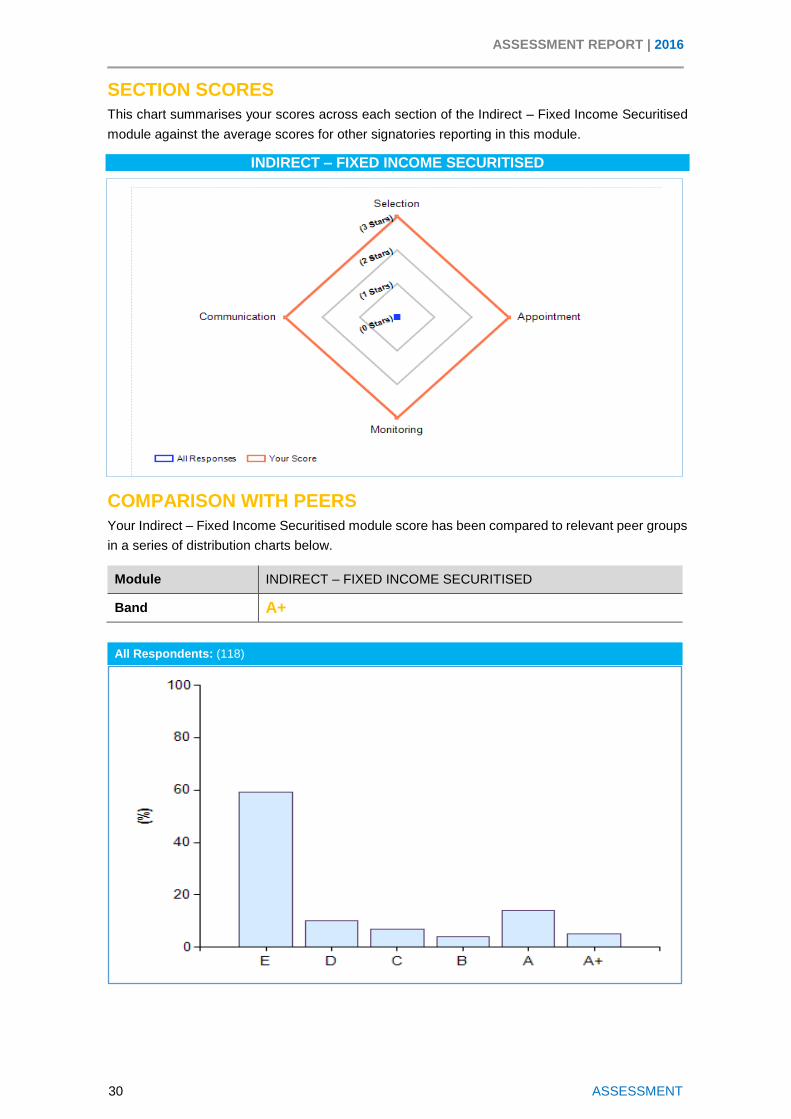
30 ASSESSMENT
SECTION SCORES
This chart summarises your scores across each section of the Indirect – Fixed Income Securitised
module against the average scores for other signatories reporting in this module.
INDIRECT – FIXED INCOME SECURITISED
COMPARISON WITH PEERS
Your Indirect – Fixed Income Securitised module score has been compared to relevant peer groups
in a series of distribution charts below.
Module INDIRECT – FIXED INCOME SECURITISED
Band A+
All Respondents: (118)
ASSESSMENT REPORT | 2016
31 ASSESSMENT
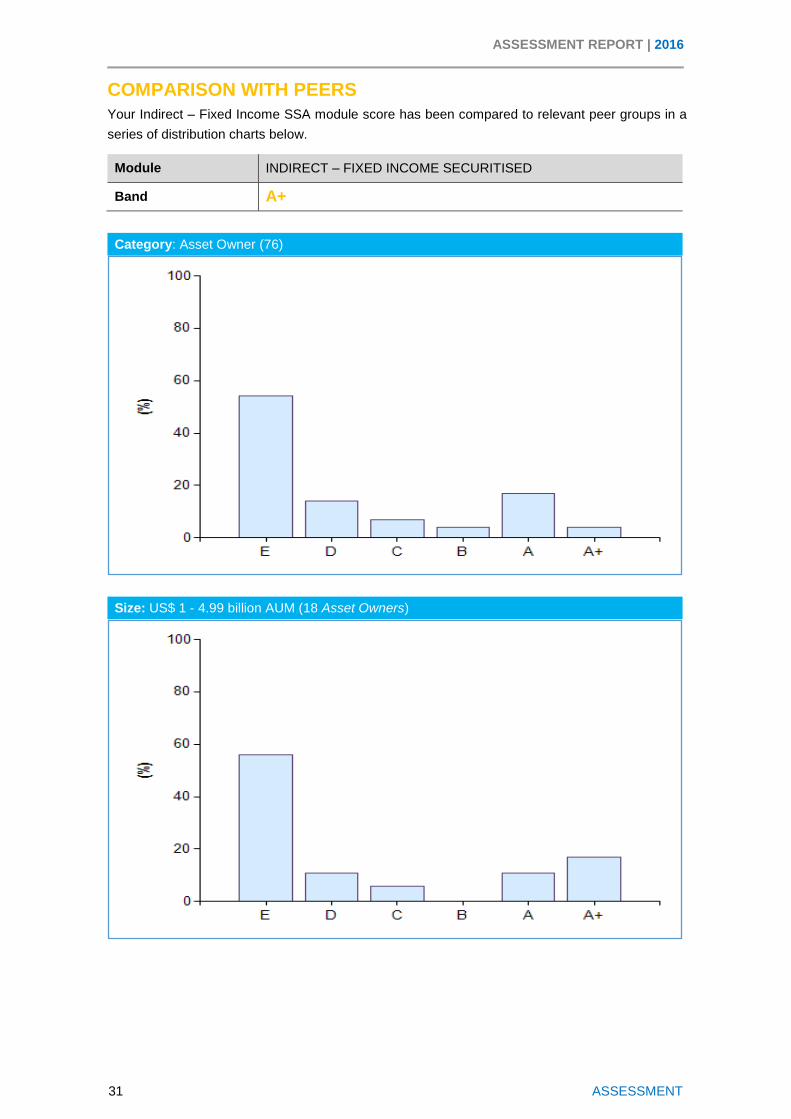
COMPARISON WITH PEERS
Your Indirect – Fixed Income SSA module score has been compared to relevant peer groups in a
series of distribution charts below.
Module INDIRECT – FIXED INCOME SECURITISED
Band A+
Category: Asset Owner (76)
Size: US$ 1 - 4.99 billion AUM (18 Asset Owners)

ASSESSMENT REPORT | 2016
32 ASSESSMENT
COMPARISON WITH PEERS
Your Indirect – Fixed Income SSA module score has been compared to relevant peer groups in a
series of distribution charts below.
Module INDIRECT – FIXED INCOME SECURITISED
Band A+
Signed PRI: 2014 (10 Investment Managers & Asset Owners)
Region: Europe (45 Investment Managers & Asset Owners)

ASSESSMENT REPORT | 2016
33 ASSESSMENT
INDIRECT – PRIVATE EQUITY INDICATOR SCORECARD
This module is designed for investors who outsource some or all of their investment activities to
external investment managers and focuses primarily on the broad processes in place for selecting,
appointing and monitoring external managers with regards to responsible investment.
If your organisation did not respond to an applicable indicator, you will see a score of .
Module INDIRECT – PRIVATE EQUITY
Total Score 15 (out of a maximum 15 from 5 indicators including the following
additionally assessed indicators: SAM 9b, SAM 9c)
Band A+
SECTION INDICATOR MEDIAN
PEER SCORE (# peers)
YOUR
SCORE
NUMBER TYPE TOPIC
OVERVIEW
SAM 01.3 CORE Role of investment consultants
(31)
SAM 01.5 CORE Role of fiduciary managers
(25)
SELECTION
SAM 09a CORE Selection processes – General
(206)
SAM 09b ADDITIONAL
Selection processes – Investment selection
(206)
SAM 09c ADDITIONAL
Selection processes – Investment monitoring
(206)
APPOINTMENT SAM 10 ADDITIONAL Appointment considerations
(206)
MONITORING
SAM 11a CORE Monitoring processes – General
(206)
SAM 11b ADDITIONAL
Monitoring processes – Investment selection
(206)
SAM 11c ADDITIONAL
Monitoring processes – Investment monitoring
(206)
COMMUNICATION SAM 14 CORE Disclosure of RI considerations
(206)

ASSESSMENT REPORT | 2016
34 ASSESSMENT
SECTION SCORES
This chart summarises your scores across each section of the Indirect – Private Equity module
against the average scores for other signatories reporting in this module.
INDIRECT – PRIVATE EQUITY
COMPARISON WITH PEERS
Your Indirect – Private Equity module score has been compared to relevant peer groups in a series
of distribution charts below.
Module INDIRECT – PRIVATE EQUITY
Band A+
All Respondents: (206)

ASSESSMENT REPORT | 2016
35 ASSESSMENT
COMPARISON WITH PEERS
Your Indirect – Private Equity module score has been compared to relevant peer groups in a series
of distribution charts below.
Module INDIRECT – PRIVATE EQUITY
Band A+
Category: Asset Owner (123)
Size: US$ 1 - 4.99 billion AUM (27 Asset Owners)
ASSESSMENT REPORT | 2016
36 ASSESSMENT
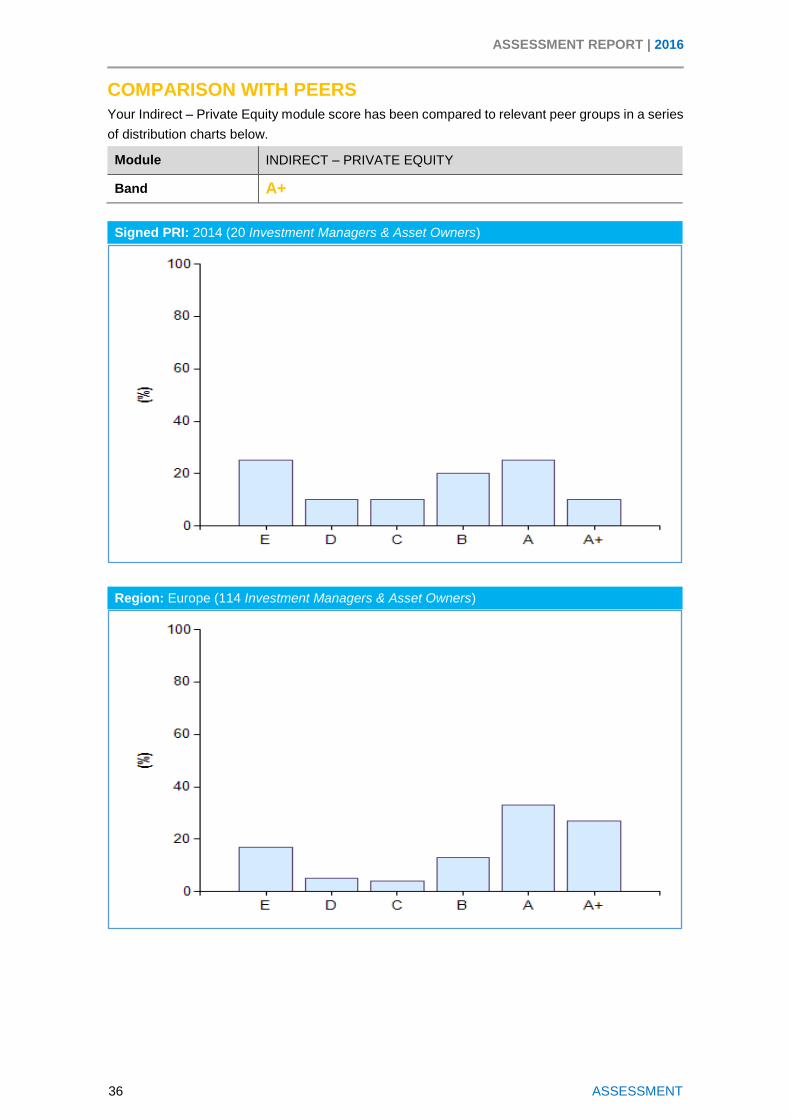
COMPARISON WITH PEERS
Your Indirect – Private Equity module score has been compared to relevant peer groups in a series
of distribution charts below.
Module INDIRECT – PRIVATE EQUITY
Band A+
Signed PRI: 2014 (20 Investment Managers & Asset Owners)
Region: Europe (114 Investment Managers & Asset Owners)

ASSESSMENT REPORT | 2016
37 ASSESSMENT
INDIRECT – PROPERTY
INDICATOR SCORECARD
This module is designed for investors who outsource some or all of their investment activities to
external investment managers and focuses primarily on the broad processes in place for selecting,
appointing and monitoring external managers with regards to responsible investment.
If your organisation did not respond to an applicable indicator, you will see a score of .
Module INDIRECT – PROPERTY
Total Score 15 (out of a maximum 15 from 5 indicators including the following
additionally assessed indicators: SAM 9b, SAM 9c)
Band A+
SECTION INDICATOR MEDIAN
PEER SCORE (# peers)
YOUR
SCORE
NUMBER TYPE TOPIC
OVERVIEW
SAM 01.3 CORE Role of investment consultants
(36)
SAM 01.5 CORE Role of fiduciary managers
(25)
SELECTION
SAM 09a CORE Selection processes – General
(161)
SAM 09b ADDITIONAL
Selection processes – Investment selection
(161)
SAM 09c ADDITIONAL
Selection processes – Investment monitoring
(161)
APPOINTMENT SAM 10 ADDITIONAL Appointment considerations
(161)
MONITORING
SAM 11a CORE Monitoring processes – General
(161)
SAM 11b ADDITIONAL
Monitoring processes – Investment selection
(161)
SAM 11c ADDITIONAL
Monitoring processes – Investment monitoring
(161)
COMMUNICATION SAM 14 CORE Disclosure of RI considerations
(161)

ASSESSMENT REPORT | 2016
38 ASSESSMENT
SECTION SCORES
This chart summarises your scores across each section of the Indirect – Property module against
the average scores for other signatories reporting in this module.
INDIRECT – PROPERTY
COMPARISON WITH PEERS
Your Indirect – Property module score has been compared to relevant peer groups in a series of
distribution charts below.
Module INDIRECT – PROPERTY
Band A+
All Respondents: (161)
ASSESSMENT REPORT | 2016
39 ASSESSMENT
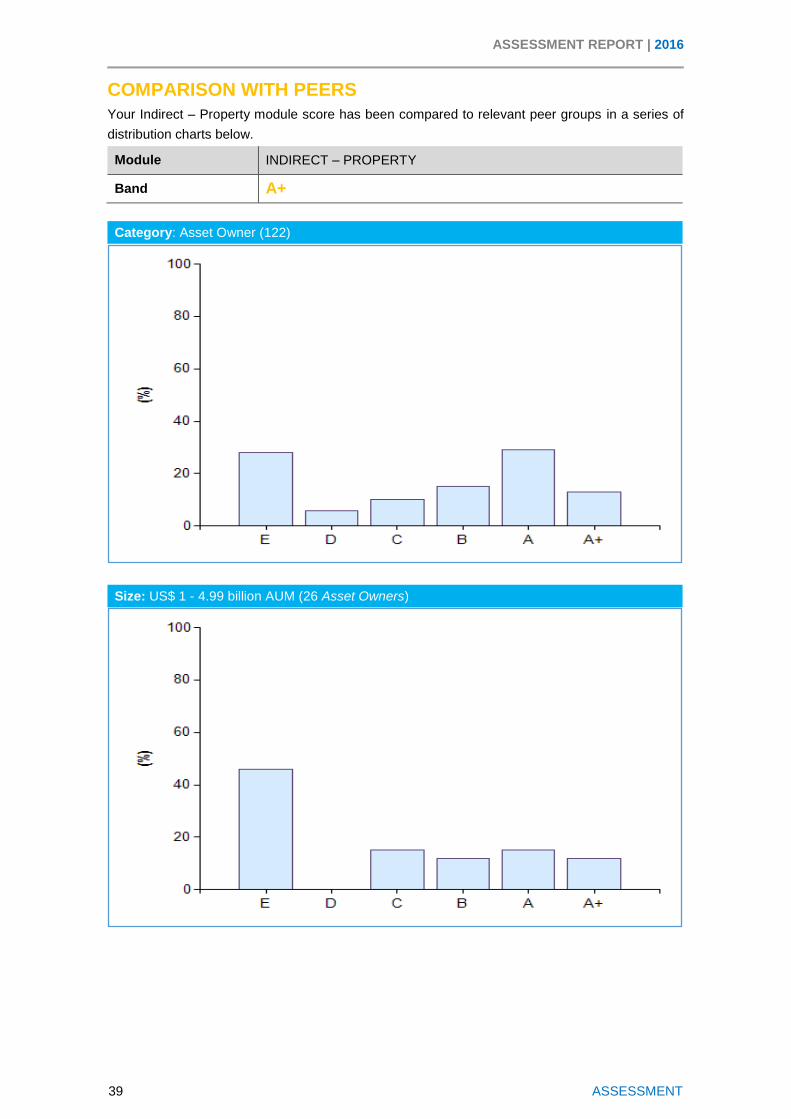
COMPARISON WITH PEERS
Your Indirect – Property module score has been compared to relevant peer groups in a series of
distribution charts below.
Module INDIRECT – PROPERTY
Band A+
Category: Asset Owner (122)
Size: US$ 1 - 4.99 billion AUM (26 Asset Owners)

ASSESSMENT REPORT | 2016
40 ASSESSMENT
COMPARISON WITH PEERS
Your Indirect – Property module score has been compared to relevant peer groups in a series of
distribution charts below.
Module INDIRECT – PROPERTY
Band A+
Signed PRI: 2014 (12 Investment Managers & Asset Owners)
Region: Europe (89 Investment Managers & Asset Owners)

ASSESSMENT REPORT | 2016
41 ASSESSMENT
INDIRECT – INFRASTRUCTURE
INDICATOR SCORECARD
This module is designed for investors who outsource some or all of their investment activities to
external investment managers and focuses primarily on the broad processes in place for selecting,
appointing and monitoring external managers with regards to responsible investment.
If your organisation did not respond to an applicable indicator, you will see a score of .
Module INDIRECT – INFRASTRUCTURE
Total Score 15 (out of a maximum 15 from 5 indicators including the following
additionally assessed indicators: SAM 9b, SAM 9c)
Band A+
SECTION INDICATOR MEDIAN
PEER SCORE (# peers)
YOUR
SCORE
NUMBER TYPE TOPIC
OVERVIEW
SAM 01.3 CORE Role of investment consultants
(37)
SAM 01.5 CORE Role of fiduciary managers
(18)
SELECTION
SAM 09a CORE Selection processes – General
(95)
SAM 09b ADDITIONAL
Selection processes – Investment selection
(95)
SAM 09c ADDITIONAL
Selection processes – Investment monitoring
(95)
APPOINTMENT SAM 10 ADDITIONAL Appointment considerations
(95)
MONITORING
SAM 11a CORE Monitoring processes – General
(95)
SAM 11b ADDITIONAL
Monitoring processes – Investment selection
(95)
SAM 11c ADDITIONAL
Monitoring processes – Investment monitoring
(95)
COMMUNICATION SAM 14 CORE Disclosure of RI considerations
(95)
ASSESSMENT REPORT | 2016
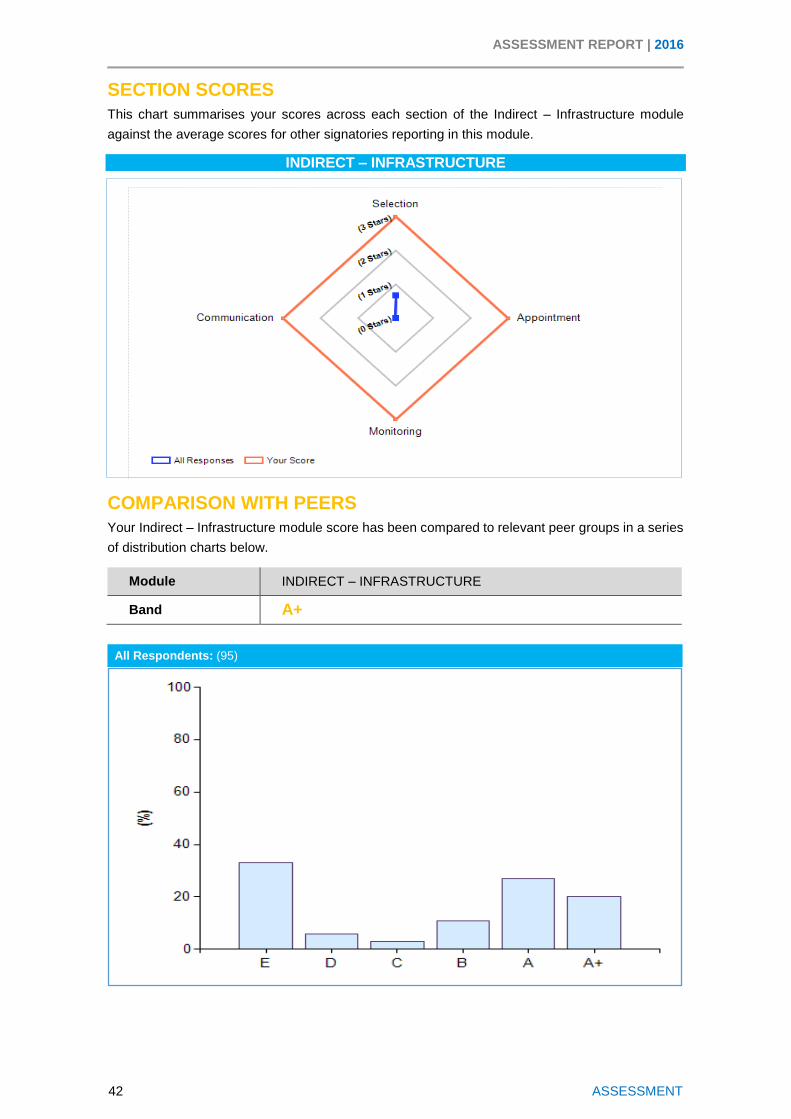
42 ASSESSMENT
SECTION SCORES
This chart summarises your scores across each section of the Indirect – Infrastructure module
against the average scores for other signatories reporting in this module.
INDIRECT – INFRASTRUCTURE
COMPARISON WITH PEERS
Your Indirect – Infrastructure module score has been compared to relevant peer groups in a series
of distribution charts below.
Module INDIRECT – INFRASTRUCTURE
Band A+
All Respondents: (95)

ASSESSMENT REPORT | 2016
43 ASSESSMENT
COMPARISON WITH PEERS
Your Indirect – Infrastructure module score has been compared to relevant peer groups in a series
of distribution charts below.
Module INDIRECT – INFRASTRUCTURE
Band A+
Category: Asset Owner (72)
Size: US$ 1 - 4.99 billion AUM (12 Asset Owners)

ASSESSMENT REPORT | 2016
44 ASSESSMENT
COMPARISON WITH PEERS
Your Indirect – Infrastructure module score has been compared to relevant peer groups in a series
of distribution charts below.
Module INDIRECT – INFRASTRUCTURE
Band A+
Signed PRI: 2014 (n/a Investment Managers & Asset Owners)
Region: Europe (50 Investment Managers & Asset Owners)

ASSESSMENT REPORT | 2016
45 ASSESSMENT
DIRECT – FIXED INCOME (SSA) INDICATOR SCORECARD
This module looks at how your organisation applies ESG to your internally managed fixed income
(SSA) holdings.
Module FIXED INCOME (SSA)
Total Score 37 (out of a maximum 39 from 13 indicators including the following
additionally assessed indicators: FI 16, FI 21, FI 13)
Band A
SECTION INDICATOR MEDIAN
PEER SCORE (# peers)
YOUR
SCORE
NUMBER TYPE TOPIC
IMPLEMENTATION
PROCESSES
FI 05.1 CORE ESG issues and issuer research
(362)
FI 05.2 CORE ESG issues and issuer research
(362)
FI 06 CORE Processes to ensure analysis is robust
(362)
IMPLEMENTATION:
SCREENING
FI 09 ADDITIONAL Examples of ESG factors in screening process
(316)
FI 10a CORE Negative Screening - ensuring criteria are met
(286)
FI 10b CORE Positive Screening - ensuring criteria are met
(223)
FI 10c CORE Norms Screening - ensuring criteria are met
(222)
IMPLEMENTATION:
THEMATIC
FI 12 CORE Themed bond processes
(196)
FI 13 ADDITIONAL Assessing impact
(196)
IMPLEMENTATION:
INTEGRATION
FI 15 CORE ESG information in investment processes
(294)
FI 16 ADDITIONAL E,S and G issues reviewed
(294)
OUTPUTS AND
OUTCOMES FI 21 ADDITIONAL
Financial/ESG performance
(362)
COMMUNICATION
FI 23a CORE Disclosure of approach to public
(362)
FI 23b CORE Disclosure of approach to clients/beneficiaries
(362)

ASSESSMENT REPORT | 2016
46 ASSESSMENT
SECTION SCORES
This chart summarises your scores across each section of the Fixed Income (SSA) module against
the average scores for other signatories reporting in this module.
FIXED INCOME (SSA)
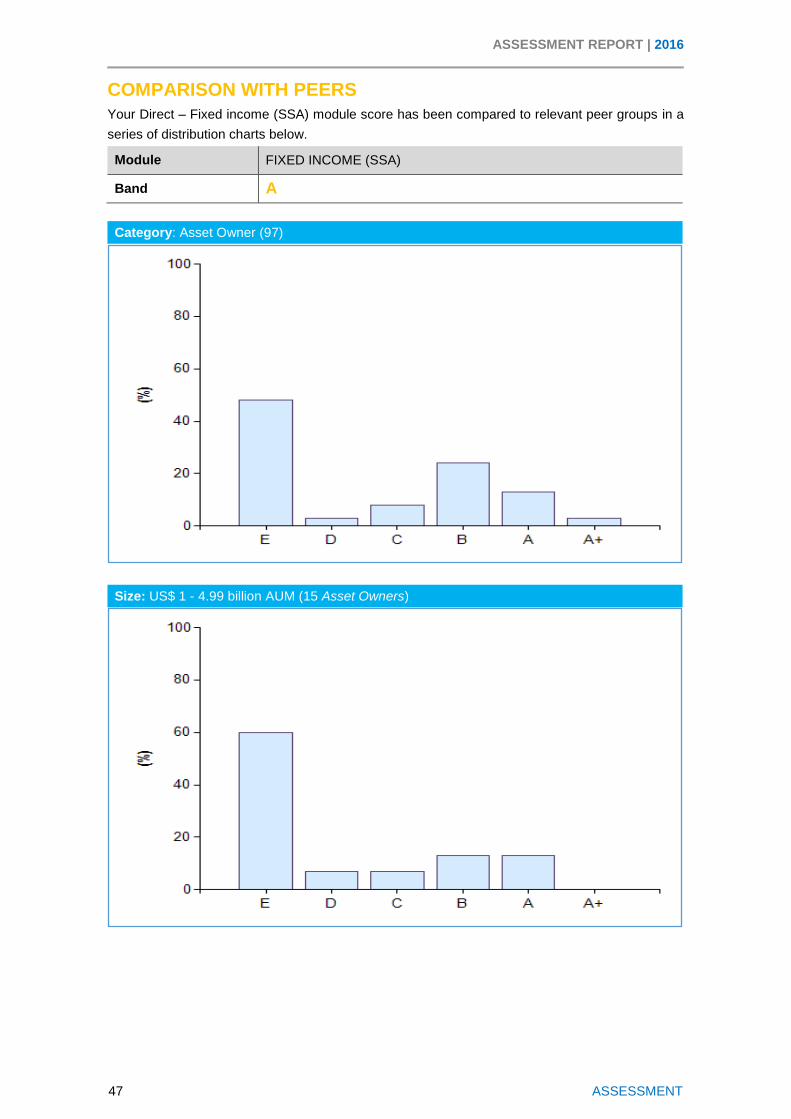
COMPARISON WITH PEERS
Your Direct – Fixed income (SSA) module score has been compared to relevant peer groups in a
series of distribution charts below.
Module FIXED INCOME (SSA)
Band A
All Respondents: (362)
ASSESSMENT REPORT | 2016
47 ASSESSMENT
COMPARISON WITH PEERS
Your Direct – Fixed income (SSA) module score has been compared to relevant peer groups in a
series of distribution charts below.
Module FIXED INCOME (SSA)
Band A
Category: Asset Owner (97)
Size: US$ 1 - 4.99 billion AUM (15 Asset Owners)

ASSESSMENT REPORT | 2016
48 ASSESSMENT
COMPARISON WITH PEERS
Your Direct – Fixed income (SSA) module score has been compared to relevant peer groups in a
series of distribution charts below.
Module FIXED INCOME (SSA)
Band A
Signed PRI: 2014 (9 Investment Managers & Asset Owners)
Region: Europe (60 Investment Managers & Asset Owners)

ASSESSMENT REPORT | 2016
49 ASSESSMENT
DIRECT – FIXED INCOME CORPORATE (FINANCIAL) INDICATOR SCORECARD
Module FIXED INCOME CORPORATE (FINANCIAL)
Total Score 35 (out of a maximum 42 from 14 indicators including the following
additionally assessed indicators: FI 16, FI 19, FI 13, FI 09)
Band A
SECTION INDICATOR MEDIAN
PEER SCORE (# peers)
YOUR
SCORE
NUMBER TYPE TOPIC
IMPLEMENTATION
PROCESSES
FI 05.1 CORE ESG issues and issuer research
(345)
FI 05.2 CORE ESG issues and issuer research
(345)
FI 06 CORE Processes to ensure analysis is robust
(345)
IMPLEMENTATION:
SCREENING
FI 09 ADDITIONAL Examples of ESG factors in screening process
(293)
FI 10a CORE Negative Screening - ensuring criteria are met
(272)
FI 10b CORE Positive Screening - ensuring criteria are met
(189)
FI 10c CORE Norms Screening - ensuring criteria are met
(196)
IMPLEMENTATION:
THEMATIC
FI 12 CORE Themed bond processes
(141)
FI 13 ADDITIONAL Assessing impact
(141)
IMPLEMENTATION:
INTEGRATION
FI 15 CORE ESG information in investment processes
(273)
FI 16 ADDITIONAL E,S and G issues reviewed
(273)
ENGAGEMENT
FI 18 CORE Engagement overview and coverage
(345)
FI 19 ADDITIONAL Engagement method
(345)
FI 20 ADDITIONAL Engagement policy disclosure
(345)
OUTPUTS AND
OUTCOMES FI 21 ADDITIONAL
Financial/ESG performance
(345)
COMMUNICATION
FI 23a CORE Disclosure of approach to public
(345)
FI 23b CORE Disclosure of approach to clients/beneficiaries
(345)
ASSESSMENT REPORT | 2016
50 ASSESSMENT
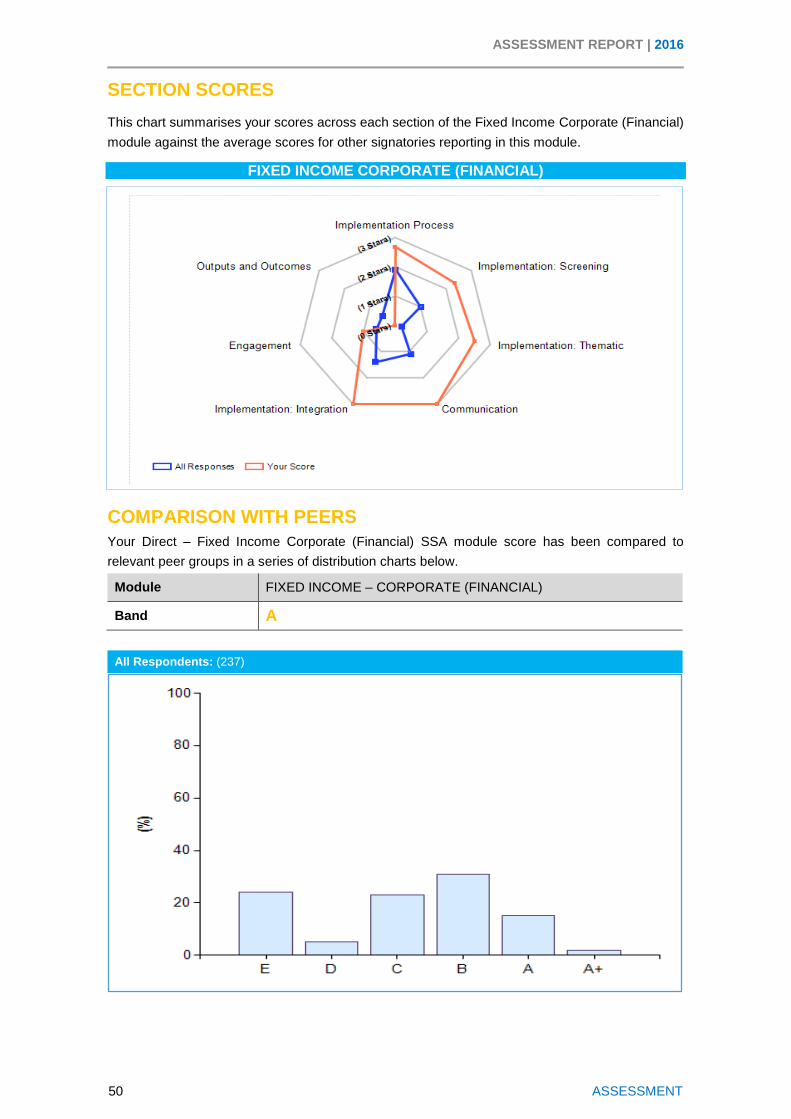
SECTION SCORES
This chart summarises your scores across each section of the Fixed Income Corporate (Financial)
module against the average scores for other signatories reporting in this module.
FIXED INCOME CORPORATE (FINANCIAL)
COMPARISON WITH PEERS
Your Direct – Fixed Income Corporate (Financial) SSA module score has been compared to
relevant peer groups in a series of distribution charts below.
Module FIXED INCOME – CORPORATE (FINANCIAL)
Band A
All Respondents: (237)
ASSESSMENT REPORT | 2016
51 ASSESSMENT
COMPARISON WITH PEERS
Your Direct – Fixed Income Corporate (Financial) module score has been compared to relevant
peer groups in a series of distribution charts below.
Module FIXED INCOME CORPORATE (FINANCIAL)
Band A
Category: Asset Owner (72)
Size: US$ 1 - 4.99 billion AUM (12 Asset Owners)

ASSESSMENT REPORT | 2016
52 ASSESSMENT
COMPARISON WITH PEERS
Your Direct – Fixed Income Corporate (Financial) module score has been compared to relevant
peer groups in a series of distribution charts below.
Module FIXED INCOME CORPORATE (FINANCIAL)
Band A
Signed PRI: 2014 (8 Investment Managers & Asset Owners)
Region: Europe (47 Investment Managers & Asset Owners)

ASSESSMENT REPORT | 2016
53 ASSESSMENT
DIRECT – FIXED INCOME SECURITISED INDICATOR SCORECARD
Module FIXED INCOME (SECURITISED)
Total Score 21 (out of a maximum 33 from 11 indicators including the following
additionally assessed indicators: FI 09)
Band B
SECTION INDICATOR MEDIAN
PEER SCORE (# peers)
YOUR
SCORE
NUMBER TYPE TOPIC
IMPLEMENTATION
PROCESSES
FI 05.1 CORE ESG issues and issuer research
(167)
FI 05.2 CORE ESG issues and issuer research
(167)
FI 06 CORE Processes to ensure analysis is robust
(167)
IMPLEMENTATION:
SCREENING
FI 09 ADDITIONAL Examples of ESG factors in screening process
(154)
FI 10a CORE Negative Screening - ensuring criteria are met
(145)
FI 10b CORE Positive Screening - ensuring criteria are met
(122)
FI 10c CORE Norms Screening - ensuring criteria are met
(122)
IMPLEMENTATION:
THEMATIC
FI 12 CORE Themed bond processes
(120)
FI 13 ADDITIONAL Assessing impact
(120)
IMPLEMENTATION:
INTEGRATION
FI 15 CORE ESG information in investment processes
(148)
FI 16 ADDITIONAL E,S and G issues reviewed
(148)
ENGAGEMENT
FI 18 CORE Engagement overview and coverage
(167)
FI 19 ADDITIONAL Engagement method
(167)
FI 20 ADDITIONAL Engagement policy disclosure
(167)
OUTPUTS AND
OUTCOMES FI 21 ADDITIONAL
Financial/ESG performance
(167)
COMMUNICATION
FI 23a CORE Disclosure of approach to public
(167)
FI 23b CORE Disclosure of approach to clients/beneficiaries
(167)

ASSESSMENT REPORT | 2016
54 ASSESSMENT
SECTION SCORES
This chart summarises your scores across each section of the Fixed Income (Securitised) module
against the average scores for other signatories reporting in this module.
FIXED INCOME (SECURITISED)
COMPARISON WITH PEERS
Your Direct – Fixed income (Securitised) module score has been compared to relevant peer groups
in a series of distribution charts below.
Module FIXED INCOME (SECURITISED)
Band B
All Respondents: (167)
ASSESSMENT REPORT | 2016
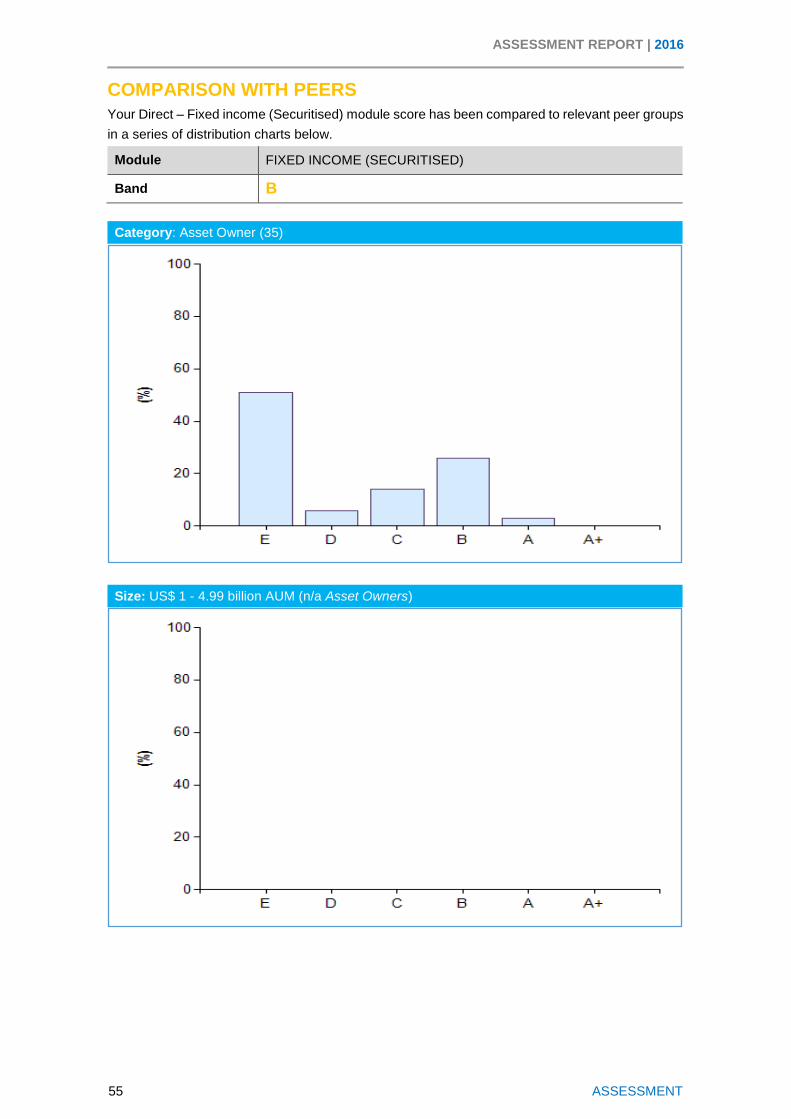
55 ASSESSMENT
COMPARISON WITH PEERS
Your Direct – Fixed income (Securitised) module score has been compared to relevant peer groups
in a series of distribution charts below.
Module FIXED INCOME (SECURITISED)
Band B
Category: Asset Owner (35)
Size: US$ 1 - 4.99 billion AUM (n/a Asset Owners)

ASSESSMENT REPORT | 2016
56 ASSESSMENT
COMPARISON WITH PEERS
Your Direct – Fixed income (Securitised) module score has been compared to relevant peer groups
in a series of distribution charts below.
Module FIXED INCOME (SECURITISED)
Band B
Signed PRI: 2014 (n/a Investment Managers & Asset Owners)
Region: Europe (22 Investment Managers & Asset Owners)

ASSESSMENT REPORT | 2016
57 ASSESSMENT
FURTHER READING / RESOURCES
PRI REPORTING FRAMEWORK 2016
Strategy and Governance Module
SG 04 It is considered good practice to review RI objectives at least once a year.
Indirect – Listed Equities Module
SAM 05 PRI scores signatories on the number of selections made.
SAM 07 PRI scores signatories on the number of selections made.
SAM 08
It is considered good practice to track the votes cast on your behalf by external managers. Page 7 of the 'Aligning Expectations: Guidance for asset owners on incorporating ESG factors into manager selection, appointment and monitoring' guide might be of interest to you.
Indirect – Private Equity Module
SAM 11 PRI scores signatories on the number of selections made.
Indirect – Property Module
SAM 10
PRI scores signatories on the breadth of ESG considerations included in agreements/fund formation contracts for non-listed assets. Private equity investors might find the 'Limited Partners’ Responsible Investment Due Diligence Questionnaire' useful.
SAM 11 PRI scores signatories on the number of selections made.
Direct Fixed Income SSA Module
FI 06
PRI scores signatories on the breadth of E S and G factors included in screening criteria. Page 27 of the Fixed Income Investor Guide offers practical examples of ESG screening in fixed income.
FI 09
Leading signatories screen based on all three types of factors. Page 27 of the Fixed Income Investor Guide offers practical examples of ESG screening in fixed income.
FI 13
PRI scores signatories on the breadth of processes used to encourage transparency and disclosure in relation to themed bond issuances. Pages 33-35 of the Fixed Income Investor Guide offers practical examples of ESG screening in fixed income.
Direct Fixed Income CF Module
FI 06
PRI scores signatories on the breadth of E S and G factors included in screening criteria. Page 27 of the Fixed Income Investor Guide offers practical examples of ESG screening in fixed income.
FI 09
Leading signatories screen based on all three types of factors. Page 27 of the Fixed Income Investor Guide offers practical examples of ESG screening in fixed income.
FI 13
PRI scores signatories on the breadth of processes used to encourage transparency and disclosure in relation to themed bond issuances. Pages 33-35 of the Fixed Income Investor Guide offers practical examples of ESG screening in fixed income.

ASSESSMENT REPORT | 2016
58 ASSESSMENT
FI 18
PRI scores signatories on the proportion of fixed income assets engaged on. Page 29 of the Fixed Income Investor Guide offers further information on engagement in Fixed Income. You may also find the Engaging with Issuers | KFW case study useful.
FI 20
It is considered good practice to outline you engagement approach for fixed income assets specifically in any engagement policy documentation. Page 29 of the Fixed Income Investor Guide offers further information on engagement in Fixed Income. You may also find the Engaging with Issuers | KFW case study useful.
FI 21 It is considered good practice to measure whether your ESG approaches impacted the financial/ESG performance of your portfolio.
Direct Fixed Income SEC Module
FI 06 PRI scores signatories on the breadth of E S and G factors included in screening criteria. Page 27 of the Fixed Income Investor Guide offers practical examples of ESG screening in fixed income.
FI 09 Leading signatories screen based on all three types of factors. Page 27 of the Fixed Income Investor Guide offers practical examples of ESG screening in fixed income.
FI 18
PRI scores signatories on the proportion of fixed income assets engaged on. Page 29 of the Fixed Income Investor Guide offers further information on engagement in Fixed Income. You may also find the Engaging with Issuers | KFW case study useful.
FI 19
PRI scores signatories on the breadth of activities done in relation to engagement. Page 29 of the Fixed Income Investor Guide offers further information on engagement in Fixed Income. You may also find the Engaging with Issuers | KFW case study useful.
FI 20
It is considered good practice to outline you engagement approach for fixed income assets specifically in any engagement policy documentation. Page 29 of the Fixed Income Investor Guide offers further information on engagement in Fixed Income. You may also find the Engaging with Issuers | KFW case study useful.
FI 21 It is considered good practice to measure whether your ESG approaches impacted the financial/ESG performance of your portfolio.
GET SUPPORT FURTHER INFORMATION
To enquire about a one-on-one session with the PRI team, please click here.
For further asset class specific information and resources, please click here.

ASSESSMENT REPORT | 2016
59 ASSESSMENT
INFORMATION
GLOSSARY:
Not Applicable/NA: Generally means a module is not applicable to you as you have 0% assets
allocated to that asset class. For the incorporation modules and active ownership module this could
mean that you have a purely passive/thematic approach or vote/engage solely through external
managers.
Not Reported/NR: Generally means you hold <10% in that asset class and have chosen not to
report on it. In the case of the infrastructure module you may have >10% AUM but chose not to
report.
PEERING CATEGORIES
The table below explains the breakdown for each category.
Peering Category Asset Owner Investment Manager
All Respondents This includes all applicable signatories for that module. Including asset owners and investment managers.
Category This includes all asset owner signatories
This includes all investment manager signatories.
Size This includes all asset owners in your applicable PRI fee band.
This includes all investment managers in your applicable PRI fee band.
Signed PRI This includes all asset owner and investment managers in your signature year.
This includes all investment managers in your signature year.
Region This includes all asset owner and investment managers in your region.
This includes all investment managers in your region.
FREQUENTLY ASKED QUESTIONS
Is the Assessment Report made publicly available?
No. The assessment report is confidential and is only shared with the signatory.
However, Signatories are free to disclose their assessment reports as long as they follow the
guidance at the beginning of this report. .
Why have I scored an E band?
The E band is awarded to signatories not doing any RI activities in an asset class even where the
holding in that asset class falls below the 10% threshold.
For further information on this please see the Assessment Way Forward document and the
assessment methodology on our website.