vermont training programaccd.vermont.gov/sites/accdnew/files/documents/ded/vtp/vtp fy15... ·...
TRANSCRIPT

Vermont Training Program Annual Report – Fiscal Year 2015 January 2016 | Agency of Commerce and Community Development
1
About the Vermont Training Program
The Vermont Training Program (VTP) sits within the
Agency of Commerce and Community Development’s
Department of Economic Development. This grant
fund for customized training helps Vermont’s
workforce acquire skills required in a rapidly changing,
global marketplace. It partners with employers and
training providers to fund the training of Vermont's
employees for the jobs of tomorrow. The VTP
accomplishes this by providing performance based
grants through a reimbursement process for the
training of new hires and incumbent workers. Training
can fall into categories such as on-the-job, classroom,
or other specialized training. Fiscal Year 2015 proved
to be a transitional year as reporting criteria changed
under act 199. This report reflects both old statutory
reporting requirements and the new reporting
requirements.
Vermont Training Program Annual Report
Fiscal Year 2015 Published:
January 15, 2016
Prepared by:
John Young, Director Workforce
Development Programs
802-355-2725
From:
Agency of Commerce and
Community Development
Patricia Moulton, Secretary
Department of Economic
Development
Joan Goldstein, Commissioner

Vermont Training Program Annual Report – Fiscal Year 2015 January 2016 | Agency of Commerce and Community Development
2
CONTENTS
Executive Summary ..................................................................................................... 3
Results Based Accountability Summary of Results................................................... 3
Impact Highlights ........................................................................................................ 5
Geographic Distribution of Grants to Partner Businesses ........................................ 6
Sector Distribution of Grants to Partner Businesses ................................................ 8
Completed and Active Grant Details ......................................................................... 9
Completed Grants .......................................................................................................9
Active Grants ............................................................................................................ 10
Geographic Distribution of Grants to Training Providers ...................................... 11
Sector Distribution of Grants to Training Providers ............................................... 13
Completed Training Provider Grants ....................................................................... 14
Employers Represented by Training Provider Grants ............................................ 14
Eligibility to Participate ............................................................................................ 16
Note on Reporting Format ...................................................................................... 17
Note on Analysis………………………………………………………………………………………….. 18
Aggregate Data ........................................................................................................ 19
Grants to Partner Businesses Training Breakdown ............................................... 20
Grants to Training Providers Training Breakdown .................................................. 23
Regional Waivers ..................................................................................................... 26
Grantee Survey ......................................................................................................... 26
Contact Information ................................................................................................ 29

Vermont Training Program Annual Report – Fiscal Year 2015 January 2016 | Agency of Commerce and Community Development
3
EXECUTIVE SUMMARY
Fiscal year 2015 was a busy and successful year for the Vermont Training
Program. Over 3200 Vermont workers including 82 new hires were trained
under the program through both on-site as well as classroom training. Of the
total 271 companies served, 91 of them have 49 employees or less. Fourteen
training providers were awarded grants and they served 244 businesses
across the State. Advanced manufacturing skills such as Lean Technology
were the most sought after but Computer Aided Design and Computer
Numerical Control were also popular requests. CNC skills were trained in
traditional metal fabricators but were needed in wood prefabrication
companies as well. Leadership training was a popular training request as
businesses continue to adjust to workforce needs and challenges. Trade skills
in HVAC, welding and electrical repair were requested either through a
training provider or an individual business application. Software and IT
training was also requested as more businesses are continuing to streamline
their processes with the support of various software. Businesses continue to
train internally as the number of incumbent employees trained is a majority
of the applications for both skill upgrades as well as advancement in
position.
HOW MUCH?
Grant Budget: $1,307,741.00
Total Employees Served: 3,250
Total Businesses Served: 271
New Hires: 82
Note: The above data is a combination of grants to businesses and training providers.
HOW WELL?
Cost Per Employee: $402.38
Grantees “Highly Satisfied” with Quality of Staff Assistance
Grantees Rate the VTP as Assisting with “An Increased Overall Business
Capability or has Improved the Outlook for the Future”
▪ ▪ ▪
“This is a great
program and
addresses some
capability issues in
the Vermont
workforce and will
help attract
employers to the
state and/or help
retain them”
▪ ▪ ▪

Vermont Training Program Annual Report – Fiscal Year 2015 January 2016 | Agency of Commerce and Community Development
4
IS ANYONE BETTER OFF?
Data collected by the Vermont Department of Labor shows that those
employees who participate in VTP trainings see a wage increase as compared
to the statewide average.
Fiscal Year Median Quarterly Wage Increase Post Training
*Preliminary 2015 0.3%
Updated 2014 15.3%
Preliminary 2014 11.2%
2013 10.6%
2012 10.9%
Source: Vermont Department of Labor Median Wage Analysis for the Vermont Training
Program. 2015 wage data is preliminary and statewide data is not yet available.
Calculations are based on individual tax return data.
*Note: Due to the fact that the Vermont training program is administered on a
rolling basis, and that VDOL calculates median wage changes only from grants that
start and end in the same fiscal year as well as those that train employees for 16
hours or more, only 14.9% of FY15 applicants were captured in VDOL’s analysis.
There were a large number of grants carried over from FY14 that we have included
in the FY15 report. However, because the grants did not start in FY15 they are not
captured in VDOL’s analysis either. We have received updated FY14 data from
VDOL in this year’s analysis that we are reporting on. Updated FY15 data will be
included in the FY16 annual report.

Vermont Training Program Annual Report – Fiscal Year 2015 January 2016 | Agency of Commerce and Community Development
5
IMPACT HIGHLIGHTS
The Company Received a grant from the Vermont Training Program and
assisted with the funding of employee training that included: Training and
upgrading the skills of over 27 employees through the University of
Vermont’s Center for Leadership and Innovation. The training provided
employees with important training regarding sales and executive team
relationship building.
“Hazelett Corporation considers the Vermont Training Program our partner
when providing necessary skills to our workforce. Always helpful with
suggestions and direction they are the best example of government support
of training for Vermont citizens. Hazelett’s future depends upon these
Vermonters.”
Hazelett Corporation is a fourth generation, family-owned company located on the
beautiful shores of Lake Champlain in Colchester, Vermont. Hazelett Corporation
designs, manufactures, installs, and services continuous casting equipment and is
the exclusive supplier of Hazelett® twin-belt continuous casting machines. With
more than 80 years in the industry, Hazelett is a global leader in twin-belt casting
for flat and long nonferrous products. The company employs more than 140
employees, including leading experts in process automation, mechanical and
electrical design, and metallurgy.
Vermont Training Program Annual Report – Fiscal Year 2015 January 2016 | Agency of Commerce and Community Development
6
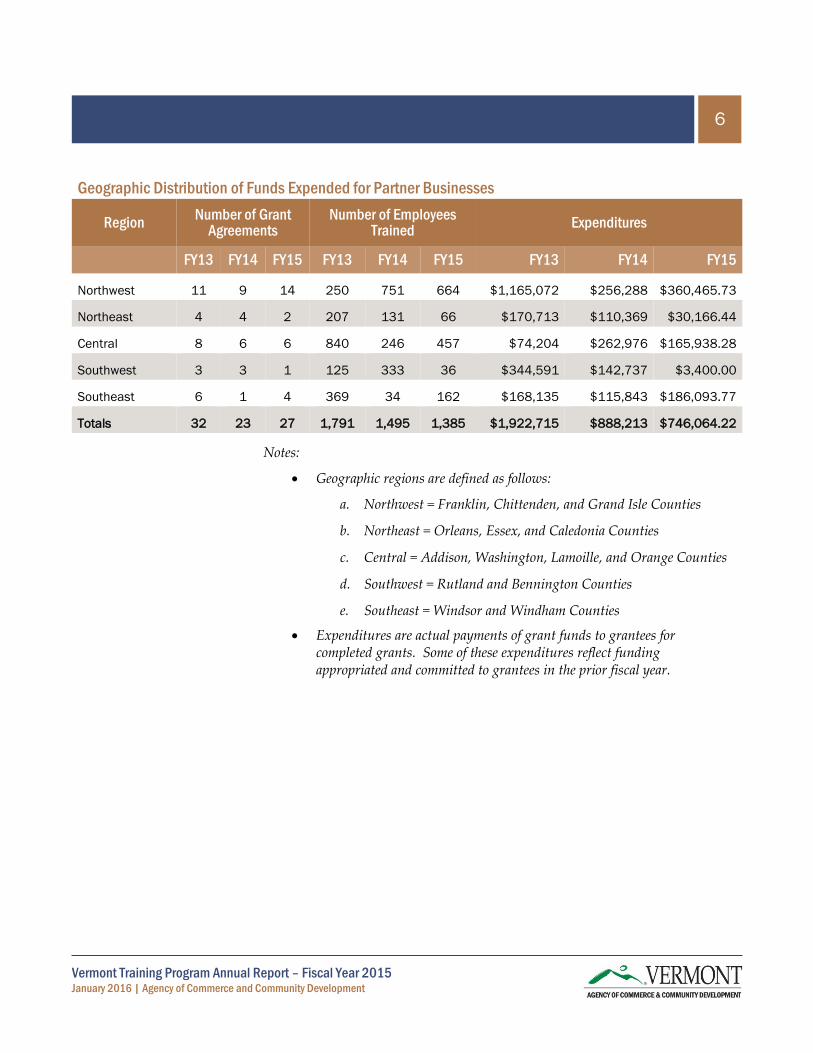
Geographic Distribution of Funds Expended for Partner Businesses
Region Number of Grant
Agreements Number of Employees
Trained Expenditures
FY13 FY14 FY15 FY13 FY14 FY15 FY13 FY14 FY15
Northwest 11 9 14 250 751 664 $1,165,072 $256,288 $360,465.73
Northeast 4 4 2 207 131 66 $170,713 $110,369 $30,166.44
Central 8 6 6 840 246 457 $74,204 $262,976 $165,938.28
Southwest 3 3 1 125 333 36 $344,591 $142,737 $3,400.00
Southeast 6 1 4 369 34 162 $168,135 $115,843 $186,093.77
Totals 32 23 27 1,791 1,495 1,385 $1,922,715 $888,213 $746,064.22
Notes:
Geographic regions are defined as follows:
a. Northwest = Franklin, Chittenden, and Grand Isle Counties
b. Northeast = Orleans, Essex, and Caledonia Counties
c. Central = Addison, Washington, Lamoille, and Orange Counties
d. Southwest = Rutland and Bennington Counties
e. Southeast = Windsor and Windham Counties
Expenditures are actual payments of grant funds to grantees for completed grants. Some of these expenditures reflect funding appropriated and committed to grantees in the prior fiscal year.
Vermont Training Program Annual Report – Fiscal Year 2015 January 2016 | Agency of Commerce and Community Development
7
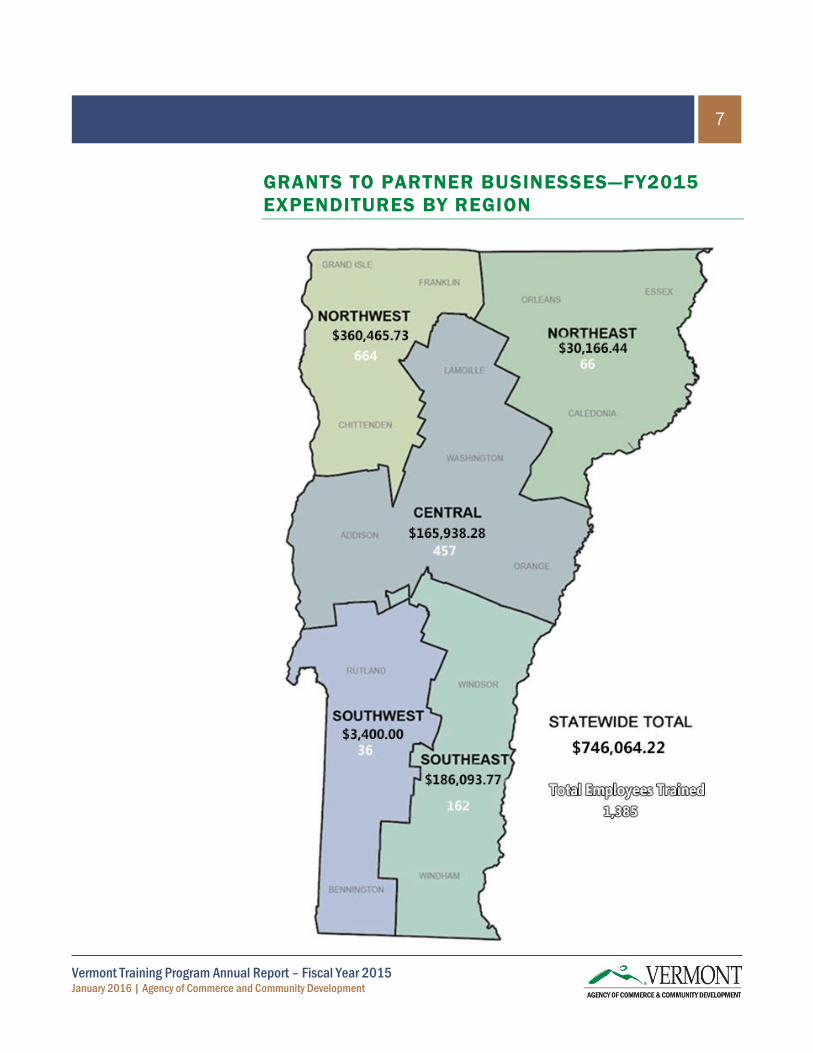
GRANTS TO PARTNER BUSINESSES—FY2015
EXPENDITURES BY REGION
Vermont Training Program Annual Report – Fiscal Year 2015 January 2016 | Agency of Commerce and Community Development
8
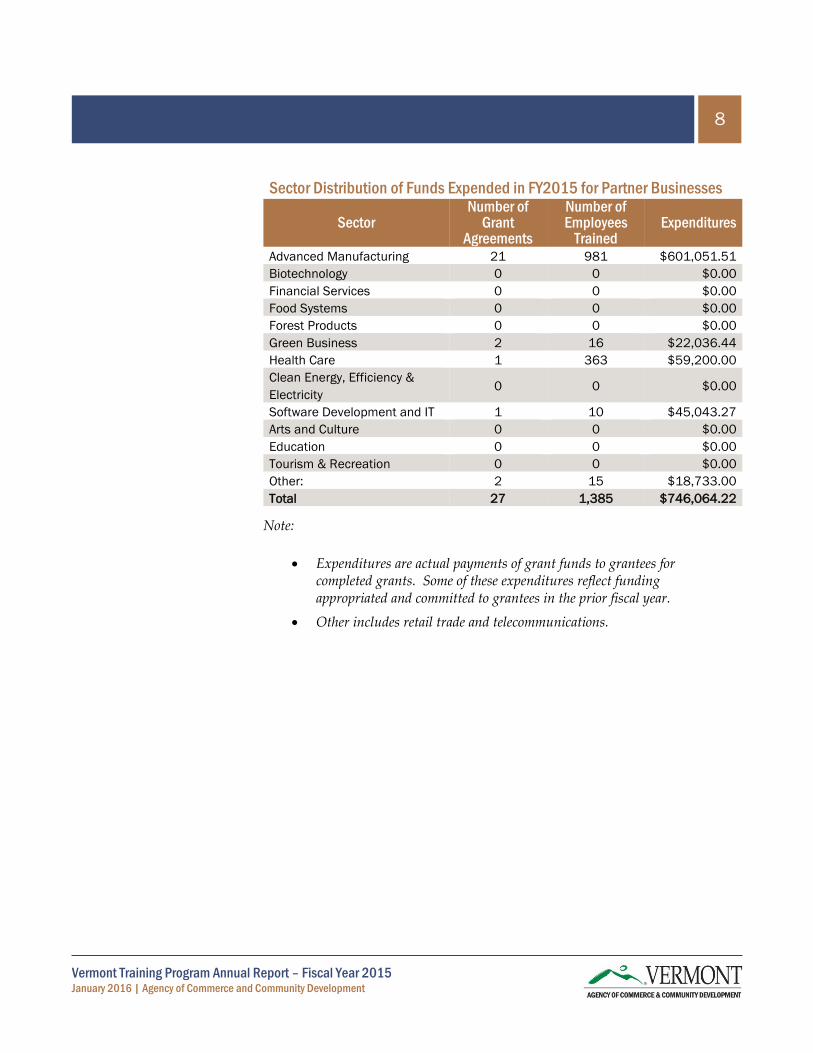
Sector Distribution of Funds Expended in FY2015 for Partner Businesses
Sector Number of
Grant Agreements
Number of Employees
Trained Expenditures
Advanced Manufacturing 21 981 $601,051.51
Biotechnology 0 0 $0.00
Financial Services 0 0 $0.00
Food Systems 0 0 $0.00
Forest Products 0 0 $0.00
Green Business 2 16 $22,036.44
Health Care 1 363 $59,200.00
Clean Energy, Efficiency &
Electricity 0 0 $0.00
Software Development and IT 1 10 $45,043.27
Arts and Culture 0 0 $0.00
Education 0 0 $0.00
Tourism & Recreation 0 0 $0.00
Other: 2 15 $18,733.00
Total 27 1,385 $746,064.22
Note:
Expenditures are actual payments of grant funds to grantees for completed grants. Some of these expenditures reflect funding appropriated and committed to grantees in the prior fiscal year.
Other includes retail trade and telecommunications.

Vermont Training Program Annual Report – Fiscal Year 2015 January 2016 | Agency of Commerce and Community Development
9
COMPLETED AND ACTIVE GRANT DETAILS
In accordance with the provisions of 10 V.S.A. § 531(i)(K):
“(k) Annually on or before January 15, the secretary shall submit a report
to the house committee on commerce and economic development and
the senate committee on economic development, housing and general
affairs summarizing all active and completed contracts and grants, the
types of training activities provided, the number of employees served,
and the average wage by employer, and addressing any waivers granted”
Key for Training Activities:
NH New Hire On-the-Job Training
IC Incumbent Employee in Classroom Training
IN OJT Incumbent Employee doing On-the-Job Training
Completed Grants
Business Grants Quick Facts:
FY13 FY14 FY15
Total Number of Completed Grants 49 31 27
Total Funds Spent on
Completed Grants $1,347,518 $1,224,351 $746,064.22
Total Number of Employees Served 3,857 2,184 1,385
Approximate Cost Per Employee $349.36 $560.60 $513.66
Completed Business Grant Recipients
Expenditure Activity # Served Average
Wage
Grow Compost $14,889.92 IN, NH 8 $14.44
Bouchard Pierce $800.00 IC 4 19.88
Connor Homes $43,159.48 IN OJT, IC,
NH 39 $22.15
Cx Associates $7,146.52 IN OJT, IC 7 $26.06
Flex-a-Seal, Inc. $45,943.56 IN OJT, IC 38 $23.50
Freedom Foods $39,516.00 IN OJT, NH 16 $13.15

Vermont Training Program Annual Report – Fiscal Year 2015 January 2016 | Agency of Commerce and Community Development
10
General Dynamics $12,532.52 IC 39 $48.91
Gordon's Window $11,030.40 IC, NH 32 $19.17
Hayward Tyler, Inc. $15,210.00 IC 119 $31.24
King Arthur Flour $11,207.43 IN OJT, IC 47 $28.49
Lake Champ Chocolates $35,857.60 IC, NH 14 $22.24
Leader Evaporator $54,845.00 IC, NH 92 $20.14
Liquid Measurement
Systems, Inc $7,720.21 IN OJT, IC 39 $35.76
Microstrain (LORD Corp) $37,808.08 IN OJT, IC,
NH 38 $33.14
North Country Engineering $10,916.44 IN OJT, NH 14 $18.34
Northeast Precision Inc. $19,250.00 IC 52 $20.58
Open Tempo $45,043.27 IC, NH 10 $30.50
Kalow Technologies $3,400.00 IC 36 $18.51
Porter Medical $59,200.00 IC 363 $46.85
Polhemus $17,317.57 IN OJT, IC 38 $34.75
PRECI Manufacturing $63,711.00 IC 180 $18.46
Revision Ballistics $5,751.25 IN OJT, NH 18 $14.74
Serac $5,500.00 IC 15 $27.16
Simon Pearce $76,511.71 IN OJT, IC 39 $39.37
Stark Mt Woodworking $3,421.63 IN OJT, IC 12 $18.59
Valleynet $17,933.00 IN OJT, IC,
NH 11 $20.28
Whitney Blake $80,441.63 IN OJT, NH 65 $30.61
Total $746,064.22 1385
Active Business Grant Recipients Maximum Payable
H. Hirschmann Ltd. $38,175.00
Mansfield Heliflight $26,210.00
Ellison Surface Tech $5,946.00
Acrylic Designs $11,351.00
CPS Critical Process Systems $26,109.00
Smart Resources $16,814.00

Vermont Training Program Annual Report – Fiscal Year 2015 January 2016 | Agency of Commerce and Community Development
11
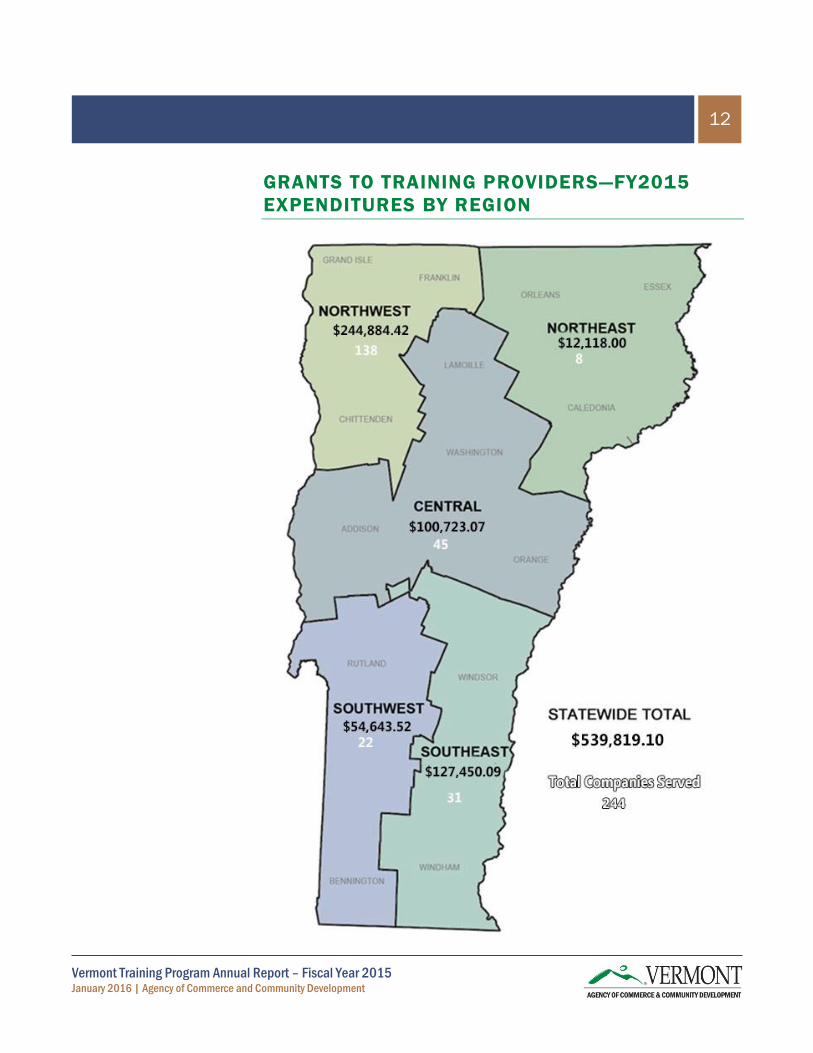
Geographic Distribution of Funds Expended to Training Providers FY2015
Region Number of Companies
Served by Grant Agreements
Number of Employees
Trained Expenditures
Northwest 138 1,088 $244,884.42
Northeast 8 21 $12,118.00
Central 45 387 $100,723.07
Southwest 22 104 $54,643.52
Southeast 31 265 $127,450.09
Total 244 1,865 $539,819.10
Notes:
Geographic regions are defined as follows:
a. Northwest = Franklin, Chittenden, and Grand Isle Counties
b. Northeast = Orleans, Essex, and Caledonia Counties
c. Central = Addison, Washington, Lamoille, and Orange Counties
d. Southwest = Rutland and Bennington Counties
e. Southeast = Windsor and Windham Counties
VTP is reporting the “Number of Companies Served by Grant Agreements” rather than the “Number of Grant Agreements” to illustrate how many companies are served through its grants to training providers.
Vermont Training Program Annual Report – Fiscal Year 2015 January 2016 | Agency of Commerce and Community Development
12
GRANTS TO TRAINING PROVIDERS—FY2015
EXPENDITURES BY REGION

Vermont Training Program Annual Report – Fiscal Year 2015 January 2016 | Agency of Commerce and Community Development
13
Sector Distribution of Funds Expended in FY2015 for Training Providers
Sector
Number of Companies Served
by Grant Agreements
Number of Employees
Trained Expenditures
Advanced Manufacturing: 169 1,283 $405,080.15
Biotechnology: 0 0 $0.00
Financial Services: 0 0 $0.00
Food Systems: 0 0 $0.00
Forest Products: 0 0 $0.00
Green Business: 0 0 $0.00
Health Care: 50 385 $89,983.35
Clean Energy, Efficiency
& Electrical: 8 26 $12,103.32
Software Dev. and IT: 10 59 $19,779.35
Arts and Culture: 0 0 $0.00
Education: 1 4 $3,750.00
Tourism & Recreation: 0 0 $0.00
Other (Telecomm): 6 108 $5,403.57
Total 244 1,865 $539,819.10
Note: All companies listed as “Other” were in the telecommunications sector.
Training Provider Quick Facts:
2013 2014 2015
Total Number of
Employers Served 336 124 244
Total Funds Spent on
Completed Grants $459,312.84 $171,333.63 $539,819.10
Number of Employees
Served 2014 689 1865
Vermont Training Program Annual Report – Fiscal Year 2015 January 2016 | Agency of Commerce and Community Development
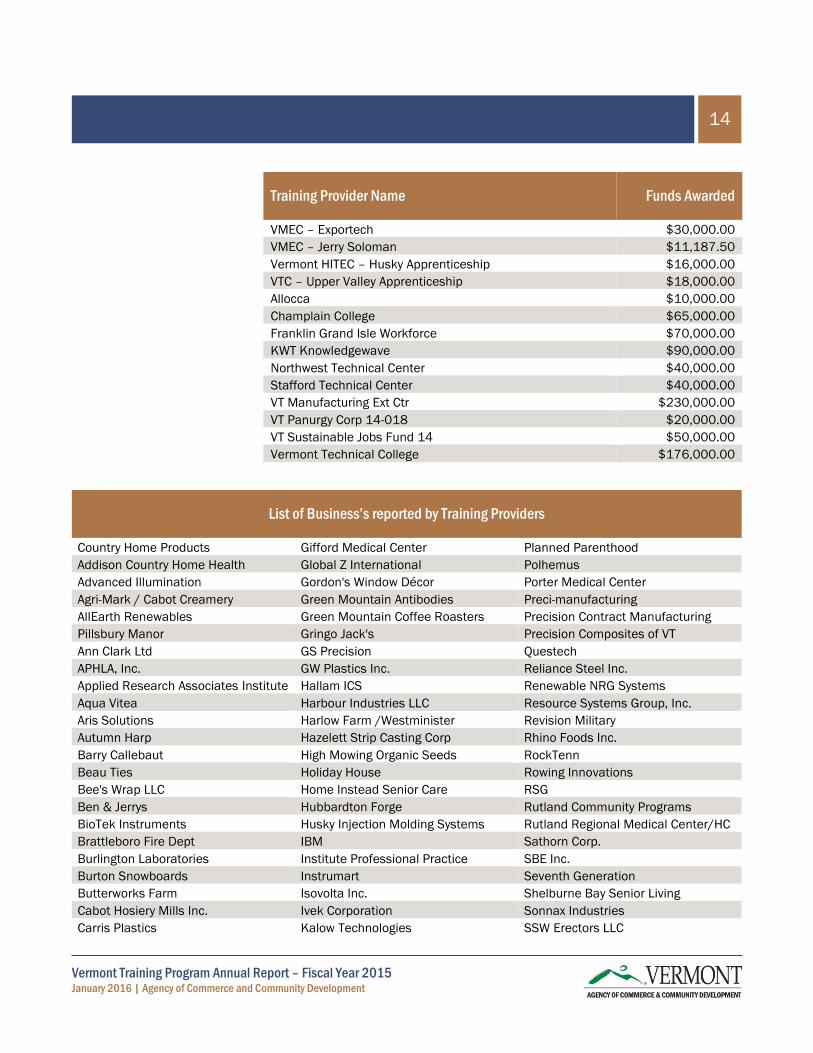
14
Training Provider Name Funds Awarded
VMEC – Exportech $30,000.00
VMEC – Jerry Soloman $11,187.50
Vermont HITEC – Husky Apprenticeship $16,000.00
VTC – Upper Valley Apprenticeship $18,000.00
Allocca $10,000.00
Champlain College $65,000.00
Franklin Grand Isle Workforce $70,000.00
KWT Knowledgewave $90,000.00
Northwest Technical Center $40,000.00
Stafford Technical Center $40,000.00
VT Manufacturing Ext Ctr $230,000.00
VT Panurgy Corp 14-018 $20,000.00
VT Sustainable Jobs Fund 14 $50,000.00
Vermont Technical College $176,000.00
List of Business’s reported by Training Providers
Country Home Products Gifford Medical Center Planned Parenthood
Addison Country Home Health Global Z International Polhemus
Advanced Illumination Gordon's Window Décor Porter Medical Center
Agri-Mark / Cabot Creamery Green Mountain Antibodies Preci-manufacturing
AllEarth Renewables Green Mountain Coffee Roasters Precision Contract Manufacturing
Pillsbury Manor Gringo Jack's Precision Composites of VT
Ann Clark Ltd GS Precision Questech
APHLA, Inc. GW Plastics Inc. Reliance Steel Inc.
Applied Research Associates Institute Hallam ICS Renewable NRG Systems
Aqua Vitea Harbour Industries LLC Resource Systems Group, Inc.
Aris Solutions Harlow Farm /Westminister Revision Military
Autumn Harp Hazelett Strip Casting Corp Rhino Foods Inc.
Barry Callebaut High Mowing Organic Seeds RockTenn
Beau Ties Holiday House Rowing Innovations
Bee's Wrap LLC Home Instead Senior Care RSG
Ben & Jerrys Hubbardton Forge Rutland Community Programs
BioTek Instruments Husky Injection Molding Systems Rutland Regional Medical Center/HC
Brattleboro Fire Dept IBM Sathorn Corp.
Burlington Laboratories Institute Professional Practice SBE Inc.
Burton Snowboards Instrumart Seventh Generation
Butterworks Farm Isovolta Inc. Shelburne Bay Senior Living
Cabot Hosiery Mills Inc. Ivek Corporation Sonnax Industries
Carris Plastics Kalow Technologies SSW Erectors LLC
Vermont Training Program Annual Report – Fiscal Year 2015 January 2016 | Agency of Commerce and Community Development
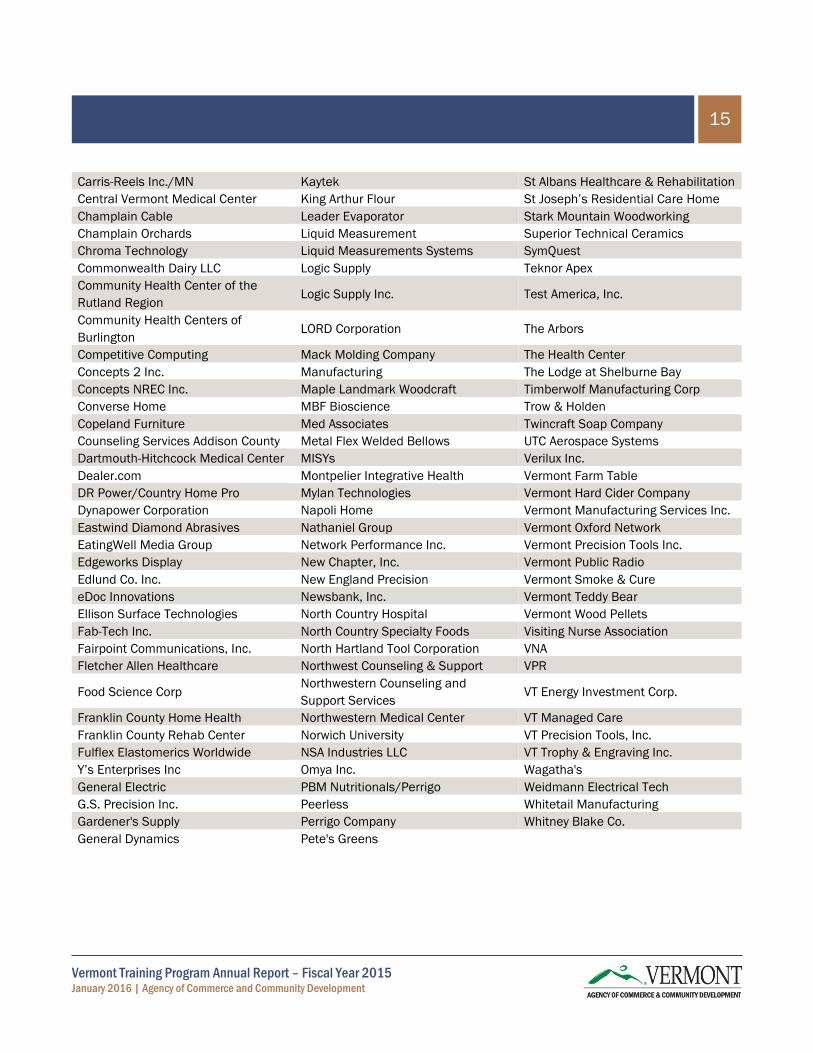
15
Carris-Reels Inc./MN Kaytek St Albans Healthcare & Rehabilitation
Central Vermont Medical Center King Arthur Flour St Joseph’s Residential Care Home
Champlain Cable Leader Evaporator Stark Mountain Woodworking
Champlain Orchards Liquid Measurement Superior Technical Ceramics
Chroma Technology Liquid Measurements Systems SymQuest
Commonwealth Dairy LLC Logic Supply Teknor Apex
Community Health Center of the
Rutland Region Logic Supply Inc. Test America, Inc.
Community Health Centers of
Burlington LORD Corporation The Arbors
Competitive Computing Mack Molding Company The Health Center
Concepts 2 Inc. Manufacturing The Lodge at Shelburne Bay
Concepts NREC Inc. Maple Landmark Woodcraft Timberwolf Manufacturing Corp
Converse Home MBF Bioscience Trow & Holden
Copeland Furniture Med Associates Twincraft Soap Company
Counseling Services Addison County Metal Flex Welded Bellows UTC Aerospace Systems
Dartmouth-Hitchcock Medical Center MISYs Verilux Inc.
Dealer.com Montpelier Integrative Health Vermont Farm Table
DR Power/Country Home Pro Mylan Technologies Vermont Hard Cider Company
Dynapower Corporation Napoli Home Vermont Manufacturing Services Inc.
Eastwind Diamond Abrasives Nathaniel Group Vermont Oxford Network
EatingWell Media Group Network Performance Inc. Vermont Precision Tools Inc.
Edgeworks Display New Chapter, Inc. Vermont Public Radio
Edlund Co. Inc. New England Precision Vermont Smoke & Cure
eDoc Innovations Newsbank, Inc. Vermont Teddy Bear
Ellison Surface Technologies North Country Hospital Vermont Wood Pellets
Fab-Tech Inc. North Country Specialty Foods Visiting Nurse Association
Fairpoint Communications, Inc. North Hartland Tool Corporation VNA
Fletcher Allen Healthcare Northwest Counseling & Support VPR
Food Science Corp Northwestern Counseling and
Support Services VT Energy Investment Corp.
Franklin County Home Health Northwestern Medical Center VT Managed Care
Franklin County Rehab Center Norwich University VT Precision Tools, Inc.
Fulflex Elastomerics Worldwide NSA Industries LLC VT Trophy & Engraving Inc.
Y’s Enterprises Inc Omya Inc. Wagatha's
General Electric PBM Nutritionals/Perrigo Weidmann Electrical Tech
G.S. Precision Inc. Peerless Whitetail Manufacturing
Gardener's Supply Perrigo Company Whitney Blake Co.
General Dynamics Pete's Greens

Vermont Training Program Annual Report – Fiscal Year 2015 January 2016 | Agency of Commerce and Community Development
16
ELIGIBILITY TO PARTICIPATE
The VTP is open to all sectors. Grantees must ensure that:
Training supplements, rather than replaces, the company’s ongoing normal training efforts and is directly related to work responsibilities
Employees are being trained in transferrable skills
Employees covered under the grant must be full time permanent employees (minimum 35 hrs. per week)
Employee compensation (hourly wage), at the completion of training, must equal or exceed the livable wage as defined by the Vermont Legislative Joint Fiscal Office (JFO). Currently set at $13.00 per hour
Employees must be offered a minimum of three of the following employee benefits: health insurance (w/ 50% or more of the premium paid by the employer), dental assistance, paid vacation, paid holidays, child care, retirement benefits, other paid time off including paid sick days, other extraordinary employee benefits.
Health Insurance (with 50% or more of
premium paid by employer) Dental Insurance Assistance
Paid Vacation Paid Holidays
Child Care Retirement Benefits
Other Paid Time off Including Sick Time Other Extraordinary Employee Benefits
Note: Employer certifies that all the information in the initial application is complete and correct via a signed document.

Vermont Training Program Annual Report – Fiscal Year 2015 January 2016 | Agency of Commerce and Community Development
17
NOTE ON REPORTING FORMAT
(k) Annually on or before January 15, the Secretary shall submit a report
to the House Committee on Commerce and Economic Development and
the Senate Committee on Economic Development, Housing and General
Affairs. In addition to the reporting requirements under section 540 of
this title, the report shall identify:
1. all active and completed contracts and grants;
2. from among the following, the category the training addressed:
(A) pre-employment training or other training for a new
employee to begin a newly created position with the
employer;
(B) pre-employment training or other training for a new
employee to begin in an existing position with the
employer;
(C) training for an incumbent employee who, upon
completion of training, assumes a newly created
position with the employer;
(D) training for an incumbent employee who upon
completion of training assumes a different position with
the employer;
(E) training for an incumbent employee to upgrade skills;
3. for the training identified in subdivision (2) of this subsection
whether the training is onsite or classroom-based;
4. the number of employees served;
5. the average wage by employer;
6. any waivers granted;
7. the identity of the employer, or, if unknown at the time of the
report, the category of employer;
8. the identity of each training provider; and
9. whether training results in a wage increase for a trainee, and the
amount of increase.

Vermont Training Program Annual Report – Fiscal Year 2015 January 2016 | Agency of Commerce and Community Development
18
Key Indicators for Fiscal Year 2015 are divided into three general areas:
1. Aggregate Data
a. Funds Appropriated and Committed
b. Median Wage
c. Wage Change
2. Grants to Partner Businesses
3. Grants to Training Providers
NOTE ON ANALYSIS
This is the fourth year that the Vermont Training Program (VTP) Annual
Report is being issued using the Key Indicators. The passage of Act 199
during the FY14 legislative session changes the metrics by which the
Vermont Training Program will be measured. Both pre Act 199 and post Act
199 key indicators will be used throughout the report.

Vermont Training Program Annual Report – Fiscal Year 2015 January 2016 | Agency of Commerce and Community Development
19
VERMONT TRAINING PROGRAM KEY
INDICATORS
Aggregate Data
Data reported in this section reflect both Grants to Partner Businesses and
Grants to Training Providers.
Median Wage
Fiscal Year Median Wage of New Hires Median Wage of Incumbent Workers
FY2013 $14.59 $34.88
FY2014 $17.62 $27.02
*FY2015 $14.50 $29.41
Wage Change
Fiscal Year % Wage Change for New
Jobs % of Wage Change for Incumbent
Employees
FY2013 16.3% 11.3%
FY2014 103.8% 10.8%
*FY2015 8.1% -1.5%
Notes:
Median Wage and Wage Change data for employees has been provided by the Vermont Department of Labor (VDOL) from VDOL’s FY2015 Social Security Number data used to track wages of employees being trained. VDOL provided only aggregate updated median wage info, therefore we cannot report on updated median wage info per individual group.
Median Wage and Wage Change data for incumbent workers includes incumbent employees served with training provider grants and grant to partner business’s
*Note: Due to the fact
that the Vermont training
program is administered
on a rolling basis, and
that VDOL calculates
median wage changes
only from grants that start
and end in the same
fiscal year as well as
those that train
employees for 16 hours
or more, only 14.9% of
FY15 applicants were
captured in VDOL’s
analysis. This FY15
incumbent aggregate
data was collected from a
sample of 185
employees in the pre-
training period and
compared to 181
employees post training.
This decreased sample
size which could be
contributed to seasonal
factors, retirements and
natural job loss. This
information is a possible
contributor for the
decrease in median wage
change.

Vermont Training Program Annual Report – Fiscal Year 2015 January 2016 | Agency of Commerce and Community Development
20
GRANTS TO PARTNER BUSINESS TRAINING
BREAKDOWN
Data reported in this section reflect only grants made directly to businesses
for training employees.
*The chart below represents the key indicators that will be included based
upon new statutory language in act 199. There are two tables included; one
based upon pre act 199. Guidance and the other post act 199. guidance.
Number of Vermont Employees Trained for Partner Businesses
Fiscal Year Total Number of Employees Trained
FY2013 1,791
FY2014 1,495
FY2015 1,385
New Jobs for Partner Businesses
Fiscal Year Number of New
Jobs Trained Average Cost Per
Employee Median Wage of
Employees
FY2013 140 $2,031.61 $14.59
FY2014 209 $2,031.48 $17.62
FY2015 82 $3,267.25 $14.50
New Jobs added for Partner Businesses
*Note: The data below is based upon new statutory language in Act 199.
Fiscal Year
Employee Type # Onsite training
# Classroom Training
FY2015 Pre-employment training for a new hire in a
newly created position 0 0
Pre-employment training for existing position 0 0
New hire for a newly created position 5 0
New Hire for an existing position 2 0
Total: 7 0

Vermont Training Program Annual Report – Fiscal Year 2015 January 2016 | Agency of Commerce and Community Development
21
New Jobs added for Partner Businesses
*Note: The data below is based upon pre Act 199 guidance.
Fiscal Year # New Hires Expenditure FY2015 75 $257,337.73
Notes:
“New Jobs” – The VTP provides funding for the training of new positions added to a company.
It is understood that the VTP is one piece that supports jobs created at/by the company.
Median wage for new employees has been provided by the Vermont Department of Labor (VDOL) from VDOL’s FY2015 Social Security Number data used to track wages of employees being trained
*The chart below represents the key indicators that will be included based
upon new statutory language in act 199. There are two tables included; one
based upon pre act 199. Guidance and the other post act 199. guidance.
Incumbent Worker Training for Business Partners
Fiscal Year Number of Incumbent
Employees Trained
Average Cost Per Incumbent Employee
Median Wage of Employees
FY2013 1,651 $33.80 $40.54
FY2014 1,286 $418.59 $25.97
FY2015 1,303 $388.06 $29.90
Incumbent Worker Training for Business Partners
*Note: The data below is based upon new statutory language in act 199.
Fiscal Year
Employee Type # Onsite training
# Classroom Training
FY2015 Incumbent employee who upon completion of
training assumes a newly created position 2 0
Incumbent employee who upon completion
of training assumes a different position 0 0
Incumbent employee who is upgrading
their skills 21 155
Total: 23 155

Vermont Training Program Annual Report – Fiscal Year 2015 January 2016 | Agency of Commerce and Community Development
22
Incumbent Worker Training for Business Partners
*Note: The data below is based upon pre act 199. guidance.
Fiscal Year # Incumbent on the job training
# Incumbent Classroom
Total
FY2015 125 1000 1125
Notes:
The Vermont Training Program offers funding for two types of incumbent worker training: on-the-job and classroom training.
Median wage for incumbent employees trained through grants to partner businesses has been provided by the Vermont Department of Labor (VDOL) from VDOL’s Social Security Number data used to track wages of employees being trained.
Employer Size for Partner Businesses
Fiscal Year Number of
Grantees 0-19 Employees
Number of Grantees 20-99
Employees
Number of Grantees ≥100
Employees FY2013 5 19 8
FY2014 5 8 10
FY2015 3 18 6
Note: The table below indicates the new statutory guidance for employer
size based on act 199. For reference, we included the numbers above based
upon the old guidance.
Employer Size for Partner Businesses
Fiscal Year Number of
Grantees 0-19 Employees
Number of Grantees 20-49 Employees
Number of Grantees 50-99 Employees
Number of Grantees
≥100 Employees
FY2015 3 11 7 6
Note:
Employer size ranges were chosen based on the VDOL Bureau of Labor Statistics Employer Size Class ranges.

Vermont Training Program Annual Report – Fiscal Year 2015 January 2016 | Agency of Commerce and Community Development
23
GRANTS TO TRAINING PROVIDERS TRAINING
BREAKDOWN
Data reported in this section reflect only grants made to training providers.
Number of Vermont Employees Trained by Training Providers
Fiscal Year Total Number of Employees Trained
FY2013 2,014
FY2014 689
FY2015 1,865
Notes:
This is the total number of Vermont employees trained under grants to training providers.
Due to legislative changes in Act 199 (S. 220) a number of training provider grants were extended into FY15 to help ease the transition.
New Jobs Trained by Training Providers
Fiscal Year Number of New
Jobs Trained Average Cost Per
Employee Median Wage of
Employees
FY2013 N/A N/A N/A
FY2014 N/A N/A N/A
FY2015 N/A N/A N/A
Note:
Training provided through grants to training providers is geared to incumbent employees.

Vermont Training Program Annual Report – Fiscal Year 2015 January 2016 | Agency of Commerce and Community Development
24
*The chart below represents the key indicators that will be included based
upon new statutory language in act 199. There are two tables included; one
based upon pre act 199. Guidance and the other post act 199. guidance
Incumbent Worker Training from Training Provider Grants
Fiscal Year Number of Incumbent
Employees Trained
Average Cost Per Incumbent Employee
Median Wage of Employees
FY2013 2,014 $228.06 $19.11
FY2014 689 $248.67 $27.53
FY2015 1,865 $289.45 $29.34
Note:
Median wage for incumbent employees has been provided by the Vermont Department of Labor (VDOL) from VDOL’s FY15 Social Security Number data used to track wages of employees being trained
Incumbent Worker Training from Training Provider Grants
*Note: The data below is based upon new statutory language in act 199.
Fiscal Year
Employee Type # Onsite Training
# Classroom Training
FY2015
Incumbent employee who upon
completion of training assumes a newly
created position
0 0
Incumbent employee who upon
completion of training assumes a
different position
0 0
Incumbent employee who is upgrading
their skills 28 0
Total: 28 0
Incumbent Worker Training from Training Provider Grants
*Note: The data below is based upon pre act 199. guidance.
Fiscal Year Number of Incumbent
Employees Trained
Average Cost Per Incumbent Employee
Median Wages of Employees
FY2015 1837 $277.14 $29.34
Note: Training Providers report businesses that they provide training to through
Vermont training program funds.
Vermont Training Program Annual Report – Fiscal Year 2015 January 2016 | Agency of Commerce and Community Development
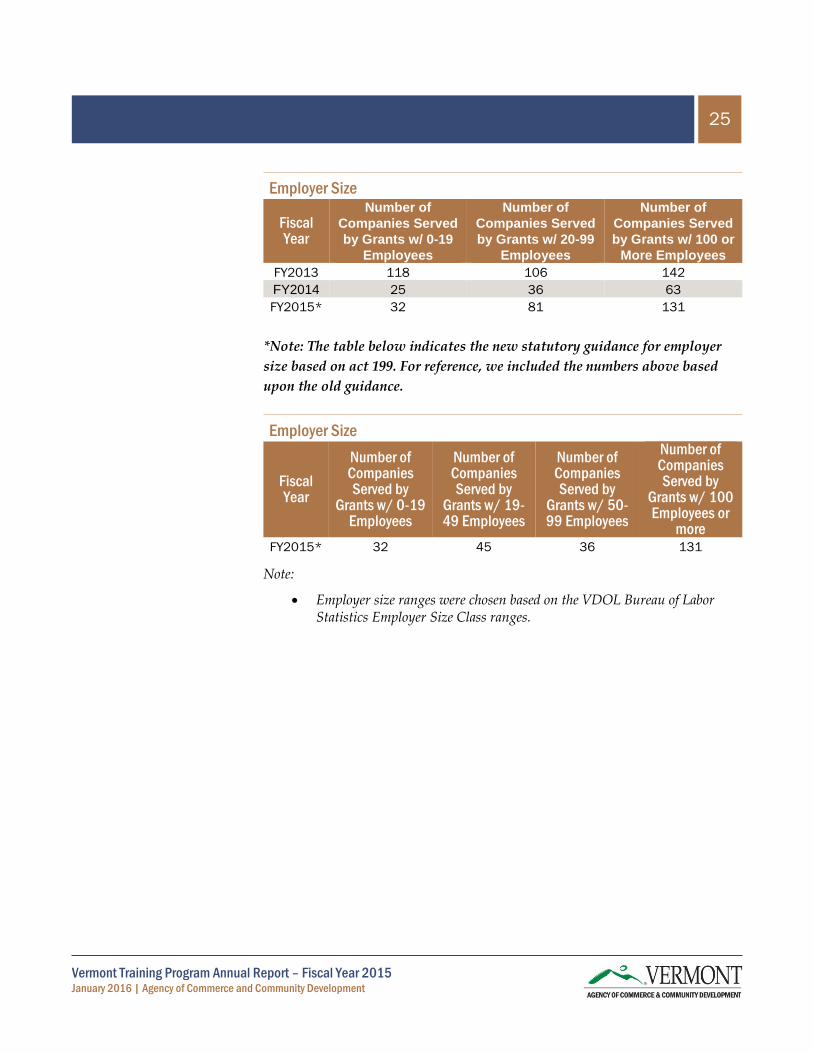
25
Employer Size
Fiscal Year
Number of
Companies Served
by Grants w/ 0-19
Employees
Number of
Companies Served
by Grants w/ 20-99
Employees
Number of
Companies Served
by Grants w/ 100 or
More Employees FY2013 118 106 142
FY2014 25 36 63
FY2015* 32 81 131
*Note: The table below indicates the new statutory guidance for employer
size based on act 199. For reference, we included the numbers above based
upon the old guidance.
Employer Size
Fiscal Year
Number of Companies Served by
Grants w/ 0-19 Employees
Number of Companies Served by
Grants w/ 19-49 Employees
Number of Companies Served by
Grants w/ 50-99 Employees
Number of Companies Served by
Grants w/ 100 Employees or
more FY2015* 32 45 36 131
Note:
Employer size ranges were chosen based on the VDOL Bureau of Labor Statistics Employer Size Class ranges.

Vermont Training Program Annual Report – Fiscal Year 2015 January 2016 | Agency of Commerce and Community Development
26
WAIVERS
In accordance with the provisions of 10 V.S.A. § 531(a,c,1):
…however, that in areas defined by the secretary of commerce and
community development in which the secretary finds that the rate of
unemployment is 50 percent greater than the average for the state, the
wage rate under this subsection may be set by the secretary at a rate no
less than one and one-half times the federal or state minimum wage,
whichever is greater;
There were no waivers awarded in fiscal year 2015
GRANTEE SURVEY
As part of the development of the Key Indicators the Vermont Department of
Labor and the Agency of Commerce and Community Development
developed a Customer Satisfaction Survey to gain further insight into the
value of the WETF and VTP grants. FY14 is the second year that the
Vermont Training Program surveyed its partner business grantees.
Grantees used the grant funds for a variety of strategic employee training
initiatives ranging from new hires to job retention. In the open ended
comments grantees spoke of using the funds to leverage their training
budgets in order to increase the number of employees or increase employee
skills in order to keep them competitive. Grantees also spoke highly of the
general service given by Vermont Training Program staff.
Number of Responses = 11

Vermont Training Program Annual Report – Fiscal Year 2015 January 2016 | Agency of Commerce and Community Development
27
In Whole or in part, due to the assistance of the Vermont Training Program funds, my organization:
0
1
2
3
4
5
6
7
8
Yes No
Has Created New Jobs
0
1
2
3
4
5
6
7
Yes No Too early to tell
Expects to create new jobs in the future
0 1 2 3 4 5 6 7 8 9
Yes
No
Too Early to tell
Increased overall business capability or has improved outlook for the future

Vermont Training Program Annual Report – Fiscal Year 2015 January 2016 | Agency of Commerce and Community Development
28
In Whole or in part, due to the assistance of the Vermont Training Program funds, my organization:
5
6
Please rate your overall satisfaction with the quality of service you recieved from VTP
Highly satisfied Satisfied Not satisfied
4
5
2
Ease of application
Highly satisfied Satisfied Not satisfied
6
5
Quality of Staff Assistance
Highly satisfied Satisfied Not satisfied
5
6
Timeliness of grant administration process
Highly satisfied Satisfied Not satisfied

Vermont Training Program Annual Report – Fiscal Year 2015 Agency of Commerce and Community Development
29
CONTACT INFORMATION
Agency of Commerce and Community Development
Patricia Moulton, Secretary
802.828.5204
Department of Economic Development
Joan Goldstein, Commissioner
802.272.2399
Vermont Training Program
John Young, Director of Workforce Development Programs
802.355.2725