vermont's changing forests - university of vermont
TRANSCRIPT

1
Vermont’s Changing ForestsKey Findings on the
Health of Forested Ecosystems from the Vermont Monitoring Cooperative
October 2009

VMC Staff Donnie Ager, Web & Data Assistant Lawrence Forcier, Principal Investigator Joanna Grossman, Web & Data Manager Mim Pendleton, Monitoring Technician & Site Operator Judy Rosovsky, Monitoring Assistant Carl Waite, Program Coordinator
2009 VMC Steering Committee Members Anne Archie, USDA Forest Service Douglas Lantagne, University of Vermont Ed O’Leary, Vermont Agency of Natural Resources Dennis May, USDA Forest Service Steve Roy, USDA Forest Service Robert Paquin, USDA Farm Service Agency Charles Scott, USDA Forest Service Steven Sinclair, Vermont Agency of Natural Resources Mary Watzin, University of Vermont 2009 VMC Advisory Committee Members Barbara Burns, Vermont Agency of Natural Resources Nancy Burt, USDA Forest Service Brian Keel, USDA Forest Service Bill Keeton, University of Vermont Jim Kellogg, Vermont Agency of Natural Resources Rich Poirot, Vermont Agency of Natural Resources Beverley Wemple, University of Vermont Deane Wang, University of Vermont Sandy Wilmot, Vermont Agency of Natural Resources
Vermont Monitoring CooperativeProviding the information needed to understand, manage, and protect Vermont’s forested ecosystems in a changing global environment.
The Vermont Monitoring Cooperative (VMC) was established in 1990. In 1996, a memorandum of understanding was signed by the Vermont Agency of Natural Resources, the University of Vermont, and USDA Forest Service. The partners agreed to work together to operate VMC to better coordinate and conduct long-term natural resource monitoring and research within Mount Mansfield State Forest, the Lye Brook Wilderness Area of the Green Mountain National Forest, and other relevant areas in Vermont.
The Vermont Monitoring Cooperative works in partnership with the USDA Forest Service State & Private Forestry as part of the Cooperative Lands Forest Health Management Program. The majority of VMC operations are handled by staff affiliated with the Rubenstein School of Environment and Natural Resources at the University of Vermont, the Vermont Department of Forests, Parks & Recreation in the Vermont Agency of Natural Resources, and the USDA Forest Service Green Mountain National Forest.
VMC Cooperators who participated in this project:
James S. Andrews, Vermont Reptile and Amphibian Atlas Project Lesley-Ann Dupigny-Giroux, University of Vermont Steve Faccio, Vermont Center for Ecostudies Jennifer Jenkins, University of Vermont William Keeton, University of Vermont Ron Kelley, Vermont Agency of Natural Resources Jim Kellogg, Vermont Agency of Natural Resources Trish Hanson, Vermont Agency of Natural Resources Kent McFarland, Vermont Center for Ecostudies Eric Miller, Ecosystems Research Group, Ltd. Heather Pembrook, Vermont Agency of Natural Resources Rich Poirot, Vermont Agency of Natural Resources Chris Rimmer, Vermont Center for Ecostudies Donald Ross, University of Vermont Jamie Shanley, U.S. Geological Survey Tom Simmons, Vermont Agency of Natural Resources Christopher Still, University of California, Santa Barbara Thomas Villars, Natural Resources Conservation Service Beverley Wemple, University of Vermont Sandy Wilmot, Vermont Agency of Natural Resources

Vermont Agency of Natural ResourcesUniversity of Vermont
United States Forest Service
Vermont’s Changing ForestsKey Findings on the
Health of Forested Ecosystems from the Vermont Monitoring Cooperative
October 2009

2
IntroductionMonitoring Vermont’s Forested Landscape
T he Vermont Monitoring Cooperative (VMC) was established in 1990 to track changes occurring in Vermont’s forests. Only limited information about the health and baseline conditions of forested ecosystems was available at that time. Vermont lacked the ability to perceive subtle changes in ecosystem condition over time and thus to be able to identify forces affecting forest ecosystem health and productivity. In addition, there was no dedicated, centralized, and stable location for storing, maintaining, and distributing important ecological data. VMC was envisioned and created to collect, assemble, and distribute high-quality, documented data and information to better understand environmental changes and their impacts on forested ecosystems. Understanding the interactive nature of environmental changes required ecosystem-scale, integrated, multi-disciplinary monitoring and research based on sound science. Those concepts lie at the heart of the Vermont Monitoring Cooperative’s existence. This report offers a sampling of the extraordinary amount of information VMC has assembled in its first 18 years. While VMC research focuses primarily on the health of Vermont’s forests, forest ecosystems are complex entities, affected by weather and climate, by natural and anthropogenic disturbances, and by the long reach of time. And everything in the forest relies on a web of connections, many of which are just now beginning to be understood. Consider the tiny, reclusive Bicknell’s thrush, a major topic of VMC research efforts. Living at the top of Vermont in our most isolated areas, the bird is nevertheless buffeted by climate change, which alters its habitat both in New England and its wintering grounds in the Caribbean; by atmospheric mercury pollution, which has found its way into its blood and feathers; and by the presence of happy skiers, who build trails ever higher on the sides of mountains. A goal of VMC is to learn how people can live side-by-side with the
thrush, the salamander, and the moose, using the manifold resources provided by Vermont forests, always with an eye toward a sustainable future. This report represents the written contributions of 19 cooperators, but collective efforts of dozens of researchers from varying backgrounds and disciplines working collaboratively to compile and tell the stories contained in this document. To the extent possible, the report is a
multidisciplinary synthesis. The majority of datasets in the VMC data library can be broadly characterized under the following section titles of this report: The Health of Our Forests, Weather and Climate in Vermont, and Monitoring Atmospheric Deposition. This report covers topics including the effects of land-use change on biodiversity, habitat and population levels of many animal species, as well as the effects of alpine development on the environment. It includes current trends in meteorological parameters such as air temperature, relative humidity, and cloud cover in the Champlain Valley and Vermont. Also discussed are current conditions and recent trends relating to atmospheric deposition, including transport, acidification of lakes and streams, ozone, and mercury in
the environment. Also explored are factors influencing forest health, diversity, structure, productivity, and forests’ ability to store carbon to help mitigate the effects of greenhouse gas accumulation in the atmosphere. The information in this report is intended as an introduction to the body of research that has been amassed over time, and which is growing daily. Numerous scientific papers have been published using VMC data, some of which are referenced here. We have tried to highlight successes where VMC data have influenced state, regional, or national policy or where research results have helped alter the behavior of would-be polluters. As an organization, VMC believes that it has an important and timely story to tell.
In This Report:
The Health of Our Forests / 7
Weather and Climate in Vermont / 20
Atmospheric Deposition / 29
Selected VMC Projects / 38
Resources / 39

3
A Brief History of the Vermont Monitoring Cooperative A major Vermont Forest Health Task Force assembled by then-Governor Madeleine Kunin determined that Vermont needed to continuously monitor forest health and important environmental variables. In 1990, there were very few models on which to build a statewide monitoring and research program. That year, through the efforts of Vermont Senator Patrick Leahy and his staff, the U.S. Congress appropriated $250,000 for the establishment of VMC. Leaders of the three founding organizations—the Vermont Agency of Natural Resources, the University of Vermont, and the U.S. Department of Agriculture Forest Service—agreed to jointly form, nurture, and administer VMC as a long-term natural resource monitoring program. VMC prided itself on a collaborative approach to organization and administration, in both its daily operations and its longer-term monitoring initiatives. VMC encouraged and embraced involvement and guidance from caring and knowledgeable individuals working outside of the immediate partner organizations. In 1996, the three founding partners signed a formal memorandum of understanding in which they agreed to work together to operate VMC with the goal to better coordinate and conduct long-term ecological monitoring and research within the Mt. Mansfield State Forest, the Lye Brook Wilderness Area of the Green Mountain National Forest, and other relevant areas in Vermont. In the process of developing the memorandum, the broad and efficient involvement of many Vermonters and other professionals was recognized as an important outcome of this phase of the Vermont Monitoring Cooperative, and an element that should be promoted as VMC continued to evolve. VMC’s mission is: “To provide the information needed to understand, manage, and protect Vermont’s forested ecosystems within a changing global environment.” VMC seeks to serve Vermont through improved understanding of annual conditions, long-term trends, and interrelationships of the physical, chemical, and biological components of forested ecosystems by collecting and disseminating Vermont environmental data. VMC also promotes the efficient communication and coordination of multi-disciplinary environmental monitoring and research activities among federal, state, university, and private entities with common interests in the long-term health, management, and protection of Vermont’s forests. VMC has become an important database and information management service for Vermont’s study of forest ecosystems and environmental quality. The VMC data library contains 300 research and monitoring projects and datasets, collected over nearly two decades by dozens of cooperators on a wide array of environmental topics (see page 38 for a sampling of VMC projects and datasets; a more complete listing can be found at the VMC web site: www.uvm.edu/vmc). VMC’s cooperators range from undergraduate and graduate students doing research for class projects and theses to university, state, federal, and private-sector research and monitoring scientists. Through VMC, all results are assembled in a collaborative effort to advance knowledge and understanding of the environment and Vermont’s forests. VMC data and information resources are used by students, natural-resources managers, scientists, lay citizens, and policy makers. VMC accomplishes its mission through a small professional staff, many other committed professionals and volunteers, contemporary data management systems, education and outreach programs, and continuing efforts to support and help coordinate Vermont’s environmental data interests. VMC continually upgrades its data services to provide the best data quality and accessibility possible.
VMC’s mission: To provide the information needed to understand, manage, and protect Vermont’s forested ecosystems within a changing global environment.
VMC cooperators have conducted research on Vermont forests for 18 years, amassing a wealth of long-term data.

4
A Steering Committee, whose members represent the three founding partner organizations, guides the planning, administration, and policy development for VMC. An Advisory Committee, with members from Vermont’s scientific research, monitoring, and resource-management communities, helps inform decisions about operations, funding, and support needs for research and monitoring projects, and advises on direction for the organization in general. Mount Mansfield was the first of two study sites selected by VMC for intensive forest ecosystem monitoring and research (Figure 1). This site comprises over 5,500 acres of state and university-owned land located between 1,300 and 4,300 feet in elevation. It includes three watersheds, northern hardwoods and montane spruce-fir forest types, as well as an alpine ecosystem. VMC utilizes on-site laboratory facilities at the University of Vermont’s Proctor Maple Research Center (PMRC). At PMRC, VMC operates field collection sites for the National Atmospheric Deposition Program (NADP)/National Trends Network, NADP/Atmospheric Integrated Research Monitoring Network, NADP/Mercury Deposition Network, U.S. Department of Agriculture UV-B Monitoring and Research Program, and the Vermont Acid Precipitation Monitoring Program. Other VMC facilities and infrastructure include a 66-foot walkup canopy tower; the longest continually operating wet atmospheric mercury monitoring station that we are aware of in the world; five meteorological stations; three stream-gage stations; and a remotely accessed soil climate station. The Vermont Air Pollution Control Division also operates a co-located air quality monitoring station at PMRC. The Lye Brook Wilderness Area, the second VMC intensive study site, provides a southern Vermont complement to Mount Mansfield. It encompasses 15,000 acres of Green Mountain National Forest land, ranges in elevation from 900 to 2,900 feet, and supports northern-hardwood, spruce-fir, and paper-birch forests. The Lye Brook area’s surface waters identify it as being sensitive to acid deposition. Lye Brook supports a remotely accessed atmospheric monitoring station (ozone, wet and dry deposition, and meteorology), air visibility monitoring, and a soil climate station. VMC data collected and archived during the past 18 years have made significant contributions toward our knowledge about climate change, land-use fragmentation, and threats from insects, diseases, invasive plants, and air pollution. VMC data have been used in Vermont to determine the best time to spray for forest tent caterpillars in order to protect economically and ecologically important sugar maple trees, while minimizing the negative effects on the endangered Indiana bat. Data collected by herpetologists tell us that while numbers of the smooth greensnake may be declining in Vermont, the only viable population of the North American racer may have already disappeared within the last two years. VMC researchers found that Bicknell’s thrush tend to avoid crossing open areas such as open ski trails and that male thrushes may be more vulnerable to predation when crossing these open areas.
Mount Mansfield
Lye Brook
Figure 1: The major VMC study sites at Mt. Mansfield and Lye Brook Wilderness Area, indicated by dots, are shown here within the context of the biophysical regions of Vermont.
Source: Sandy Wilmot and Beverley Wemple

5
VMC-supported projects have shown that high-elevation developments increase annual water, sediment, and chloride yields over undeveloped watersheds. Also, we now know that, on average, sugar maple budbreak is three days earlier and leaf-out five days earlier this decade than in the 1990s; the 2008 budbreak was 12 days earlier and leaf-out was nine days earlier than the baseline. A map of forest soil carbon assembled by VMC researchers which shows areas of high or low carbon may suggest future guidelines for managing soil carbon. In a 2007 lawsuit filed by the U.S. Environmental Protection Agency and eight northeastern states against a large midwestern utility company, data from PMRC in Underhill helped provide compelling evidence that the company was keeping outdated power plants in service to avoid the costs of producing cleaner power; in an out-of-court settlement, the company agreed to spend $4.6 billion to retrofit several old power plants. Because of the pioneering work done by VMC cooperators, Vermont is a strong candidate for a role as a pilot site in an anticipated national mercury biomonitoring network. The Underhill monitoring site known as VT99 was recently selected and funded by EPA as one of the initial sites in the new NADP/Mercury Trends Network. The work of VMC has helped Vermont’s leadership role on the national stage in certain environmental issues. During the potentially uncertain times brought about by climate change, continuing threats from air pollution, and changes in land use both locally and nationally, it is more important than ever to support monitoring of environmental variables and conditions and to efficiently and effectively share scientifically robust data among scientists, resource managers, policy makers, and the public in an unselfish spirit of cooperation. Ecosystem health is an essential element to achieve sustainability. The need for useful indicators of forest ecosystem health recognized by Vermont and federal leaders 20 years ago is even more important in 2009.
8
7
6
5
4
3
2
1
0
1989
Hermit Thrush Decline
1990 1991
1992 1993
1994 1995
1996 1997
1998 1999
2000
2001 2002
2003 2004
2005 2006
Annu
al In
dex
Annual Trend = -6.3% (SE 0.024)
P = 0.011
The State of Vermont’s State Bird: Hermit Thrush Decline
R
Figure 2: Populations of hermit thrush have declined by 6.3 percent annually at more than two dozen VMC study sites.
Source: FBMP
esults from the VMC-supported Vermont Forest Bird Monitoring Program (FBMP) indicate that Vermont’s state bird, the hermit thrush, declined by an average of 6.3 percent annually between 1989 and 2006 (Figure 2). FBMP monitors breeding birds at more than two dozen forested study sites throughout the state, including sites at Mt. Mansfield and Lye Brook. Several factors may have contributed to this long-term decline, including habitat alterations from deer overbrowse, soil calcium depletion
due to acid rain, and habitat loss, especially on the bird’s southeastern U.S. wintering grounds.
n Hermit Thrush
During the potentially uncertain times brought about by climate change, continuing threats from air pollution, and changes in land use both locally and nationally, it is more important than ever to support monitoring of environmental variables and conditions.

6
Figure 3: More than 80 percent of Vermont’s forests are privately owned.
Source: Adapted from Wharton et al. 2003
The Landscape Over Time
T
Distribution of Timberland Area by Ownership
Individuals: 63%
Federal: 6%
Other Public: 8%
Forest Industry: 6%
Farmers: 6%
Corporations: 11%
he history of the Vermont landscape is marked by the influence of geologic forces that gave rise to the state’s mountains over 400 million years ago and climatic forces that have produced dramatic changes in environmental conditions. Roughly 11,000 years ago, glacial ice that had extended over the state for nearly two million years began to retreat and trees began to appear on a landscape stripped bare of vegetation. These earliest forests were dominated by black spruce and paper birch. Animal communities became established in new habitats made available in the emerging forests. As the climate warmed, tundra vegetation retreated to only the state’s highest peaks, while spruce and fir dominated the higher elevations and northern mountains. Lower elevations came to be dominated by eastern white pine, maple, birch, hemlock, beech, oak, and hickory, creating today’s mosaic of the mixed northern hardwood forest. Today forests cover roughly 4.6 million acres or roughly 78 percent of the state (Wharton et al. 2003). The current predominance of young to mature forests is an artifact of 19th-century clearing, subsequent land abandonment, and secondary forest redevelopment on old-fields. With these changes have come shifts in the types of ecosystem services provided by forested landscapes. For example, young to mature northern hardwood forests provide less desirable habitats for late-successional wildlife species, lower levels of biomass and associated carbon storage, and less dramatic effects on aquatic habitat structure in forest streams (Keeton et al. 2007). On the other hand, a young, maturing forest has higher growth rates, providing opportunities for sustained yield timber production. In addition, open lands and young forests provide abundant habitats for early-successional species, some of which are now declining due to forest redevelopment. Compared to the primary (or never cleared) forest systems, the secondary forests that have recovered across Vermont’s landscape tend to have less complex canopies, lower densities of large trees (both live and dead), lower volumes and densities of downed logs, smaller canopy gaps, and less horizontal variation in stand density (McGee 1999, Keeton et al. 2007). At larger scales, our land-use and forest-management history has converted landscapes with complex patch mosaics, which are shaped by wind and other disturbances, to simpler configurations. Forest patches are now less diverse in size and less complex in shape (Mladenoff and Pastor 1993). The relative abundance of dominant tree species has also shifted as a result of land-use history (Cogbill et al. 2002). As we evaluate the current conditions and trends in forest ecosystem health indicators, we need to keep in mind that land-use history has profoundly shaped our current forested landscape. Modern changes to the Vermont landscape accompany dramatic changes in the state’s population over the last few decades. The population boom in the United States following the Second World War did not reach Vermont until later, with a 14 percent population growth in the 1960s and a 15 percent growth in the 1970s, and rates slowing to 10 percent or less in more recent decades. With this population growth, came a change in urbanized land, which has grown by roughly 20 percent since 1960. Nearly one-third of urbanized land has come from conversion of agricultural land and nearly two-thirds from conversion of forest land. Although much of this population and development pressure has been focused in the Champlain Valley and more populous towns of the state, a significant feature of Vermont’s recent growth has been a growth in recreational development and second homes in Vermont’s resort towns. Demographic changes and pressures associated with property taxation have led to changes in land ownership and increased parcelization of forest land across the state. Today, more than 80 percent of Vermont’s forests are privately owned (Figure 3). These changes in population, land ownership, and land use have important implications for forest ecosystem health. A 1999 EPA report estimates a loss of approximately 35 percent of our wetlands since European settlement, with more recent annual losses of 200 to 400 acres per year (EPA 1999). Undeveloped land provides valuable ecosystem services. Degradation, fragmentation, or loss of these natural systems adversely impacts forest ecosystem health and compromises the ability of forests to provide habitat, clean water, pure air, and other critical resources upon which we rely.
7
istorically forests were considered healthy simply if they supported an abundance of healthy trees. In a broader context, forests are ecosystems supporting many organisms in addition to trees, and whose functions are more inclusive than just human exploitation of its resources. Forest ecosystems provide services to humans without which we could not live. They purify our air by capturing pollutants. They provide shade and windbreaks that regulate and moderate temperatures. They protect waters by purifying and keeping them cool. When storms come, they mitigate the impacts from flooding. They capture nutrients from the air, and renew soil fertility. Tree roots adhere to soils and prevent major soil erosion and sediments leaching into streams and lakes. Forests provide habitats for game and nongame animals, harbor natural control agents against pests, provide resilience from disturbances. And they allow humans to benefit economically from recreation, aesthetics, wood harvesting and other forest products. A healthy forest ensures the provision of these ecosystem services. A healthy forest system is also dynamic in response to natural climate variability, disturbances, and succession. But changes in structure or function outside the historical range of variability may signal stress. Recent international agreements known as the Montreal Process Criteria and Indicators of Forest Sustainability have formed a foundation for describing and measuring forest sustainability across the landscape. Five of these indicators pertain to forest ecosystem health: biodiversity, productivity, soil and water resources, carbon cycles, and disturbances. These provide a framework for describing current conditions and trends in forest ecosystem health with particular focus on studies by the Vermont Monitoring Cooperative (VMC).
THE HEALTH OF OUR FORESTS
H Biodiversity Biodiversity encompasses not only the composition of species, but also the complexity of structural features within a forest stand and across landscapes. Vermont hillsides are a patchwork of forests with trees of various sizes and ages. This diversity of tree sizes and ages makes forests adaptable, dynamic, better situated to recover from disturbance, and also provides a broader range of habitats for other organisms. One advisory group of Vermont foresters and ecologists suggested that a healthy proportion of tree sizes in a mature forest would be approximately 50 percent saplings, 30 percent pole-sized trees, and 20 percent sawtimber-sized trees (VTFPR 1999). Two time periods of statewide forest inventory data show an increasing proportion of trees in the smaller tree category (Figure 4). Special characteristics of forests can make them suitable as habitat for animal species. Vernal pools, caves, coarse woody material, and legacy trees are examples of unique structural elements that provide habitat for animals and allow greater potential diversity. When animal survey data are not available, habitat measures can be used as predictors of potential species diversity. VMC data have been valuable in building connections between animal-species diversity and habitat features. Among other examples of this data are VMC’s forest bird survey and moth-host plant database, both of which are discussed in this report.
Composition of Tree Sizes in Vermont Forests
80
60
40
20
024.3
8.219.1
7.9
1983 1997
67.5 73
Figure 4: Studies in 1983 and 1997 show an increasing percentage of Vermont trees are in smaller-size categories.
Source: VTFPR 1999

8
Non-native Pests and Invasive Plants
ermont has been subject to many introductions of exotic insect and disease organisms that have caused damage to forests (Table 1). Some organisms have ecosystem-altering effects, such as those responsible for Dutch elm disease and chestnut blight. In other cases the impacts are slower, offering opportunities to develop management strategies to mitigate impacts. VMC has been instrumental in providing ongoing detailed information on non-native organisms, such as pear thrips, gypsy moths, and beech bark disease, which are now well established in Vermont, and has helped in understanding relationships between these pests and environmental factors. For example, pear thrips have been found to cause more damage when cold weather slows the development of sugar maple leaves. Other non-native insects are moving toward Vermont, and could cause significant ecological effects. These include the emerald ash borer, with new finds in Quebec; the Asian long horned beetle, a maple pest now in Worcester, MA; and the hemlock woolly adelgid, now in forests in southeastern Vermont. Long-term monitoring by VMC provides baseline data which will help assess the impact of these insects on host species and associated organisms. Invasive non-native plants, such as barberry, buckthorn, and honeysuckle, continue to expand northward in Vermont forests, causing negative impacts on biodiversity and forest regeneration. Forest monitoring plots, such as those measured at the VMC research sites, provide a mechanism to survey trends in invasive plants and their long-term effects on forest health. The North American Maple Project survey results highlight the growing incidence of invasive plant species in forests across Vermont (Figure 5). At the VMC sites at Mt. Mansfield and Lye Brook, which are more removed from residential areas and their associated plantings of non-native plants,no exotic invasive plants were found in a 2005 survey at 20 monitoring plots.
Table 1: This list indicates the status of non-native insects and diseases in Vermont. Source:VTFPR
60
50
40
30
20
10
0
Barberry Buckthorn Honeysuckle Multiflora Rose
Non-native Invasive Plant Species
Pres
ence
on
Plot
s (%
)
Figure 5: There is a growing incidence of non-native invasive plant species on monitoring plots statewide.
Source: North American Maple Project
V
Non-native forest insects Status in Vermont Japanese beetle Popillia japonica Established Elm leaf beetle Pyrrhalta luteola Established Pine shoot beetle Tomicus piniperda Recently detected Eastern spruce gall adelgid Adelges abietis Established Balsam woolly adelgid Adelges piceae Established Hemlock woolly adelgid Adelges tsugae Recently detected Beech scale Cryptococcus fagisuga Established Introduced pine sawfly Diprion similis Established Birch leafminer Fenusa pusilla Established European spruce sawfly Gilpinia hercyniae Established Mountain-ash sawfly Pristiphora geniculata Established Larch casebearer Coleophora laricella Established Gypsy moth Lymantria dispar Established Pear thrips Taeniothrips inconsequens Established Introduced basswood thrips Thrips calcaratus Established Sirex wood wasp Sirex noctilio Recently detected Emerald ash borer Agrilus planipennis Not detected Asian long horned beetle Anoplophora glabripennis Not detected Non-native forest diseases Scleroderris canker Ascocalyx abietina Established Chestnut blight Cryphonectria parasitica Established White pine blister rust Cronartium ribicola Established Dogwood anthracnose Discula destructive Established Beech bark disease Nectria coccinea Established Dutch elm disease Ophiostoma ulmi Established Butternut canker Sirococcus clavigignenti-juglandacearum Established Sudden oak death Phytophthora ramorum Not detected

9
Vermont is estimated to be home to 441 species of birds, mammals, amphibians, and reptiles. A majority of these species are dependent on forests for all or part of their life cycles. As we struggle to balance procurement of forest products with conservation of wildlife, new models of forest management are emerging that protect specific “focus” animal species. At VMC research sites, we have documented many forested species and their associated habitat requirements. Biodiversity audits can help assess the relative environmental impacts of various forestry and land-development practices and of climate change. While biodiversity in communities is often seen as desirable, it is important to remember that some ecosystems, such as in bogs or sandplains, may have relatively low diversity but harbor highly valued species that are unusual from a regional perspective.
Insect Diversity
While the enormous diversity and sheer numbers of insects excites entomologists, the general public is familiar with only a relatively few species that have economic or health impacts. Comparatively little or nothing is known about other insects. Insects comprise over two-thirds of the approximately 2 million known species of living things on the earth, and millions more species remain to be discovered. There are about as many species of butterflies and moths on Mt. Mansfield as there are breeding bird species in all of Canada! There are currently known to be approximately 2,000 species of butterflies and moths (Lepidoptera) in Vermont, which reflects the great variety of habitats found here. The long, varied, and sometimes arduous work that has produced this number involves methodical field procedures combined with meticulous record-keeping. Additionally, existing curated insect collections have been an invaluable source of baseline environmental data, with each specimen vouching for the historical occurrence of a species at a particular time and place. Collectively, this information allows us to retroactively track local arrivals and extinctions of various species, and frames the study of the effects of human disturbance and climate change. For several years in the 1990s, and again a decade later, Lepidoptera were surveyed at three elevations on VMC sites on Mt. Mansfield. These efforts resulted in a count of close to 400 butterfly and moth species. In the food-web, Lepidoptera larvae are a primary food source during the nesting periods of the majority of birds that breed in Vermont. What can insect communities tell us about the relative ecological health of an area? Among other things, insects have roles in forests as pollinators, decomposers of leaf litter, and as prey for breeding birds. Documenting the insect species living in a given habitat, along with their immediate networks of organisms, brings us closer to evaluating the health of that natural community. Monitoring indicator species may shed light on the vigor of a natural habitat. For example, we know that the aquatic larvae of certain species of black fly are associated with clean water, or that given species of springtails occur within a specific pH range.
Productivity Forest productivity, usually thought of as growth and abundance, is an endpoint of many functional processes of forests that in one way or another contribute to growth. Measures of forest processes include plant growth (biomass), reproductive success, timing of developmental stages (phenology), and nutrient dynamics in air, biota, soil, and water. Forest biomass is a measure of the effectiveness of the photosynthetic process. When growth exceeds mortality, biomass accumulation increases. But if disturbances impact the balance of growth to mortality, biomass accumulation decreases. At VMC’s Mt. Mansfield site, there has been a decrease in above-ground live tree biomass on the east slope and summit since 1997 (Figure 6), evidence of the impacts from a variety of stress events on forest productivity. These events included the ice storm in January 1998 followed by excessive moisture in the summer of 1998 and marked drought in 1999.
There are as many species of butterflies and moths on Mt. Mansfield as there are breeding bird species in all of Canada.
Atlantis fritillary

10
The timing of developmental stages provides a baseline for comparing annual changes and allows evaluation of stress impacts on functional processes of plants and animals. When managing forest pests, the timing of developmental stages of pest and host is essential (see page 23 for a discussion of phenology monitoring).
Soil and Water Resources The soils supporting forests play a crucial role in forest health, providing a myriad of services ranging from nutrient recycling to physical support. Characteristics important to forest health include soil texture, drainage, depth, and fertility. With the exception of soil fertility, these soil characteristics don’t change significantly over time. Tunbridge soils are typical of Vermont uplands, and not surprisingly support the majority of northern hardwood forests (Table 2). Depth to bedrock or hardpan and soil drainage affect root growth and availability of soil moisture, and determine areas that will be most affected by droughts. Forest lands have been altered through time for a wide variety of uses, and not all forests are growing in sites that represent their ideal growing conditions. Soil-nutrient availability is a common measure of forest health, and where soil pH, base cations, or aluminum concentrations are abnormal, ecological impacts can occur (see page 34 on critical loads). VMC supports a program of research and long-term monitoring of streamflow and water quality dynamics of high-elevation forested streams within the Lye Brook Wilderness Area and on the slopes of Mt. Mansfield. These studies have shown that both the flow of water and concentration of some solutes such as nitrate are highest during snowmelt. As a result, most of the annual loss of these solutes from forest to stream system is found during a relatively short time period in the spring. This ongoing VMC monitoring will aid the detection of environmental change due to changing climate and high-elevation development such as ski resorts.
Carbon Cycles One of the major greenhouse gases is atmospheric carbon in the form of carbon dioxide. Through photosynthesis, CO2 is removed from the air by trees and forest plants, and stored as carbon in roots, stems, and foliage. Forests play a huge role in carbon dioxide mitigation in Vermont, so knowledge of current carbon storage and release is essential to learning how to better manage our carbon budget. Carbon can be stored for long time periods in live tree biomass, below ground in roots, in soils, and in trees harvested for durable wood products. Vermont forests are being considered for future policies aimed at sequestration of additional carbon emissions in attempts to reduce our carbon footprint. In calculating carbon sequestration, researchers must consider a variety of complex factors, including amount of carbon stored in forests, rate of carbon accumulation, amount of biomass extracted for fuel, biomass used for durable wood products, impacts of forest management on above- and below-ground forest carbon, and disturbances such as insect defoliation.
160
140
120
100
80
60
40
20
0
Biom
ass
(Mg/
ha)
East West Summit
Above-ground Live Tree Biomass
Years
1993
1997
2001
2005
Natural Community Type Soil Name
Northern Hardwoods Tunbridge Cabot Berkshire Lyman Peru Marlow
Rich Northern Hardwoods Buckland Vershire Dutchess Oak-hickory Georgia Stockbridge Paxton Pittsfield
Table 2: Common soil series associated with some of Vermont’s forest communities, in order of importance.
Source: Report by the Governor’s Task Force on Climate Change, 2007
Figure 6: At VMC’s Mt. Mansfield site, there has been a decrease in above-ground live tree biomass on the east slope and summit since 1997.

11
Greenhouse Gas Mitigation
R apidly developing domestic and international carbon markets recognize three general possibilities for forest carbon management. These are reforestation/afforestation, avoided deforestation, and improved forest management (Ruddell et al. 2007). The latter is concerned with the carbon stored in managed forests, and focuses on the concept of “additionality” or the potential for increasing net carbon storage over a baseline level. But this has proved challenging for scientists and forest managers alike, particularly because of the complex carbon accounting required to determine the net effects of a particular management approach (Ray et al. 2009). Actively managed forests provide carbon sequestration benefits both within the forest ecosystem and in harvested wood products. Biomass fuel produced as a by product of forest management activities can help offset greenhouse gas emissions from fossil fuels. Ongoing research is exploring how to design forest management strategies that optimize storage among these sinks. Rapidly growing, younger or well spaced forest stands may have higher rates of carbon uptake, but they have lower biomass per unit area compared to older or less intensively managed forests (Figure 7), and thus actually store less carbon than high biomass forests with lower or stable rates of carbon uptake (Harmon and Marks 2002). Research has shown that as forests age they store more carbon, due to very high levels of accumulated above and belowground biomass (Keeton et al. 2007; Luyssaert et al. 2008). Forested landscapes recovering toward an older, higher biomass condition will store much higher quantities of carbon than landscapes dominated by young to mature hardwood forests (Rhemtullaa et al. 2009). Different management approaches (frequency and intensity) result in different
amounts of average carbon storage over the long term. Thus the choice of harvesting approach directly affects not only emissions offsets but also long-term carbon storage dynamics. Research at UVM by VMC cooperators has used simulation modeling to examine the impact of harvesting frequency and proportion of post-harvest structural retention on carbon storage and the significance of including harvested wood products in carbon accounting (Nunery and Keeton, in review). Carbon dynamics were simulated under nine forest management scenarios, spanning a range of increasing structural retention and decreasing harvesting frequencies, including “no harvest.” The simulations incorporated carbon flux between aboveground forest biomass (dead and live pools) and harvested wood products. The results suggest that intensified regeneration cutting reduces net carbon storage. Conversely, extended rotations or entry cycles, high levels of post-harvest retention, and practices favoring production of durable wood products enhance average storage over multiple rotations or entry cycles. The highest levels of storage are actually achieved by passive management, even factoring in the foregone storage in wood products. These conclusions are valid only so long as the analysis does not include the greenhouse gas emissions that would result from substituting non-wood construction materials for wood if production of the latter were reduced. Other work has shown that factoring in “substitution effects” can make some intensive management scenarios comparable to the least intensive in terms of net carbon sequestration, depending on the assumptions built into the analysis (Malmsheimer et al. 2008).
Tota
l Car
bon
Stor
ed
Stand Development Over Time
Figure 7: This figure shows carbon sequestration and storage in relation to forest stand development. Note that the highest rates of uptake occur in early to mid stages of development, but the greatest levels of storage are achieved late in development, resulting in a substantial carbon reservoir.
Source: Jared Nunery and Bill Keeton, UVM

12
The estimated annual, statewide accumulation of CO2 in forests is 9.63 million metric tons of carbon dioxide equivalent) (Table 3). Keep in mind that in 1990, Vermont CO2 emissions were 8.1 million metric tons, and by 2005 had increased to 9.1. Without emission-reduction policies, emissions could grow to 10.67 million metric tons by 2030, beyond forest-sequestration rates.
The two major carbon pools in forests are live trees and soil. Forests that continue to increase live tree biomass are considered sinks for atmospheric carbon. When the rate of sequestration decreases to a point where net growth is less than mortality and decomposition, such as in areas of forest decline, forests become a source of carbon dioxide emission. The VMC plot data shows that some locations on Mount Mansfield may currently be a source of carbon dioxide emissions, due to drought-induced mortality and a trend toward decreasing biomass. This, however, could be reversed as existing trees grow and new trees replace dead trees. Soil carbon is less well studied. Vermont estimates may be low because temperate forests are estimated to store nearly double that of above-ground vegetation. Most of the soil carbon in Vermont is organic carbon, allowing estimates of soil carbon based on organic matter content. VMC researchers assembled a map of forest soil carbon for Vermont (Figure 8); areas of high or low carbon may suggest future guidelines for managing soil carbon.
Disturbances Forest health monitoring measures the ability of trees to recover from damages inflicted by natural and anthropogenic disturbances. Natural disturbances are an ecologically important and intrinsic part of Vermont’s forested ecosystems. They shape the types, quantities, and spatial distributions of habitats and strongly influence successional processes. In contemporary ecology, natural disturbances are viewed as a “subsidy” to the system, creating critical habitat structures and driving a host of ecological processes, including soil and nutrient turnover, organic matter recruitment into streams, and carbon storage dynamics. But when disturbance dynamics are perturbed by humans (for example, when people’s actions contribute to severe flooding or large-scale insect outbreaks), then deleterious stress can be induced. Disturbances also interact with human-induced stressors, such as acid deposition and climate change, in determining trajectories of forest ecosystem change (North and Keeton 2008).
Vermont Forests Stored Carbon Annual (MMt) Accumulation of CO2 (MMt)
Soil 139 0.7 Forest floor 45.7 0.5 Down dead 12.2 0.4 Understory 3.2 0.03 Standing dead 11.4 0.3 Live trees 172.2 6.3 Wood products 1.4
Total 383.7 9.63
Table 3: Estimates of carbon stored in Vermont forests and the annual removal of CO
2 from the atmosphere
through forest sequestration.
Figure 8: This map of forest soil carbon in Vermont, assembled by VMC researchers, may help develop guidelines for managing forest carbon in the future.
Source:Wilmot et al. 2008
Vermont Forest Soil Carbon

13
A variety of natural disturbance agents, including wind, ice, insects, fungal pathogens, beavers, floods, and fire, have sculpted our forested landscapes for centuries. Events that create gaps in the canopy are the most common type of disturbance in Vermont’s forests. Disturbance gaps usually involve death or damage to individual or small groups of trees. Depending on size and orientation, gaps can result in regeneration of intermediate to shade tolerant species, release of advanced regeneration, or competitive release and accelerated growth in proximate overstory trees. In 1985, surveys of Vermont’s hardwood resources showed nearly 14,000 acres of dead trees (Figure 9). Although subsequent resurveys showed that acres of dead trees decreased and percent of healthy trees improved to 90 percent or better, concern about sugar maple tree health across the region—caused potentially by impacts of acid deposition and the ill effects of tapping trees for maple syrup production—led to the establishment of a Canada-United States sugar maple health monitoring program (NAMP). In Vermont, one of the monitoring sites was at the base
of Mount Mansfield. Sugar maple health monitoring has provided solid information on trends in stress events and recovery for this prominent tree in Vermont forests. While initially this survey showed areas of tree decline, with only 81 percent of sugar maples in Vermont plots considered healthy, tree health improved in the early 1990s (Figure 10). Tree health dipped again in recent years following an outbreak of forest tent caterpillar. In 1990, a systematic forest health detection program started in New England and grew to become the national Forest Health Monitoring program, aimed at detecting emerging regionally significant forest health problems. We have adopted key ecosystem methods from this program for use on many of our VMC monitoring plots. VMC provided a unique opportunity to co-locate these forest health
measurements with those of atmospheric, weather, wildlife, water, and soils conditions, which has improved our understanding of relationships among environmental changes, forest health, and ecological dynamics (see Ozone, page 36).
A massive ice storm in 1998 devastated large portions of Vermont’s forests.
17,500
14,000
10,500
7,000
3,500
01985 1990 1995 2000
Acres of Hardwood Mortality in Vermont
Year
Figure 9: In 1985, a survey of Vermont’s hardwood resources showed nearly 14,000 acres of dead trees. In later years this acreage decreased dramatically.
Source: Kelley et al. 2002
25
20
15
10
5
0
Sugar Maple Health
Average %
1988 1989 1990 1991 1992 1993 1994 1995 1996 1997 1998 1999 2000 2001 2002 2003 2004 2005 2006 2007
Dieback
Foliage Transparency
Mortality
Figure 10: Sugar maple health monitoring has provided long-term information on trends in stress events and recovery. While initially only 81 percent of sugar maples were healthy, tree health improved in the early 1990s.
Source: Vermont Plots, NAMP
Forest tent caterpillar

14
Precipitation is one of the key drivers of forest health, both directly and indirectly. Trees need adequate moisture for growth, but low precipitation has also been correlated with rising populations of insect defoliators. Periods of poor sugar maple tree health have corresponded with below-normal precipitation over the past two decades. Following the 1999 and 2001 droughts, forest tent caterpillar populations exploded, resulting in extensive defoliation. Stress from a variety of disturbances has affected sugar maple health at Mt. Mansfield and around Vermont as seen in the percent of trees with thinner than normal foliage (Figure 11). Monitoring has been instrumental in determining thresholds for tree recovery. Periods of stress often lead to crown dieback, but trees have the ability to recover if the stresses abate. Fertile sites high in calcium tend to recover more quickly. This ability also varies with species. Sugar maple is good at recovering; yellow birch has a moderate ability to recover, but paper birch has poor stress recovery. This information has helped forest managers determine how and when to thin forests to maintain healthy, vigorous trees, and was especially helpful in salvage cutting following the destruction from the 1998 ice storm (Kelley et al. 2002). Tree recovery at VMC sites has followed this same trend; sugar maple recovery from the ice storm and from forest tent caterpillar defoliation has been good, but white birch recovery from ice damage and drought has not been as successful. At the VMC study sites, weather factors play a significant role in shaping the growing conditions of forests. Mt. Mansfield has elevations ranging from 1,300 to 4,300 feet and Lye Brook Wilderness Area peaks at nearly 3,000 feet. Winter storms are severe, with high winds and ice covering trees. Soils are quite shallow in portions of upper elevation forests. Also, air at these upper elevations is laden with high amounts of acidic compounds, ozone, and mercury. So monitoring the health of these forests can show the most extreme forest impacts from stress events, but can also provide early indications of potential problems that will affect a wider area of Vermont’s forests. Forests of the high-elevation spruce-fir zone on Mt. Mansfield have been more prone to mortality than other locations. The balsam fir-dominated forests consistently have high dieback and damage from broken branches. Annual monitoring has also shown that heavy cone-producing years, while benefiting squirrel populations, is detrimental to crown health and indirectly to bird reproduction, as squirrels are predators of bird eggs. Birch trees are particularly vulnerable to drought. On the east slope of Mt. Mansfield, birch condition has declined since the severe drought of 1998-99 (Figure 12).
50
45
40
35
30
25
20
15
10
5
01992
Percent of Trees with High Dieback
1993 1994
1995 1996
1997 1998
1999
2000 2001
2002 2003
2004 2005
2006 2007
2008
Balsam fir
Birch
Figure 12: This figure indicates dieback of birch and balsam fir on Mt. Mansfield. A decade of balsam fir recovery follows a past disturbance. Birch trees are particularly vulnerable to drought, shown here in the decline of birch since the severe drought of 1998-99.
Source: Sandy Wilmot, VTFPR
50
45
40
35
30
25
20
15
10
5
01988
Percent of Sugar Maple Trees on Monitoring Plots with Thin Foliage
Pear Thrips Ice Storm
Drought Forest Tent Caterpillar
1989 1990
1991 1992
1993 1994
1995 1996
1997 1998
1999
2000 2001
2002 2003
2004 2005
2006 2007
Figure 11: Stresses from a variety of events have affected sugar maple health. Following the 1999 and 2001 droughts, for example, forest tent caterpillar populations exploded, resulting in extensive defoliation.
Source: Vermonts Plots, NAMP

15
orest managers in Vermont must contend with myriad hot button issues. These include how to deal with exotic diseases and insects, adapt to climate change, safeguard riparian systems, minimize impacts associated with forest roads, manage competing recreational interests, and conserve forest biodiversity. Keeping working forests economically viable, conserving open space, and discouraging parcelization and sprawl are major concerns. But 21st century foresters also face new opportunities, such as growing interest in community-based forestry, forest certification, rapidly developing carbon markets, and rising demand for sustainably produced biomass fuels. These opportunities may create economic and other incentives for sustainable forest management, but also require balancing tradeoffs between competing resource values. An example is the inherent difficulty of how best to allocate biomass among uses such as on-site carbon storage, wood products, fuel, and habitat structure. A central challenge in sustainable forest management has been determining the best mix of management approaches most capable of providing a broad array of ecosystem functions while meeting landowner objectives. VMC scientists are conducting research on a promising area known as disturbance based silviculture, which emulates naturally occurring forest processes (Keeton 2006). A general finding of this research is that late-successional characteristics in northern hardwood—including vertically complex canopies and gaps—can be promoted through a variety of modified silvicultural approaches. But these management techniques are less effective in other ways, tending to significantly inhibit certain stand development processes, such as recruitment of large trees, downed coarse woody debris, and the highest levels of biomass and carbon storage. The results signal that treatments can be modified to retain and even enhance important elements of stand structural complexity, but of course this involves tradeoffs in terms of reduced harvest volumes (Figure 13). The VMC-sponsored Forest Ecosystem Management Demonstration Project (FEMDP) has also shown that low-intensity, disturbance-based management can provide an intermediate level of carbon storage, providing a margin of enhanced on-site carbon sequestration compared to conventional selection harvesting. Aboveground biomass is predicted to increase over the next 50 years under all the treatments, including controls. None of the experimental stands is likely to attain the biomass they would have without treatment, but some techniques are projected to attain 91.4 percent of the biomass levels of untreated stands.
FEMDP researchers have monitored a variety of wildlife as indicators of biodiversity responses to sustainable forest management. As predicted, responses to the silvicultural treatments vary according to the habitat associations of different groups of species. For instance, some early successional bird species appear to have benefited from the variably sized openings created by group selection logging, while all the treatments have been effective in maintaining the habitat needed by interior dwelling and late-successional birds (Strong, unpublished data). There are clear economic tradeoffs involved in modifying silvicultural treatments to promote stand structural complexity (Keeton and Troy 2006). FEMDP assessments examined timber-related revenue only, whereas a more complete economic analysis might include other potential revenue sources, such as carbon credits. The profit margins incurred by all the treatments were highly sensitive to site quality and market conditions. Where these are poor, lower intensity harvesting may generate only enough profit to cover expenses. This might be acceptable in a limited number of settings, for instance where disturbance-based approaches are employed for restoration purposes in reserves. For commercial harvests, however, the experimental approaches would be marketable only where site quality is moderate to high and market conditions are favorable. Under those conditions the experimental treatments offer alternatives that provide revenue from low-intensity harvest while also meeting ecological management objectives.
Research on Sustainable Forest Management
F
P r e -H a r v e s t
P r e -H a r v e s t
P o s t - H a r v e s t
P o s t - H a r v e s t
Single-Tree Selection Unit
Structural Complexity Enhancement Unit
Figure 13: Visualization of stand structure changes associated with two of the experimental treatments in the VMC Forest Ecosystem Management Demonstration Project.
Source: Keeton 2006
PRE-HARVEST
PRE-HARVEST
POST-HARVEST
POST-HARVEST

16
Biomonitoring data collected on mountain streams below ski resorts show that increased sediment and fluctuating pH can affect the productivity, abundance, and species richness of macroinvertebrates.
Ski Resorts and Land-Use Disturbance
Disturbances caused by conversion of upland forests to developed uses may have more serious environmental implications than at low elevations. As Vermont ski resorts expand and diversify activities over four seasons, their ecological impacts may be intensifying. Mountain ecosystems are also increasingly subject to other disturbances and stresses such as climate change, mercury deposition, acid precipitation, and development of wind and communication towers. VMC-supported wildlife research has focused on three aspects of mountain development: direct habitat loss, fragmentation, and modification. Hydrologic and aquatic studies have examined the role of mountain development on streamflow, water quality, and aquatic biota. The response of wildlife species to forest fragmentation and loss is dictated by factors such as home range size, sensitivity to habitat edge effects, and gap-crossing ability. Theoretical modeling of bird species on two existing Vermont ski resorts, Stratton Mountain and Mount Mansfield, showed dramatic decreases in population sizes as fragmentation and edge effects increased (Strong et al. 2009). Modeling habitat requirements, using current ski resort management scenarios, shows that species with one-hectare territories declined by 32-41 percent, while population declines in species with ten-hectare territories ranged from 64-73 percent. These results underscore the need to investigate actual impacts of ski resort development on wildlife, in particular high-elevation forest birds like Bicknell’s thrush. Research on songbirds has repeatedly shown that increased habitat fragmentation causes “edge effects” which can lead to higher rates of nest predation and lower rates of nest survival. Because ski trails and associated work roads fragment and increase the amount of edge habitat, an important question is whether these modifications affect the nesting success of Bicknell’s thrush. VMC researchers examined potential differences in nest predation and adult survivor-ship on ski resorts compared to natural forest areas on Mansfield and Stratton (Rimmer et al. 2004). Overall there was no strong evidence for a ski resort effect on nest predation or survivorship. There was some evidence that male thrushes may be more vulnerable to predation when crossing open ski trails. Radio telemetry data indicate that Bicknell’s thrushes tend to avoid crossing large openings. Other species may also be reluctant to cross open ski trails, as shown in research involving forest beetles (Strong 2009) and six species of songbirds (Holmgren 2002). Mountain watersheds are high energy settings, where water, solutes and sediment move rapidly over steep slopes and thin soils. Decades of study in forests of the northeastern U.S. and elsewhere indicate that logging and road construction affect annual water yields, peak flows, sediment production, water quality, and aquatic habitat quality. The effects of ski resort development, however, are not well known. In 2000, a team of VMC cooperators established a
Aerial infrared photography showing an increase in road infrastructure and land-use changes in Charlotte over a 15-year period.
Source: Kelley et al. 2002
1985 2000

17
watershed study on Mt. Mansfield to examine the hydrologic effects of ski resort development. The study uses a paired-watershed approach to compare streamflow, water chemistry, and sediment yields for two adjacent watersheds on the eastern slopes of Mt. Mansfield (Wemple et al. 2007; Shanley and Wemple 2009). Even after accounting for small differences in watershed size and artificial snowmaking, study results show that water runoff from the ski resort watershed consistently exceeds that of the unmanaged watershed to a greater extent than forest harvesting increased runoff over unmanaged forests in regional watershed studies. The greater runoff appears to result from the combined effects of the more prodigious snowfall in the ski-resort watershed and to differences in snowmelt delivery to streams during spring runoff, and has important implications for storm water management in mountain development projects. Annual sediment yield from the ski-resort watershed exceeds that from the unmanaged watershed by roughly three times (Figure 14), with much larger differences documented during periods of construction and ground disturbance. Annual chloride yield is ten times higher in the developed watershed, presumably due to road salting, relative to the control (Figure 15). VMC-sponsored research on ski resort development also focuses on aquatic biota. Biomonitoring data collected on mountain streams below ski resorts show that increased sediment and fluctuating pH can affect the productivity, abundance, and species richness of macroinvertebrates. Increased flows often will cause a scour effect temporarily decreasing macroinvertebrate abundance, results that are seen in monitoring data across the state. The three species of stream salamanders which inhabit the mountain forests of Vermont serve as useful bioindicators of stream habitat quality. Salamander abundance and body sizes were quantified within seven Vermont ski resorts and in adjacent undisturbed forest areas, including Mt. Mansfield (Hagen 1998; Strong et al. 2009). Ski resort streams supported significantly lower populations of spring salamanders and northern dusky salamanders, and body lengths of northern dusky salamanders were shorter within ski resorts. These differences may have resulted from clearing streamside vegetation and increased siltation rates in streams within ski resorts. VMC-supported research has shown that the effects of upland development, when referenced against traditional forest practices of logging and road construction, have proved to be larger than expected. Some of these effects can be mitigated through good management practices, including storm water detention structures, waterbars on ski trails, and increased riparian buffer widths. Other effects are an inevitable outcome of habitat fragmentation associated with development of the mountain landscape.
Fragmentation Effects on Reptiles and Amphibians
Land conversion and fragmentation are key disturbances that adversely affect the ability of animals to move safely through the landscape. As a result of the statewide reptile and amphibian studies funded by VMC, we have refined our knowledge of the distribution of all of Vermont’s reptiles and amphibians and the effects of habitat fragmentation on these species. One of these species, the eastern ratsnake, is among the largest snakes in the United States, commonly reaching six feet in length. The eastern ratsnake has an isolated northern population and a connected population in western Rutland County. The northern population on the Monkton/New Haven/Bristol border is entirely disconnected from any other eastern ratsnakes; hence, there is no introduction of new genes into the population and no possibility of recolonization after a local population extirpation. Consequently, it is at a much greater risk of permanent loss than the Rutland County population.
250
200
150
100
50
0
Annual Suspended Sediment Yield
WY01 WY02 WY03
150
100
50
0
Annual Chloride Yield
WY01 WY02 WY03
Ranch Brook West Brook
Ranch Brook West Brook
Wood turtle
Figures 14 and 15: In a paired-watershed study at Mt. Mansfield conducted in water years 2001-2003, both annual sediment yield and annual chloride yield were higher on a ski-resort watershed than on an unmanaged watershed.
Source: Wemple et al. 2007; Shanley and Wemple 2009

18
Among the best known migrating wildlife in Vermont are those species of amphibian that breed in the early spring. With the first warm rains of late March and early April, thousands of spotted salamanders and wood frogs that have spent the winter in upland deciduous forests, head to the nearest beaver ponds, vernal pools, and swamps to breed and lay their eggs. VMC-funded work has discovered a few, large, remaining populations of the blue-spotted salamander. One of these populations currently crosses a major shortcut to the Williston big-box shopping malls. As a result, hundreds of adult blue-spotted salamanders are killed on this road every spring. Eventually the amount of mortality on the road will surpass the ability of the population to replace them, and the population will disappear. Another amphibian, the eastern newt, relies on a contiguous mosaic of often shifting ponds and forested uplands for its life cycle. As these ponds and forests become isolated from each other by forest fragmentation, the newts become increasingly at risk. Wood turtles exemplify another conservation issue affecting long-lived species. Wood turtles may live 30 years or more and do not become sexually mature until reaching about 14 years of age. Their survival as a species depends upon the turtles laying eggs for many years. The long-lived strategy worked well for wood turtles until the introduction of cars, mechanized haying equipment, and turtle collectors. Consequently, both their longevity and their terrestrial behavior put them more at risk from increased development, habitat fragmentation, and human population growth. Another example of the impact of changing forested landscapes on reptiles is loss of early successional habitat. Both smooth greensnakes and North American racers prefer open grasslands or a mix of shrubs and grasses. Historically these might have been extensive beaver meadows, flood plains, or areas cleared by rockslides, hurricanes, or other natural events. As hilltop farms were abandoned, open areas first returned to forests, and now many are being developed. Most of the lands that remained open were maintained by regular mowing, or used as cropland. The machines that keep these lands open today have become faster and more
efficient over the years. Wildlife of all kinds is mowed, raked, and baled along with the crops. As a result, smooth greensnakes and North American racers no longer inhabit cropland or regularly mowed and baled areas. They are, however, found along open power lines, cleared margins of roadways, pastures (kept open by animals), wet fields, and fields kept open by occasional brush-hogging to maintain
views. Consequently, populations of the smooth greensnake are increasingly difficult to find. We know of only one recent population of North American racers and even that one may have disappeared in the last two years.
Blue-spotted salamander
Smooth greensnake
Eastern rat snake
VMC-funded work has discovered a few, large, remaining populations of the blue-spotted salamander. Eventually the amount of mortality on the road will surpass the ability of the population to replace them.

19
Recommendations Nearly two decades of VMC-supported research and monitoring provides a rich picture of the health of our forests and a window into things to come. Strengths and weaknesses in the health of our forest ecosystems have been highlighted in this report. Productivity monitoring indicates stresses caused by air pollution, extreme weather events, and perhaps changing climate conditions. Our forests produce an abundant supply of clean water, but studies suggest that development will produce impacts on flows and water quality that will have measureable effects on aquatic organisms. Biodiversity in our forests is high, but VMC studies show clear effects of a landscape increasingly pressured by a growing population and land-use practices that consume and fragment natural habitats.
VMC researchers studying forest-health issues recommend the following:
• Continuetostudycarbondynamicsinmanagedandunmanagedforests,andtheir relationship to long-term forest recovery from historic land uses, anthropogenic stress, natural disturbance dynamics, and forest management.
• Investinequipmenttobetterunderstandcarbonfluxandinteractionsbetweencarbon and other atmospheric pollutants as climate changes.
• UtilizeVMCexpertiseanddatatoaddresstheecologicaleffectsofexpandingbiomass harvesting for energy.
• Createdemonstrationareasforforestmanagerstomeasureforestcarboncyclingand understand carbon accounting and management options.
• Continuemonitoringtheresponsesofterrestrialandaquaticspeciestodevelopment pressures leading to habitat fragmentation.
• CollectbaselinedataonnewhumanandanimalhealthrisksemerginginVermont, including especially the deer tick, a vector of Lyme disease.
• Monitornaturaldisturbanceimpactstobetterunderstandbaselineecosystemdynamics and evaluate regime changes related to global climate disruption.
• UtilizeVMC-supportedwatershedresearchtoinformstatepermittingstandardsfornew mountain development projects.
• Providedatatoinformguidelinesforskiresortsandothersconductinghabitat-mitigation efforts to maintain or restore ecosystem structure and function.
VMC Insect Data and Indiana Bats ndiana bats are listed as an endangered species at state and federal levels. Populations in Vermont depend on large old sugar maple trees for nesting and rearing their young. A recent population explosion of forest tent caterpillars defoliated thousands of acres of sugar maple forest. Proposed control efforts to protect sugar maple stands included aerial applications of a bacterial biological control agent, Bacillus thuringiensis (Bt). Because Bt is known to kill Lepidoptera larvae in general, concerns were raised about the effects of such treatments on the bats’ food supply, which would have placed an additional stress on bats during a critical life stage. Data on moth presence and abundance, generated through VMC and other studies, were used to help time the aerial sprayings so that effects on the Indiana bat populations would be minimized.
I
Indiana bat
Nearly two decades of VMC-supported research and monitoring provides a rich picture of the health of our forests.

S
20
WEATHER AND CLIMATE IN VERMONT
ituated just south of the 45th parallel, Vermont experiences a humid, continental climate that is characterized by a high degree of variability. The state’s latitude and location relative to air masses and frontal systems that originate to its northwest, west, and south are key factors in both the weather fluctuations that are observed seasonally and annually, as well as the nature of the storms that move across it. Precipitation is equally distributed throughout the year and the cloud shield that affects most of the region makes Vermont one of the cloudiest places in the United States. Weather and climate refer to two very different phenomena. Weather describes the condition of the atmosphere (for example, temperature, precipitation, cloud cover, and humidity) over a short time frame of minutes to about a week. Climate, on the other hand, refers to the longer-term averages—months to millennia and longer—of the variations in the atmosphere, biosphere, and hydrosphere over time. Climate variability incorporates the naturally occurring fluctuations in the atmosphere over these long time periods, while climate change refers to a long-term change in the statistics of climate variables (such as winds and temperature) due to either natural climatic processes, changes in earth-sun characteristics, or anthropogenic mechanisms (American Meteorological Society 2000). Natural climatic hazards that plague Vermont include temperature extremes, flooding, drought, tornadoes, damaging winds, severe thunderstorms, winter storms and forest fires. Each hazard has seasonal characteristics and temporal cycles, with some occurring more frequently in certain decades than others. Hazards can be exacerbated by the state’s terrain and mountain barriers (its orography), in particular the north-south trending Green Mountains and Taconics. Orographic precipitation refers to the enhanced precipitation totals that occur when a storm system is forced to rise as it encounters a mountain barrier. This is often observed across Vermont and can lead to flooding episodes in the summer or areas of increased snowfall accumulation in the winter. On a local and regional scale,
Vermont’s mountains and valleys also affect the funneling of wind flow, the creation of cold/frost hollows in valleys, and the line between freezing precipitation and rain or snow during complex winter storms. These terrain influences are translated into the distribution and diversity of species types as well as the location and magnitude of storm damage on forests (Dupigny-Giroux 2002).
Meteorological Trends In Vermont there is a saying that one extreme follows another. This is particularly true for droughts and floods. Very severe droughts are rare and tend to be statewide, spanning a number of years. These include the severe droughts of the mid-1960s, 1998-1999, and 2001-2002— all were noteworthy in terms of their effects on the state’s forests. The 1998-1999 event affected 85,000 acres (34,425 hectares) statewide with symptoms such as leaf scorch, leaf yellowing, and early leaf color. Less severe droughts occur more frequently and tend to be localized in extent. Species that are susceptible to drought include red and sugar maple (Dupigny-Giroux 2002). Temperature extremes can occur in every season, including extreme cold and frost during the summer which can be detrimental during the growing season. In the spring, marked fluctuations following budding can influence flowering in species such as crab apples. In 2001, spring temperatures varied from at least 90 degrees F to about 20 degrees F. This accelerated the production of apple blossoms, which were then destroyed by the low nocturnal temperatures. Moisture extremes can be conducive to insect outbreaks as well as diseases such as tar spot that repeatedly struck Norway maples in 2007 and 2008. Storms and other severe weather can act as disturbances in forested ecosystems, the most noteworthy of which in recent decades was the ice storm of January 1998, which damaged more than 951,000 acres in Vermont alone. Other stressors such as drought and hurricane-induced rainfall have also caused physical and chemical changes in plant response. When these stressors and

21
disturbances occur consecutively or coincidentally, they raise questions about long-term forest health and viability. Meteorological observations are taken at six Vermont Monitoring Cooperative (VMC) sites. The lowest in elevation are Colchester Reef (125 feet or 38 meters) and Diamond Island (148 feet or 45 meters), located on Lake Champlain. Both stations report 15-minute averages with Colchester Reef beginning in July 1996 and Diamond Island in May 2004. In September 1996, the station on the western slopes of Mt. Mansfield began operations at an elevation of 2,800 feet (853 meters). A second station, also at 2,800 feet on the eastern side of Mt. Mansfield, became operational in July 1999. Fifteen-minute data are available for these stations as well as for the Proctor Maple Research Center Air Quality site (1,309 feet or 399 meters). Finally the National Weather Service supervises daily records at the summit of Mt. Mansfield (4,300 feet or 1,310 meters), which has been in operation since 1954. Daily readings of temperature and relative humidity taken at the Colchester Reef station versus Mt. Mansfield West highlight the stations’ physical and geographical differences (Figures 16 and 17). The moderating influence of Lake Champlain is clearly observed at Colchester Reef in contrast to the more continental and higher elevation on Mt. Mansfield. Variations in relative humidity between these two sites are determined by both the temperature and water vapor pressure of air and largely reflect the different air characteristics at the sites. The range of relative humidity values is larger at
40
30
20
10
0
-10
-20
-301997
Air Temperature – Colchester Reef
1998 1999
2000 2001
2002
2003 2004
2005 2006
2007 2008
2009
Year
Air T
empe
ratu
re (
C)
30
20
10
0
-10
-20
-30
-401997
Air Temperature – Mt. Mansfield
1998 1999
2000 2001
2002 2003
2004
2005 2006
2007 2008
2009
Year
Air T
empe
ratu
re (
C)
Figure 16: Daily average air temperatures at Colchester Reef (top) and Mt. Mansfield West. Source: Christopher Still
100
90
80
70
60
50
40
30
20
10
01997
Relative Humidity – Colchester Reef
1998 1999
2000 2001
2002
2003 2004
2005 2006
2007 2008
2009
Year
Rela
tive
Hum
idity
(%
)
Relative Humidity – Mt. Mansfield
100
90
80
70
60
50
40
30
20
10
01997
1998 2000
2001 2002
2003 2004
2005 2006
2007 2008
2009
Year
Rela
tive
Hum
idity
(%
)
Figures 17: Daily average relative humidity at Colchester Reef (top) and Mt. Mansfield West. Source: Christopher Still
The Colchester Reef monitoring station.

22
Mt. Mansfield than it is at Colchester Reef, with substantially more 100 percent relative humidity observations at the former site. Also, while the mean daily relative humidity is rarely below 50 percent at Colchester Reef, it frequently dips below this threshold at the Mt. Mansfield station. Cloud data comprise another meteorological element measured at these stations. Clouds influence several environmental factors important for forest carbon and water cycling and forest health. For example, clouds are strong determinants of surface climate, particularly intercepted solar radiation (insolation), air temperature, and relative humidity. Clouds diffuse sunlight. Studies of forests have documented how increasing this so-called “diffuse insolation” can increase canopy photosynthesis up to a point. The reason is thought to be due to enhanced photosynthesis of leaves deep in the canopy that are otherwise shaded by upper-canopy leaves. Clouds also decrease radiant heating and thus temperatures of upper canopy leaves. Finally, increased cloudiness is also associated with higher relative humidity via decreases in air and leaf temperature and increases in specific humidity. As a result of all these processes, temperate broadleaf forests often have the highest photosynthesis rates under partly cloudy conditions, as they benefit from lowered temperatures, higher relative humidities, and increased diffuse insolation (Freedman et al. 2001; Min and Wang 2008; Still et al. 2009). However, clouds can also negatively impact forests through delivery of acidity and pollutants from cloudwater deposition. Cloudwater is often contaminated with pollutants like mercury and other trace elements. Given the importance of clouds for forest processes and health, we analyzed long-term data on cloud frequency and height from the Burlington International Airport. Seasonal cycles of cloud frequency are shown in the two charts in Figure 18, which indicate clearly how cloudy the Burlington area is, with the highest cloud frequency in winter and the lowest frequency in the summer months. Cloud data going back to the late 1940s document an apparent downward trend in the frequency of cloudy periods observed in Burlington starting in the mid-1990s and continuing to the present. Notably, when we examine the frequency of clouds with bases below 1,000 meters over this same time period, no downward trend appears, so the variation must be driven by higher elevation clouds. Interestingly the downward trend in cloud frequency may underlie the insolation patterns observed at Colchester Reef. As can be seen in Figure 19, there is an increase through time in the summertime maximum insolation values measured at Colchester Reef. This is exactly what would be expected from declining cloud cover over this period, with reduced reflection, scattering, and absorption of solar radiation from cloud droplets. In order to place these observations into perspective, it is useful to look at averages over the entire western region of Vermont for an extended period of time. Again, climate variability comes to the fore with marked temperature and precipitation fluctuations over the last century at both a regional scale (western Vermont) as well as statewide. Several droughts of larger magnitude and intensity than those observed in the VMC period of record are noted on Figure 20, as are the decades that have been warmer and colder than those of the 1998-2008 time frame.
Figure 18: Cycles of cloud frequency at the Burlington International Airport.
Source: Christopher Still
0.9
0.8
0.7
0.6
0.5
0.4
0.3
0.2
0.1
0
Average Seasonal Cycle of Cloud Frequency
Month
Clo
ud F
requ
ency
1 2 3 4 5 6 7 8 9 10 11 12
Mean Monthly Frequency Clouds < 1000mMean Monthly Frequency All Clouds
0.8
0.7
0.6
0.5
0.4
0.3
0.2
YearC
loud
Fre
quen
cy
1949 1952
1955 1958
19611964
1967 1970
1973
1976 1979
1982 1985
1988 1991
1994 1997
2000 2003
2006
Annual Mean Cloud Frequency Since 1949
600
500
400
300
200
100
0
Insolation Values at Colchester Reef
Inso
latio
n (W
/m2)
1996
1997
1997
1997
1998
1999
1999
2000
2000
2001
2002
2002
2002
2003
2003
2004
2004
2005
2005
2006
2006
2007
2007
2008
2008
2009
Date
Figure 19: There is an increase through time in the summertime maximum insolation values measured at Colchester Reef.
Source: Christopher Still

23
Forest Processes in Spring Forests are dynamic. Thus, understanding and measuring what is normal can be challenging, requiring a long-time commitment. One measure of forest processes is the timing of spring events such as tree leaf and flower development, ephemeral plant flowering, and pear thrips (a forest insect pest) emergence and feeding. Over the past 18 years, sugar maple leaf and flower development have been monitored annually, and other spring phenological events have been monitored periodically, at Mt. Mansfield, Lye Brook, and other locations, as indicators of forest health. Forests in spring are teeming with activity as trees, plants, and animals come alive from their long winter’s dormancy. Everything happens quickly and the timing of events determines an organism’s survival and propagation. Herbaceous ephemeral plants (plants that are only seen in the spring) are a clear example of a quick, well timed forest process. Sunshine penetrates forest canopies that haven’t yet produced their leaves, warming the forest floor. This provides an opportunity for plants that normally live in the shade of forest trees to take advantage of the warmth and open canopy to quickly emerge, gather sunlight for energy, flower, and set seeds. By the time tree leaves have come out, these plants are finished their crucial life stages and retreat into dormancy once more. The timing of these events has been monitored over the last 18 years at the base of Mt. Mansfield in a sugar maple-dominated forest, providing a baseline for monitoring change over time (Table 4). Pear thrips was discovered as a new sugar maple pest in 1987, and in 1988 thrips defoliated nearly 250,000 acres of forestland in Vermont. This tiny insect emerges from the soil in the early spring and searches for open sugar maple buds to enter and feed upon. If spring bud development is rapid, thrips have little time to enter buds, feed, and damage leaf tissue. But if weather conditions stall bud development, thrips can destroy young leaves, causing significant forest injury. In the early 1990s, research on pear thrips at the UVM Entomology Research Laboratory produced monitoring methods for sugar maple leaf and flower development. Subsequent tree and insect monitoring at the VMC Mt. Mansfield site have contributed to understanding population and management strategies of this insect in relation to sugar maple processes. In 1993 and 1995, pear thrips populations were significant, emergence and feeding developed sooner than sugar maple leaf development, and this resulted in large areas of forest injury. Normally, sugar maple leaf emergence outpaces thrips feeding and little leaf injury occurs. Additional monitoring of other hardwood species has increased our understanding of the progression of spring development among species, at different elevations and within forest canopies. Managing forest health in Vermont requires answering questions about the timing of tree species development. For example, when VMC researchers received a request for information on the timing of sugar maple pollination, the answer was readily available: between April 28th and May 15th. Another request for information came from the maple syrup industry,
Figure 20: Standardized Precipitation Index (SPI) for the western climate division of Vermont 1895-2008. Periods of excessive precipitation and droughts have been noted.
Source: Courtesy the National Drought Mitigation Center
4
3
2
1
0
-1
-2
-3
-4
Standardized Precipitation Index 1895-2008
SPI v
alue
s
1895
1899
1903
1907
1911
1915
1919
1923
1927
1931
1935
1939
1943
1947
1951
1955
1963
1967
1971
1975
1979
1983
1987
1991
1995
1999
2003
2007
Months
1927 19381955
1998,19992005
199519871980
197819631915
Table 4: Flowering dates of understory spring plants at Proctor Maple Research Center in Underhill. Data results are from 18 years of monitoring (1991-2008).
Source: Sandy Wilmot and Tom Simmons, VTFPR

24
which was interested in expanding tapping to include red maple trees and needed information on the timing of red maple bud development in comparison to sugar maple. Red maple has been traditionally thought of as flowering early in spring and so could potentially add a “buddy flavor” if mixed with sugar maple sap. Although red maple flower buds begin to swell on average two days earlier than sugar maples, budbreak (when leaves start to emerge) is actually later. Sugar maple bud development is on average 37 days from bud swell to full leaf out, whereas red maple is 51 days. Monitoring results indicated that red maple, on average, leafed out 14 days later that sugar maple, so timing of leaf out was not a valid reason for excluding red maple sap. Spring development, however, is highly variable from year to year and location to location, depending on temperature, precipitation, snow pack, and other environmental factors. On Mount Mansfield with its colder temperatures, increased snow pack, and other environmental differences, leaf development of sugar maple forests located at 2,200 feet was 7-10 days later than at 1,400 feet. Because of interest in climate change, researchers are often asked if the timing of leaf development is earlier or later than normal. Sugar maple budbreak (green tip of leaf emerging from buds) and leaf out (full leaf development) have been earlier in the decade of the 2000s compared to the 1990s. While there is much variability from year to year, eight of the nine years of earlier than normal leaf development occurred since 2000. On average, budbreak is three days earlier and leaf out is five days earlier this decade than in the 1990s (Figure 21). In 2008, monitoring showed that budbreak was 12 days earlier and full leaf out was nine days earlier than the baseline. While this may seem like an indication of climate change effects, there have not been significant changes in spring temperatures over this same time period. Although temperature and bud development are closely linked, there may be other reasons for bud development differences such as late snow cover in the spring, soil moisture deficit, or other weather conditions. As with many weather-dependent processes, more time is needed to discern what lies within the realm of normal variation, and what will prove to be a long-term trend.
29-May
24-May
19-May
14-May
9-May
4-May
29-April
24-April
19-April1992
Comparison of Sugar Maple Leaf Out Dates
1993 1994
1995 1996
1997 1998
1999 2000
2001 2002
2003 2004
2005 2006
2007 2008
Year
Dat
e
Annual Leaf out
1991-1999 Average
2000-2008 Average
Figure 21: On average, budbreak of sugar maples at Proctor Maple Research Center is three days earlier and leaf out is five days earlier this decade than in the 1990s.
Source: Sandy Wilmot and Tom Simmons, VTFPR
Development stages of red maple flowers (top row) and leaf buds (bottom row).
The maple syrup industry was interested in expanding tapping to include red maple and needed information on timing of bud development.

25
Weather and Climate Influences on Reptiles and Amphibians Reptile and amphibian abundance and health are dependent in part on the amount and distribution of heat and moisture in their surroundings. Unlike mammals or birds, reptiles and amphibians do not generate their own heat. They control their internal temperatures by moving into or out of the sun, warm water, or into or out of contact with warmer objects. They are essentially solar heated. Their growth, digestion, healing, and all other physiological processes work best within a fairly narrow range of temperatures and water conditions. In our work on Mt. Mansfield and near the Lye Brook Wilderness, we have often found wood frog and spotted salamander eggs or larvae drying up at the bottom of what were vernal pools earlier in the year. Vernal pools fill with water during the spring but often are dry by early fall. If the pool dries before the amphibians hatch and metamorphose (approximately the third week in July for spotted salamanders at our sites), they will all die. This is a fine balance. Even if the amount of annual rainfall is adequate, if it is dry for three weeks in May, the pools will dry and the amphibians will die. Changes in the timing or amount of snowfall in winter also control populations. If snow cover is non-existent or minimal during an extended cold period in the winter, even freeze-tolerant species such as spring peepers and wood frogs that winter in the leaf litter will freeze and die.
Soil Climate Analysis Network
he USDA Natural Resources Conservation Service (NRCS) Soil Climate Analysis Network (SCAN) is a cooperative nationwide data collection system designed to support natural resource assessments and conservation activities. As part of the long-term soil monitoring program, VMC and NRCS partnered to install SCAN stations near Lye Brook Wilderness and on the west flank of Mt. Mansfield in September 2000. In addition to supporting the national objectives of the SCAN program, the objectives of the VMC SCAN sites are to collect long-term data on local weather and soil moisture and temperature to complement measurements of physical, chemical, and biological parameters at long-term soil monitoring sites located nearby. Remote sites like Vermont’s are designed to provide near real-time data from a variety of sensors. The above-ground sensors collect information required for climate analysis and evapotranspiration calculations, including precipitation, air temperature, relative humidity, wind speed and direction, solar radiation, barometric pressure, snow depth, and snow water content. Below-ground sensors collect soil temperature and soil moisture data at five depths (2, 4, 8, 20, and 40 inches). At Lye Brook, two sets of below-ground sensors are installed, one set in a sunny forest opening another in shade under the forest canopy. SCAN data show that in the summer, the upper layers of soil are the warmest, but in the winter, the deeper layers are warmest. In July and August, there are daily soil temperature fluctuations of up to 3 degrees C at the surface, while at 40 inches, daily temperature changes are on the order of about 0.1degrees C or less. At some point in the month of April, the soil has virtually the same temperature throughout the soil profile as the upper layers begin to warm up. In September, the same temperature equalization happens as the upper layers begin to cool down. Very few soil temperature readings of below 0 degrees C have been recorded, which raises the question of whether these soils actually freeze in winter, as is commonly believed. The soils typically have the highest moisture content reading in April. This seems to be more attributable to snowmelt than increased precipitation. All soils dry out in the summer months, regardless of precipitation levels. Although not as distinct as in summer, there is a noticeable drop in soil moisture in winter.
T
Wood frog

26
Reptile and amphibian distribution is also controlled in part by climate. Many of our rarest reptile species such as North American racers, timber rattlesnakes, and common five-lined skinks are at the northern extremes of their ranges. As the climate warms, these species may benefit. Their numbers may increase and their ranges may expand if they can move safely through the landscape to colonize new areas. But it may be difficult or impossible for them to move safely to the nearest piece of appropriate habitat. Habitat fragmentation may have resulted in large distances between appropriate habitat locations. Mortality from roads and other sources may be too frequent to allow adequate numbers to move. As a result, it may be that only more mobile southern species, with relatively unspecialized habitat requirements, expand their ranges in the state. Several amphibian species are at the southern extreme of their range in Vermont. The boreal chorus frog may have already been extirpated from Vermont. It was last heard in Alburg in 1999. This may be the result of drainage of temporary low-elevation wetlands and an inability to compete with wood frogs. As the climate warms, our remaining northern species, the mink frog, may disappear from its current limited range in northeastern Vermont. It is unclear why it is limited to that portion of our state. It may be unable to compete with more aggressive southern species such as bullfrogs, or perhaps colder water temperatures keep other diseases, parasites, or predators at bay. Whatever the case, the mink frog’s climate is warming and its environment and surrounding species mix will change. It may soon disappear from Vermont.
The Ice Storm of January 1998 In January 1998, a prolonged, widespread icing episode affected much of the northeastern United States and adjacent Canada. Damage resulting from this severe ice storm was aerially mapped on one-fifth of the forest land in Vermont. Damage was most severe to hardwoods, recently thinned stands, and pole-size trees. Damage consisted mainly of branch breakage, broken main stems, and bent trunks, with fewer uprooted trees. The storm impacted about 20 percent of the forest plots used for forest health monitoring in the state, killing more than 20 percent of the hardwood trees on these plots. Damage affected parts of both Mt. Mansfield and Lye Brook, and prompted ecological studies of damage patterns and forest response. Most trees have an amazing ability to recover from a natural disturbance such as this. For hardwood species, this is especially true if the damage occurs during the winter months when most of the trees’ energy reserves remain in the roots. Recovery for trees that weren’t immediately killed by the storm was documented for damaged sites at Mt. Mansfield and elsewhere in the state between 1999 and 2003 by doing vertical photography of crown canopy cover and oblique photography of individual tree crowns.
I
Following the destruction caused by the ice storm in 1998, sugar maples recovered rapidly, as shown in these series of photos of crown improvement of 8-inch diameter trees in Strafford, Vermont.
In addition to tracking long- and short-term climate and weather changes and events, knowing the potential significance of these changes to native species, communities, and working ecosystems will hopefully generate more informed action.

27
Crown canopy cover (the amount of space occupied by tree branches and foliage) in ice-damaged hardwood forests increased from 69 percent in 1999 to 77 percent in 2001 and 80 percent in 2003. Trees with more than 75 percent crown loss due to the storm were considered high risk for survival, but most of these trees recovered, although stem growth was reduced. Sugar maples and white ash showed the best recovery. Yellow birch was intermediate in its ability to recover from severe crown loss, while paper birch was poor. The ice storm’s short-term effects on breeding birds were also studied through VMC. During June of 1999 and 2000, birds were surveyed at 32 ice-affected stations in northern hardwood forest stands located within the Green Mountain National Forest in central Vermont. Results were compared with pre-storm samples collected at the same points in 1993 or 1994, and at 25 control sites that were unaffected by the storm. The ice storm resulted in small canopy gaps in a largely forested landscape, significantly reducing canopy cover at sample points, while basal area and understory density remained unchanged. Overall, the total number of birds declined at ice-damaged sites, although a greater diversity of species was present (Figure 22). The abundance of three forest interior species declined following the storm, two of which (red-eyed vireo and Blackburnian warbler) were canopy-foragers, and one (ovenbird) was a ground-forager/nester. Another ground-forager/nester, dark-eyed Junco, was the only species to increase in abundance after the storm, although Canada warbler and winter wren showed increasing trends. Species that utilize forest-edge and open habitats increased in abundance, along with woodpeckers. Results from this study are consistent with investigations of bird responses to selective forest management, suggesting that these management strategies may effectively emulate some types of natural disturbance events such as ice storms.
Recommendations Topics involving weather and climate are becoming increasingly important to policymakers as they wrestle with new climate change legislation and ways to manage our forested resources. In addition to tracking long- and short-term climate and weather changes and events, knowing the potential significance of these changes to native species, communities, and working ecosystems will hopefully generate more informed action. The potential implications of a changing climate on the distribution and abundance of our native flora and fauna is of great concern. Finally, there needs to be a concerted effort at local, federal, and international levels to minimize our anthropogenic contribution to climate change, as well as to mitigate and adapt to a changing climate in both the short and long terms.
Thus the authors’ primary recommendations involve ongoing maintenance and support of meteorological observations that provide:
• baselinevaluesforachangingclimateatvariousaltitudesandecosystemsaroundVermont; • theabilitytotrackandmonitortheeffectsofsub-dailyweatherphenomenaonspecies;and • theabilitytomonitorchangesinphenologyandlifestagesofspeciesinresponsetoweather extremes or natural hazards.
3.00
2.50
2.00
1.50
1.00
.50
0 Red-eyed Overbird Blackburniam Dark-eyed Winter Canada Vireo Warbler Junco Wren Warbler
Ice Storm Sites
Pre-storm
Post-storm
1.80
1.50
1.20
.90
.60
.30
0 Black-throated Blue Warbler Black-capped Chickadee
Control Sites
Mea
n nu
mbe
r of i
ndiv
idua
ls/p
oint
cou
nt
Figure 22: These data show changes in the mean number of bird species at sites in central Vermont affected by the 1998 Ice Storm versus control sites.

28
Modeling Bicknell’s Thrush and Climate Change icknell’s thrush, a rarely seen small bird with a flute-like song, is a mountain species of high conservation concern. It nests only in high-elevation “islands” of spruce-fir forests in the northeastern United States and southeastern Canada. There are probably fewer than 50,000 individuals. On its Caribbean wintering grounds, where an estimated 90 percent of the global population is concentrated on Hispaniola, loss of forested habitats has been severe and is ongoing. The species is at risk from a variety of threats to its breeding habitat, including development, atmospheric pollution, and potentially the most damaging, climate change. Because the extent of Bicknell’s thrush breeding habitat is controlled primarily by climate, projected warming has the potential to alter the distribution and abundance of this species. Changes in vegetation communities along elevation gradients in the Northeast are strongly influenced by temperature (Spear 1989; Botkin et al. 1972). Warmer growing seasons could gradually elevate forest ecotones and confine high-elevation plant and animal communities to progressively higher, smaller, and more isolated patches. To project effects of climate change on Bicknell’s thrush habitat, VMC researchers first modeled mean July temperature in mountainous areas of New York and northern New England (Ollinger et al. 1995). Next, they identified the temperature range that corresponds with a model of the birds’ current breeding distribution (Lambert et al. 2005). Then researchers simulated warming, in one-degree increments, and measured changes in the availability of suitable habitat. Finally, predicted future changes in temperature were used to assess potential impacts on the amount of suitable habitat available under different climate-change scenarios (Hayhoe 2007). Regional warming of even 1 degree C will reduce potential Bicknell’s thrush habitat by more than half and an increase of 2 degrees C may be sufficient to eliminate all breeding sites from most of Vermont (Figure 23). A 3 degree C increase in growing season temperatures has the potential to nearly eliminate Bicknell’s thrush habitat in the entire Northeast. Summer temperatures are projected to rise on average by 2.8-5.9 degrees C under a range of carbon-emission scenarios (UCS 2006). It’s not clear how long it will take for ecotones to shift once temperature changes occur; scientific opinion ranges from decades to as long as centuries. VMC modeling using the temperature envelope approach should be interpreted to present the range of possible changes in spruce-fir habitat.
B
12000
10000
8000
6000
4000
2000
0
Projected Reduction in Bicknell’s Thrush Habitat
Temperature (C) Change Relative to 1950-1990
Bick
nell’
s Th
rush
Bre
edin
g H
abita
t (H
a)
0 1 2 3 4 5 6
Predicted LowerEmissions Scenario (2.8C)
Predicted HigherEmissions Scenario (5.9C)
Figure 23: This chart shows reduction in Bicknell’s thrush habitat under
simulated warming conditions. Simulations raised mean July
temperature in 1 degree C increments and assumed even warming.
Source: Rodenhouse et al. 2008
Bicknell’s thrush

29
A irborne pollutants can travel thousands of miles from their origins, but are eventually removed from the air and deposited to the earth’s surface through various atmospheric deposition processes. Wet deposition removes pollutants such as sulfuric and nitric acids which are dissolved in rain, snow, or cloud water. Dry deposition occurs when gaseous pollutants like ozone or sulfur dioxide, or particle pollutants like lead or black carbon, are deposited directly to plant leaves, surface waters, or other environmental surfaces. Wet and dry deposition processes provide a valuable service by cleansing the air of pollutants which would otherwise build to intolerably high atmospheric concentrations. However, atmospheric deposition also brings adverse environmental consequences in the form of acids, oxidants, hazardous organic compounds, mercury, and other toxic metals which accumulate in aquatic and terrestrial ecosystems. Atmospheric deposition monitoring provides an important foundation for environmental research, as atmospheric inputs can accumulate on the landscape over time and have cascading impacts on ecosystems. Long-term atmospheric deposition monitoring has not only been a cornerstone that supports other VMC research, but has also been an important research focus in its own right. Analyses of VMC air quality and deposition data have shown that Vermont’s pollution originates from a variety of local and distant sources. For example, the sulfate that impairs our visibility and acidifies our rain comes partly from Canadian smelters (which also contribute arsenic), partly from East Coast oil burning (which also contribute nickel and vanadium), and partly from midwestern coal burning (which also contributes selenium). All of the above pollutants have declined as emissions from these various source categories have been reduced. VMC has also conducted pioneering research on the trends, origins, and effects of ambient concentrations and deposition of atmospheric ozone, aerosols, and mercury.
MONITORING ATMOSPHERIC DEPOSITION
The core VMC site for atmospheric deposition monitoring is the Proctor Maple Research Center (PMRC), in Underhill. PMRC hosts several precipitation and air quality monitoring programs in response to regional and national scale issues such as acid rain, airborne toxic substances (such as benzene), cancer-causing ultraviolet radiation, haze, mercury, and ozone. PMRC is intensively instrumented, and features a 66-foot tower to support measurements and research on pollutant gradients within and above the forest canopy. Air and deposition monitoring is also conducted near VMC’s site at the Lye Brook Wilderness Area. The segments to follow feature key VMC atmosphere-related research on acid rain, mercury, and ozone, and on their effects on vegetation, soils, and lakes. Also included is a segment on critical loads assessment, which is research at the interface of atmosphere and ecosystems designed to assess how much pollutant deposition ecosystems can withstand.
Acid Deposition Atmospheric deposition monitoring at the PMRC in Underhill includes stations in three different statewide or national “acid rain” monitoring networks: the Vermont Acid Precipitation Monitoring Program (VAPMP, since 1980), the National Atmospheric Deposition Network (NADP, since 1984), and the NOAA Atmospheric Integration Research Monitoring Network (AIRMoN, since 1993). VMC has a second atmospheric site at Lye Brook in southern Vermont. Lye Brook was formerly a CASTNET site for dry deposition, and wet deposition data from a nearby NADP site in Bennington are used to assess the composition and trends of acid deposition in Lye Brook.

30
Since 1984, when the Underhill NADP site was established, the concentrations and loading of nitrate and sulfate have steadily decreased by about half (Figure 24). In response, pH has climbed from 4.38 in 1984 to over 4.7 in 2008. The pattern and magnitude of the trends are similar at the Bennington NADP site. Acid deposition in the northeastern U.S. peaked in the early to mid-1970s, and the trends in Vermont reflect decreasing emissions resulting from the Clean Air Act amendments in 1977 and 1990. Annual U.S. sulfur dioxide emissions from upwind fossil fuel burning utilities have decreased from more than 17 million tons in 1980 to less than 9 million tons in 2007. Sulfate accounts for more than half of the acidity in precipitation throughout Vermont. Despite these improvements, we are not “out of the woods” with acid rain, and acidic deposition continues to threaten some of Vermont’s ecosystems (see section below on Critical Loads). When the sulfate and nitrate pollutants that acidify Vermont’s precipitation are not being deposited as wet or dry deposition, they can remain suspended in the ambient air as gases and as tiny aerosol particles. Sulfate and nitrate aerosols are major components of fine particle pollution in Vermont and are also very efficient at scattering light, which impairs visibility and periodically obscures Vermont’s scenic vistas behind a dense blanket of regional haze. Detailed measurements of the concentrations and chemical compositions of small particles that cause regional haze and contribute to dry deposition have been made at the northern and southern VMC sites since 1989 and 1991 respectively. As with sulfate in precipitation, the past 30 years have seen a decrease in sulfate concentrations in atmospheric particles, due primarily to reductions in upwind sulfur emissions required by federal legislation. Nevertheless, sulfate pollution remains a problem for human health, public welfare (visibility), and sensitive organisms and ecosystems in Vermont. At Lye Brook, and the Underhill site, sulfate particles still account for half of the average fine particle pollution, and three-fourths of the haze on hazy days.
Mercury Pollution Mercury is a potent toxin that has adverse effects on the human brain, heart, kidneys, lungs, and immune system. Elevated mercury also causes abnormal behavior, reduced growth and reproduction, and mortality in wildlife. VMC researchers have conducted pioneering research on mercury pollution since 1992, including how mercury is deposited from the atmosphere, how the soil and terrestrial fauna such as birds take up atmospheric mercury, and how mercury moves through watersheds. VMC’s Underhill site—known as VT99 in the international network of mercury deposition sites—provides the longest continuous record of wet atmospheric mercury deposition in the world. This record shows that while 50-90 percent cuts in national and regional mercury emissions from medical waste incinerators and municipal waste combustors have occurred since 1990, wet deposition of mercury in northern New England remained stable (Figure 25). Researchers have
1985
1986
1987
1988
1989
1990
1991
1992
1993
1994
1995
1996
1997
1998
1999
2000
2001
2002
2003
2004
2005
2006
2007
2.4
2.0
1.6
1.2
0.8
0.4
0
Sulfa
te a
nd N
itrat
e Co
ncen
trat
ion
(mg/
l)
pH
Sulfate Nitrate pH
4.8
4.7
4.6
4.5
4.4
4.3
4.2
Figure 24: Since 1984 at the Underhill site, concentrations and loading of nitrate and sulfate have decreased by about half.
Source: NADP
LOW
M
OD
ERATE H
IGH
View of Mother Myrick Mountain from the Lye Brook Wilderness Area showing various haze levels caused by sulfate and nitrate aerosols.

31
demonstrated that much of the mercury deposited in Vermont originated in areas with high densities of coal-fired electric power plants (Keeler et al. 2005; Miller et al. 2009). Emissions from coal-fired power plants have remained stable over the period (Miller et al. 2009). VMC and EPA-funded observations of ambient air concentrations of reactive gaseous mercury (RGM), particulate mercury (HGP), and gaseous elemental mercury (GEM) at VT99 since 2004 provide an even clearer identification of out-of-state mercury sources. Because the air samples represent 2-hour averages, air-mass back-trajectories associated with them are more accurate in comparison to the complex multiple trajectories that contribute mercury to any given rainfall event. These observations establish that all three forms of mercury experience net transport to a greater degree than suggested by current generation EPA emissions-transport models used to establish policy. These measurements make plain that emissions-dense regions are associated with the highest air concentration events in northern Vermont (Figure 26, Miller et al. 2009). These unique and detailed records have provided additional insights such as the importance of climate variations influencing wet deposition, a strong seasonality to both wet and dry deposition, and less enrichment of mercury in cloud water relative to rain as compared to other pollutants. VMC also coordinated and executed several studies comparing the performance of different wet-deposition collector types on behalf of the national network and research partners. The core mercury monitoring activities at VT99 have facilitated numerous other studies, including determination of dry-deposition rates of mercury to forests and retention of mercury in watershed soils.
MICB MDN
1993
1994
1995
1996
1997
1998
1999
2000
2001
2002
2003
2004
2005
2006
2007
14
12
10
8
6
4
2
0
Annu
al H
g W
et-D
epos
ition
(ug
/m2 )
Year
Figure 25: Wet deposition of mercury at Underhill. There was no significant trend in deposition over the period.
Source: Miller et al. 2009
Reactive Gaseous Mercury (pg/m
3 )
Anthropogenic Hg2+
Emissions (g / y)
0
20
40
60
80
100
120
140
109 110 111 112 113 114 115 116
Reac
tive
Gas
eous
Mer
cury
(pg
/m3 )
Day of Year
Figure 26: High reactive gaseous mercury (RGM) levels in Vermont are due to the transport of air from emissions-dense regions to the south and west. The inset panel shows RGM measurements at VMC’s Underhill site, VT99, for seven days in 2007. The main panel shows the motion of air parcels for the 72 hours prior to their arrival at VT99 during the same period overlain on a map of RGM emissions. The gray squares show the air transport paths resulting in high RGM measurements. The blue and green circles (shown to the northwest and northeast of VT99) show the air transport paths resulting in low RGM concentrations in Vermont.
Source: RGM emissions courtesy of Mark Cohen, NOAA; map by Eric Miller
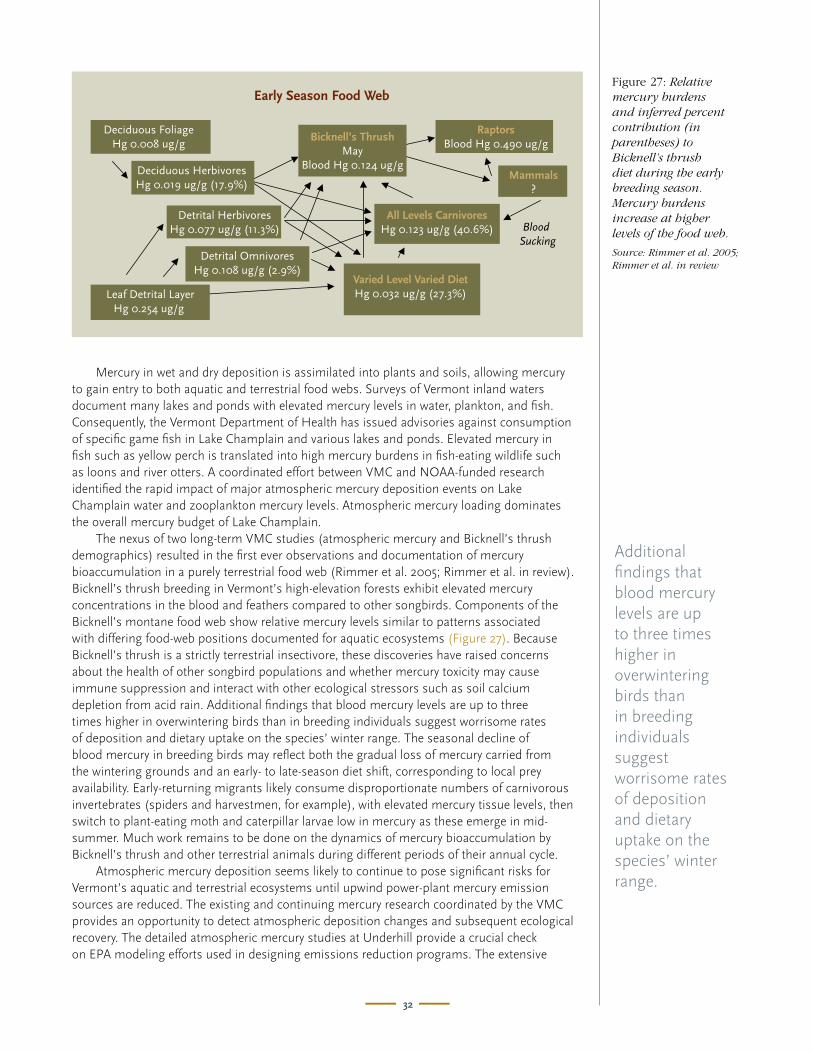
32
Mercury in wet and dry deposition is assimilated into plants and soils, allowing mercury to gain entry to both aquatic and terrestrial food webs. Surveys of Vermont inland waters document many lakes and ponds with elevated mercury levels in water, plankton, and fish. Consequently, the Vermont Department of Health has issued advisories against consumption of specific game fish in Lake Champlain and various lakes and ponds. Elevated mercury in fish such as yellow perch is translated into high mercury burdens in fish-eating wildlife such as loons and river otters. A coordinated effort between VMC and NOAA-funded research identified the rapid impact of major atmospheric mercury deposition events on Lake Champlain water and zooplankton mercury levels. Atmospheric mercury loading dominates the overall mercury budget of Lake Champlain. The nexus of two long-term VMC studies (atmospheric mercury and Bicknell’s thrush demographics) resulted in the first ever observations and documentation of mercury bioaccumulation in a purely terrestrial food web (Rimmer et al. 2005; Rimmer et al. in review). Bicknell’s thrush breeding in Vermont’s high-elevation forests exhibit elevated mercury concentrations in the blood and feathers compared to other songbirds. Components of the Bicknell’s montane food web show relative mercury levels similar to patterns associated with differing food-web positions documented for aquatic ecosystems (Figure 27). Because Bicknell’s thrush is a strictly terrestrial insectivore, these discoveries have raised concerns about the health of other songbird populations and whether mercury toxicity may cause immune suppression and interact with other ecological stressors such as soil calcium depletion from acid rain. Additional findings that blood mercury levels are up to three times higher in overwintering birds than in breeding individuals suggest worrisome rates of deposition and dietary uptake on the species’ winter range. The seasonal decline of blood mercury in breeding birds may reflect both the gradual loss of mercury carried from the wintering grounds and an early- to late-season diet shift, corresponding to local prey availability. Early-returning migrants likely consume disproportionate numbers of carnivorous invertebrates (spiders and harvestmen, for example), with elevated mercury tissue levels, then switch to plant-eating moth and caterpillar larvae low in mercury as these emerge in mid-summer. Much work remains to be done on the dynamics of mercury bioaccumulation by Bicknell’s thrush and other terrestrial animals during different periods of their annual cycle. Atmospheric mercury deposition seems likely to continue to pose significant risks for Vermont’s aquatic and terrestrial ecosystems until upwind power-plant mercury emission sources are reduced. The existing and continuing mercury research coordinated by the VMC provides an opportunity to detect atmospheric deposition changes and subsequent ecological recovery. The detailed atmospheric mercury studies at Underhill provide a crucial check on EPA modeling efforts used in designing emissions reduction programs. The extensive
Additional findings that blood mercury levels are up to three times higher in overwintering birds than in breeding individuals suggest worrisome rates of deposition and dietary uptake on the species’ winter range.
Early Season Food Web
Deciduous FoliageHg 0.008 ug/g
Deciduous HerbivoresHg 0.019 ug/g (17.9%)
Detrital HerbivoresHg 0.077 ug/g (11.3%)
Detrital OmnivoresHg 0.108 ug/g (2.9%)
Leaf Detrital LayerHg 0.254 ug/g
Bicknell’s ThrushMay
Blood Hg 0.124 ug/g
RaptorsBlood Hg 0.490 ug/g
All Levels CarnivoresHg 0.123 ug/g (40.6%)
Varied Level Varied DietHg 0.032 ug/g (27.3%)
Mammals?
Blood Sucking
Figure 27: Relative mercury burdens and inferred percent contribution (in parentheses) to Bicknell’s thrush diet during the early breeding season. Mercury burdens increase at higher levels of the food web.
Source: Rimmer et al. 2005; Rimmer et al. in review
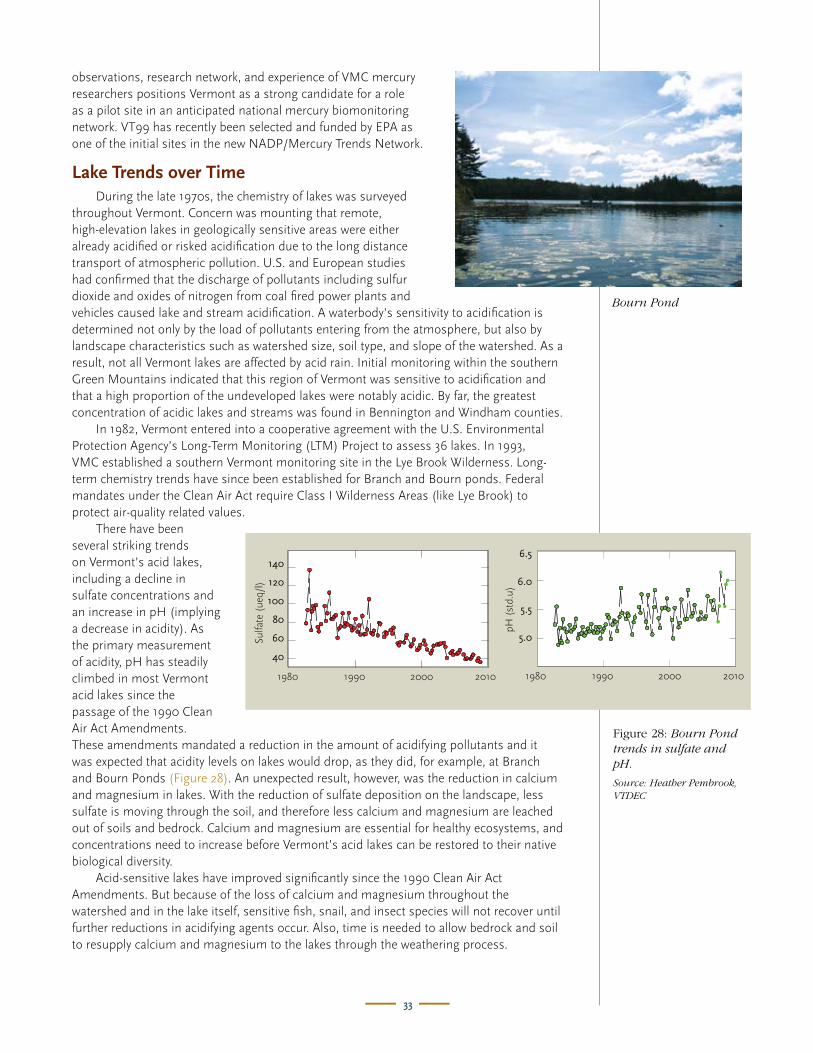
33
observations, research network, and experience of VMC mercury researchers positions Vermont as a strong candidate for a role as a pilot site in an anticipated national mercury biomonitoring network. VT99 has recently been selected and funded by EPA as one of the initial sites in the new NADP/Mercury Trends Network.
Lake Trends over Time During the late 1970s, the chemistry of lakes was surveyed throughout Vermont. Concern was mounting that remote, high-elevation lakes in geologically sensitive areas were either already acidified or risked acidification due to the long distance transport of atmospheric pollution. U.S. and European studies had confirmed that the discharge of pollutants including sulfur dioxide and oxides of nitrogen from coal fired power plants and vehicles caused lake and stream acidification. A waterbody’s sensitivity to acidification is determined not only by the load of pollutants entering from the atmosphere, but also by landscape characteristics such as watershed size, soil type, and slope of the watershed. As a result, not all Vermont lakes are affected by acid rain. Initial monitoring within the southern Green Mountains indicated that this region of Vermont was sensitive to acidification and that a high proportion of the undeveloped lakes were notably acidic. By far, the greatest concentration of acidic lakes and streams was found in Bennington and Windham counties. In 1982, Vermont entered into a cooperative agreement with the U.S. Environmental Protection Agency’s Long-Term Monitoring (LTM) Project to assess 36 lakes. In 1993, VMC established a southern Vermont monitoring site in the Lye Brook Wilderness. Long-term chemistry trends have since been established for Branch and Bourn ponds. Federal mandates under the Clean Air Act require Class I Wilderness Areas (like Lye Brook) to protect air-quality related values. There have been several striking trends on Vermont’s acid lakes, including a decline in sulfate concentrations and an increase in pH (implying a decrease in acidity). As the primary measurement of acidity, pH has steadily climbed in most Vermont acid lakes since the passage of the 1990 Clean Air Act Amendments. These amendments mandated a reduction in the amount of acidifying pollutants and it was expected that acidity levels on lakes would drop, as they did, for example, at Branch and Bourn Ponds (Figure 28). An unexpected result, however, was the reduction in calcium and magnesium in lakes. With the reduction of sulfate deposition on the landscape, less sulfate is moving through the soil, and therefore less calcium and magnesium are leached out of soils and bedrock. Calcium and magnesium are essential for healthy ecosystems, and concentrations need to increase before Vermont’s acid lakes can be restored to their native biological diversity. Acid-sensitive lakes have improved significantly since the 1990 Clean Air Act Amendments. But because of the loss of calcium and magnesium throughout the watershed and in the lake itself, sensitive fish, snail, and insect species will not recover until further reductions in acidifying agents occur. Also, time is needed to allow bedrock and soil to resupply calcium and magnesium to the lakes through the weathering process.
140
120
100
80
60
40
1980 1990 2000 2010
6.5
6.0
5.5
5.0
1980 1990 2000 2010
Bourn Pond
Figure 28: Bourn Pond trends in sulfate and pH.
Source: Heather Pembrook, VTDEC

34
Forest and Surface Water Critical Loads Vermont’s mountain ridges and deep glaciated valleys form a diverse landscape with widely varying geologic, climatic, and ecological zones. These biophysical contrasts coupled with differing land-use practices across the state lead to a complex mosaic of ecosystem tolerance for the effects of atmospheric deposition of sulfur and nitrogen. The critical load of sulfur plus nitrogen acidity is the level of deposition below which no harmful ecological effects occur for an ecosystem. The exceedance of the critical load is the difference between the critical load and current atmospheric deposition loading. The magnitude of the exceedance indicates the severity of ecosystem risk posed by sulfur and nitrogen deposition. The critical sulfur and nitrogen load for Vermont’s terrestrial ecosystems was established relative to the sustainability of the essential plant nutrients calcium, magnesium, and potassium, with data and collaboration provided by VMC (Miller et al. 2005). When these nutrients are lost in streamflow faster than they are supplied from precipitation and mineral weathering, inadequate levels of nutrients may develop in both soils and plants. Poor calcium nutrition underlies a wide range of forest health problems including reduced growth rates, inadequate plant response to climate stress, pest and pathogen stress, and increased mortality (Schaberg et al. 2008) as well as decreased breeding success of songbirds. The critical load for aquatic ecosystems was established with respect to the acid neutralizing capacity (ANC) of water, which in turn is related to pH (acidity) and levels of toxic aluminum (Pembrook 2003). Low pH and elevated aluminum impair the health and cause die-offs of many fish and plankton species, leading to a loss of diversity in aquatic ecosystems. The lowest critical loads in Vermont were found along the spine of the Green Mountains and in the Northeast Kingdom, where soils are developed in thin and patchy tills derived from rocks with low buffering capacity. Not surprisingly, this is where acid precipitation exceeded the critical loads by the greatest amount. Areas of calcium-rich rocks and soils scattered throughout the region support the highest critical loads where forests and surface waters are well buffered against acidic deposition. Total sulfur plus nitrogen deposition ranged widely across the state. High-elevation areas received the highest sulfur and nitrogen deposition due to orographically enhanced precipitation and cloud water inputs. Deposition was also high in the southern and western parts of the region due to their proximity to emission sources. Despite the substantial decrease in sulfur deposition documented in Vermont over the past 25 years, combined sulfur and nitrogen deposition during 1999-2003 continued to exceed the critical load for sulfur and nitrogen acidity for 30 percent of Vermont forests and 29 of 30 acid-sensitive ponds (Figure 29). Vermont’s 30 acid-sensitive ponds are found in areas of nutrient poor soils with high atmospheric deposition loads (Figure 30). While deposition had fallen below the critical load in one pond and within 6 percent of the critical load in two other monitored ponds by 2003, the anticipated biological recovery has been delayed in these waters due to coincident reductions in calcium concentrations, depriving aquatic animals of an essential nutrient.
Bourn Branch Little Mud (Winhall)
Excess Acid Deposition
Critical Load
meq
/m2/
yr
120
100
80
60
40
20
0
Figure 29: Yellow through red indicates where atmospheric deposition exceeds the critical load, thus potentially damaging forest ecosystems. In the years 1999-2003, the critical load for sulfur and nitrogen acidity was exceeded for 30 percent of Vermont forests and 29 of 30 acid-sensitive ponds (black circles).
Source: after Miller et al. 2005
Figure 30: Three of the thirty Vermont acid-sensitive ponds are within or adjacent to the Lye Brook Wilderness Area: Bourn,
Branch, and Little Mud Ponds. The top of each stacked bar represents the total annual acid input. The tan part of each bar
represents the Critical Load each pond can withstand without adverse biological effects. The brown part of each bar represents
the excess acid loading.

35
Soil Monitoring VMC has launched a very long-term soil study. The overall goal of the 200-year soil monitoring project is to use soils as a barometer for changes due to human-caused impacts, such as climate change and air pollution. The project will measure changes in soil properties, via sampling and lab analysis at intervals over the next 200 years, in forest settings where ecological processes like nutrient cycling, ecosystem development, and disturbance are not affected by human traffic. In 2000, basic reference soil sampling and analysis was conducted at three long-term study plots in Mt. Mansfield State Forest and two plots in the Lye Brook Wilderness area. The five long-term soil monitoring plots have glacial till soils that typify large forested areas in the Green Mountains, represent a range of forest cover types and elevation, and can be reached within a 30-minute hike. Each plot measures 50x50 meters and has relatively uniform slope, soils, and vegetation. The plan calls for soil sampling in 10 sub-plots each at years 0 (which was 2002), 5 (2007), 10, 20, 50, 100, 150, and 200. Soils are sampled by horizon, with analysis of selected chemical and physical properties by soil laboratories at Natural Resource Conservation Service, U.S. Forest Service, and UVM. Samples are being archived for later retrieval and analysis. From the first two sampling efforts, more than 400 soil samples have been collected for analysis and long-term storage. Initial investigations are focusing on detecting calcium depletion (due to continued acid deposition) and monitoring changes in mercury build-up. Long-term soil monitoring is a potentially valuable way to track the fate of atmospheric mercury deposition. Mercury is strongly bound to organic matter in soil (Figure 32), so that only a fraction of mercury deposition (roughly 10 percent) runs off in streamflow and enters the aquatic ecosystem. Thus mercury builds up in the soil, and it is uncertain whether this “legacy mercury” will eventually find its way to a stream in the decades and centuries to come. Monitoring mercury in the soil over this 200-year study will help to define how mercury storage, release, and vertical distribution in soils change as mercury deposition and soil carbon dynamics change over time. It will also provide a comparison of mercury build-up or release in soils in northern and southern Vermont.
100 200 300 400 500 600 700
Soil
Hg
conc
entr
atio
n, m
g kg
-1
0.8
0.7
0.6
0.5
0.4
0.3
0.2
0.1
0
r2 = 0.52
Soil C concentration, g kg-1
Figure 32: Mercury concentration in soils from the YEAR 0 sampling of the VMC long-term soil study shows a strong positive correlation to soil organic carbon concentration, reflecting the affinity of mercury for organic matter.
Source: Ross 2007
Vermont Acid Precipitation Monitoring Program (VAPMP) olunteer monitors from the VAPMP sample precipitation from three areas on Mt. Mansfield. These samples have revealed a distinct spatial pattern of acid deposition as storms typically pass from west to east over the Green Mountains (Figure 31). The most acidic rain occurs on the western slopes and mountain summit, and the least acidic rain occurs on the eastern side. Mountaintops receive greater precipitation and additional deposition from highly polluted cloud water and thus see much greater acid loading. Mountain areas are the least capable of neutralizing the acids due to their shallow soils, steep slopes, and poor buffering capacity of the bedrock geology.
Figure 31: Spatial pattern of precipitation pH (1980-2008) as air masses pass over Mt. Mansfield. Values for the Underhill and Mt. Mansfield sites are significantly different than the
Morrisville site to the east.
4.7
4.6
4.5
4.4
4.3
4.2
4.1
4.0
pH
Underhill Mt. Mansfield Morrisville
West East
A A
B
V

36
The success of the long-term soil monitoring project will depend in part on how well it responds to future challenges. The relevant environmental concerns can change over time; for example, atmospheric deposition of sulfur may become less of an issue, while soil warming and soil carbon storage may become bigger concerns in the next century.
Ozone Ground-level ozone pollution causes serious human health effects, which can be especially severe for individuals with existing cardiovascular or respiratory diseases. Ozone pollution also damages forest plants and agricultural crops by reducing plant growth and vigor, reducing seed production, and increasing susceptibility to insects and disease. As with humans, certain plants are especially sensitive to pollution. Black cherry, white ash, and yellow poplar are ozone-sensitive and show visible symptoms of injury following exposure to prolonged periods of ozone pollution. Unlike the human health effects which result from short-term, eight-hour peak concentrations, the effects of ozone on plant species occur from the cumulative effects of repeated exposures over the entire growing season. Ground-level ozone pollution has shown a gradual improvement over the past decade at sites in northern and southern Vermont. Biologically relevant ozone pollution is expressed in terms of a cumulative seasonal index. EPA scientific advisors recently suggested 7 ppm-hours as a threshold below which adverse effects on sensitive vegetation are substantially reduced. Ozone at the Underhill VMC site has dropped below the EPA threshold since 2000, while in southern Vermont, similar improvements were seen after 2002. These decreases in ground-level ozone have been accompanied by parallel and dramatic reductions in visible damage in ozone-sensitive plants (Figure 33). Plant injury in southern Vermont has been consistently greater, in keeping with the higher atmospheric ozone levels. These results show that our state and federal clean air strategies are working to reduce airborne concentrations of ozone pollution. Despite this progress, additional improvements are needed, since ozone-induced plant injury continues at southern Vermont sites, and since ozone damage can occur at concentrations below those that cause visible foliar injury.
In 2008, the EPA Clean Air Scientific Advisory Committee strongly encouraged the agency to set a cumulative ozone standard in the range of 7-15 ppm-hours to protect sensitive vegetation. (The former EPA administrator decided not to take this advice.) By combining two VMC long-term monitoring datasets—ozone concentrations in ambient air and foliar ozone injury—VMC cooperators have shown that foliar ozone injury in ozone-sensitive plants tracks cumulative seasonal ozone exposures, not isolated high ozone concentration events. VMC results further suggest that foliar ozone damage is substantially reduced when the ozone exposure falls below about 7 ppm-hours. These findings strongly support the recommendations of EPA’s scientific advisors, and should provide valuable information as a new EPA administrator reconsiders the adequacy of the current ozone standards.
14
13
12
11
10
9
8
7
6
5
4
3
2
1
01995 1996 1997 1998 1999 2000 2001 2002 2003 2004 2005 2006
20
18
16
14
12
10
8
6
4
2
03-
Year
Ave
rage
W12
6 O
zone
(pp
m-h
ours
)
3-Ye
ar A
vera
ge P
erce
nt P
lant
Inju
ry
Estimated OzoneInjury Threshold
Southern Vermont W126 OzoneSouthern Vermont % Plant Injury
Northern Vermont W126 OzoneNorthern Vermont % Plant Injury
Figure 33: Ground level ozone trends during the growing season for southern (Bennington) and northern (Underhill) Vermont. Trends in the percent of ozone sensitive plants with injury (curved lines, right axis) at monitoring sites in northern and southern Vermont, including VMC sites. Dry summers in 1995, 1999 and 2001 are partly responsible for lower ozone injury in those years.
Source: From VT Air Pollution Control Division and USFS/FIA
Ozone injury to white ash.

37
Recommendations Vermont has helped lead the nation in atmospheric deposition monitoring, and with that in mind the authors of this section recommend the following:
• VMCenvironmentalandbiologicalmonitoringeffortsshouldcontinuedespiterecent improvements in air quality. • ContinueVMCmonitoringoftotalandmethylmercuryinwetdeposition,ambient air mercury speciation, and dry deposition. These long-term datasets are essential for documenting changes in mercury deposition rates in response to emissions policies, and for continuing studies on mercury cycling in Vermont’s ecosystems. • VermontshouldcontinueseasonalchemicalmonitoringofBranchandBournPonds. These water bodies are ideal indicators to document trends resulting from emission reductions required by the Clean Air Act. Conversely, new sources of downwind emissions can degrade these water bodies and overwhelm any expected improvement. • Biologicalmonitoringofsensitiveaquaticgroupslikemayflies,clams,andsnails should be conducted every five years unless a change in water chemistry warrants more frequent analysis. Biological assessments can be examined on an ongoing basis as part of the present Long-Term Monitoring Project. • UseVMCdatatoinformnationalozonestandards.Acumulative,seasonalozone standard in the range of 7-15 ppm-hours will protect most sensitive vegetation.
Vermont has helped lead the nation in atmospheric deposition monitoring.
An Acid Rain Settlement
n the early 1970s, scientists observed high mortality of red spruce trees in Vermont and other northeastern states. In response to an early hypothesis that acid rain was damaging trees and the soils that supported them, programs were developed to monitor the chemistry of precipitation. Proctor Maple Research Center in Underhill was one of the first stations to begin long-term measurements in 1981. Precipitation chemistry combined with meteorological measurements did indeed reveal the “smoking gun”: sulfur emissions from electric generating facilities in the Midwest were the predominant cause of acidic deposition in Vermont. Without long-term observation of atmospheric chemistry, there would be no way to tell whether regulatory programs designed to clean up air pollution were working or not. In 2007, the EPA and eight northeastern states filed a lawsuit against a large utility company using data from Underhill and other northeastern sites. This company operates several power plants that predate the Clean Air Act Amendments of 1977, and thus were “grandfathered in” to operate without pollution controls. The lawsuit alleged that the utility was keeping these plants alive to avoid the costs of producing cleaner power. The data from Underhill helped provide compelling evidence, and the company settled out-of- court, agreeing to spend $4.6 billion to retrofit several old power plants. This process is a prime example of how VMC science has helped shape policy and safeguard human and ecosystem health.
I
Atmospheric samplers at Proctor Maple Research Center.

Selected VMC Projects and DatasetsProject Title Contact Location Duration
AIRAmbient Air Monitoring for Ozone Benjamin Whitney Mt. Mansfield 1986-present Bennington 1986-present Assessment of Dry Deposition Kathleen Weathers Lye Brook 2002-2007 Atmospheric Mercury Deposition Monitoring Eric Miller Mt. Mansfield 1992-present Basic Meteorological Monitoring: Colchester Reef Meteorology Carl Waite Lake Champlain 1996-present Proctor Maple Research Center Carl Waite Mt. Mansfield 1988-present Mt. Mansfield – mid slope (884m) Carl Waite Mt. Mansfield 1996-present Mercury Flux at PMRC Eric Miller Mt. Mansfield 2004-present NADP/National Trends Network Carl Waite Mt. Mansfield 1984-present Vermont Acid Precipitation Monitoring Program Heather Pembrook Mt. Mansfield 1980-present
FORESTAlpine plant communities Tammy Gilpatrick Mt. Mansfield 2000-2001 Eric Hazelton Rick Paradis Forest Ecosystem Management Demonstration Project: Silvicultural experimentation Bill Keeton Mt Mansfield 2001-present Soil and biodiversity responses Bill Keeton Mt Mansfield 2001-present Forest Health Monitoring Sandy Wilmot Lye Brook 1991-present Mt. Mansfield 1991-present Forest Damage Aerial Survey Barbara Burns Mt. Mansfield 1991-present Barbara Burns Lye Brook 1991-present Forest Pest Monitoring Trish Hanson Mt. Mansfield 1991-present Long-term vegetation monitoring William Howland Mt. Mansfield 1991-1995 Tree Phenology Monitoring Sandy Wilmot Mt. Mansfield 1991-present
SOILSoil Climate Analysis Network Sites: Soil Thomas Villars Lye Brook 2000-present Thomas Villars Mt. Mansfield 2000-present Meteorology Thomas Villars Lye Brook 2000-present Thomas Villars Mt. Mansfield 2000-present Long-term Soil Monitoring: Sampling Thomas Villars Lye Brook & 1999-present Scott Bailey Mt. Mansfield 1999-present Don Ross Long-term Soil Monitoring: Soil Mercury Thomas Villars Lye Brook & 1999-present Scott Bailey Mt. Mansfield 1999-present Don Ross 1999-present
WATERBiological & Chemical Survey of Selected Surface Waters in Lye Brook Macroinvertebrate communities Jim Kellogg Lye Brook 1993-1995 Long-term Water Quality & Biological Monitoring Project for Lake Champlain Eric Smeltzer Lake Champlain 1992-present Paired Watershed Study on the East Slope of Mt. Mansfield: Hydrologic Monitoring Jamie Shanley Mt. Mansfield 2000-present Jon Denner Stream Chemistry of Ranch Brook and West Branch Beverley Wemple Mt. Mansfield 2000-present Don Ross
WILDLIFEAmphibian Survey & Monitoring Jim Andrews Lye Brook 1991-present Mt. Mansfield 1991-present Abby Pond 1991-present Bicknell’s thrush Population Demographics and Ecology: Assessing Levels of Methyl Mercury in Montane Forest Bird Community Chris Rimmer Mt. Mansfield 2000-present Kent McFarland Ski Resort Development Effects on Montane Forest Bird Community Kent McFarland Stratton Mt. 1995-1997 Mt. Mansfield 1995-1997 Forest Bird Surveys Steven Faccio Lye Brook 1991-present Mt. Mansfield 1991-present Insect Diversity on Mt. Mansfield Scott Griggs Mt. Mansfield 2000 John Grehan Mt. Mansfield 1990-1995 James Boone Mt. Mansfield 1991-1994
38

39
Resources
The Vermont Monitoring Cooperative maintains a data library containing more than 300 research and monitoring projects and datasets. For more information, visit the VMC web site: www.uvm.edu/vmc.
Literature Cited
American Meteorological Society Glossary of Meteorology. 2000. http://amsglossary.allenpress.com/glossary.
Botkin, D.B., et al. 1972. Some ecological consequences of a computer model of forest growth. Journal of Ecology. 60:849-872.
Cogbill, C.V., P.S. White. 1991. The latitude-elevation relationship for spruce-fir forest and treeline along the Appalachian Mountain chain. Vegetation. 94:153–175
Dupigny-Giroux, L-A. 2002. Climate variability and socioeconomic consequences of Vermont’s natural hazards: a historical perspective. Vermont History, Volume 70, Winter/Spring, pp. 19-39.
EPA. 1999. Vermont State Program Unit of the Environmental Protection Agency. Keeping in touch, September report, 1999.
Freedman, J.M., D.R. Fitzjarrald, K.E. Moore, R.K. Sakai. 2001. Boundary layer clouds and vegetation-atmosphere feedbacks. Journal of Climate. 14(2), 180-197.
Hagen, Kimberly. 1999. The effects of ski area development on populations of stream salamanders in central Vermont. M.S. thesis. Antioch University New England.
Harmon, M. E. and B. Marks. 2002. Effects of silvicultural practices on carbon stores in Douglas-fir-western hemlock forests in the Pacific Northwest, USA: results from a simulation model. Canadian Journal of Forest Research. 32:863-877.
Hayhoe K., C. Wake, J. Bradbury, et al. 2007. Past and future changes in climate and hydrological indicators in the U.S. Northeast. Climate Dynamics. 28:381-407.
Holmgren, A. 2002. The territorial response of six songbirds to ski trails at Smugglers’ Notch Resort and Stowe Mountain Resort, Vermont. Senior Thesis. University of Vermont.
Keeler, G.J., L.E.Gratz, K. Al-Wali. 2005. Long-term atmospheric mercury wet deposition at Underhill,Vermont. Ecotoxicology. 14, 71-83.
Keeton, W.S. 2006. Managing for late-successional/old-growth characteristics in northern hardwood-conifer forests. Forest Ecology and Management. 235: 129-142.
Keeton, W.S. and A. R. Troy. 2006. Balancing ecological and economic objectives while managing for late-successional forest structure. L. Zahvoyska, editor. Ecologisation of economy as a key prerequisite for sustainable development. Proceedings, Sept. 22 -23, 2005. Ukrainian National Forestry University, L’viv, Ukraine.
Keeton, W.S., C.E. Kraft, D.R. Warren. 2007b. Mature and old-growth riparian forests: Structure, dynamics, and effects on Adirondack stream habitats. Ecological Applications. 17:852-868.
Kelley, R.S., J. Lackey, E.L. Smith, B. Frament, F. Peterson. 2002. The Health of Vermont’s Hardwood Resource: 1985-2001. Vermont Department of Forests, Parks and Recreation.
Lambert, J.D., K.P. McFarland, C.C. Rimmer, S.D. Faccio, J. L. Atwood. 2005. A practical model of Bicknell’s Thrush distribution in the northeastern United States. Wilson Bulletin. 117:1-11.
Luyssaert, S., E.D. Schulze, A. Borner, A. Knohl, D. Hessenmoller, B.E. Law, P. Ciais, J. Grace. 2008. Old-growth forests as global carbon sinks. Nature. 455:213-215.
Malmsheimer, R.W., P. Heffernan, S. Brink, D. Crandall, F. Deneke, C. Galik, E. Gee, J. A. Helms, N. McClure, N. Mortimer, S. Ruddell, M. Smith, J. Stewart. 2008. Preventing Greenhouse Gas Emissions through Wood Substitution. Journal of Forestry.106:132-135.
McGee, G.G., D.J. Leopold, R. D. Nyland. 1999. Structural characteristics of old-growth, maturing, and partially cut northern hardwood forests. Ecological Applications. 9:1316-1329.
Miller, E.K. 2005. Assessment of forest sensitivity to nitrogen and sulfur deposition in New Hampshire and Vermont. Final Technical Report. NH Dept. of Environmental Services. 19pp.
Miller, E.K., M.B. Burkins, R. Poirot, J. Shanley, S. Lawson, C. Waite, M. Pendelton, A. VanArsdale, M. Cohen. 2009. Atmospheric mercury in Vermont and New England: ambient air mercury speciation studies. Final Report to USEPA-ORD-HEASD.
Min, Q. and S. Wang. 2008. Clouds modulate terrestrial carbon uptake in a midlatitude hardwood forest. Geophysical Research Letters. 35, L02406.

40
Mladenoff, D.J. and J. Pastor. 1993. Sustainable forest ecosystems in the northern hardwood and conifer forest region: concepts and management. In: G.H. Aplet et al. (eds.). Defining Sustainable Forestry. Island Press.
North, M.P. and W.S. Keeton. 2008. Emulating natural disturbance regimes: an emerging approach for sustainable forest management. In R. Lafortezza et al., editors. Patterns and Processes in Forest Landscapes-Multiple Use and Sustainable Management. Springer.
Nunery, J.S. and W.S. Keeton. In review. Forest carbon storage in the northeastern United States: effects of harvesting frequency and intensity including wood products.
Ollinger S.V., J.D. Aber, C.A. Federer, et al. 1995. Modeling the physical and chemical climatic variables across the northeastern U.S. for a Geographic Information System. USDA Forest Service General Technical Report. NE-1913.
Pembrook, H. 2003. Calculating critical loads of acidity and exceedances for acid-impaired lakes in Vermont using the Steady State Water Chemistry (SSWC) model. Appendix A of Vermont Dept. of Environmental Conservation TMDL for 30 acid impaired lakes. Ray, D.G., R.S. Seymour, N.S. Scott, W.S. Keeton. 2009. Mitigating climate change with managed forests: balancing expectations, opportunity, and risk. Journal of Forestry. January/February Issue: 50-51. Rimmer, C.C., K.P. McFarland, J.D. Lambert, R.B. Renfrew. 2004. Evaluating the use of Vermont ski areas by Bicknell’s Thrush: applications for Whiteface Mountain, New York. Vermont Institute of Natural Science. Woodstock, VT.
Rimmer, C.C., K.P. McFarland, D.C. Evers, E.K. Miller, Y. Aubry, D. Busby, and R.J. Taylor. 2005. Mercury concentrations in Bicknell’s Thrush and other insectivorous passerines in montane forests of northeastern North America. Ecotoxicology. 14:223-240.
Rimmer, C.C., E.K. Miller, K.P. McFarland, R.J. Taylor, S.D. Faccio. In review. Mercury bioaccumulation and trophic transfer in the terrestrial food web of a montane forest.
Rhemtulla, J.M., D. J. Mladenoff, M.K. Clayton. 2009. Historical forest baselines reveal potential for continued carbon sequestration. Proceedings of the National Academy of Sciences. 106: 6082-6087. Rodenhouse, N.L., S.N. Matthews, K.P. McFarland, J.D. Lambert, L.R. Iverson, A. Prasad, T.S. Sillett, R.T. Holmes. 2008. Potential effects of climate change on birds of the Northeast. Mitigation and Adaptation Strategies for Global Change. 13: 517-540.
Ross, D.S., 2007. A carbon-based method for estimating the wetness of forest surface soil horizons. Canadian Journal of Forest Resources. 37:846:852.
Ruddell, S., R. Sampson, M. Smith, R. Giffen, J. Cathcart, J. Hagan, D. Sosland, J. Godbee, J. Heissenbuttel, S. Lovett, J. Helms, W. Price, R. Simpson. 2007. The role for sustainably managed forests in climate change mitigation. Journal of Forestry. 105:314-319.
Schaberg, P.G., Miller, E.K., Eagar, C. 2008. Assessing the threat that anthropogenic calcium depletion poses to forest health and productivity. USDA Forest Service General Technical Report. Southern and Pacific Northwest Research Stations. Also in: www.threats.forestencyclopedia.net.
Shanley, J. B. and B. Wemple. 2009. Water quality and quantity in the mountain environment. In J. E. Milne et al., editors. Mountain Resorts: Ecology and the Law. Ashgate Publishing.
Spear, R.W. 1989. Late-quaternary history of high-elevation vegetation in the White Mountains of New Hampshire. Ecological Monographs. 59:125-151.
Still, C.J. et al. 2009. The influence of clouds and diffuse radiation on ecosystem-atmosphere CO2 and CO18O exchanges. Journal of Geophysical Research-Biogeosciences. 114, G01018, doi:10.1029/2007JG000675.
Strong, A.M., C.C. Rimmer, K.P. McFarland, K. Hagan. 2009. Effects of mountain resorts on wildlife. In J. E. Milne et al., editors. Mountain Resorts: Ecology and the Law. Ashgate Publishing.
Strong, Allan. Unpublished data. University of Vermont.
UCS (Union of Concerned Scientists). 2006. Climate change in the U.S. Northeast: a report of the Northeast climate impacts assessment. UCS Publications.
Vermont Department of Forests, Parks & Recreation. 1999. In: A forest that works for all: the Vermont forest resource plan, 1999-2008. Wemple, B., J.B. Shanley, J. Denner, D. Ross, K. Mills. 2007. Hydrology and water quality in two mountain basins of the northeastern U.S.: assessing baseline conditions and effects of ski area development. Hydrological Processes. 21: 1639-1650. Wharton, E.H., R.H. Widmann, C.H. Barnett, T.S. Frieswyk, A.J. Lister, B. DeGeus. 2003. The forests of the Green Mountain State. Resource Bulletin NE-158. USDA Forest Service, Northeastern Research Station. Wilmot, S., M. Stuart, T. Villars, D. Ross, J. Juillerat, E. Engstrom. 2008. Vermont forest soil carbon map (unpublished).

Acknowledgments
The Vermont Monitoring Cooperative would like to thank the three people who supervised all aspects of this project: Larry Forcier and Carl Waite of the University of Vermont, and Barbara Burns of the Vermont Department of Forests, Parks and Recreation. Six VMC Cooperators took leadership roles in producing the report’s three sections: Beverley Wemple and Sandy Wilmot (The Health of Our Forests); Lesley-Ann Dupigny-Giroux and Christopher Still (Weather and Climate in Vermont); and Eric Miller and Jamie Shanley (Monitoring Atmospheric Deposition).
Additionally, VMC thanks its many Cooperators, past and present, who have entrusted VMC with their data and donated, in many cases, their time and expertise for the betterment of Vermont and beyond, and its Stakeholders, some of whom helped guide the production of this report and are the real reason for VMC’s existence.
Finally, VMC would like to give special thanks and recognition to Jennifer Jenkins and Sean Lawson, both of whom were instrumental in initiating and moving forward the idea and process that has culminated in this report, and David Sleeper for his excellent leadership, experience, and guidance that has made production of this report possible.
Funding for this project was provided by the USDA Forest Service State & Private Forestry, Forest Health Protection.
Project Manager and Editor: David Sleeper, Sleeper Associates LLC
Report design: RavenMark, Inc.
Printing: Queen City Printers, Inc.
Report Photos: (Cover Photos) Large photo: Emily Sloan; inset photos: Sandy Wilmot, Jim Andrews, Ron Kelley, and Ejla Page 2: Sandy Wilmot Page 3: Sandy Wilmot Page 4: Top: Sandy Wilmot; bottom: Heather Pembrook Page 5: Bryan Pfeiffer/www.wingsphotography.com/ Page 7: Ron Kelley Page 9: Kent McFarland Page 13: Ron Kelley Page 18: top, Amy Alfieri; bottom: both C. Slesar Page 19: John Chenger Page 20: Ejla Page 21: Carl Waite Page 24: Sandy Wilmot Page 25: Jim Andrews Page 26: Ron Kelley Page 28: Bryan Pfeiffer/www.wingsphotography.com/ Page 29: VMC Page 30: VMC Page 33: Kellie Merrell Page 36: Gretchen Smith Page 37: VMC Inside back cover: Emily Sloan
The stock used for this report is FSC certified...

705 Spear Street South Burlington, VT 05403
(802) 656-0683
www.uvm.edu/vmc