vertical profiles of cloud condensation nuclei, aerosol ... · vertical profiles of cloud...
TRANSCRIPT
Vertical profiles of cloud condensation nuclei, aerosol hygroscopicity, water uptake, and scattering across the
United States
J. J. Lin1, A. Bougiatioti1,3, A. Nenes1,2, B.E. Anderson4, A. Beyersdorf4, C.A. Brock5,6, T.Gordon5,6, D.A. Lack5,6, D. Law5, J. Liao5,6, R.H. Moore4,
A.M. Middlebrook5, M.S. Richardson5,6, K.L. Thornhill7, N.L. Wagner5,6, A. Welti5,6†, E. Winstead7, L. Ziemba4
1Georgia Tech, Atlanta, GA; 2School of Chemical and Biomolecular Engineering, Georgia Tech, Atlanta, GA; 3National Technical University of Athens, Zografou Campus, Athens, Greece; 4NASA Langley Research Center, Hampton, VA; 5NOAA Earth System Research Laboratory, Boulder, CO; 6CIRES, University of Colorado Boulder,
Boulder, CO; 7Science System and Application, Inc., Hampton, VA; †Now at Institute for Atmosphere and Climate, ETH Zürich, Switzerland
Acknowledgments: NOAA, NASA, EPA
Introduction
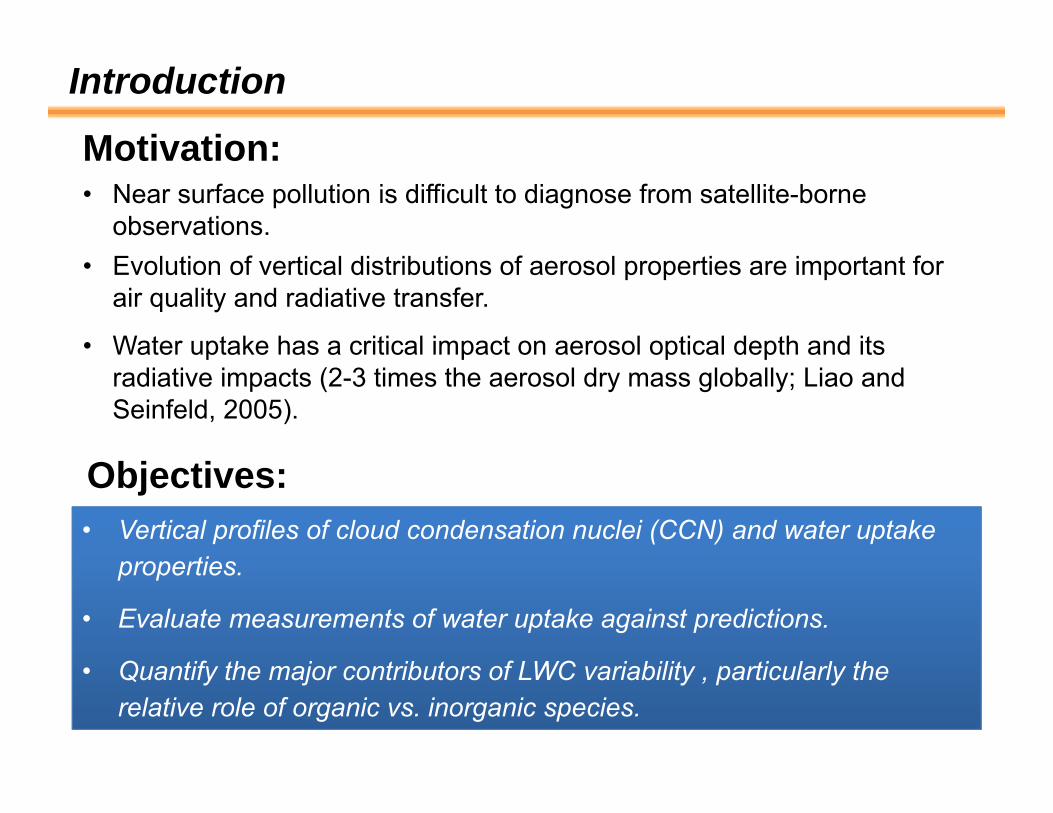
Motivation:• Near surface pollution is difficult to diagnose from satellite-borne
observations.• Evolution of vertical distributions of aerosol properties are important for
air quality and radiative transfer.
• Water uptake has a critical impact on aerosol optical depth and its radiative impacts (2-3 times the aerosol dry mass globally; Liao and Seinfeld, 2005).
Objectives:• Vertical profiles of cloud condensation nuclei (CCN) and water uptake
properties.
• Evaluate measurements of water uptake against predictions.
• Quantify the major contributors of LWC variability , particularly the relative role of organic vs. inorganic species.
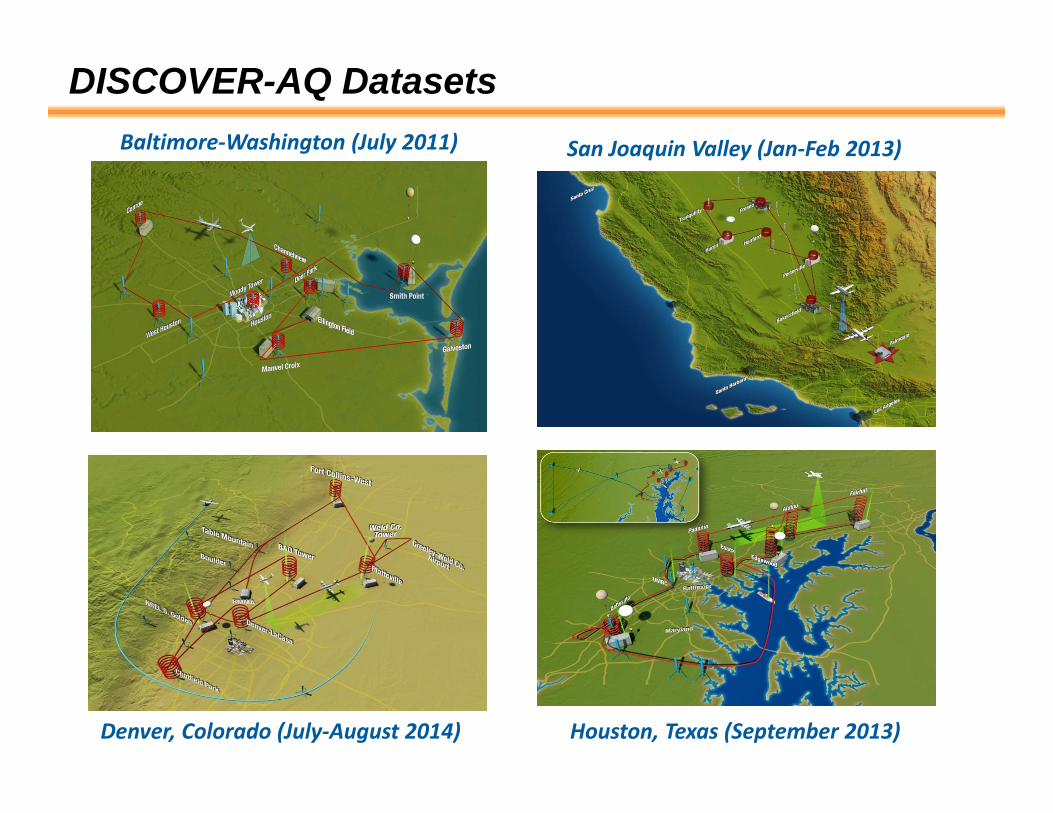
DISCOVER-AQ Datasets
Houston, Texas (September 2013) Denver, Colorado (July‐August 2014)
San Joaquin Valley (Jan‐Feb 2013)Baltimore‐Washington (July 2011)
Experimental methods: Data from DISCOVER-AQ
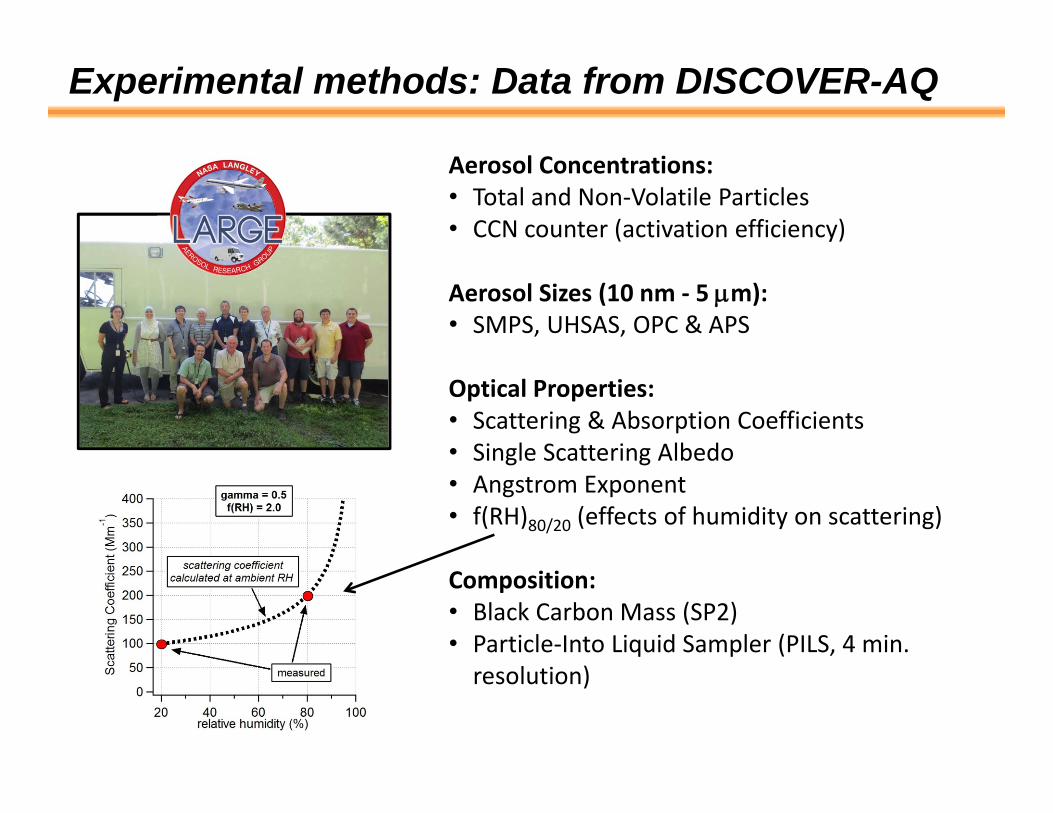
Aerosol Concentrations:• Total and Non‐Volatile Particles• CCN counter (activation efficiency)
Aerosol Sizes (10 nm ‐ 5 m):• SMPS, UHSAS, OPC & APS
Optical Properties:• Scattering & Absorption Coefficients• Single Scattering Albedo• Angstrom Exponent• f(RH)80/20 (effects of humidity on scattering)
Composition:• Black Carbon Mass (SP2)• Particle‐Into Liquid Sampler (PILS, 4 min. resolution)
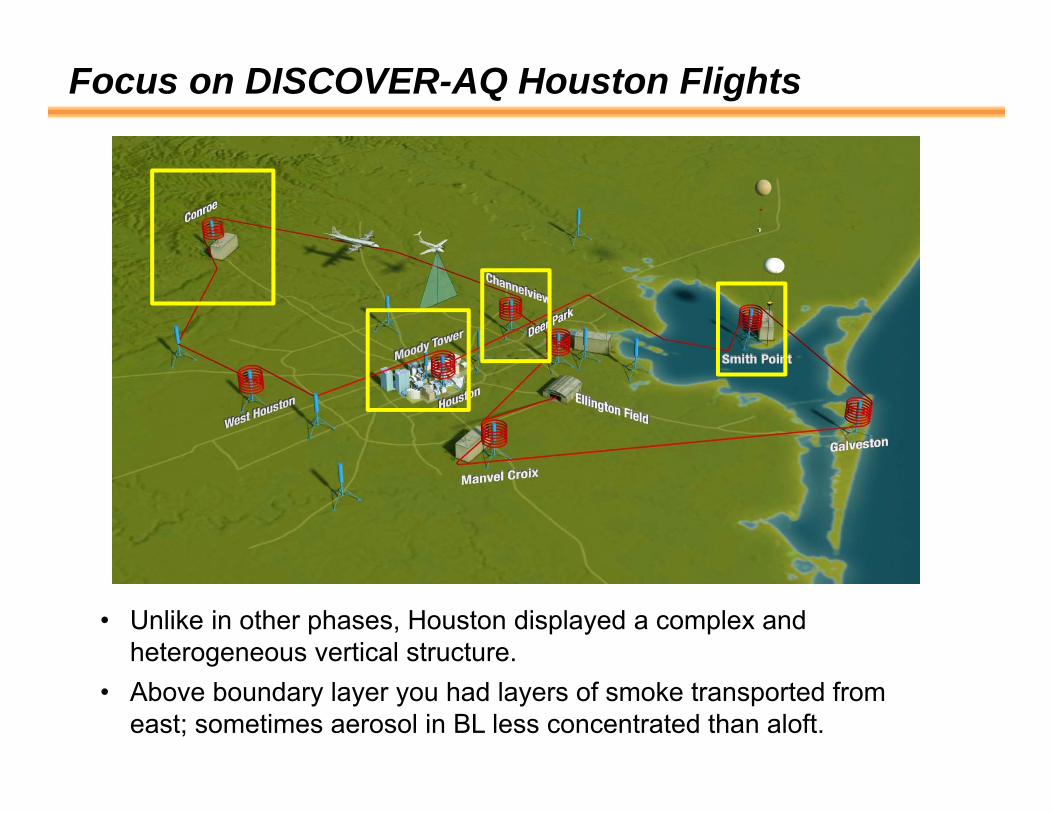
Focus on DISCOVER-AQ Houston Flights
• Unlike in other phases, Houston displayed a complex and heterogeneous vertical structure.
• Above boundary layer you had layers of smoke transported from east; sometimes aerosol in BL less concentrated than aloft.
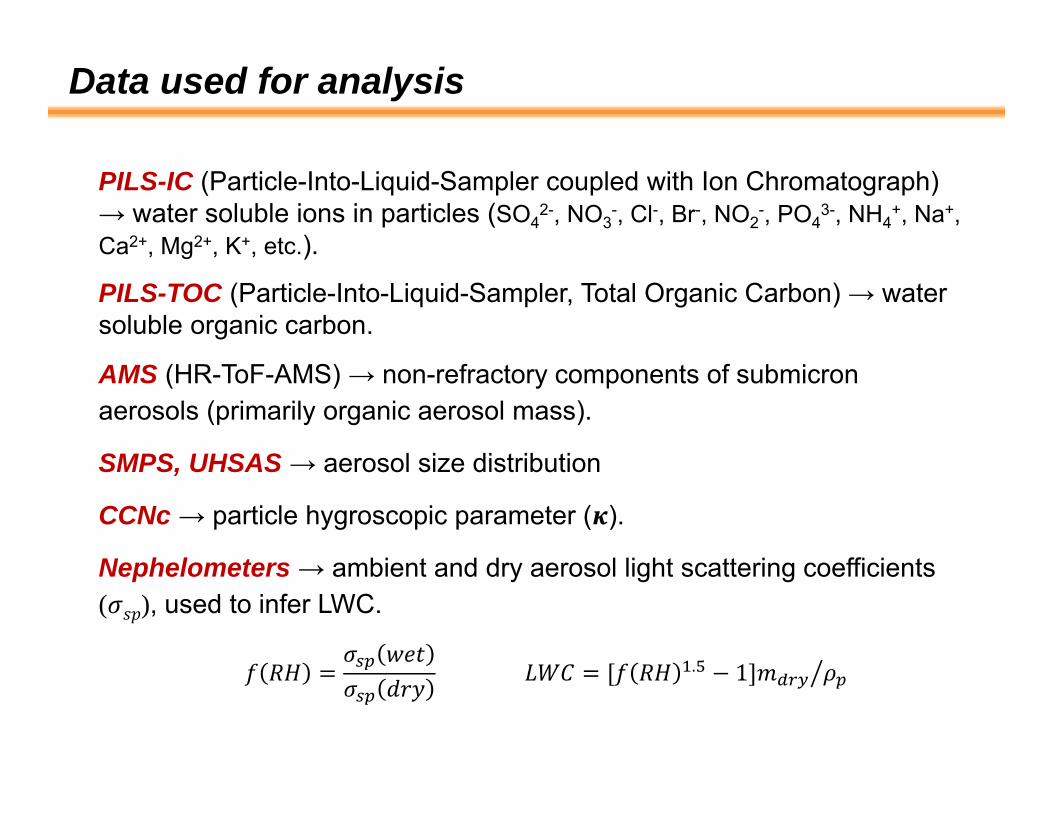
Data used for analysis
PILS-IC (Particle-Into-Liquid-Sampler coupled with Ion Chromatograph) → water soluble ions in particles (SO4
2-, NO3-, Cl-, Br-, NO2
-, PO43-, NH4
+, Na+, Ca2+, Mg2+, K+, etc.).
PILS-TOC (Particle-Into-Liquid-Sampler, Total Organic Carbon) → water soluble organic carbon.
AMS (HR-ToF-AMS) → non-refractory components of submicron aerosols (primarily organic aerosol mass).
SMPS, UHSAS → aerosol size distribution
CCNc → particle hygroscopic parameter ( ).
Nephelometers → ambient and dry aerosol light scattering coefficients ( ), used to infer LWC.
. 1
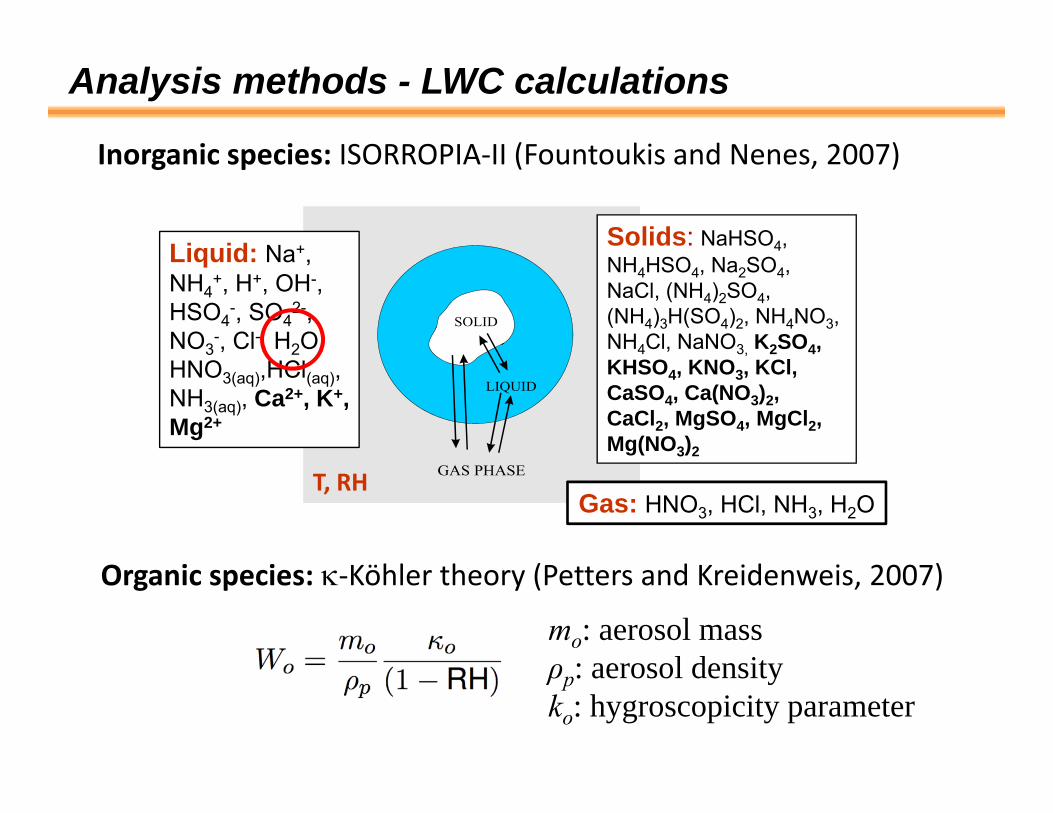
Analysis methods - LWC calculations
Gas: HNO3, HCl, NH3, H2O
Liquid: Na+, NH4
+, H+, OH-, HSO4
-, SO42-,
NO3-, Cl-, H2O,
HNO3(aq),HCl(aq), NH3(aq), Ca2+, K+, Mg2+
http://nenes.eas.gatech.edu/ISORROPIA
Solids: NaHSO4, NH4HSO4, Na2SO4, NaCl, (NH4)2SO4, (NH4)3H(SO4)2, NH4NO3, NH4Cl, NaNO3, K2SO4, KHSO4, KNO3, KCl, CaSO4, Ca(NO3)2, CaCl2, MgSO4, MgCl2, Mg(NO3)2
Inorganic species: ISORROPIA‐II (Fountoukis and Nenes, 2007)
Organic species: ‐Köhler theory (Petters and Kreidenweis, 2007)
T, RH
mo: aerosol massρp: aerosol densityko: hygroscopicity parameter
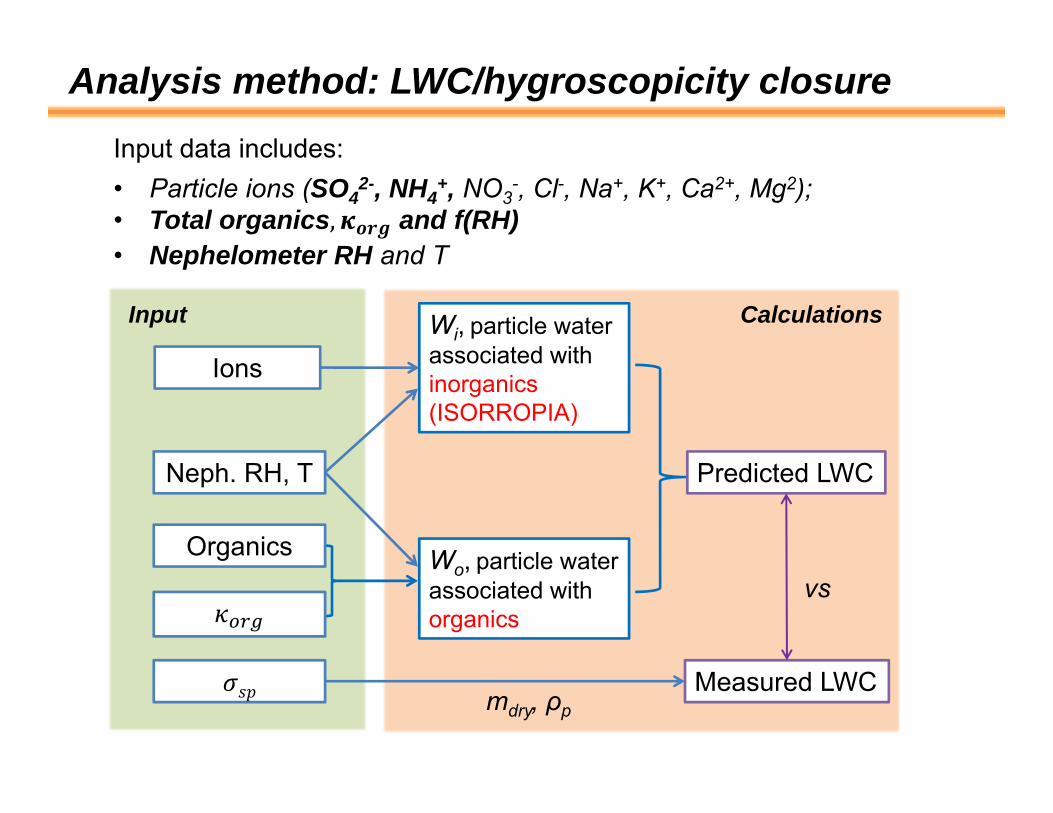
Analysis method: LWC/hygroscopicity closure
IonsWi, particle water associated with inorganics (ISORROPIA)
Input data includes:• Particle ions (SO4
2-, NH4+, NO3
-, Cl-, Na+, K+, Ca2+, Mg2);• Total organics, and f(RH)• Nephelometer RH and T
Measured LWC
Wo, particle water associated with organics
Predicted LWC
mdry, ρp
Organicsvs
Input
Neph. RH, T
Calculations
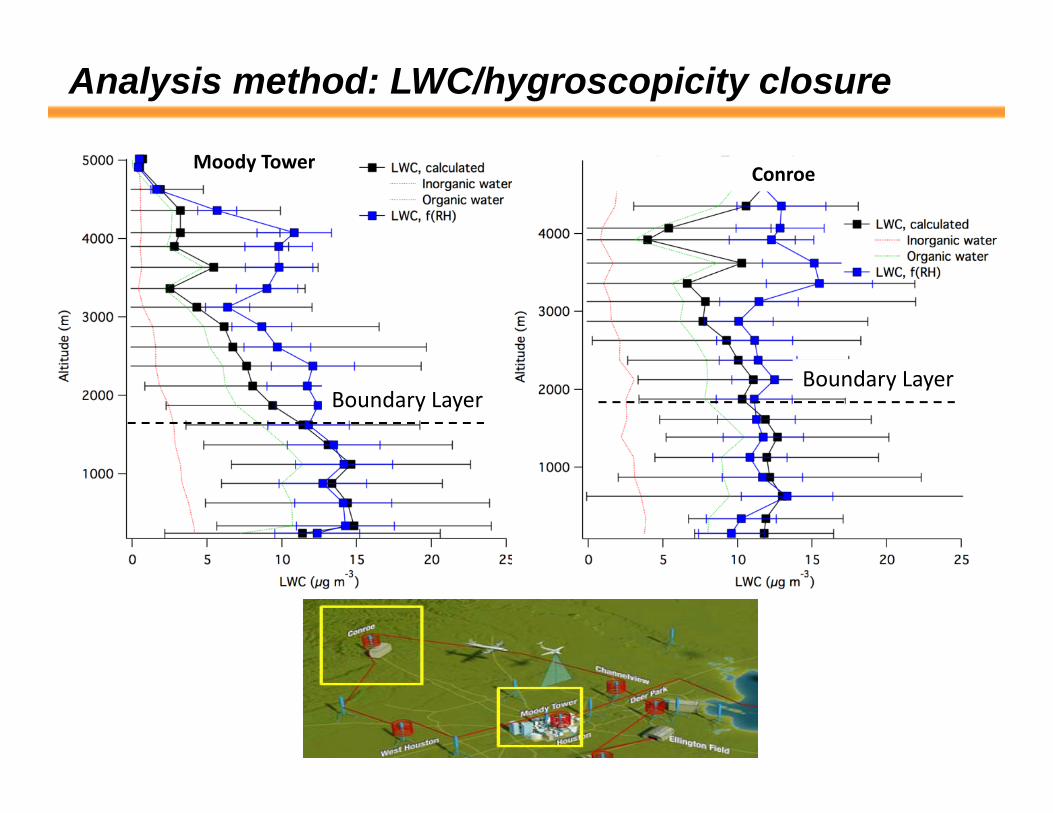
Analysis method: LWC/hygroscopicity closure
Moody Tower Conroe
Boundary Layer Boundary Layer
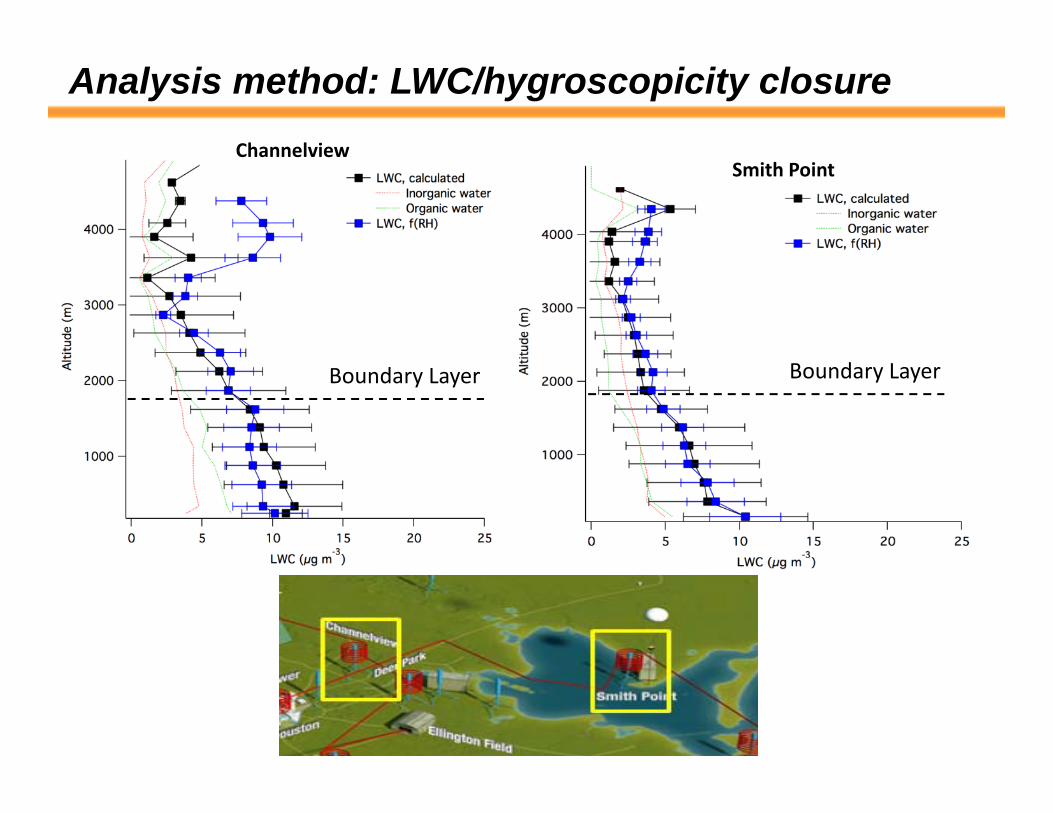
Analysis method: LWC/hygroscopicity closureChannelview
Smith Point
Boundary Layer Boundary Layer
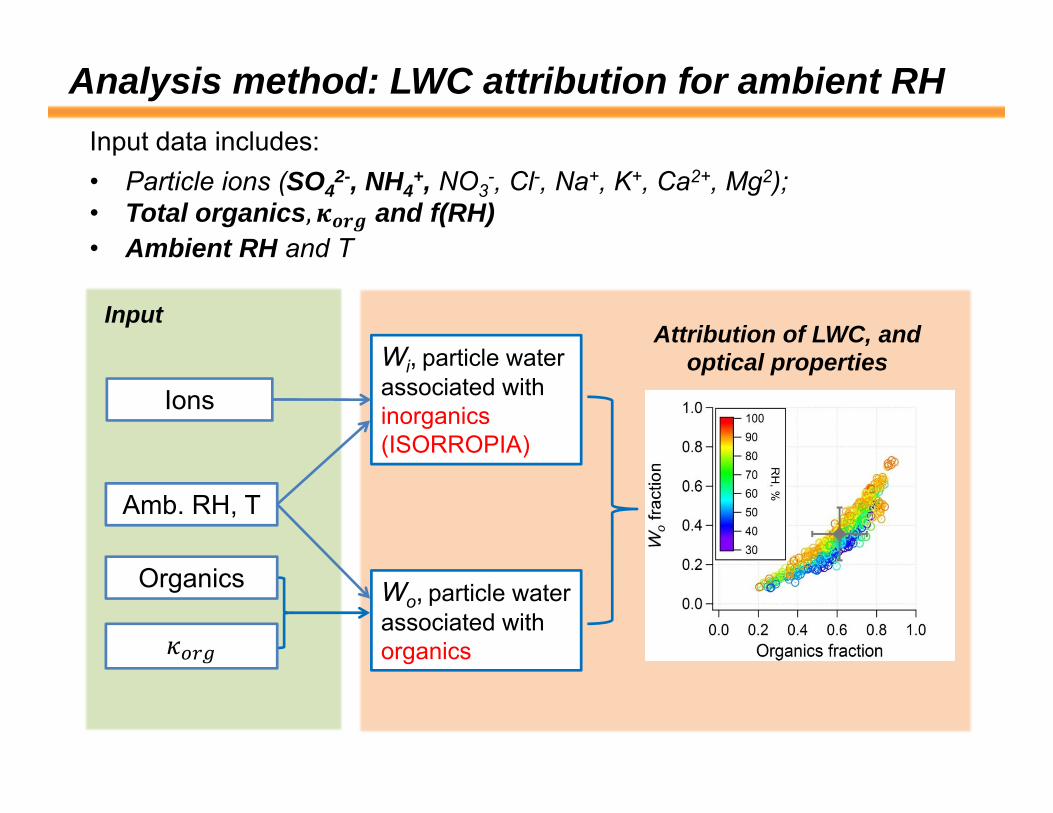
Analysis method: LWC attribution for ambient RH
IonsWi, particle water associated with inorganics (ISORROPIA)
Input data includes:• Particle ions (SO4
2-, NH4+, NO3
-, Cl-, Na+, K+, Ca2+, Mg2);• Total organics, and f(RH)• Ambient RH and T
Wo, particle water associated with organics
Organics
Input
Amb. RH, T
Attribution of LWC, and optical properties
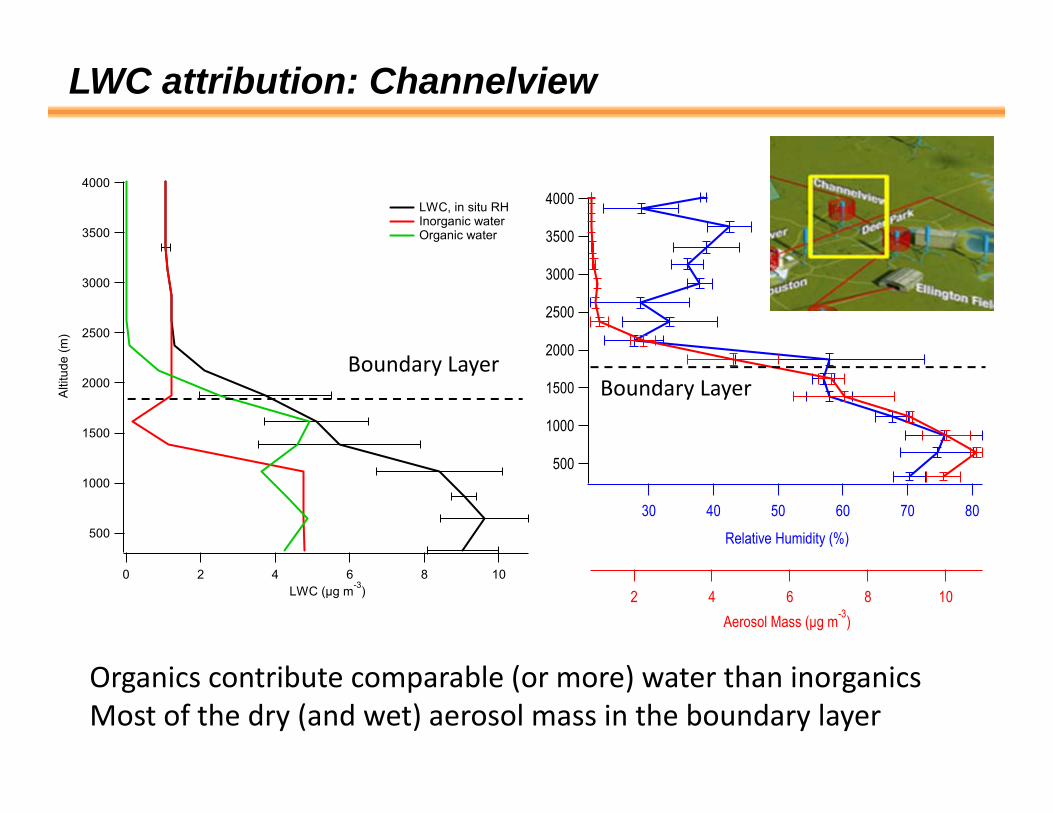
LWC attribution: Channelview
4000
3500
3000
2500
2000
1500
1000
500
807060504030
Relative Humidity (%)
108642Aerosol Mass (µg m-3)
4000
3500
3000
2500
2000
1500
1000
500
Alti
tude
(m)
1086420LWC (µg m-3)
LWC, in situ RH Inorganic water Organic water
Organics contribute comparable (or more) water than inorganicsMost of the dry (and wet) aerosol mass in the boundary layer
Boundary Layer Boundary Layer
4000
3000
2000
1000
807060504030
Relative Humidity (%)
6040200Aerosol Mass (µg m-3)
Boundary Layer
4000
3000
2000
1000
Alti
tude
(m)
50403020100LWC (µg m-3)
LWC, ambient RH Inorganic water Organic water
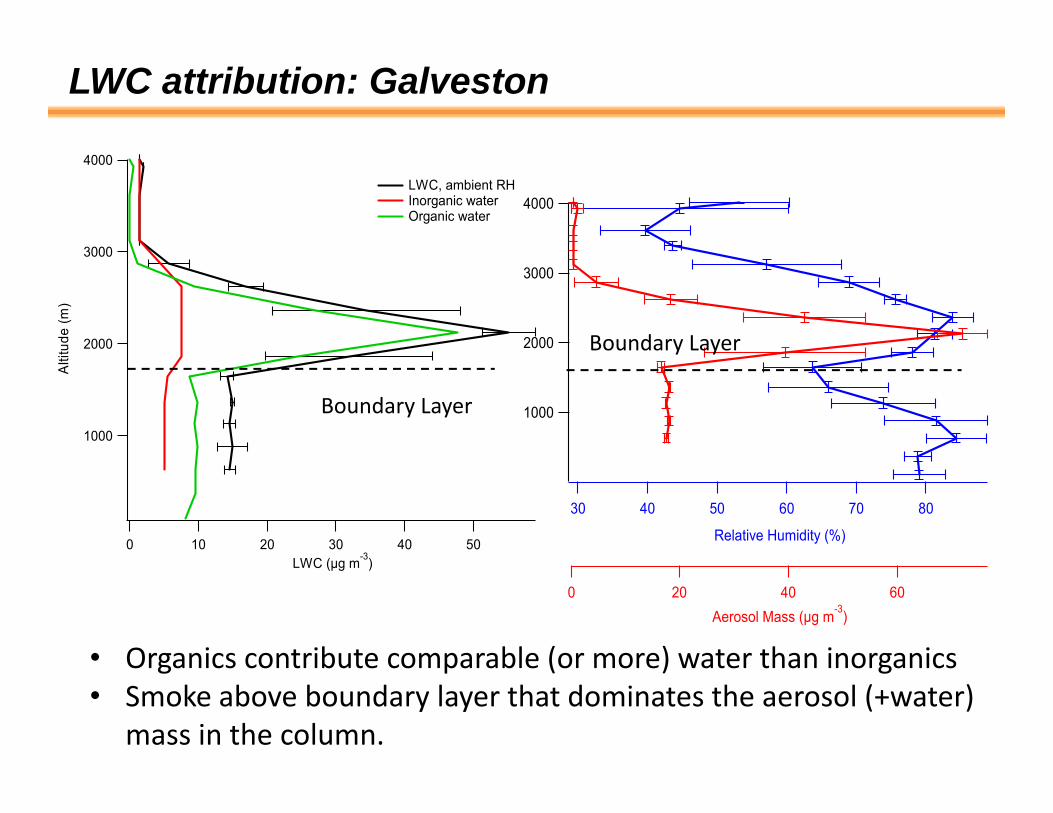
LWC attribution: Galveston
• Organics contribute comparable (or more) water than inorganics• Smoke above boundary layer that dominates the aerosol (+water)
mass in the column.
Boundary Layer
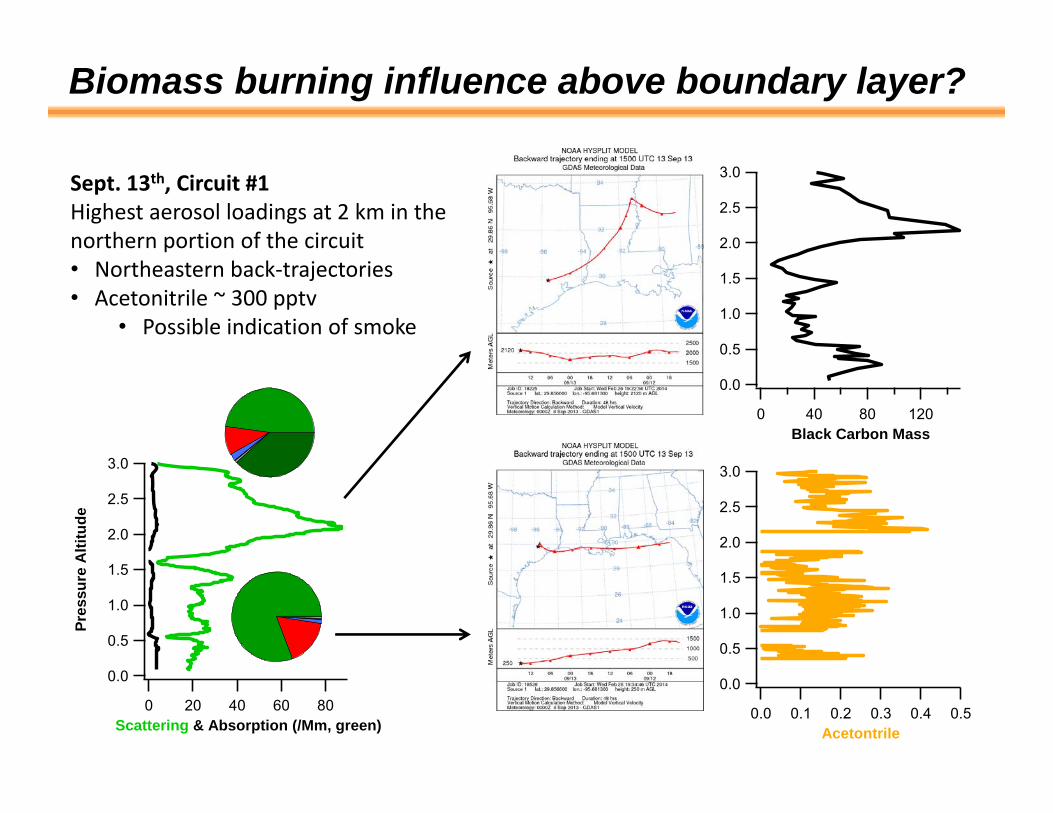
Biomass burning influence above boundary layer?
Sept. 13th, Circuit #1Highest aerosol loadings at 2 km in the northern portion of the circuit• Northeastern back‐trajectories • Acetonitrile ~ 300 pptv
• Possible indication of smoke
3.0
2.5
2.0
1.5
1.0
0.5
0.0
Pres
sure
Alti
tude
806040200Scattering & Absorption (/Mm, green)
3.0
2.5
2.0
1.5
1.0
0.5
0.0
12080400Black Carbon Mass
3.0
2.5
2.0
1.5
1.0
0.5
0.0
0.50.40.30.20.10.0Acetontrile
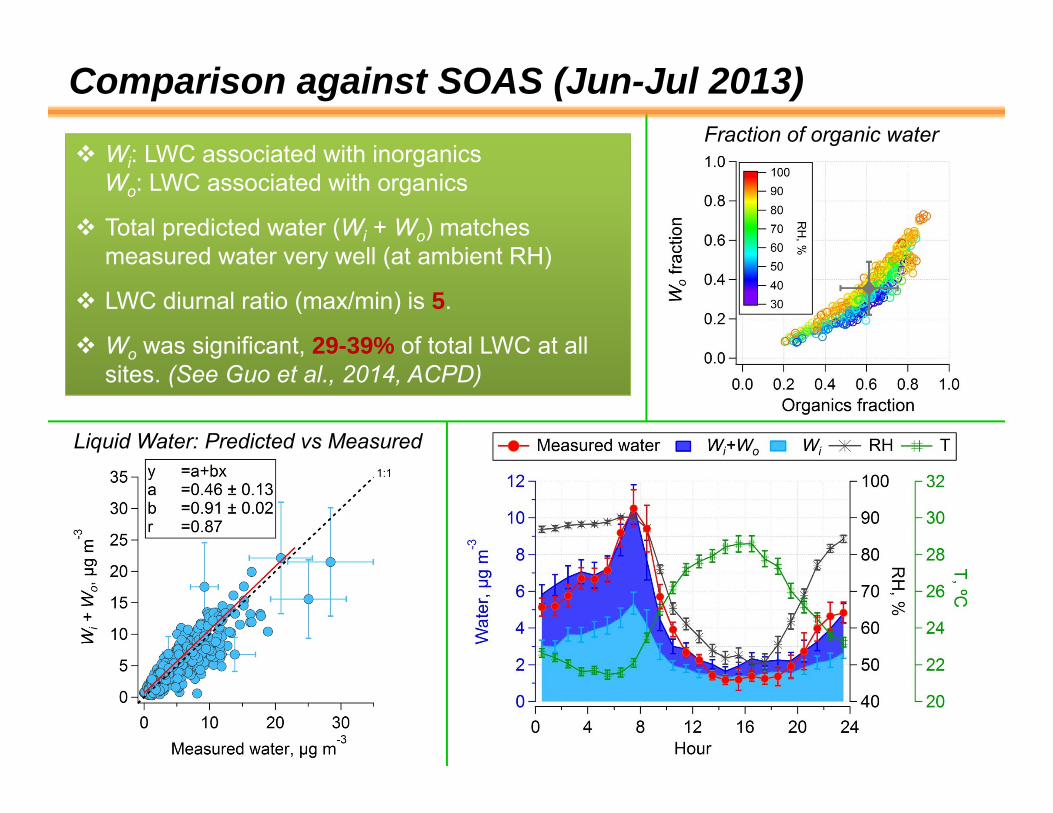
Wi: LWC associated with inorganicsWo: LWC associated with organics
Total predicted water (Wi + Wo) matches measured water very well (at ambient RH)
LWC diurnal ratio (max/min) is 5.
Wo was significant, 29-39% of total LWC at all sites. (See Guo et al., 2014, ACPD)
15
Liquid Water: Predicted vs Measured
Fraction of organic water
Comparison against SOAS (Jun-Jul 2013)
Take home messages
• Thermodynamic prediction of LWC verified by f(RH) and hygroscopicity measurements.
• Organics (mostly water‐soluble) dominated the aerosol composition.
• Water associated with organic species is significant: 20‐90%.
• The effect of organic water is higher in the BL but still significant above. Sometimes even more important (BB).
• The importance of organic water is not episodic but seems to be regional (SE US).
• This has important implications for aerosol chemistry .
• Aerosol loadings at ground‐level (Houston) were low but high altitude aerosol layers contributed significantly (hence AOD).
THANK YOU!