vertical specialization and the changing nature of world … · vertical specialization and the...
TRANSCRIPT

FRBNY ECONOMIC POLICY REVIEW / JUNE 1998 79
Vertical Specialization and the Changing Nature of World TradeDavid Hummels, Dana Rapoport, and Kei-Mu Yi
he world’s economies have become increas-
ingly integrated and increasingly global.
Among the most important and often cited
features of the rise in globalization is the enor-
mous growth in the export and import shares of GDP since
World War II. In the United States, international trade—
that is, exports plus imports—accounted for 23.9 percent of
GDP in 1996, up from 9.2 percent in 1962.1 Worldwide,
the merchandise export share of production has more than
doubled over the last forty-five years, while the manufac-
tured export share of production has almost quadrupled
(Chart 1). Most countries—emerging nations as well as
highly developed economies—have experienced increases in
their export share of GDP (Chart 2). Clearly, a greater num-
ber of countries are trading more today than in the past.
Another significant feature of increased globaliza-
tion is the internationalization of production. Rather than
concentrate production in a single country, the modern
multinational firm uses production plants—operated
either as subsidiaries or through arm’s-length relation-
ships—in several countries. By doing so, firms can exploit
powerful locational advantages, such as proximity to mar-
kets and access to relatively inexpensive labor. There are
currently more than 39,000 parent firms and 279,000 for-
eign affiliates worldwide, with a total foreign direct invest-
ment (FDI) stock equal to $2.7 trillion in 1995, compared
with $1.0 trillion in 1987. Moreover, the value added of
foreign affiliates—that is, their sales less materials costs—
accounted for 6 percent of world GDP in 1991, a 300 per-
cent increase from 1982 (United Nations Conference on
Trade and Development 1996).
Increased international production, however, does
not always lead to increased international trade. For
instance, if a country’s firms serve markets abroad through
production facilities in each country—rather than through
David Hummels is an assistant professor of economics at the University ofChicago’s Graduate School of Business; Dana Rapoport is an assistanteconomist and Kei-Mu Yi an economist at the Federal Reserve Bank ofNew York.
T

80 FRBNY ECONOMIC POLICY REVIEW / JUNE 1998
Chart 1
World Production and Export Volumes
Index: 1950 = 1
Production volume
Export volume
1
35
Production volume
Export volume
9590858075706560551950
25
10
20
1
25
10
20
Source: World Trade Organization Secretariat.
35Manufacturing Export Share of Output
Merchandise Export Share of OutputCountries’ 1962 and 1995 Export Shares of GDP: Most Countries’ Export Shares Increased
Chart 2
Source: Authors’ calculations, based on data from International Monetary Fund, International Financial Statistics Yearbook.
Notes: Each dot represents a different country. If a country lies above and to the left of the 45º line, then its 1995 export share is larger than its 1962 export share. It is clear that this is the case for a majority of the countries. Furthermore, this phenomenon is true for all types of countries: Countries as distinct as Bangladesh, the Congo, Germany, Ireland, Korea, Malaysia, andthe United States all lie above the 45º line.
1995 export shares
0 0.2 0.4 0.6 0.8 1.0 1.2 1.4 1.60
0.2
0.4
0.6
0.8
1.0
1.2
1.4
1.6
1962 export shares
= Country
exports from the home country—trade may actually
decrease as international production rises. International
production will be associated with increased trade when
countries are vertically linked—that is, when international
production prompts countries to specialize in particular
stages of a good’s production. In that case, a sequential
mode of production arises in which a country imports a
good from another country, uses that good as an input in
the production of its own good, and then exports its good
to the next country; the sequence ends when the final good
reaches its final destination. We use the term “vertical spe-
cialization” to describe this mode of production.2 By com-
parison, in a horizontal-specialization scenario, countries
trade goods that are produced from start to finish in just
one country.
In this article, we shed light on the globalization
of international production and trade by demonstrating
the increasingly important role vertical specialization
plays in international trade. We use case studies and
input-output tables to calculate the level and growth of
vertical-specialization-based trade, which we define as the
amount of imported inputs embodied in goods that are
exported. The case studies—the United States–Canada
Auto Agreement of 1965, Mexico’s maquiladora trade with
the United States, electronics trade between Japan and
Asia, and trade involving Opel’s subsidiary in Spain—
allow us to quantify the amount of vertical-specialization-
based trade.3 In all of the case studies, our findings indicate
that vertical specialization has increased sharply in recent
years: in the Japan-Asia electronics trade, for example, it
increased 900 percent between 1986 and 1995.
To show that the results of our case studies can be
generalized, we use input-output tables to calculate esti-
mates of vertical-specialization-based trade in ten developed
countries from the Organization for Economic Cooperation
and Development (OECD). We find that by the beginning
of the present decade, 14.5 percent of all trade in these coun-
tries was vertical-specialization-based—a 20 percent increase
FRBNY ECONOMIC POLICY REVIEW / JUNE 1998 81
from the late 1960s and early 1970s. Thus, while the majority
of trade continues to be horizontal, vertical-specialization-
based trade is making significant gains.
Analysis of our OECD data reveals a strong statisti-
cal association between the increased vertical specialization
share of total trade and the rising trade shares of GDP. In
addition, it shows that the industries accounting for most of
the increase in the vertical specialization share of total
trade—chemicals, and machinery and equipment—also
account for most of the increase in overall trade as a share of
GDP. Increases in vertical-specialization-based trade are also
found to account for more than 25 percent of the increase in
total trade in most of our ten OECD countries.
Our study also considers some implications of the
increase in vertical specialization for trade policy. Although
a detailed examination of policy issues is beyond the scope
of this article, our results lead to two tentative conclusions.
First, even though tariff and nontariff barriers worldwide
are now quite low, especially among the developed coun-
tries, vertical specialization can magnify the gains that are
achieved by lowering these barriers even further. Second,
vertical specialization has helped make the linkages
between foreign direct investment policy and trade policy
stronger than ever. The trade gains from vertical specializa-
tion can therefore be realized when countries place greater
emphasis on eliminating FDI restrictions.
In the next section, we define vertical specializa-
tion more precisely and relate it to other important pro-
duction concepts, such as outsourcing, vertical foreign
direct investment, and vertical integration. We then
present our case study and input-output table evidence of
the increased importance of vertical specialization. We con-
clude with a discussion of the possible causes of vertical
specialization, as well as its trade policy implications.
VERTICAL SPECIALIZATION
The story of globalization is a story about specialization.
Today, countries focus more and more on producing a rela-
tively narrow range of goods and services. They exchange the
fruits of their specialization for other goods and services. The
traditional notion of specialization is horizontal—firms or
countries become adept at producing particular goods
and services from scratch and then export them. We show,
however, that an increasingly significant characteristic of
world trade is vertical specialization.
Three conditions must hold for our definition of
vertical specialization to occur: (1) a good must be produced
in multiple sequential stages, (2) two or more countries
must specialize in producing some, but not all, stages, and
(3) at least one stage must cross an international border
more than once.4 In other words, vertical specialization
occurs when a country uses imported intermediate
parts to produce goods it later exports. This definition
captures the idea that countries link sequentially to produce
a final good.
To obtain a quantitative measure of the amount of
trade due to vertical specialization, we define vertical-
specialization-based trade to be the value of imported
intermediates embodied in a country’s exports, multiplied
by two. We multiply by two because imported interme-
diates are counted twice: once as imports and once as
embodied in exports. We calculate this trade as:
(1) ( fraction of gross production that is imported
intermediates) (exports) (2)
or, equivalently, as:
(1a) (imported intermediates) ( fraction of gross
production that is exported ) (2).
From the above formulas, we can see that as the fraction of
gross production that is imported intermediates and/or the
fraction of gross production that is exported increases, the
fraction of trade that is vertical-specialization-based will
increase.
× ×
×
×
Vertical specialization occurs when a country
uses imported intermediate parts to produce
goods it later exports. This definition captures
the idea that countries link sequentially to
produce a final good.

82 FRBNY ECONOMIC POLICY REVIEW / JUNE 1998
An Example of Vertical-Specialization-Based Trade
$50 millionparts
$150 millioncomputers
$100 millionexports
of computers
$50 milliondomestic parts
$50 milliondomestic sales
$50 millioncapital and labor
Country 1
Country 2
Country 3
The exhibit below offers a good example. Country 2
imports $50 million of parts from Country 1 and, after
producing computers, exports $100 million of the com-
puters to Country 3. Applying equation 1, we see that
vertical-specialization-based trade for Country 2 is ($50/
$150) $100 2 = $200/3 million, which is twice the
value of imported intermediates embodied in exports.
Because Country 2’s total trade is $150 million, vertical-
specialization-based trade thus accounts for 44 percent of
its total trade. However, if one or both of the imported
intermediates and exports were zero, vertical-specialization-
based trade would also be zero.
Vertical-specialization-based trade is clearly related
to trade in intermediate goods, which has also risen sharply
in recent decades. However, our definition makes clear that
vertical-specialization-based trade can include trade in
final goods, as long as some imported intermediates are
used to produce those goods. The above example also shows
that imports of intermediate goods would not count as
vertical-specialization-based trade if the good produced
with the imported intermediates was not exported.
Vertical specialization is related to several produc-
tion concepts including outsourcing, vertical integration,
and vertical FDI, all of which have garnered much atten-
× ×
tion in academic research and the popular press. Outsourc-
ing is the relocation of one or more stages of a good that
was formerly produced entirely in the home country
(see box). Vertical integration and vertical FDI are activi-
ties in which multinational firms locate different stages of
production of a good or goods in different countries. These
concepts are similar to vertical specialization because they
are all concerned with the location of production. The main
distinction, however, is that vertical specialization concerns
the activities of countries, while outsourcing, vertical
integration, and vertical FDI involve the behavior of
multinational firms. While firm-level production activities
represent ways in which country-level vertical specializa-
tion can occur, outsourcing and vertical integration and
FDI need not imply vertical specialization, and vice versa.5
We later show that the industries in which multinational
firms are engaged—manufacturing industries, especially
OUTSOURCING AND VERTICAL SPECIALIZATION
We define outsourcing as the relocation of one or more stages of
the production of a good from the home country. Labor, capital,
and/or technology can be transferred in the process. While we
regard outsourcing as the act of relocation, others have viewed
it more generally as reliance on imported inputs. The examples
below illustrate the distinction between vertical specialization
and both types of outsourcing:
1. Suppose a firm relocates production of computer com-ponents to another country and imports these compo-nents from that country. The firm then completes theproduction of the computers but does not export them.In this case, outsourcing—as we define it—hasoccurred, but vertical specialization has not. However, ifthe country does export the final goods, both outsourc-ing and vertical specialization have occurred.
2. Suppose a country manufactures computers and some ofthe intermediate inputs are imported. In this case, out-sourcing—as others define it—has occurred. If no com-puters are exported, there is no vertical specialization; ifcomputers are exported, vertical specialization hasoccurred.
3. According to our definition, outsourcing is not presentin the second example. Either way, however, verticalspecialization and outsourcing are distinct concepts.

FRBNY ECONOMIC POLICY REVIEW / JUNE 1998 83
Chart 3
U.S.-Canadian Auto Trade: Before and After the 1965Auto Agreement
Sources: Top panel: Beigie (1970, p. 71, Table 13); middle panel: Beigie (1970, p. 72, Table 14); bottom panel: U.S. Department of Commerce, Bureau of Economic Analysis, Survey of Current Business, International Monetary Fund, Direction of Trade.
Automotive Exports and Imports
0
0.5
1.0
1.5
2.0
2.5
3.0
68676665646362611960
Billions of canadian dollars
Canadian importsfrom United States
0
10
20
30
40
50
60
70
68676665646362611960
Percent
Completed Vehicle Export Share of Production and Import Share of Market
Canadian productionexported to United States
Share of Canadianmarket held by
U.S. imports
0
5
10
15
20
25
30
35
706968676665646362611960
Percent
U.S. Automotive Export and Import Shares of TotalU.S.-Canadian Exports and Imports
Export share
Import share
Canadian exports to United States
chemicals, machinery, and equipment—are those in which
the share of total trade that is vertical-specialization-based
is the largest.6
EMPIRICAL EVIDENCE: FOUR CASE STUDIES
To construct empirical measures of vertical-specialization-
based trade, ideally we would use data on the production
process and direction of trade flow for every stage of each
good traded in the world economy.7 Unfortunately, these
data are impossible to obtain. We can, however, construct
detailed estimates of vertical trade on a case-by-case basis.
(Appendix A provides additional details on the data
sources for our four case studies.)
Implicit in all of our case study calculations is the
assumption that countries divide production into two
stages—intermediate goods production and final goods
production—with one stage occurring in each country.8 To
the extent that countries divide production into more than
two stages, our calculations underestimate the amount of
vertical trade. For example, imagine that the United States
used pistons imported from Canada to produce engines
that are then exported to Canada, where they are assembled
into final motor vehicles that are exported back to the
United States. In this instance, our calculations would miss
one set of trade flows, or one “border crossing.”
Our first two case studies illustrate bilateral rela-
tionships—that is, relationships in which one country
exports goods to a second country, which uses them as
inputs to produce goods that are exported back to the first
country. In the other two studies, the second country,
rather than exporting the goods back to the first country,
exports them to a third country.
THE 1965 UNITED STATES–CANADA AUTO AGREEMENT
Before the 1965 United States–Canada Auto Agreement,
auto trade between the two countries was virtually nonex-
istent. Tariffs were significant: 17.5 percent on Canadian
automotive imports from the United States and 6.5 to
8.5 percent on U.S. automotive imports from Canada.
Canadian auto manufacturers (affiliates of GM, Ford,
Chrysler, and American Motors Corporation) produced
exclusively for the Canadian market, and almost all vehicles
sold in Canada were also made there. The 1965 agreement
reduced the tariffs facing producers to zero.9 Viewing the
United States and Canada as one integrated market after the
agreement, U.S. auto companies immediately consolidated
production. In Canada, production was narrowed to just a
few models, with the output serving the entire North Amer-
ican market. Just four years after the agreement, auto trade
soared (Chart 3). The share of Canadian vehicles exported to

84 FRBNY ECONOMIC POLICY REVIEW / JUNE 1998
Vertical Trade as a Percentage of Auto Trade and Auto Trade as a Percentage of Auto Output: The United States and Canada
Chart 4
Source: Authors’ calculations, based on data from the United NationsStatistical Division, the U.S. Commerce Department’s Bureau of Economic Analysis, and Ward’s Automotive Yearbook.
Note: The data are described in greater detail in Appendix 1.
Percent
0
5
10
15
20
25
30
35
40
0
5
10
15
20
25
30
9490858075701965
Percent
Scale
Auto tradeScale
Vertical trade
the United States leaped from 7 percent to 60 percent, and
the share of the Canadian automobile market consisting of
imported cars jumped from 3 percent to 40 percent (Beigie
1970, pp. 4-5). The bottom panel of the chart shows that the
automobile share of total U.S.-Canadian trade rose immedi-
ately, from approximately 8 percent to 30 percent.10
These events seem like a textbook example of tra-
ditional horizontal specialization, in which there is just
more trade in motor vehicles.11 Nevertheless, the basic
data provide a hint that vertical specialization also
occurred. Sixty percent of U.S. auto exports to Canada are
engines and parts, while 75 percent of U.S. auto imports
from Canada are finished cars and trucks (U.S. Depart-
ment of Commerce 1994-96). To proceed further, we esti-
mate the level of U.S.-Canadian vertical trade following
the auto agreement using data from Ward’s Automotive
Yearbook, the United Nations Comtrade database, and the
U.S. Department of Commerce’s Bureau of Economic
Analysis (BEA). The United Nations and BEA trade data
separate parts trade from vehicles trade, a distinction that
is key to our calculation. Our calculation has two steps.
First, we attribute trade in auto parts in 1964, before the
agreement, entirely to the auto repair market, for which
there is no vertical specialization. We also assume that
the ratio of repair market trade to total U.S. auto and
truck output is constant at its 1964 level in order to
calculate estimates of repair trade in future years. We
subtract this amount of trade from the overall trade figures
to obtain an estimate of parts trade owing specifically to
the agreement (Appendix A). Second, we determine the
amount of vertical trade generated by the auto agreement,
which equals:
(2) 2 { [(adjusted ) Canadian parts imports]
[ fraction of Canadian vehicle production
exported to United States] + [(adjusted ) U.S.
parts imports] [ fraction of U.S. vehicle
production exported to Canada] }.
Note that we calculate vertical trade in both direc-
tions—that is, from the United States to Canada to the
United States, and from Canada to the United States to
Canada. The fraction of Canadian vehicle production
×
×
×
exported to the United States is currently about 80 to
90 percent; by contrast, only a small fraction of U.S. vehicle
production is exported to Canada. This means that the vast
majority of vertical trade consists of the U.S.-Canadian-U.S.
flow. Chart 4 shows the percentage of total automotive
trade from 1965 to 1994 that is vertical trade generated by
the auto agreement. By 1971, vertical trade had risen
from 0 percent to more than 20 percent of total auto trade,
and it has continued to trend upward. In recent years,
vertical trade has accounted for more than 35 percent of
U.S.-Canadian auto trade, or about $30 billion. Chart 4
also shows that the share of vertical trade in total U.S.-
Canadian auto trade is highly correlated with total U.S.-
Canadian auto trade as a fraction of U.S. auto output; the
correlation coefficient is 0.82.
MEXICO’S MAQUILADORAS Mexico’s maquiladoras are non-Mexican-owned production
plants that complete processing or secondary assembly of
imported components for export.12 These plants benefit
from Mexican laws that exempt from Mexican tariffs parts
and materials imported by Mexico for use in maquiladoras.
FRBNY ECONOMIC POLICY REVIEW / JUNE 1998 85
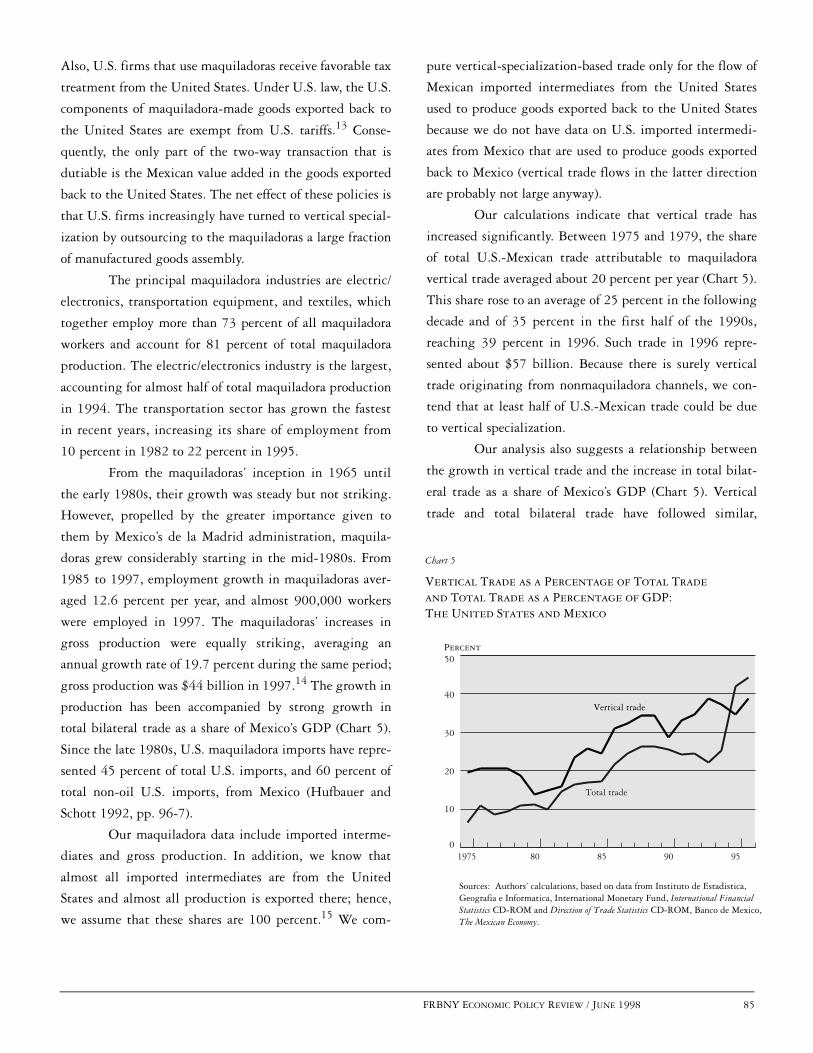
Vertical Trade as a Percentage of Total Trade and Total Trade as a Percentage of GDP: The United States and Mexico
Chart 5
Sources: Authors’ calculations, based on data from Instituto de Estadistica, Geografia e Informatica, International Monetary Fund, International Financial Statistics CD-ROM and Direction of Trade Statistics CD-ROM, Banco de Mexico,The Mexican Economy.
Percent
0
10
20
30
40
50
959085801975
Total trade
Vertical trade
Also, U.S. firms that use maquiladoras receive favorable tax
treatment from the United States. Under U.S. law, the U.S.
components of maquiladora-made goods exported back to
the United States are exempt from U.S. tariffs.13 Conse-
quently, the only part of the two-way transaction that is
dutiable is the Mexican value added in the goods exported
back to the United States. The net effect of these policies is
that U.S. firms increasingly have turned to vertical special-
ization by outsourcing to the maquiladoras a large fraction
of manufactured goods assembly.
The principal maquiladora industries are electric/
electronics, transportation equipment, and textiles, which
together employ more than 73 percent of all maquiladora
workers and account for 81 percent of total maquiladora
production. The electric/electronics industry is the largest,
accounting for almost half of total maquiladora production
in 1994. The transportation sector has grown the fastest
in recent years, increasing its share of employment from
10 percent in 1982 to 22 percent in 1995.
From the maquiladoras’ inception in 1965 until
the early 1980s, their growth was steady but not striking.
However, propelled by the greater importance given to
them by Mexico’s de la Madrid administration, maquila-
doras grew considerably starting in the mid-1980s. From
1985 to 1997, employment growth in maquiladoras aver-
aged 12.6 percent per year, and almost 900,000 workers
were employed in 1997. The maquiladoras’ increases in
gross production were equally striking, averaging an
annual growth rate of 19.7 percent during the same period;
gross production was $44 billion in 1997.14 The growth in
production has been accompanied by strong growth in
total bilateral trade as a share of Mexico’s GDP (Chart 5).
Since the late 1980s, U.S. maquiladora imports have repre-
sented 45 percent of total U.S. imports, and 60 percent of
total non-oil U.S. imports, from Mexico (Hufbauer and
Schott 1992, pp. 96-7).
Our maquiladora data include imported interme-
diates and gross production. In addition, we know that
almost all imported intermediates are from the United
States and almost all production is exported there; hence,
we assume that these shares are 100 percent.15 We com-
pute vertical-specialization-based trade only for the flow of
Mexican imported intermediates from the United States
used to produce goods exported back to the United States
because we do not have data on U.S. imported intermedi-
ates from Mexico that are used to produce goods exported
back to Mexico (vertical trade flows in the latter direction
are probably not large anyway).
Our calculations indicate that vertical trade has
increased significantly. Between 1975 and 1979, the share
of total U.S.-Mexican trade attributable to maquiladora
vertical trade averaged about 20 percent per year (Chart 5).
This share rose to an average of 25 percent in the following
decade and of 35 percent in the first half of the 1990s,
reaching 39 percent in 1996. Such trade in 1996 repre-
sented about $57 billion. Because there is surely vertical
trade originating from nonmaquiladora channels, we con-
tend that at least half of U.S.-Mexican trade could be due
to vertical specialization.
Our analysis also suggests a relationship between
the growth in vertical trade and the increase in total bilat-
eral trade as a share of Mexico’s GDP (Chart 5). Vertical
trade and total bilateral trade have followed similar,
86 FRBNY ECONOMIC POLICY REVIEW / JUNE 1998
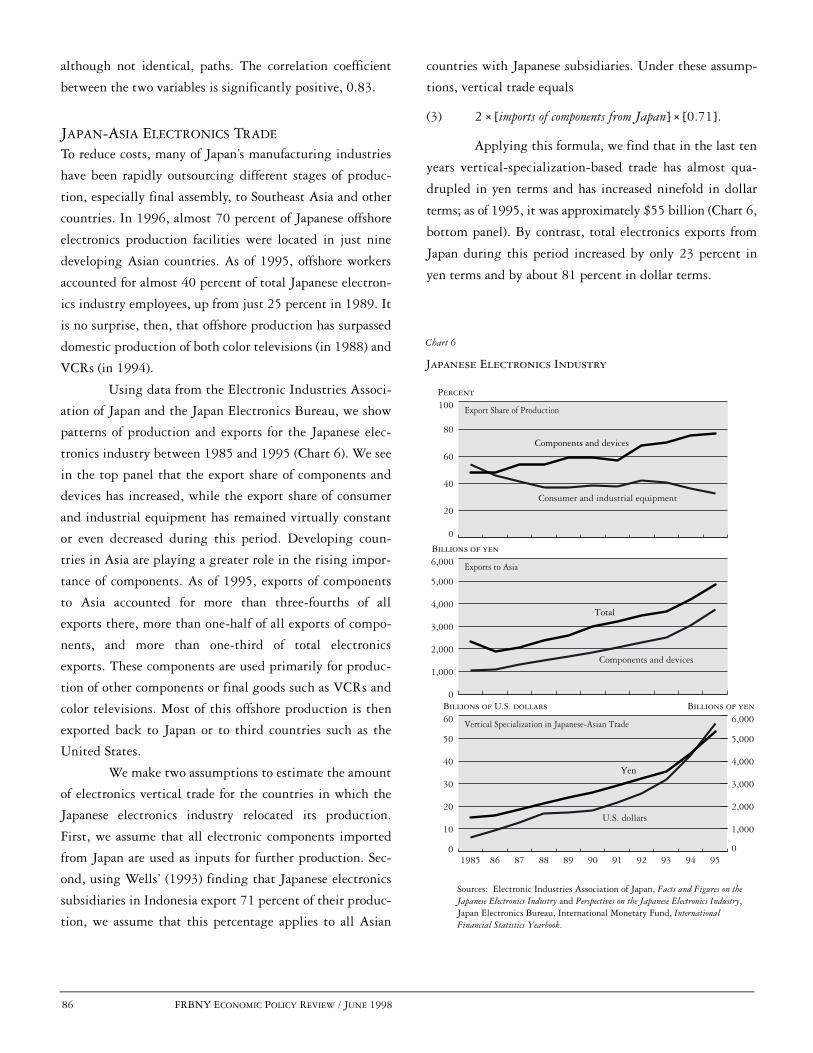
Chart 6
Japanese Electronics Industry
Sources: Electronic Industries Association of Japan, Facts and Figures on the Japanese Electronics Industry and Perspectives on the Japanese Electronics Industry,Japan Electronics Bureau, International Monetary Fund, International Financial Statistics Yearbook.
Export Share of Production
Percent
Consumer and industrial equipment
Components and devices
0
20
40
60
80
100
Exports to Asia
Billions of yen
Components and devices
Total
0
1,000
2,000
3,000
4,000
5,000
6,000
Vertical Specialization in Japanese-Asian Trade
Billions of U.S. dollars
U.S. dollars
Yen
0
10
20
30
40
50
60
0
1,000
2,000
3,000
4,000
5,000
6,000
959493929190898887861985
Billions of yen
although not identical, paths. The correlation coefficient
between the two variables is significantly positive, 0.83.
JAPAN-ASIA ELECTRONICS TRADE
To reduce costs, many of Japan’s manufacturing industries
have been rapidly outsourcing different stages of produc-
tion, especially final assembly, to Southeast Asia and other
countries. In 1996, almost 70 percent of Japanese offshore
electronics production facilities were located in just nine
developing Asian countries. As of 1995, offshore workers
accounted for almost 40 percent of total Japanese electron-
ics industry employees, up from just 25 percent in 1989. It
is no surprise, then, that offshore production has surpassed
domestic production of both color televisions (in 1988) and
VCRs (in 1994).
Using data from the Electronic Industries Associ-
ation of Japan and the Japan Electronics Bureau, we show
patterns of production and exports for the Japanese elec-
tronics industry between 1985 and 1995 (Chart 6). We see
in the top panel that the export share of components and
devices has increased, while the export share of consumer
and industrial equipment has remained virtually constant
or even decreased during this period. Developing coun-
tries in Asia are playing a greater role in the rising impor-
tance of components. As of 1995, exports of components
to Asia accounted for more than three-fourths of all
exports there, more than one-half of all exports of compo-
nents, and more than one-third of total electronics
exports. These components are used primarily for produc-
tion of other components or final goods such as VCRs and
color televisions. Most of this offshore production is then
exported back to Japan or to third countries such as the
United States.
We make two assumptions to estimate the amount
of electronics vertical trade for the countries in which the
Japanese electronics industry relocated its production.
First, we assume that all electronic components imported
from Japan are used as inputs for further production. Sec-
ond, using Wells’ (1993) finding that Japanese electronics
subsidiaries in Indonesia export 71 percent of their produc-
tion, we assume that this percentage applies to all Asian
countries with Japanese subsidiaries. Under these assump-
tions, vertical trade equals
(3) 2 [imports of components from Japan] [0.71].
Applying this formula, we find that in the last ten
years vertical-specialization-based trade has almost qua-
drupled in yen terms and has increased ninefold in dollar
terms; as of 1995, it was approximately $55 billion (Chart 6,
bottom panel). By contrast, total electronics exports from
Japan during this period increased by only 23 percent in
yen terms and by about 81 percent in dollar terms.
× ×
FRBNY ECONOMIC POLICY REVIEW / JUNE 1998 87
OPEL’S SUBSIDIARY IN SPAIN Opel, General Motors’ affiliate in continental Europe,
began operations in Spain in 1982. As of 1994, Opel
España made about 22 percent of Spain’s total production
of 1.8 million passenger cars. From the beginning, Opel
España was an important participant in vertical trade,
relying heavily on imported inputs to produce automobile
parts and final vehicles, most of which were exported. To
calculate vertical trade, we use 1983-95 Opel España data
on net sales of vehicles and parts, exports of vehicles and
parts, and imported parts. As in the two previous case
studies, we can calculate this trade only in one direction.
(Because countries in the European Union are likely to
have extensive production and trade networks, vertical
trade in the other direction—that is, Spain exporting inter-
mediate goods to other countries and then importing goods
embodying those intermediates—may be significant.) With
the data we do have, we estimate the amount of Opel
España’s vertical-specialization-based trade to be both signif-
icant and increasing: $0.6 billion in 1983, $1.8 billion in
1993, $2.7 billion in 1994, and $3.6 billion in 1995.
Using additional data on Spain’s auto exports, we
can estimate the contribution of vertical trade to the coun-
try’s overall auto trade. We know that Spain’s other auto
companies—affiliates of American or European corpora-
tions—all export a somewhat smaller fraction of their pas-
senger car production than Opel España, about 70 percent
as opposed to 90 percent. Using Opel España’s market
share of 22 percent, and assuming that these other compa-
nies rely on imported inputs to the same degree as Opel,
we estimate Spain’s total vertical trade in autos to be
$13.5 billion in 1995, up from $6.8 billion in 1993
and $10.1 billion in 1994. When we compare these latter
figures with total Spanish auto trade of $21 billion in 1993
and $25 billion in 1994, we estimate that at least 40 per-
cent of Spanish auto trade is vertical trade.16
EMPIRICAL EVIDENCE: INPUT-OUTPUT TABLES
We have established the quantitative significance of verti-
cal specialization for our case studies. Next, we ask whether
the conclusions reached through case studies of specific
operations and products can be extended to entire coun-
tries. To resolve this issue, we use input-output tables to
calculate vertical-specialization-based trade. Input-output
tables characterize, in matrix fashion, the interrelationships
among industries in a country’s economy. The tables
report, for example, how much of the steel industry’s out-
put is used as an intermediate input in the motor vehicles
industry and vice versa. They also report the gross output
and value added of each industry, as well as the amount of
each industry’s output exported or used domestically for
consumption or investment.
Our analysis uses the OECD Input-Output Data-
base, which contains cross-sectional data on ten coun-
tries—the G-7 nations, plus Australia, Denmark, and the
Netherlands—for selected years between 1968 and
1990.17 These ten countries account for about two-thirds
of world GDP and more than one-half of world trade. The
tables divide the world economy into thirty-five sectors,
including twenty-four goods-producing sectors, of which
twenty-two are manufacturing. The concentration on man-
ufacturing sectors is important because they increasingly
dominate world trade.18 For each country, we focus on the
goods industries: agriculture and mining, plus the twenty-
two manufacturing industries.
The OECD data offer two major advantages. First,
they include an “imported transactions” table for each
country, which reports the fraction of one sector’s inputs
imported from another sector. Hence, because the tables
provide data on imported inputs, gross production (as well
as value added), and exports, we can calculate the amount
of vertical trade for each industry, as well as for the country
overall. Second, the data provide a consistent set of tables
to facilitate comparisons across countries and over time.
The input-output tables do, however, pose an
aggregation problem. Each industry produces many
goods, but we measure the use of imported inputs and
exports at the industry level, rather than for each good.
Consider an extreme example of a potential problem: An
industry produces just two goods. One good uses
imported intermediate inputs but is not exported. The

88 FRBNY ECONOMIC POLICY REVIEW / JUNE 1998
other good uses no imported inputs but is exported. In
this case, there would be no vertical-specialization-based
trade, yet at the industry level we would calculate a
positive amount of such trade. However, suppose that the
first good relied heavily on imported intermediate inputs
and was heavily exported, and the second good used no
imported inputs and was not exported. Then, at the
industry level, we would underestimate the amount of
vertical-specialization-based trade. Unfortunately, we do
not know whether the former or the latter case is more
common, nor do we know the quantitative significance of
the “bias.”
When we calculate vertical trade as a share of total
trade for nine countries in our sample for all available years
between 1968 and 1990, two patterns emerge (Chart 7).19
First, for every country but Japan, vertical trade as a share
of total trade has increased from the first to the last year.
Using the most recently available years for each country,
we calculate vertical trade in our ten-country sample to be
about 14.5 percent of overall trade, up from about 12.0 per-
cent in the earliest years for each country—a 20 percent
increase in less than two decades.20 Second, there is wide
cross-country variation in the amount of vertical trade.
Japan, the United States, and Australia, for example, have
the least amount of such trade, only about 7 percent of
total trade in the final year of our study period. By con-
trast, 34.7 percent of the Netherlands’ total trade was
vertical trade in 1986 (the last year for which we have
Netherlands data).
Interestingly, our ten-country sample includes the
world’s largest economies, which are conceivably the least
likely to be involved in vertical trade. Large countries
generally find it easier than small ones, for scale economy
reasons, to retain production of every stage of a good. This
rationale explains why the United States, Germany, and
Japan have three of the four lowest vertical trade shares of
total trade. The rest of the world, which accounts for about
half of world trade, may be more like the Netherlands—
which has much higher vertical trade. For example, in cal-
culations not reported here, we find that vertical trade
accounted for 28.4 percent of overall trade in Ireland in
1990 and about 23.9 percent in Korea in 1993. Moreover,
our case studies suggest that countries like Spain, Malaysia,
and the Philippines may also have large vertical trade
shares. Consequently, a world vertical trade share on the
order of 20 to 25 percent could well be likely.
Within each country, the prominence of vertical
trade varies widely across industries (Table 1). Industries
with the most vertical trade are motor vehicles, shipbuild-
ing, and aircraft, as well as industrial chemicals, nonferrous
metals, and petroleum and coal products; those with the
least are agriculture, mining, wood products, and paper
products. In Japan, for example, vertical trade accounts for
16 percent of industrial chemicals trade, while it accounts
for only 0.1 percent of agriculture trade. There is also wide
variation across countries within each sector. For instance,
only 4.5 percent of motor vehicles trade in Australia is vertical
trade, compared with 49.9 percent in Canada. Canada’s
figure is similar to the estimate calculated in our case study.
Our analysis also suggests that the increase in ver-
tical trade is linked to the growing trade share of output.
The positive relationship over time between vertical trade
as a share of total trade and total trade as a share of gross
merchandise output is evident in Chart 7. The correlation
coefficient between the two variables for every country
exceeds 0.79, except for Japan, where the correlation is
0.26.21 To capture more formally the relationship between
the trade share of output and vertical trade, we also perform
Large countries generally find it easier than
small ones, for scale economy reasons, to retain
production of every stage of a good. This
rationale explains why the United States,
Germany, and Japan have three of the four
lowest vertical trade shares of total trade.

FRBNY ECONOMIC POLICY REVIEW / JUNE 1998 89
Vertical Trade as a Percentage of Total Trade and Total Trade as a Percentage of Gross Merchandise Output in Selected Countries
Chart 7
Percent
Source: Authors’ calculations, based on the OECD’s Input-Output Database.
Note: Italy is not shown because data were available only for 1985.
Australia
5.0
5.5
6.0
6.5
7.0
7.5
25
30
35
40
45
1989198619741968
Percent
Vertical tradeScale
ScaleTotal trade
Percent
Canada
16
18
20
22
24
26
45
50
55
60
65
70
75
19901986198119761971
Percent
Vertical tradeScale
ScaleTotal trade
Denmark
20
21
22
23
24
25
26
70
75
80
85
90
95
100
19901985198019771972
Vertical tradeScale
ScaleTotal trade
France
12
14
16
18
20
22
30
35
40
45
50
55
60
19901985198019771972
Vertical tradeScale
ScaleTotal trade
Germany
14.0
14.5
15.0
15.5
16.0
16.5
40
45
50
55
60
1990198819861978
Vertical tradeScale
ScaleTotal trade
6.4
6.6
6.8
7.0
7.2
7.4
7.6
7.8
8.0
14
16
18
20
22
24
26
19901985198019751970
Japan8.2
Vertical tradeScale
ScaleTotal trade
Netherlands
2830
32
34
36
38
40
42
44
75
80
85
90
95
100
1986198119771972
Vertical tradeScale
ScaleTotal trade
14
15
16
17
18
19
20
30
40
50
60
70
80
1990198419791968
United Kingdom
Vertical tradeScale
ScaleTotal trade
United States
3
4
5
6
7
8
10
15
20
25
30
19901985198219771972
Vertical tradeScale
ScaleTotal trade

90 FRBNY ECONOMIC POLICY REVIEW / JUNE 1998
an ordinary least squares regression of total trade as a share
of gross merchandise output on vertical trade as a share of
total trade for all countries. We include in our regressions
country-specific dummy variables to capture differences
due to such factors as country size, GDP per capita, and
distance from other countries. The regression results are
reported below with the standard errors of the coefficient
estimates in parentheses (we do not report the coefficients
on the country-specific dummy variables):
(4) Total trade = 0.03 + 2.92 vertical trade (share
(share of gross of total trade)
merchandise output) (0.03)(0.41)
adjusted R2 = 0.95.
We find that the coefficient on vertical trade is statisti-
cally significant at the 1 percent level. The coefficient
×
estimate implies that an increase of 1 percentage point in
vertical trade as a share of total trade is associated with an
increase of 2.92 percentage points in total trade as a share
of gross merchandise output, an economically significant
amount.22
We also employ growth decompositions to assess
which industries account for the increase in a country’s ver-
tical trade as a share of total trade. The overall growth in
vertical trade as a share of total trade depends on two
forces: the change in each industry’s vertical trade as a share
of industry trade and the change in each industry’s share of
total trade. (Appendix B gives an algebraic derivation of
the growth decomposition formula.) We examine the con-
tribution of different industries to the growth in vertical
trade as a share of total trade for Canada, France, Japan, the
United Kingdom, and the United States. We concentrate
Table 1VERTICAL TRADE AS A PERCENTAGE OF TOTAL INDUSTRY TRADE IN SELECTED COUNTRIES
Australia Canada Denmark France Germany Italy Japan NetherlandsUnited
KingdomUnitedStates
Industry 1989 1990 1990 1990 1990 1985 1990 1986 1990 1990CHEMICALS
Industrial chemicals 5.4 14.4 27.6 24.5 22.7 20.8 15.7 49.3 24.8 9.3Drugs and medicines 3.8 3.4 31.0 25.7 0.0 16.4 1.9 32.2 15.2 3.5
MACHINERY
Nonelectrical machinery 2.6 12.2 27.4 16.7 15.6 25.2 6.6 25.1 20.3 6.7Office and computing machinery 0.0 29.2 0.0 19.8 11.5 28.2 8.7 24.1 29.3 16.7Electrical apparatus, not elsewhere categorized 3.6 9.5 23.1 18.6 13.6 24.5 12.0 41.2
19.37.2
Radio, TV, and communication equipment 3.3 29.2 29.9 12.6 0.0 17.8 9.1 0.0
20.87.6
Shipbuilding and repairing 8.3 15.4 41.8 29.6 26.4 29.0 7.3 38.6 18.6 8.4Other transport 5.2 26.1 22.0 10.5 0.0 15.4 7.2 15.4 16.6 8.1Motor vehicles 4.5 49.9 0.0 21.1 22.4 16.1 5.6 25.4 20.0 8.7Aircraft 2.4 28.6 0.0 38.4 16.7 24.2 7.3 52.5 34.5 11.6Professional goods 4.2 11.8 27.6 11.3 11.6 13.1 7.4 24.9 16.8 5.8
OTHER
Agriculture, forestry, and fishing 9.4 8.8 20.4 10.9 3.7 4.3 0.1 13.0 6.1 4.8Mining and quarrying 12.6 5.8 3.5 3.5 1.3 0.0 0.0 4.8 10.5 0.8Food, beverages, and tobacco 7.4 7.9 25.9 12.4 15.1 10.2 0.9 36.8 10.1 4.6Textiles, apparel, and leather 9.2 7.6 29.4 18.1 15.1 29.6 5.2 34.6 19.1 2.8Wood products and furniture 5.8 12.9 32.8 9.5 11.4 18.6 1.3 14.3 5.9 3.9Paper, paper products, and printing 3.0 12.2 16.2 12.2 18.6 13.9 4.2 21.0 12.2 7.2Petroleum and coal products 11.4 34.7 15.3 25.6 13.4 46.1 11.1 98.7 12.5 15.5Rubber and plastic products 2.6 14.4 32.6 29.3 19.2 32.3 8.6 32.1 19.9 5.7Nonmetallic mineral products 1.4 5.9 20.0 8.1 9.9 20.8 6.6 13.9 11.3 3.0Iron and steel 9.3 15.5 16.9 21.5 11.8 31.9 13.4 27.1 20.9 4.7Nonferrous metals 14.2 28.7 19.5 36.0 27.0 13.2 10.3 0.0 24.7 12.2Metal products 9.3 11.9 26.3 13.5 16.1 22.7 7.3 27.7 17.2 8.9Other manufacturing 5.4 10.4 28.6 10.8 16.6 42.1 4.2 21.3 11.0 2.8
TOTAL GOODS 7.4 23.2 25.2 18.7 16.3 19.6 6.6 34.7 19.1 7.4
Source: Authors’ calculations, based on the OECD’s Input-Output Database.
FRBNY ECONOMIC POLICY REVIEW / JUNE 1998 91
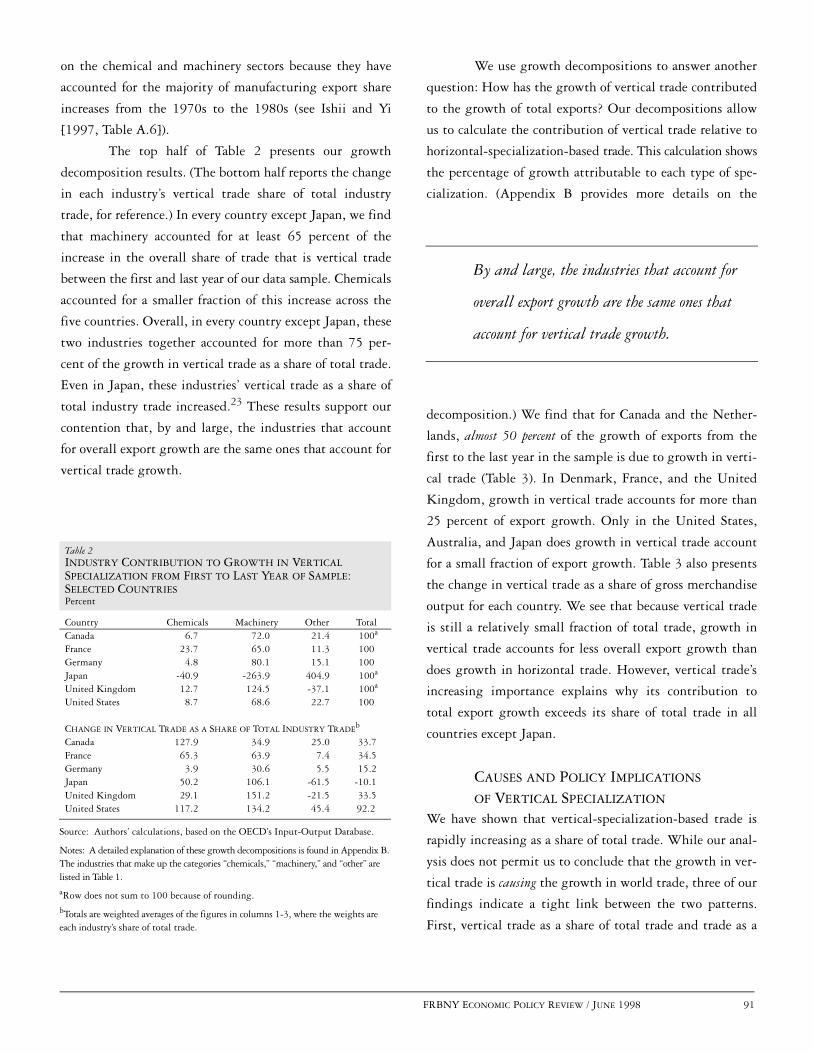
on the chemical and machinery sectors because they have
accounted for the majority of manufacturing export share
increases from the 1970s to the 1980s (see Ishii and Yi
[1997, Table A.6]).
The top half of Table 2 presents our growth
decomposition results. (The bottom half reports the change
in each industry’s vertical trade share of total industry
trade, for reference.) In every country except Japan, we find
that machinery accounted for at least 65 percent of the
increase in the overall share of trade that is vertical trade
between the first and last year of our data sample. Chemicals
accounted for a smaller fraction of this increase across the
five countries. Overall, in every country except Japan, these
two industries together accounted for more than 75 per-
cent of the growth in vertical trade as a share of total trade.
Even in Japan, these industries’ vertical trade as a share of
total industry trade increased.23 These results support our
contention that, by and large, the industries that account
for overall export growth are the same ones that account for
vertical trade growth.
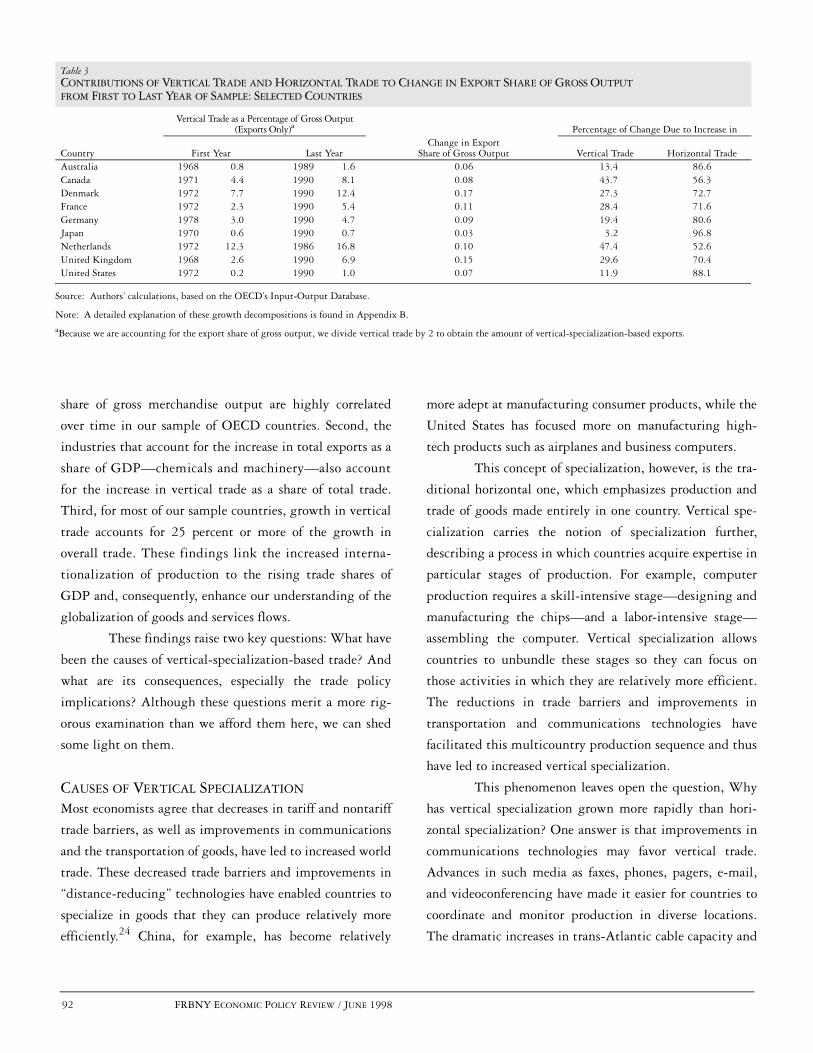
We use growth decompositions to answer another
question: How has the growth of vertical trade contributed
to the growth of total exports? Our decompositions allow
us to calculate the contribution of vertical trade relative to
horizontal-specialization-based trade. This calculation shows
the percentage of growth attributable to each type of spe-
cialization. (Appendix B provides more details on the
decomposition.) We find that for Canada and the Nether-
lands, almost 50 percent of the growth of exports from the
first to the last year in the sample is due to growth in verti-
cal trade (Table 3). In Denmark, France, and the United
Kingdom, growth in vertical trade accounts for more than
25 percent of export growth. Only in the United States,
Australia, and Japan does growth in vertical trade account
for a small fraction of export growth. Table 3 also presents
the change in vertical trade as a share of gross merchandise
output for each country. We see that because vertical trade
is still a relatively small fraction of total trade, growth in
vertical trade accounts for less overall export growth than
does growth in horizontal trade. However, vertical trade’s
increasing importance explains why its contribution to
total export growth exceeds its share of total trade in all
countries except Japan.
CAUSES AND POLICY IMPLICATIONS OF VERTICAL SPECIALIZATION
We have shown that vertical-specialization-based trade is
rapidly increasing as a share of total trade. While our anal-
ysis does not permit us to conclude that the growth in ver-
tical trade is causing the growth in world trade, three of our
findings indicate a tight link between the two patterns.
First, vertical trade as a share of total trade and trade as a
Table 2INDUSTRY CONTRIBUTION TO GROWTH IN VERTICAL SPECIALIZATION FROM FIRST TO LAST YEAR OF SAMPLE: SELECTED COUNTRIESPercent
Country Chemicals Machinery Other TotalCanada 6.7 72.0 21.4 100a
France 23.7 65.0 11.3 100Germany 4.8 80.1 15.1 100Japan -40.9 -263.9 404.9 100a
United Kingdom 12.7 124.5 -37.1 100a
United States 8.7 68.6 22.7 100
CHANGE IN VERTICAL TRADE AS A SHARE OF TOTAL INDUSTRY TRADEb
Canada 127.9 34.9 25.0 33.7France 65.3 63.9 7.4 34.5Germany 3.9 30.6 5.5 15.2Japan 50.2 106.1 -61.5 -10.1United Kingdom 29.1 151.2 -21.5 33.5United States 117.2 134.2 45.4 92.2
Source: Authors’ calculations, based on the OECD’s Input-Output Database.
Notes: A detailed explanation of these growth decompositions is found in Appendix B. The industries that make up the categories “chemicals,” “machinery,” and “other” are listed in Table 1.aRow does not sum to 100 because of rounding.bTotals are weighted averages of the figures in columns 1-3, where the weights are each industry’s share of total trade.
By and large, the industries that account for
overall export growth are the same ones that
account for vertical trade growth.
92 FRBNY ECONOMIC POLICY REVIEW / JUNE 1998
share of gross merchandise output are highly correlated
over time in our sample of OECD countries. Second, the
industries that account for the increase in total exports as a
share of GDP—chemicals and machinery—also account
for the increase in vertical trade as a share of total trade.
Third, for most of our sample countries, growth in vertical
trade accounts for 25 percent or more of the growth in
overall trade. These findings link the increased interna-
tionalization of production to the rising trade shares of
GDP and, consequently, enhance our understanding of the
globalization of goods and services flows.
These findings raise two key questions: What have
been the causes of vertical-specialization-based trade? And
what are its consequences, especially the trade policy
implications? Although these questions merit a more rig-
orous examination than we afford them here, we can shed
some light on them.
CAUSES OF VERTICAL SPECIALIZATION
Most economists agree that decreases in tariff and nontariff
trade barriers, as well as improvements in communications
and the transportation of goods, have led to increased world
trade. These decreased trade barriers and improvements in
“distance-reducing” technologies have enabled countries to
specialize in goods that they can produce relatively more
efficiently.24 China, for example, has become relatively
more adept at manufacturing consumer products, while the
United States has focused more on manufacturing high-
tech products such as airplanes and business computers.
This concept of specialization, however, is the tra-
ditional horizontal one, which emphasizes production and
trade of goods made entirely in one country. Vertical spe-
cialization carries the notion of specialization further,
describing a process in which countries acquire expertise in
particular stages of production. For example, computer
production requires a skill-intensive stage—designing and
manufacturing the chips—and a labor-intensive stage—
assembling the computer. Vertical specialization allows
countries to unbundle these stages so they can focus on
those activities in which they are relatively more efficient.
The reductions in trade barriers and improvements in
transportation and communications technologies have
facilitated this multicountry production sequence and thus
have led to increased vertical specialization.
This phenomenon leaves open the question, Why
has vertical specialization grown more rapidly than hori-
zontal specialization? One answer is that improvements in
communications technologies may favor vertical trade.
Advances in such media as faxes, phones, pagers, e-mail,
and videoconferencing have made it easier for countries to
coordinate and monitor production in diverse locations.
The dramatic increases in trans-Atlantic cable capacity and
Table 3CONTRIBUTIONS OF VERTICAL TRADE AND HORIZONTAL TRADE TO CHANGE IN EXPORT SHARE OF GROSS OUTPUT FROM FIRST TO LAST YEAR OF SAMPLE: SELECTED COUNTRIES
Vertical Trade as a Percentage of Gross Output (Exports Only)a Percentage of Change Due to Increase in
Country First Year Last YearChange in Export
Share of Gross Output Vertical Trade Horizontal TradeAustralia 1968 0.8 1989 1.6 0.06 13.4 86.6Canada 1971 4.4 1990 8.1 0.08 43.7 56.3Denmark 1972 7.7 1990 12.4 0.17 27.3 72.7France 1972 2.3 1990 5.4 0.11 28.4 71.6Germany 1978 3.0 1990 4.7 0.09 19.4 80.6Japan 1970 0.6 1990 0.7 0.03 3.2 96.8Netherlands 1972 12.3 1986 16.8 0.10 47.4 52.6United Kingdom 1968 2.6 1990 6.9 0.15 29.6 70.4United States 1972 0.2 1990 1.0 0.07 11.9 88.1
Source: Authors’ calculations, based on the OECD’s Input-Output Database.
Note: A detailed explanation of these growth decompositions is found in Appendix B.aBecause we are accounting for the export share of gross output, we divide vertical trade by 2 to obtain the amount of vertical-specialization-based exports.

FRBNY ECONOMIC POLICY REVIEW / JUNE 1998 93
the corresponding reductions in the cost of trans-Atlantic
communications have also encouraged frequent interaction
between firms in different countries.25 Since the sequential
production nature of vertical specialization requires
intensive oversight and coordination of production, these
technological advances would tend to benefit vertical-
specialization-based trade more than horizontal-
specialization-based trade.26
Our case studies point to another explanation for
vertical specialization’s rising importance. When a good
crosses only one border, tariffs and transportation costs are
incurred only once. When a good crosses multiple borders,
as in vertical-specialization-based trade, even low tariff
rates of 2 to 4 percent are magnified as they are repeatedly
applied to the good-in-process. This multiple taxation
results effectively in much higher rates of protection.
Therefore, reductions in these tariff rates will spur vertical
specialization more than they will horizontal specializa-
tion. For example, the tariff rates on automotive trade
between the United States and Canada before the 1965
Auto Agreement were roughly 10 to 15 percent, which was
not high by historical standards. Yet the elimination of
these tariffs resulted in a sixfold increase in auto trade in
just four years, and raised the share of total trade accounted
for by vertical specialization from zero to 20 percent in six
years. Our maquiladora case study also suggests that tariff
reductions have had a proportionately greater effect on ver-
tical trade than on horizontal trade. Tariffs were reduced on
both sides of the border; in particular, U.S. tariffs were
changed so that they were levied only on Mexico’s value
added. This action removed the multiple-border-crossing
penalty and led to more vertical-specialization-based trade.
POLICY IMPLICATIONS
One clear policy implication of vertical specialization is
that further tariff liberalization could yield substantial
gains. This is true even though tariff rates in the developed
countries are already quite low, approximately 5 percent or
less. Moreover, the gains would become greater as vertical
specialization increased.27
A second implication is that the linkage between
trade policy and foreign direct investment policy is likely
to tighten. Recall that all of our case studies involve multi-
national firms engaging in vertically integrated foreign
direct investment. Absent firms’ ability to invest freely in
foreign countries, vertical-specialization-based trade may
not occur. Similarly, it might not make sense to open a
country to increased FDI inflows without also liberalizing
import and export barriers. The notion that trade liberal-
ization and investment liberalization are complementary
has recently been supported by the theoretical literature as
well (see, for example, Markusen [1997]).
One other trade policy issue is worthy of further
consideration. Recently, there has been controversy sur-
rounding the value of regional trade agreements such as the
North American Free Trade Agreement, as opposed to
broader agreements under the auspices of the World Trade
Organization (see, for example, Bergsten [1997] and
Bhagwati [1997]). The main argument against regional
trade agreements is that they often create barriers between
participating and nonparticipating countries; hence, trade
“diversion” could occur, in which participating countries
specialize in producing goods that nonparticipating coun-
tries would produce in a completely free world market. In
other words, the gains to participating countries may be
exceeded by the losses to nonparticipating countries.
It would be interesting to know how the increased
importance of vertical specialization would affect gain-and-
loss calculations. For example, would regional trade agree-
ments lead to more or less trade diversion? What would
happen to the attractiveness of regional trade agreements
relative to world trade agreements? We note that all of our
case studies involve either regional trading agreements or
arrangements. In each case study, a relatively low-wage
country engages in final assembly and a relatively high-
One clear policy implication of vertical
specialization is that further tariff
liberalization could yield substantial gains.
94 FRBNY ECONOMIC POLICY REVIEW / JUNE 1998
wage country engages in parts and components production.
These regional agreements and arrangements clearly boost
trade and produce gains for the participants. Whether
these gains come at the expense of other countries is yet to
be determined.
CONCLUSION The rising international trade shares of GDP are probably
the most commonly cited evidence of the globalizing
world economy. In this article, we identify a deeper dimen-
sion of the rising trade shares: the increased importance of
imported inputs in the production of goods that are
exported—that is, vertical specialization. Our evidence
from case studies and input-output tables points to large
and increasing shares of trade that can be attributed to ver-
tical-specialization-based trade. In some of the smaller
countries examined, the shares of total trade represented by
vertical trade approach 50 percent.
Hence, globalization has gone beyond just “more
trade.” The nature of trade has changed to the point where
countries increasingly specialize in producing particular
stages of a good, rather than making a complete good from
start to finish. This vertical trade is also what links height-
ened international trade to greater international produc-
tion. In all likelihood, the forces that have led to increased
vertical trade—lower trade barriers and improvements in
transportation and communications technologies—will
continue. Thus, we can expect the importance of vertical
trade to grow as the world economy heads into the twenty-
first century.
APPENDIX FRBNY ECONOMIC POLICY REVIEW / JUNE 1998 95
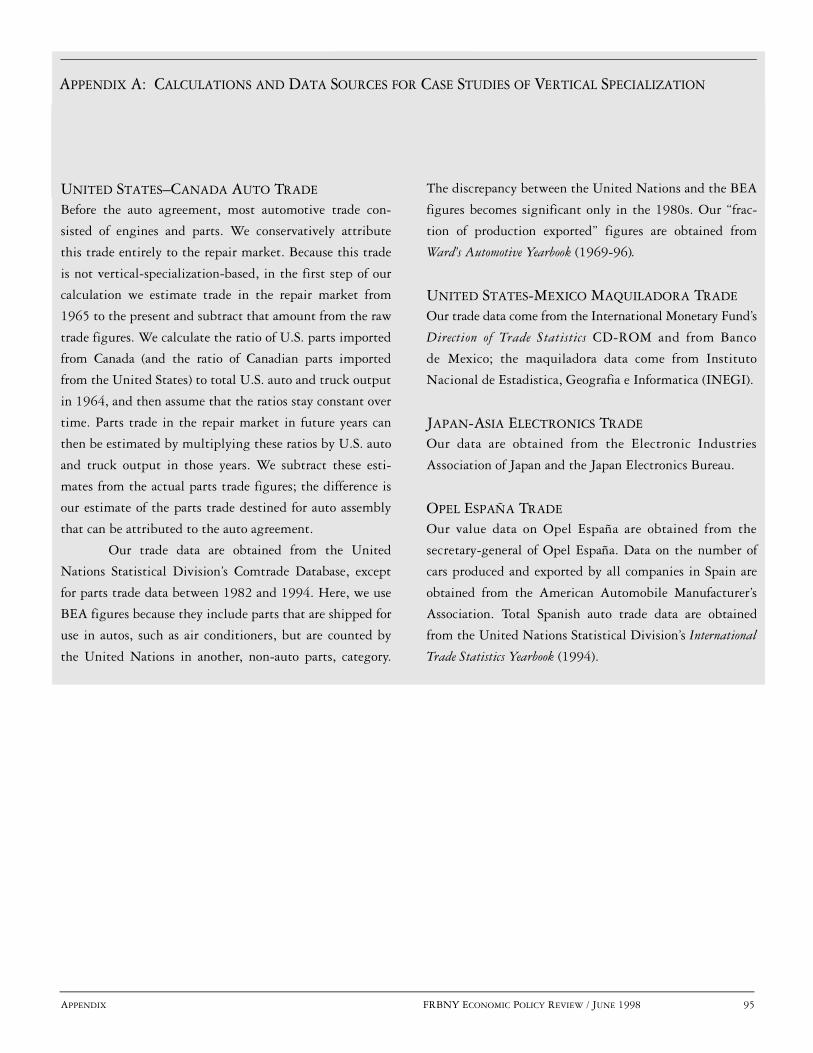
UNITED STATES–CANADA AUTO TRADE Before the auto agreement, most automotive trade con-
sisted of engines and parts. We conservatively attribute
this trade entirely to the repair market. Because this trade
is not vertical-specialization-based, in the first step of our
calculation we estimate trade in the repair market from
1965 to the present and subtract that amount from the raw
trade figures. We calculate the ratio of U.S. parts imported
from Canada (and the ratio of Canadian parts imported
from the United States) to total U.S. auto and truck output
in 1964, and then assume that the ratios stay constant over
time. Parts trade in the repair market in future years can
then be estimated by multiplying these ratios by U.S. auto
and truck output in those years. We subtract these esti-
mates from the actual parts trade figures; the difference is
our estimate of the parts trade destined for auto assembly
that can be attributed to the auto agreement.
Our trade data are obtained from the United
Nations Statistical Division’s Comtrade Database, except
for parts trade data between 1982 and 1994. Here, we use
BEA figures because they include parts that are shipped for
use in autos, such as air conditioners, but are counted by
the United Nations in another, non-auto parts, category.
The discrepancy between the United Nations and the BEA
figures becomes significant only in the 1980s. Our “frac-
tion of production exported” figures are obtained from
Ward’s Automotive Yearbook (1969-96).
UNITED STATES-MEXICO MAQUILADORA TRADE
Our trade data come from the International Monetary Fund’s
Direction of Trade Statistics CD-ROM and from Banco
de Mexico; the maquiladora data come from Instituto
Nacional de Estadistica, Geografia e Informatica (INEGI).
JAPAN-ASIA ELECTRONICS TRADE
Our data are obtained from the Electronic Industries
Association of Japan and the Japan Electronics Bureau.
OPEL ESPAÑA TRADE
Our value data on Opel España are obtained from the
secretary-general of Opel España. Data on the number of
cars produced and exported by all companies in Spain are
obtained from the American Automobile Manufacturer’s
Association. Total Spanish auto trade data are obtained
from the United Nations Statistical Division’s International
Trade Statistics Yearbook (1994).
APPENDIX A: CALCULATIONS AND DATA SOURCES FOR CASE STUDIES OF VERTICAL SPECIALIZATION
96 FRBNY ECONOMIC POLICY REVIEW / JUNE 1998 APPENDIX
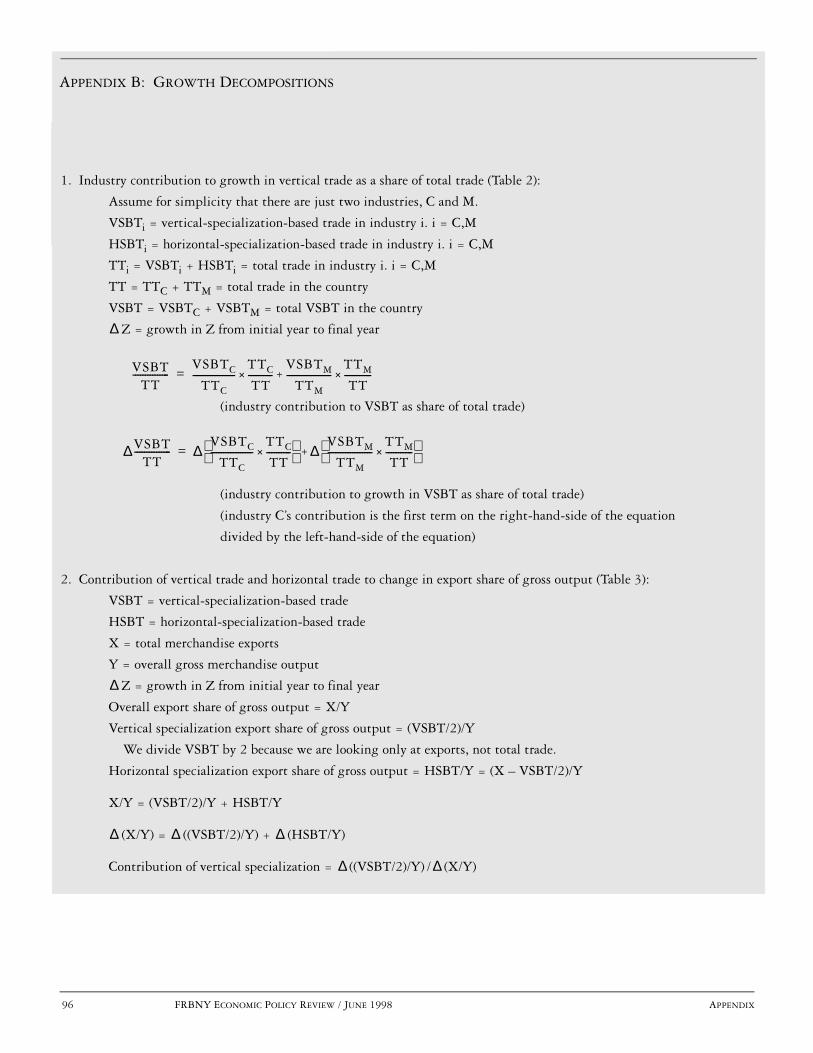
1. Industry contribution to growth in vertical trade as a share of total trade (Table 2):
Assume for simplicity that there are just two industries, C and M.
VSBTi = vertical-specialization-based trade in industry i. i = C,M
HSBTi = horizontal-specialization-based trade in industry i. i = C,M
TTi = VSBTi + HSBTi = total trade in industry i. i = C,M
TT = TTC + TTM = total trade in the country
VSBT = VSBTC + VSBTM = total VSBT in the country
Z = growth in Z from initial year to final year
(industry contribution to VSBT as share of total trade)
(industry contribution to growth in VSBT as share of total trade)
(industry C’s contribution is the first term on the right-hand-side of the equation
divided by the left-hand-side of the equation)
2. Contribution of vertical trade and horizontal trade to change in export share of gross output (Table 3):
VSBT = vertical-specialization-based trade
HSBT = horizontal-specialization-based trade
X = total merchandise exports
Y = overall gross merchandise output
Z = growth in Z from initial year to final year
Overall export share of gross output = X/Y
Vertical specialization export share of gross output = (VSBT/2)/Y
We divide VSBT by 2 because we are looking only at exports, not total trade.
Horizontal specialization export share of gross output = HSBT/Y = (X – VSBT/2)/Y
X/Y = (VSBT/2)/Y + HSBT/Y
(X/Y) = ((VSBT/2)/Y) + (HSBT/Y)
Contribution of vertical specialization = ((VSBT/2)/Y) / (X/Y)
∆
VSBTTT
---------------VSBTC
TTC
-----------------TTC
TT----------
VSBTM
TTM
------------------TTM
TT-----------×+×=
∆VSBTTT
--------------- ∆VSBTC
TTC
-----------------TTC
TT----------×
∆+VSBTM
TTM
------------------TTM
TT-----------×
=
∆
∆ ∆ ∆
∆ ∆
APPENDIX B: GROWTH DECOMPOSITIONS

ENDNOTES
NOTES FRBNY ECONOMIC POLICY REVIEW / JUNE 1998 97
The authors thank Lucinda Vargas-Ambacher and Tomoko Mischke forproviding data and information on the maquiladoras and the Japanese electronicsindustry, respectively, and Jim Harrigan and two anonymous referees for veryhelpful comments.
1. Many economists, including Krugman (1995) and Irwin (1996),have noted that the international trade shares today are not much higherthan they were in the early twentieth century. Nevertheless, the growthin trade is striking, and these economists acknowledge that the nature oftrade is different today.
2. Balassa (1967, p. 97) may have coined the term vertical specialization.We later show how our adapted definition differs from his.
3. These case studies draw from Ishii and Yi (1997).
4. Balassa’s definition of vertical specialization encompasses parts 1and 2 of our definition. We also choose to include a part 3 to distinguishvertical specialization from intermediate goods trade in a broad sense.Sanyal and Jones (1982), among others, note that most importedgoods—even so-called final goods such as motor vehicles—need salesand marketing services “added on” to them. Thus, almost all importedgoods can be viewed as intermediate goods. By examining those goodsthat involve more than one border crossing, we limit our study to goodsdestined for export that are actually created through the sequentialcontributions of different countries. We thereby avoid the moreambiguous notion of intermediate goods.
5. Take Nike as an example. By most definitions, Nike is not avertically integrated multinational firm because the footwear productionoccurs through arm’s-length relationships. Yet to the extent thatthe footwear-producing countries import Nike services and otherinputs and export Nike footwear, vertical-specialization-based tradeoccurs. In addition, vertical integration and vertical FDI deal withissues of ownership and internalization; vertical specialization does not.
6. In 1989, chemicals and allied products, machinery, andtransportation equipment accounted for about 60 percent ofmanufacturing multinational gross product and about 35 percent of totalmultinational gross product (see Mataloni and Goldberg [1994]).
While multinational firms account for a majority of U.S. trade, theirshare of U.S. trade declined from 1977 to the mid-1990s. Zeile (1993,1995) shows that the importance of foreign multinational firms to U.S.trade has been increasing; nevertheless, overall U.S. and foreignmultinational trade has still been declining. These facts indicate thatvertical trade goes beyond multinational firms.
7. Hereafter, “vertical-specialization-based trade” and “vertical trade”are used interchangeably.
8. While each good likely requires numerous production steps, weassume that these steps can be grouped into two stages.
9. See Economic Council of Canada (1975, p. 197). The agreementincluded two important restrictions: total production in Canada roughlyhad to match total sales in Canada, and 60 percent of the value added inCanadian-made cars had to be of Canadian origin (Wonnacott andWonnacott 1967). A plausible argument can be made that the absence ofthese restrictions would have led to more vertical-specialization-basedtrade.
10. U.S. vehicles, engines, and parts exported to Canada as a fraction oftotal exports to Canada increased from 13 percent in 1964 to 30 percentin 1968. U.S. vehicles, engines, and parts imported from Canada as afraction of total imports from Canada increased from less than 3 percentin 1964 to about 30 percent in 1968. As of 1995, engines and partsaccounted for about 40 percent of U.S.-Canadian automotive trade. TotalU.S. trade in vehicles, engines, and parts relative to U.S. auto and truckoutput increased from 9 percent in 1960 to 61 percent in 1994. Enginesand parts accounted for more than 45 percent of total automotive tradein 1994.
11. Indeed, one of the major undergraduate textbooks in internationaleconomics, Krugman and Obstfeld (1997), discusses the auto agreementas such.
12. U.S. firms own the vast majority of maquiladoras, although there isincreasing ownership by firms from Japan, Korea, and some Europeannations.
13. These are Harmonized Tariff System (HTS) items 9802.00.60 and9802.00.80. They were formerly known as items 806.30 and 807.00 ofthe Tariff Schedule of the United States (TSUS). Item 9802.00.60concerns tariff treatment for metal of U.S. origin processed in a foreignlocation and returned to the United States, while item 9802.00.80involves goods that contain U.S.-made components (Hufbauer andSchott 1992, p. 93).
14. Much of the data that follow originate from Instituto Nacional deEstadistica, Geografia e Informatica (INEGI). Hanson (1996) draws fromthese data as well.
15. Over the last decade, two provisions have been passed to easerestrictions and one to tighten restrictions on the amount of maquiladoraoutput that could be sold in Mexico. While there are no hard figures onthe results of these rule changes, reports of factory managers in Mexicosuggest that virtually all production is still exported to the United States.See Wilson (1992, pp. 40-1).
98 FRBNY ECONOMIC POLICY REVIEW / JUNE 1998 NOTES
ENDNOTES (Continued)
Note 15 continuedThe presence of non-U.S.-owned firms in the maquiladora industry
has made it likely that some of the inputs imported by Mexico are fromnon-U.S. sources. In 1989, approximately 4 percent of maquiladoras wereJapanese- or Korean-owned. Moreover, it is plausible that U.S.-ownedfirms also rely on inputs imported from non-U.S. sources. However, wedo not know the extent of this non-U.S. sourcing. In vertical tradecalculations for Mexico, the origin of the imported inputs does notmatter; it matters only when we calculate the vertical trade share of totalUnited States–Mexico trade.
16. Vertical trade = $3.6 billion + ($3.6 billion) (.7/.9) (.78/.22) =$13.5 billion. Total auto trade data are not yet available for 1995.
17. The G-7 nations are Canada, France, Germany, Italy, Japan, theUnited Kingdom, and the United States.
18. In 1970, manufacturing accounted for about 60 percent of worldmerchandise trade; in 1996, it accounted for about 75 percent.
19. Italy is not shown on the chart because the OECD data hadinformation only for 1985.
20. We convert all countries’ figures into 1989 dollars using 1989exchange rates and the U.S. consumer price index. In several countries,vertical trade as a share of total trade declined between the next-to-lastyear and the last year. Most of the declines were relatively small, and noneaffects the underlying upward trends. By examining the data morecarefully, we find that the largest decline, which occurred in theNetherlands between 1981 and 1986, is mainly explained bydevelopments in the petroleum and coal products industry. The declinein oil prices between 1981 and 1986 would have lowered the share ofimported inputs in gross output, reducing the estimated importance ofvertical trade. Correlations presented below indicate that despite thedecline, vertical trade as a share of total trade and trade as a share of grossoutput are highly correlated for all countries except Japan.
× ×
21. Some caution should be used in interpreting each correlationcoefficient because there are only four or five data points for each country.
22. When we ran the regression in first differences and without thecountry dummies, we obtained similar coefficient estimates; also, theadjusted R2 was 0.35.
23. The figures for Japan in the top and bottom halves of the table canbe reconciled as follows: machinery vertical trade as a share of machinerytrade grew, which made the fall in overall vertical trade as a share of totaltrade smaller, thereby contributing negatively to the (negative) growth.
24. These two forces have also facilitated specialization by allowingcountries to take advantage of economies of scale. However, there is somedisagreement about the relative importance of these two forces inexplaining the growth of trade. See, for example, Rose (1991), Krugman(1995), and Bergstrand (1996).
25. See Hummels (1997).
26. Another factor that would favor vertical trade is the changingtechnology of goods production. Goods may require more productionsteps today than in the past: for example, the typical pharmaceutical drugneeds fifteen or more production steps. The increase in the number ofthese steps heightens countries’ opportunities to specialize in particularstages.
27. Ishii and Yi (1997) develop a model in which the gains from tariffreduction are several times larger when vertical specialization is included.
The views expressed in this article are those of the authors and do not necessarily reflect the position of the Federal ReserveBank of New York or the Federal Reserve System. The Federal Reserve Bank of New York provides no warranty, express orimplied, as to the accuracy, timeliness, completeness, merchantability, or fitness for any particular purpose of any informationcontained in documents produced and provided by the Federal Reserve Bank of New York in any form or manner whatsoever.

REFERENCES
NOTES FRBNY ECONOMIC POLICY REVIEW / JUNE 1998 99
Balassa, Bela. 1967. TRADE LIBERALIZATION AMONG INDUSTRIAL
COUNTRIES. New York: McGraw-Hill.
Beigie, Carl. 1970. THE CANADA-U.S. AUTOMOTIVE AGREEMENT.Quebec: Canadian American Committee.
Bergsten, C. Fred. 1997. “American Politics, Global Trade.” ECONOMIST,September 27, 23-6.
Bergstrand, Jeff. 1996. “The Growth of World Trade: Tariffs vs.Technology.” Unpublished paper, University of Notre Dame,October.
Bhagwati, Jagdish. 1997. “Fast Track to Nowhere.” ECONOMIST,October 18, 21-3.
Economic Council of Canada. 1975. LOOKING OUTWARD: A NEW TRADE
STRATEGY FOR CANADA.
Hanson, Gordon H. 1996. “Localization Economies, VerticalOrganization, and Trade.” AMERICAN ECONOMIC REVIEW 86, no. 5:1266-78.
Hufbauer, Gary C., and Jeffrey J. Schott. 1992. NORTH AMERICAN FREE
TRADE: ISSUES AND RECOMMENDATIONS. Washington, D.C.:Institute for International Economics.
Hummels, David. 1997. “Towards a Geography of Trade Costs.”Unpublished paper, University of Chicago.
Irwin, Douglas A. 1996. “The United States in a New Global Economy?A Century’s Perspective.” AMERICAN ECONOMIC REVIEW 86, no. 2:41-6.
Ishii, Jun, and Kei-Mu Yi. 1997. “The Growth of World Trade.” FederalReserve Bank of New York Research Paper no. 9718, May.
Krugman, Paul R. 1995. “Growing World Trade: Causes andConsequences.” BROOKINGS PAPERS ON ECONOMIC ACTIVITY, no. 1:327-77.
Krugman, Paul R., and Maurice Obstfeld. 1997. INTERNATIONAL
ECONOMICS: THEORY AND POLICY. 4th ed. New York: Addison-Wesley.
Markusen, James R. 1997. “Trade Versus Investment Liberalization.”Unpublished paper, University of Colorado, August.
Mataloni, Raymond, Jr., and Lee Goldberg. 1994. “Gross Product of U.S.Multinational Companies, 1977-91.” SURVEY OF CURRENT
BUSINESS, February: 42-63.
Rose, Andrew. 1991. “Why Has Trade Grown Faster than Income?”CANADIAN JOURNAL OF ECONOMICS 24, no. 2: 417-27.
Sanyal, Kalyan K., and Ronald W. Jones. 1982. “The Theory of Trade inMiddle Products.” AMERICAN ECONOMIC REVIEW 72, no. 1: 16-31.
United Nations Conference on Trade and Development. 1996. WORLD
INVESTMENT REPORT, 1996: INVESTMENT, TRADE AND
INTERNATIONAL POLICY ARRANGEMENTS. New York: UnitedNations.
United Nations Statistical Division. 1994. INTERNATIONAL TRADE
STATISTICS YEARBOOK. Vol. 1, TRADE BY COUNTRY. New York:United Nations.
U.S. Department of Commerce. Bureau of Economic Analysis. 1994-96.SURVEY OF CURRENT BUSINESS. Various issues. Washington, D.C.:U.S. Government Printing Office.
Ward’s Communications, Inc. 1969-96. WARD’S AUTOMOTIVE
YEARBOOK. 31st-58th eds.
Wells, Louis T. 1993. “Mobile Exporters: New Foreign Investors in EastAsia.” In K.A. Froot, ed., FOREIGN DIRECT INVESTMENT. Chicago:University of Chicago Press.
Wilson, Patricia A. 1992. EXPORTS AND LOCAL DEVELOPMENT:MEXICO’S NEW MAQUILADORAS. Austin: University of Texas Press.
Wonnacott, Ronald, and Paul Wonnacott. 1967. FREE TRADE BETWEEN
THE UNITED STATES AND CANADA: THE POTENTIAL ECONOMIC
EFFECTS. Cambridge: Harvard University Press.
Zeile, William J. 1993. “Merchandise Trade of U.S. Affiliates of ForeignCompanies.” SURVEY OF CURRENT BUSINESS, October: 52-65.
———. 1995. “Foreign Direct Investment in the United States.”SURVEY OF CURRENT BUSINESS, May: 57-81.