vesting of private pension benefits in 1979 and …vesting of private pension benefits in 1979 and...
TRANSCRIPT

Vesting of Private Pension Benefits in 1979 and Change From 1972
by Gayle Thompson Rogers*
This article examines the prevalence of vested private pension benefits in 1979 as reported by full-time private wage and salary workers actively participating in pension plans. It also analyzes the effect of selected demographic, economic, labor-force, and plan characteristics on vested status.
Years of participation in a plan was by far the most impor- tant predictor of vested status. Age was positively related to vested status even after accounting for the longer plan partici- pation of older workers. Evidence pertaining to occupation, size of firm, and type of employer plan suggests that multi- employer plans and those covering professional and managerial workers and the employees of the smallest firms have more rapid vesting schedules than plans covering other workers. Sex, race, union representation, and earnings had little meaningful effect on vested status.
This article also examines change in the prevalence of vesting after passage of the Employee Retirement Income Security Act (ERISA) by comparing reported vested rates for 1972 and 1979. The proportion of plan participants reporting vested benefits rose substantially during this period, a finding suggestive of ERISA’s substantial impact. The magnitude of the change is examined by years of service with employer, age, sex, earnings, occupation, and industry.
Private pension benefits are an important supplement to benefits received from the old-age, survivors, and dis- ability insurance (OASDI) program, more commonly known as the social security program. Retired persons receiving private pensions in addition to social security benefits have substantially higher retirement incomes, a much lower probability of poverty, and a higher re- placement of their preretirement earnings than those who only receive social security.
Median total money income in 1978 for social security beneficiaries (married couples and nonmarried individ- uals) aged 65 and older was $9,190 for those receiving additional income from private pensions but only $4,210 for those whose only retirement pension was from social security.] The poverty rates for these two
*Division of Retirement and Survivors Studies, Office of Research and Statistics, Office of Policy, Social Security Administration.
t Susan Grad, Income of the Population 55 and Older, 1978 (Staff Paper forthcoming),‘Office of Research and Statistics, Office of Pol- icy, Social Security Administration, table 35.
groups were 2 percent and 32 percent, respectively. Me- dian earnings replacement rates among married men aged 63-69 in 1973-74 were 52 percent for those receiv- ing second pensions as well as social security benefits and 38 percent for those receiving social security bene- fits only.2
Despite the important contribution that private pen- sion benefits make to retirement income, a minority of older persons receive such income. Among social security beneficiaries aged 65 and older in 1978, 33 percent of the married couples, 24 percent of the non- married men, and 13 percent of the nonmarried women received income from private pensions or annuities.3
Many current retirees not receiving private pension benefits had never participated in private pension plans
2 Alan Fox, “Earnings Replacement Rates of Retired Couples: Findings from the Retirement History Study,” Social Security Bulletin, January 1979, table 8.
3 Susan Grad, op. cit., table 3.
12 Social Security Bulletin, July 1981/Vol. 44, No. 7

and thus had had no opportunity to earn benefits.4 Of those who had participated, some changed to jobs not covered by the same plan or left the labor market before qualifying for benefits. Other participants remained in their plans long enough to quaiify for benefits (vested participants) but, upon separation from the plan or re- tirement, received a lump-sum disbursement in ex- change for monthly retirement benefits. Still other vested participants lost benefits because of plan ter- minations or company bankruptcies.
The number and proportion of private wage and sal- ary workers covered5 by private pension plans ex- panded substantially in the 1950’s and more slowly in the 1960’s and the first half of the 1970’s. The number of private pension beneficiaries and the ratio of bene- ficiaries to active covered workers also has expanded considerably, particularly since 1960.6
Private pension benefits undoubtedly will be more prevalent among future generations of retired persons, both as a result of the normal maturation of the private pension system, and in response to the more liberal vest- ing requirements and termination insurance mandated by the Employee Retirement Income Security Act (ERISA) of 1974. Barring new legislative initiatives, however, many future retirees will not receive these benefits. Many currently noncovered workers are em- ployed in small, low-wage, nonunionized industries where extensive new plan formation is unlikely.’ Of those who are covered, many-particularly highly mo- bile and intermittent workers-will continue to leave their plans before meeting the vesting requirements or will receive lump-sum benefits upon separation from their plans.
Research Objectives This article analyzes data relating to the prevalence of
vested private pension benefits in 1979 as reported by full-time 8 wage and salary workers in the employed pri- vate labor force who were active participants in pension
4 For an analysis of characteristics related to coverage and benefit receipt among retiring workers, see Gayle B. Thompson, “Pension Coverage and Benefits, 1972: Findings From the Retirement History Study,” Social Security Bulletin, February 1978, pages 3-17.
5 Covered workers are defined as those who are actively p’articipat- ing in pension plans, that is, who are actively accruing pension credits. The terms “coverage” and “participation” are used synonymously in this article.
6 Martha Remy Yohalem, “Employee Benefit Plans, 1975,” Social Security Bulletin, November 1977, table 6.
’ Daniel J. Beller, “Coverage Patterns of Full-Time Employees Under Private Retirement Plans,” Social Security Bulletin, July 1981, page 3; Gayle Thompson Rogers, Pension Coverage and Vesting Among Private Wage and Salary Workers, 1979 (Working Paper No. 16). Office of Research and Statistics, Office of Policy, Social Security Administration, June 1980.
* Full-time workers are defined as those who usually work 35 or more hours per week on their principal job.
plans.9 It examines whether and how selected demo- graphic, economic, labor-force, and plan characteristics affect vested status apart from the influence of years of plan participation. The specific characteristics examined are: Years of plan participation, age, annual earnings, sex, race, occupation, size of firm, union representa- tion, and type of employer plan. The article also exam- ines changes in the prevalence of vested benefits between 1972 and 1979, that is, before and after the passage of ERISA.
The term “vesting” refers to the nonforfeitable rights of employees to receive benefits based on employer con- tributions, that is, rights to benefits even if the em- ployees should cease active participation in their plans at any time before the normal retirement age. They ac- quire these rights by satisfying the vesting requirements stated in their plans. In general, the vested benefit is based on their accrued pension credits up to the time that they separate from the plan and is payable at normal or early retirement age. If the accrued benefit value is under $1,750 at the time of an employee’s sep- aration from the plan, a defined-benefit plan can cash out this value and provide the employee with a lump- sum distribution. With the employee’s consent, benefit values in excess of that amount can also be cashed out. The employee is permitted a tax-free rollover of a lump- sum distribution into an Individual Retirement Account (IRA).
Before ERISA, plans were not legally required to con- tain vesting provisions. They could deny benefits to par- ticipants, even to those with long service under the plan, who withdrew from active participation before attaining retirement age. In 1969, 23 percent of the active partici- pants in plans with 26 or more participants were in plans with no vesting provisions. lo Thirty-four percent were in plans requiring 5-10 years of service under the plan for vesting, 30 percent in plans requiring 1 l-15 years, and 11 percent in plans with more stringent requirements. Only 1 percent were in plans requiring less than 5 years.
With the passage of ERISA, tax-qualified plans were required to incorporate a vesting schedule at least as lib- eral as one of the following:
(1) Cliff vesting: full (100 percent) vesting after 10 years of participation in the plan, with no vesting be- fore completion of 10 years.
(2) Graded vesting (5 to 15 years): 25 percent vesting after 5 years of participation, plus 5 percent for each additional year of participation up to 10 years (50 per- cent vesting after 10 years), plus an additional 10 per-
* 9 The Department of Labor has prepared a companion article
examining pension coverage data from the same survey. See Daniel J. Beller, op. cit.
to Harry E. Davis and Arnold Strasser, “Private Pension Plans, 1960 to l969-An Overview,” Monthly Labor Review, July 1979, table2.
Social Security Bulletin, July 1981/Vol. 44, No. 7

cent for each year thereafter (100 percent vesting after 15 years of participation).
(3) “Rule of 45” (based on age and participa- tion): 50 percent vesting for an employee with at least 5 years of participation when his or her age and years of participation add up to 45, plus 10 percent for each year thereafter.
Under any of these options, an employee must be at least 50 percent vested after 10 years of participation and 100 percent vested after 15 years, regardless of age.
Very few pension plans have adopted the “rule of 45” schedule.” Large plans, particularly those intended to provide basic retirement benefits, generally have adopted a lo-year cliff-vesting schedule. Small plans tend to have more rapid vesting schedules. According to a recent survey by the American Society of Pension Ac- tuaries, 59-67 percent of the defined-benefit plans with lOl-9,999 participants have a lo-year cliff-vesting schedule.i2 Substantially fewer defined-benefit plans with 100 or fewer participants use that schedule: l-2 percent of plans with 10 or fewer participants, 14-19 percent with 1 l-22 participants, and 26 percent with 26-100 participants.
Many of these small plans were found to have vesting schedules more liberal than required by ERISA. A 4/40 vesting schedule, for example, is common in the small- est plans. This schedule provides 40 percent vesting after 4 years, increasing to 100 percent after 11 years, and may be adopted as a “safe harbor” from standard In- ternal Revenue Service audit procedures for discrim- inatory vesting. Tax-qualified pension plans are not per- mitted to discriminate in favor of highly paid employees and thus must document nondiscrimination unless they have adopted a 4/40 or more liberal vesting schedule or unless there is evidence of actual misuse.
A 4/40 schedule has been adopted by 34-37 percent of plans with fewer than 10 participants, by 5-14 per- cent of those with 1 l-25 participants, and by 12 percent of those with 26-100 participants. Many of the small plans have vesting standards even more liberal than the 4/40 schedule.
Methodology Data Base
The data for this analysis were obtained from the 1972 and 1979 surveys of coverage and vesting under pension plans jointly sponsored by the Social Security
‘1 American Society of Pension Actuaries, An Analysis of the Characteristics of Small and Medium Size Employer Sponsored Pri- vate Retirement Plans and A Model Comparison of the Benefits and Costs Associated with Various Alternative Plan Types and Benefit Provisions, Report to the President’s Commission on Pension Policy, December 1980, table 15.
I* Ibid.
Administration and the Department of Labor.” Both pension surveys were supplements to the monthly Bu- reau of the Census Current Population Surveys (CPS). The primary emphasis in this article is on the 1979 data.
The term “pension plan,” as used in the surveys, re- fers to employer-financed defined-benefit and defined- contribution plans designed to provide retirement bene- fits to employees. Excluded from this definition are IRA’s and annuities purchased by individuals and Keogh accounts purchased by self-employed individuals for their own retirement. Keogh accounts provided to the employees of self-employed persons are considered pension plans.
Measurement of Vested Status, 1979 Survey respondents who indicated that they were ac-
tive participants in pension plans on their current (May 1979) jobs were asked the following question to measure whether or not they had acquired vested rights to bene- fits:
If you left your employer and were no longer included in your present pension or retirement plan, could you receive some benefits at retirement age?
The vested data presented in this article are based on all possible responses to this question-yes, no, and don’t know.
The vested rates cited here indicate the proportion of plan participants who reported that they were vested. They deviate from, and probably underestimate, the “true” proportion with vested benefits for two reasons. First, plan participants who did not know if they were vested- 18 percent of all participants-were included in the base from which vested rates were derived. Exclu- sion of these participants would have resulted in higher vested rates. Second, only 78 percent of participants re- porting 10 or more years of participation, instead of the 100 percent expected under ERISA, reported vested benefits. The technical note at the end of this article dis- cusses the measurement of vested status in more detail and compares alternative definitions. The vested rates presented in this article are lower than those obtained under any of the alternatives examined.
The vested rates cannot be used to estimate the pro- portion of plan participants who will receive monthly retirement benefits based on their current jobs. Some nonvested participants will eventually acquire vested rights. Conversely, some vested participants, if and when they separate from their plans, will receive lump- sum benefits in exchange for monthly benefits. Finally, as indicated above, the rates probably underestimate the
I3 A full report of the 1972 survey is presented in Walter W. Kolo- drubetz and Donald M, Landay, “Coverage and Vesting of Full-Time Employees Under Private Retirement Plans,” Social Security Bulk- tin, November 1973, pages 20-36. For more detail on the 1979 survey, see the technical note to this article.
14 Social Security Bulletin, July 1981 /Vol. 44, No. 7
proportion of current plan participants with vested benefits.
Statistical Procedure and Variables A multidimensional contingency table program
(ACT) I4 was used to analyze the predictors of vested status in 1979. The ACT program, through the parti- tioning of chi square I5 and logit analysis, makes it pos- sible to determine whether each independent variable has an effect on vested status apart from the other vari- ables studied and to determine whether and how its effect is conditioned by one or more of the other variables. Because years of participation is the key de- terminant of vested status, particular interest centered on whether the other independent variables affect vested status after accounting for years of participation and whether the nature of that effect is conditioned by the length of plan participation.
Two models were examined: a demographic and eco- nomic status model, and a labor-force and plan model. The independent variables included in each model are listed below:
Demographic and economic status model: Age Annual earnings Sex Race Years of participation
Labor-force and plan model: Occupation Size of firm Union representation Type of employer plan
All labor-force and plan characteristics refer to the principal job held at the time of the survey in May 1979 and are based on respondent reports. Years of participa- tion refers to the number of years of membership in a plan counting toward retirement benefits. Annual earn- ings are estimated by multiplying usual weekly earnings on the principal job times weeks usually worked per year on that job. Size of firm is measured in terms of the number of employees at all of a firm’s locations. It is positively related to but not synonymous with size of plan. The employees of small firms tend to belong to small plans but some belong to large, multiemployer
14 ACT, produced by CSI/Datacrown, is a modification and expan- sion of Leo Goodman’s ECTA program. This article’s author is grate- ful to Elkan Halpern of CSI/Datacrown for his invaluable assistance in the use and interpretation of ACT. For a discussion of the theoret- ical foundation of the program, see Leo A. Goodman, Analyzing Qualitative Categorical Data, Abt Books, 1978.
is The data analyzed in ACT were weighted to correct for sample design but were not inflated to produce population counts. Each Per- son’s weight was derived by dividing his or her CPS pension supple- ment weight by the average weight for all private wage and salary workers.
plans.i6 Union representation measures whether workers were represented by labor organizations. The workers may or may not have belonged to those orga- nizations, however. Type of employer plan indicates whether the plan was a single employer or a multi- employer plan.
Vested status, the dependent variable, was dicho- tomized into “vested” and “all other” responses. In other words, “no” and “don’t know” responses were combined. Readers interested in the prevalence of “don’t know” responses are referred to tables in the ap- pendix. These tables present full responses to the vesting question-vested, not vested, and don’t know-by indi- vidual characteristics and sex.
Vested Status by Selected Characteristics, 1979
Forty-eight percent of full-time workers actively par- ticipating in private pension plans in 1979 reported vested rights to benefits. Whether or not a participant reported vested benefits was highly related to the num- ber of years of participation in the plan. Twenty-eight percent of full-time workers with less than 5 years of participation reported vested benefits, compared with 42 percent of those with 5-9 years and 78 percent of those with 10 or more years.
Years of participation was by far the strongest predic- tor of vested status. The predictive power of the other independent variables was much smaller, particularly after accounting for their relationships with years of participation. These conclusions are supported by the relative size of the entropy statistic, which is a measure of the strength of the relationship between independent and dependent variables. The entropy for years of par- ticipation was 0.147 when considered alone and 0.073 and 0.143 after accounting for the effects of all other variables in the demographic and economic status model and the labor-force and plan model, respectively.
The entropies of the other independent variables are displayed in the following tabulation. The first column indicates the entropy for each variable alone-that is, before accounting for the effects of the other variables in its model. The entropies indicate that, with the excep- tion of age and earnings, the relationship between each independent variable and vested status is small. The sec- ond column indicates the entropy for each variable after accounting for the effects of years of participation. The entropies for age and earnings suggest that their ap- parent relationships to vested status are largely ac- counted for by their relationships with years of partici- pation.
16 Two-thirds of plan participants in firms with fewer than 25 and 25-99 employees were members of single-employer plans and one- third were members of multiemployer plans. About three-fourths of those in larger firms belonged to single-employer plans.
Social Security Bulletin, July 1981/Vol. 44, No. 7 15

Entropy 1979 vested rates
Model
Demographic and economic status model:
Alone
After accounting for years of
participation
Years of participation
Age . . . . . . . . . . . . . . . . . . . . . . . . 0.069 0.006 Annual earnings. . . . . . . . . 3024 ,005 Sex......................... .006 ,001 Race........................ .OOl ,000
Labor-force and plan model: Occupation . . . . . . . . . ,006 .006 Size of firm . . . . . . . . .005 .004 Union representation . . . . . . . . .OOl ,001 Type of employer plan . . . . . C.001 .OOl
Median years of
Less IOor partici- Age Total than 5 5-9 more pation
Under30. . . . 27 24 32 2 30-44 . . . 47 30 42 “ii” 7 45andolder . . . . . 66 35 50 81 14
Despite the seemingly weak relationships between vested status and the independent variables other than years of participation, all but sex and union representa- tion made statistically significant I7 contributions to their models. Earnings, race, occupation, size of firm, and type of employer plan were involved in significant interactions with years of participation. This means that the nature (size or direction) of their relationships to vested status is contingent upon years of participation. The relationship of age to vested status, on the other hand, is approximately the same across all categories of years of participation. Sex and union representation are not significant predictors of vested status after account- ing for their relationships with the other variables in their models. The nature of the relationships between vested status and age, earnings, race, occupation, size of firm, and type of employer plan are discussed in more detail below.
tivity to and awareness of vesting among older workers. The data in this survey cannot directly test this hypothesis, but the data in the following tabulation pro- vide some tentative support. The proportion of plan participants who did not know if they were vested was lower among older than among younger workers even among those with the same length of participation.i8
1979 “don’t know” rates
Years of participation
Less 1Oor Age Total than 5 5-9 more
Under 30. . . . . 25 25 24 . . . 30-44 . . . . . . . . . . . 19 22 I5 14 45andolder...... 13 15 14 9
Demographic and Economic Status Characteristics
Older workers reported vested benefits more fre- quently than younger workers. The vested rates were 66 percent among plan participants aged 45 and older, 47 percent among those aged 30-44, and 27 percent among those under age 30. Since older workers on average had substantially longer plan participation, it is not surpris- ing that they reported vested benefits more often. Even after taking length of participation into account, how- ever, older workers were still more likely to report vested benefits, as noted in the tabulation in the next column.
Another possible explanation for the persistent age differences is that older workers may be concentrated in plans with more liberal vesting schedules, perhaps be- cause of their greater concern with retirement income. The results of the labor-force and plan model discussed later in this article suggest that multiemployer plans and plans covering professional and managerial workers and the employees of small firms have more liberal vesting schedules than other plans. Examination of the relation- ships between age and type of employer plan, occupa- tion, and size of firm, however, indicates that older workers were no more likely than younger workers to have those characteristics associated with more liberal pension plans.
Very few pension plans, as noted earlier, have adopted the “rule of 45” vesting schedule and thus the persistence of age differences among those with the same length of participation cannot be attributed to the existence of this schedule. It is possible, however, that the persistent age differences result from a greater sensi-
Race and earnings appear to have little meaningful ef- fect on vested status. Substantial vesting differences by earnings and race occurred only among those with 10 or more years of participation, as shown on the next page. Among workers in this participation category, reported vested rates were higher in each successive earnings class and were higher among whites than among racial minorities. Since, under ERISA, 100 percent of the par- ticipants in qualified plans with 10 or more years of par- ticipation must be vested, the observed differences in vested rates could be attributed to respondent error. Al- though the reasons are not clear, the results suggest that high earners and whites may be more aware of the vest-
t7 The level of significance set for this analysis isO.05. t* The reader will recall that, for analytical purposes, the “don’t
know” responses arecombined with the “no” responses.
16 Social Security Bulletin, July 198I/Vol. 44, No. 7

1979 vested rates by years of participation
Annual earnings and race
Annual earnings:
Less IOor than 5 5-9 more
Lessthan $10,000 . 23 40 64 $10,000-$14,999 30 42 74 $15,000-$19,999 30 38 78 $20,00Oormore. 31 45 84
Race: White . 28 41 79 Black and other. 26 45 67
ing provisions of their plans or the number of years of participation counting toward vested benefits than low earners and racial minorities.
Labor-Force and Plan Characteristics Professional and managerial workers were more like-
ly to report vested benefits than workers in other occu- pational groups even accounting for differences in years of participation, size of firm, and type of employer plan. Their greater propensity to report vested benefits within categories of years of participation is shown be- low.
1979 vested rates by years of participation
Less 1Oor Occupation than 5 5-9 more
Professional and managerial workers 33 50 86 Clerical and sales workers 27 46 74 Blue-collar workers. . . 27 34 75 Serviceworkers. . . 19 49 68
The largest difference in vested rates occurred among those with 10 or more years of participation and may re- flect a greater awareness of vesting among professional and managerial workers. That a difference also oc- curred among those with less than 10 years of participa- tion suggests that these workers tended to belong to plans with more liberal vesting schedules.
The relationship between size of firm and vested status was contingent upon years of participation. Among workers with fewer than 10 years in their plans, those employed in firms with fewer than 25 employees were much more likely to report vested benefits than workers in larger firms. This relationship did not hold among those with 10 or more years of participation, however. Within that participation category, workers employed in’ firms with 500 or more employees were more likely to report vested benefits than other workers.
The relationships discussed above are displayed in the following tabulation and in chart I. The chart plots the logarithms of the odds of reporting vested benefits. Log-odds greater than 0 indicate vested rates greater
than 50 percent, and log-odds less than 0 indicate rates less than 50 percent. In addition to demonstrating the nature of the relationship between size of firm and vested status, chart 1 provides a graphic display of the steady and steep increase in reported vested rates with increases in years of participation for each size of firm category.
1979 vested rates by years of participation
Size of firm Less lOor (number of employees) than 5 5-9 more
Fewerthan . . 39 63 74 25-99 . . . . . . . . . . . . . . . . . . . . . . . . 30 40 74 lOO-499.......................... 28 47 72 500or more. . . 28 40 82
The results of this analysis suggest that plans covering the employees of very small firms tend to have more lib- eral vesting schedules than plans covering the employees of larger firms. This conclusion is reasonable in view of the data discussed earlier concerning the vesting sched- ules adopted by small plans (see pages 13-14). The re-
Chart 1. - Reporting of vested benefits by years of par- ticipation, 1979: Log odds for different sizes of firms
Log odds
1.: :
: : :
: 1s
0.5
0.C
-0.5
-1.c
- = under 25 employees
-. - = 25-99 employees
- - = loo-499 employees
.----= = 500or more employees
-1.5 I Less than 5
I 5-9
1 10 or more
Yeari of participation
Social Security Bulletin, July 198 1 /Vol. 44, No. 7 17

suits also suggest that employees in the largest firms Chart 2.-Reporting of vested benefits by years of par- may be somewhat more knowledgeable about vesting ticipation, 1979: Log odds for single and than employees in small firms. multi-employer plans
The relationship between type of employer plan and vested status is also contingent upon years of participa- tion. The only participation category in which there was a significant difference between the participants of single and multiemployer plans was the less-than-5 years category, as shown in the following tabulation and in chart 2. Within that category, those in multiemployer plans were more likely to report vested benefits than those in single-employer plans. Among participants in multiemployer plans, the probability of reporting vested benefits was nearly the same for those with fewer than 5 years of participation as it was for those with 5-9 years in their plans. Among those in single-employer plans, however, vested rates were much higher in the 5-9 years category than in the less-than-5-years category. These results suggest that multiemployer plans have more lib- eral vesting schedules than single-employer plans.
Log odds
1979 vested rates by years of participation
Less IOor Type of employer plan than 5 5-9 more
Singleemployer. . . 27 44 80 Multiemployer . . . . . . . . 37 40 78
l.!
1s
0.:
0.1
-O.!
-l.f
-l.!
= single-employer plan -- = multiemployer plan
Change in Vested Status, 1972-79
Vested Rates
Less 59 10 or than 5 more
Years of participation
The proportion of full-time plan participants report- ing vested benefits increased substantially between the 1972 and 1979 pension surveys-from 32 percent to 48 percent.19 The distribution of participants by years of service with their employer20 was about the same in 1979 as it had been in 1972 (table 1). Therefore, the ob- served increase in reported~ vesting during the period cannot be attributed to any increase in length of service. Nor can it be attributed to any increase in knowledge of vesting since the proportion of participants who did not know if they were vested was actually higher in 1979 (18 percent) than it had been in 1972 (15 percent).
service (table 2). In other words, the largest gain oc- curred among long-service employees, most of whom would have been vested in 1979 because of ERISA regu- lations.
Several other factors could have contributed to the in- crease in reported vested rates: The natural maturation of existing pension plans, differences in the amount of respondent and measurement error in the 1972 and 1979 surveys, and differences in questionnaire design. It is impossible to determine precisely how strongly each of these factors affected the increase.
The increase, or at least part of it, undoubtedly re- sulted from the vesting standards mandated by ERISA. Vested rates increased 6 percentage points among par- ticipants with less than 5 years of service with their em- ployer, 13 points among those with 5-9 years of service, and 30 points among those with 10 or more years of
I9 In the 1972 survey, vested status was measured by responses to the following question: “If you should change to a job not covered by this plan, would you still be eligible to receive the plan’s benefits at re- tirement age?”
2o Years of service refer to years of service with the employer, not in the pension plan. Years of plan participation is not available for 1972.
Age. Vested rates increased more in the old than in the young age groups. For example, they increased 6 percentage points within the under-age-30 group and 26 points within the aged 50-and-older group. The age dif- ference in vesting gains is largely a function of the fact that older plan participants had longer service than younger ones. Median years of service with the current employer in 1979 were: 3.6 for those under age 30, ,7.4 for those aged 30-39, 12.0 for those aged 40-49, and 18.8 for those aged 50 and older. Among those with the same length of service, the percentage-point change in vested rates was nearly the same for all age groups (table 3).
18 Social Security Bulletin, July 1981/Vol. 44, No. 7

Table l.-Years of service with employer: Percentage Table 4.-Vested rates by sex and years of service with distribution of full-time private workers participating in employer, 1972 and 1979: Full-time private workers par- pension plans, 1972 and 1979 ticipating in pension plans
Percentage distribution
Vested rates Percentage-point
Men Women change, 1972-79
Years 1972 1979 1972 1979 Men Women
Total _. __. __. _, _. 34 51 26 41 I7 I5
LessthanS. 21 28 I6 21 7 5 5-9......................... 25 38 24 37 I3 I3 10-14.. _. 36 67 34 57 31 23 15-19. 49 76 39 77 27 38 20ormore.. ..,,.,..,.....__. 52 RI 43 81 29 38
Source (I 972 data): See table I, Walter W. Kolodrubetz and Donald M. Lan-
Years 1972 1979
Total percent. 100 100
Lessthan . . . . . . . . . . . . . . . . . . . . . . . . . . . . . . . . . ..t 34 36 s-9.......................................... 22 23 IO-14........................................ I3 I6 15-19........................................ II 9 20ormore ,,.__....._......................... 21 I7
Medianyears . . . . . . . . . . . . . . . . . . 8.6 8.0
Source (1972 data): Walter W, Kolodrubetzand Donald M. Landay, “Cover- age and Vesting of Full-Time Employees Under Private Retirement Plans,” So- einl Security Bulletin, November 1973. table 8.
Table 2.-Vested rates by years of service with employ- er, 1972 and 1979: Full-time private workers participat- ing in pension plans
Vested rates
Percentage-point Years 1972 I979 change, 1972-79
Total. 32 48 I6
Lessthan 5, 20 26 6 S-9.............................. 25 38 I3 IO-14............................ 36 64 28 l5-19............................ 47 76 29 20ormore . . . . . . . . . . 51 81 30
Source (1972 data): See table I, Walter W. Kolodrubetz and Donald M. Lan- day, table 8.
Table 3.-Vested rates by age and years of service with employer, 1972 and 1979: Full-time private workers par- ticipating in pension plans
Age
Years
50 and Under 30 30-39 40-49 older
1972 1979 1972 1979 1972 1979 1972 1979
I Vested rates
Total _. _. _. _. _. 21 27 27 44 38 1 57 ! 42 ! 68
Less than 10. IO-14.................... 15-19. ,.,,.,_,_,.____.... 20ormore. 51 82 51 81
Percentage-point change, 1972-79
Total 6 I7 I9 26
Lessthan IO. 5 1.2: I3 I3 10-14. _. _. _. _. 28 26 30 15-19. 29 24 35 2Oor more. 31 30
Source (I972 data): See table I, Walter W. Kolodrubetz and Donald M. Lan- day, table IO.
Sex. The overall increase in reported vesting was about the same for women as for men: 15 and 17 per- centage points, respectively (table 4). Among plan par- ticipants with 15 or more years of service, however,
day, table 8.
women experienced larger vesting gains than men. The vested rates for participants in this service category in- creased 38 percentage points among women and 28 per- centage points among men. In 1972, women with this much service were less likely than men to have reported vested benefits. By 1979, however, their vested rate was no different from that of men.
Annual earnings. The earnings variable used to com- pare 1972 and 1979 vesting data is expressed in 1971 dol- lars in order to adjust for inflation (table 5)?’ Apart from the highest earnings category ($25,000 or more), vesting gains tended to be higher in each successive earn- ings category studied-increasing from 7 percentage points for the under-$5,000 category to 22-24 points for the $15,000-$24,999 category. The generally positive as- sociation between size of the vesting gain and earnings probably results from the positive association of both of these variables to years of service.
The vesting gain for the $25,000-or-more category was nearly as low as the one observed for the lowest earnings category despite the fact that plan participants in this category tended to have longer service than other participants, as shown below. The vested rate for this group may be approaching an upper limit to the propor- tion of plan participants who can be expected to have earned vested benefits at any particular point in time.
Annual 1979 earnings Median years of service (in 1971 dollars) with employer, 1979
Less than $5,000. . 4.2 $5,000-$9,999 . . 7.3 $10,000-$14,999. . . 9.9 $15,00@$19,999. 11.7 $20,000-$24,999. 13.6 $25,OOOor more. . . 14.2
Industry and occupation. Vesting gains, as shown in table 5, were highest within the following industries:
21 The 1972 survey used annual earnings in calendar year 1971. Thus 1979 earnings were multiplied by the ratio of 1971 to May 1979 consumer price indices (121.3 A 214.3 or 0.566) in order toadjust for inflation.
Social Security Bulletin, July 198l/Vol. 44, No. 7 19
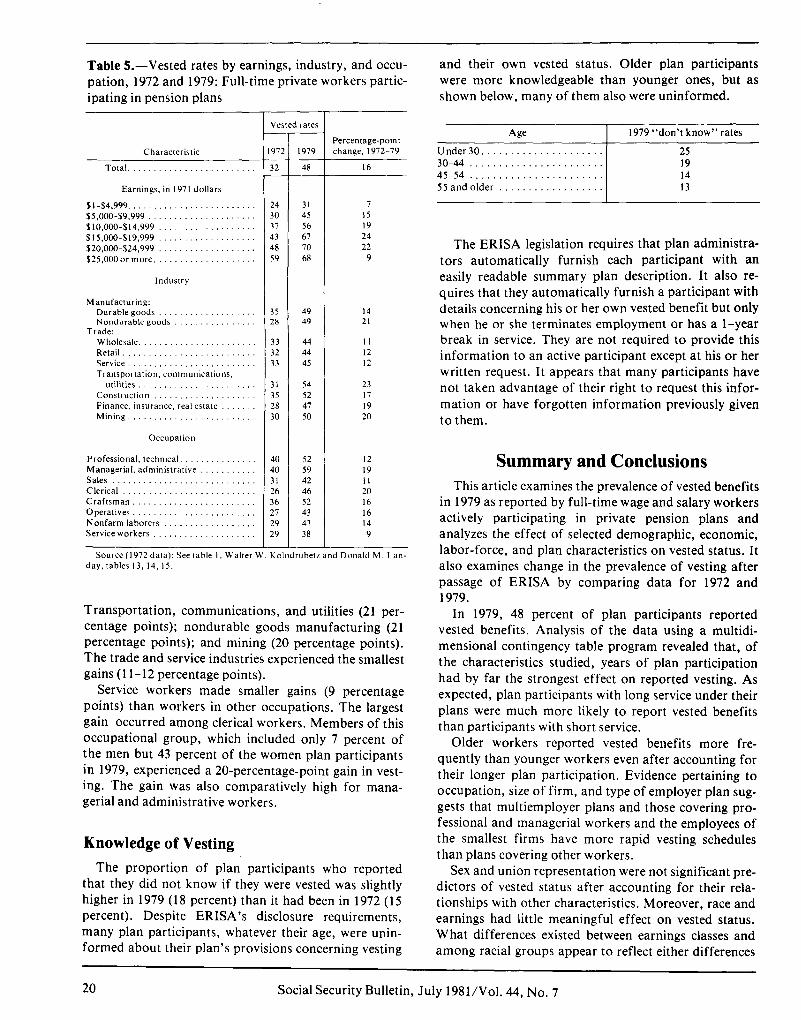
Table J.-Vested rates by earnings, industry, and occu- and their own vested status. Older plan participants pation, 1972 and 1979: Full-time private workers partic- were more knowledgeable than younger ones, but as ipating in pension plans shown below, many of them also were uninformed.
Characteristic I Percentage-point change, 1972-79
Total .........................
97;
32 -
I979
48 16
Earnings, in 1971 dollars
$I-$4.999 ......................... 24 31 7
$5,000-$9,999 ..................... 30 45 15 $l0.00&$14,999 ................... 37 56 I9
$15,000-$19.999 ................... 43 67 24
$20,000-$24,999 ................... 48 70 22
$25,00Oormore. ................... 59 68 9
Industry
Manufacturing: Durable goods ................... Nondurable goods ................
Trade: Wholesale. ...................... Retail .......................... Service ......................... Transportation, communications,
uttlrttes .......................... Construction .................... Finance, insurance, real estate Mining, ........................
35 28
49 49
14 21
33 44 I1 32 44 I2 33 45 I2
31 54 23 35 52 I7 28 47 I9 30 50 20
Occupation
Professional, technical. .......... ... Managerial, administrative Sales ........................ ... Clerical .......................... Craftsman .................... ... Operatives. ....................... Nonfarm laborers .............. ... Service workers ....................
40 52 12 40 59 I9 31 42 II 26 46 20 36 52 I6 27 43 I6 29 43 I4 29 38 9
T Vested rates -
- Source (I972 data): See table I, Walter W. Kolodrubetr and Donald M. Lan-
day, tables 13. 14, 15.
Transportation, communications, and utilities (21 per- centage points); nondurable goods manufacturing (21 percentage points); and mining (20 percentage points). The trade and service industries experienced the smallest gains (11-12 percentage points).
Service workers made smaller gains (9 percentage points) than workers in other occupations. The largest gain occurred among clerical workers. Members of this occupational group, which included only 7 percent of the men but 43 percent of the women plan participants in 1979, experienced a 20-percentage-point gain in vest- ing. The gain was also comparatively high for mana- gerial and administrative workers.
Knowledge of Vesting The proportion of plan participants who reported
that they did not know if they were vested was slightly higher in 1979 (18 percent) than it had been in 1972 (15 percent). Despite ERISA’s disclosure requirements, many plan participants, whatever their age, were unin- formed about their plan’s provisions concerning vesting
Age 1979 “don’t know” rates
Under30..................... 25 30-44 . . . . . . . . . . . . . . . . . . . . . . . 19 45-54 . . . . . . . . . . . . . ..t.... 14 55 and older . 13
The ERISA legislation requires that plan administra- tors automatically furnish each participant with an easily readable summary plan description. It also re- quires that they automatically furnish a participant with details concerning his or her own vested benefit but only when he or she terminates employment or has a l-year break in service. They are not required to provide this information to an active participant except at his or her written request. It appears that many participants have not taken advantage of their right to request this infor- mation or have forgotten information previously given to them.
Summary and Conclusions This article examines the prevalence of vested benefits
in 1979 as reported by full-time wage and salary workers actively participating in private pension plans and analyzes the effect of selected demographic, economic, labor-force, and plan characteristics on vested status. It also examines change in the prevalence of vesting after passage of ERISA by comparing data for 1972 and 1979.
In 1979, 48 percent of plan participants reported vested benefits. Analysis of the data using a multidi- mensional contingency table program revealed that, of the characteristics studied, years of plan participation had by far the strongest effect on reported vesting, As expected, plan participants with long service under their plans were much more likely to report vested benefits than participants with short service.
Older workers reported vested benefits more fre- quently than younger workers even after accounting for their longer plan participation. Evidence pertaining to occupation, size of firm, and type of employer plan sug- gests that multiemployer plans and those covering pro- fessional and managerial workers and the employees of the smallest firms have more rapid vesting schedules than plans covering other workers.
Sex and union representation were not significant pre- dictors of vested status after accounting for their rela- tionships with other characteristics. Moreover, race and earnings had little meaningful effect on vested status. What differences existed between earnings classes and among racial groups appear to reflect either differences
20 Social Security Bulletin, July 1981 /Vol. 44, No. 7

in years of participation or differences in knowledge of vesting.
The passage of ERISA in 1974 meant that tax-quali- fied private pension plans had to comply with minimum vesting standards. Although many plans already met these standards, some did not. The availability of data for both 1972 and 1979 permitted comparisons of vested rates before and after ERISA. The analysis suggests that ERISA had a major impact on increasing the prevalence of vested benefits.
The proportion of plan participants reporting vested benefits rose substantially from 1972 to 1979, from 32 percent to 48 percent. The most substantial increase oc- curred among participants with long service with their employer. The overall vesting gain for women was about the same as that for men. Among those with long service, however, the gain was larger for women. Vest- ing gains were greater for old than for young, age groups, and, with some deviation, for high than for low earners. They were also greater for clerical and for man- agerial and administrative workers than they were for the members of other occupations, and greater for workers employed in the following industries: Trans- portation, communications, and utilities; nondurable goods manufacturing; and mining.
The increase in vesting that occurred during the 1970’s undoubtedly will have a positive effect on the prevalence of private pension benefits among future re- tired generations. Many future retirees still will not re- ceive these benefits, however, because many private workers remain uncovered by the private pension sys- tem. Moreover, of those currently covered, some will withdraw from their plans before qualifying for bene- fits, and others will exchange their vested rights to monthly retirement benefits for lump-sum benefits when they leave their plans.
Technical Note
Survey Design and Sample The 1979 Survey of Pension Plan Coverage, jointly
sponsored by the Social Security Administration and the Department of Labor, was a supplement to the May 1979 Current Population Survey (CPS). The CPS is a national sample of households in the United States (ap- proximately 56,000 households in May 1979) conducted monthly by the Bureau of the Census to provide na- tional estimates of employment, unemployment, and other labor-force characteristics of the civilian, non- institutionalized population.22
The pension survey sample consisted of 31,749 em- ployed persons aged 14 and older belonging to four of
22 A detailed description of the CPS is presented in The Current Population Survey: Design and Methodology (Technical Paper No. 40), Bureau of the Census, 1978.
the eight CPS rotation groups. Complete interviews were obtained from 27,253 of these persons. The data were weighted, using a special pension supplement weight, to correct for sample design and to reflect the total number of persons in the employed labor force aged 14 and older. The sample represents an estimated 72,056,OOO private wage and salary workers, 15,932,OOO government workers, and 8,575,OOO self-employed indi- viduals.
Questionnaire and Data File The pension questionnaire gathered information in
the following areas: Coverage and vesting under em- ployer-financed pension plans on the principal job held during the survey week and on any job held previously, current individual contributions to IRA’s and Keogh ac- counts, characteristics of the current pension plan (con- tributory status and type of employer plan), and current labor-force characteristics not available from the regu- lar monthly CPS (union representation, size of estab- lishment and firm, weeks usually worked for principal employer per year, years of service with employer, and years of participation in pension plan).
Data from the pension supplement were matched with data from the regular May CPS and with 1978 income and labor-force data from the March 1979 CPS and with earnings data from the June 1979 CPS. The data file also contains May CPS-1 and March supplement data for all nonemployed persons aged 14 and older who resided in the households of pension survey sample members.
The pension data were obtained directly from sample persons through personal interviews, either by tele- phone or in person. The other data, however, were obtained either directly from sample persons or from proxies if the sample persons were not at home at the time of contact.
Alternative Definitions of Vested Status Vested status, as measured in this article, is based on
full, unimputed responses to the vesting question cited on page 22. Knowledge of vesting was less than perfect, however, and this affects the interpretation of the re- sults. Eighteen percent of the plan participants did not know if they were vested. Moreover, 22 percent of those claiming 10 or more years of participation in their plans did not report vested benefits. (Under ERISA, all par- ticipants in qualified pension plans with this length of service would be vested.) Because of the imperfect knowledge, the vested rates cited in this article should be interpreted as indicating the proportion of participants who reported vested benefits, not the “true” proportion who actually are vested.
Social Security Bulletin, July 198 1 /Vol. 44, No. 7 21
Responses to the vesting question could be handled in several ways. The alternatives are:
(1) Use of full, unimputed responses. This is the al- ternative used in this article.
(2) Classification of all participants with 10 or more years of participation as vested regardless of their re- sponses to the vesting question. Use of full, un- imputed responses for all those with less than 10 years of participation.
(3) Exclusion from the analysis of participants who didn’t know if they were vested. This alternative as- sumes that these participants are randomly dis- tributed among the known (vested and nonvested) categories.
(4) Classification of all participants with 10 or more years of participation as vested regardless of re- sponses to the vesting question. Exclusion of partici- pants with less than 10 years if they didn’t know if they were vested.
(5) Imputation of “don’t know” responses. This procedure has been implemented by ICF Incorpo- rated and is described below.
The vested rates for full-time private wage and salary plan participants obtained under alternatives l-4 are presented in table I.
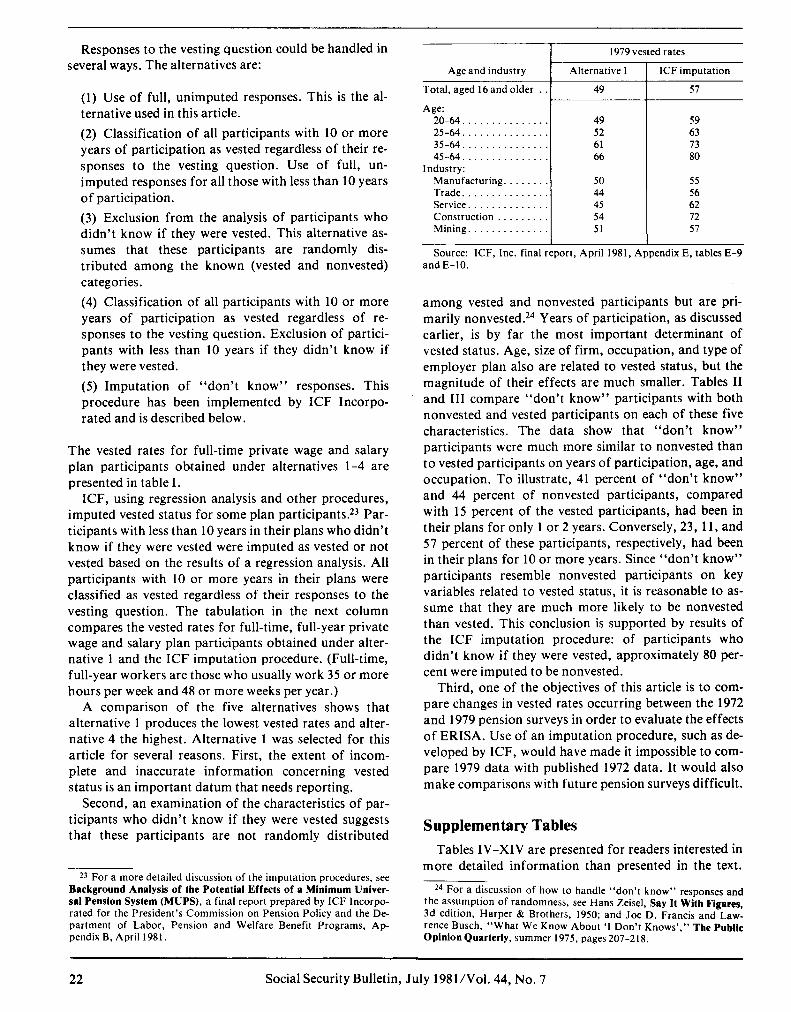
ICF, using regression analysis and other procedures, imputed vested status for some plan participants.23 Par- ticipants with less than 10 years in their plans who didn’t know if they were vested were imputed as vested or not vested based on the results of a regression analysis. All participants with 10 or more years in their plans were classified as vested regardless of their responses to the vesting question. The tabulation in the next column compares the vested rates for full-time, full-year private wage and salary plan participants obtained under alter- native 1 and the ICF imputation procedure. (Full-time, full-year workers are those who usually work 35 or more hours per week and 48 or more weeks per year.)
A comparison of the five alternatives shows that alternative 1 produces the lowest vested rates and alter- native 4 the highest. Alternative 1 was selected for this article for several reasons. First, the extent of incom- plete and inaccurate information concerning vested status is an important datum that needs reporting.
Second, an examination of the characteristics of par- ticipants who didn’t know if they were vested suggests that these participants are not randomly distributed
*3 For a more detailed discussion of the imputation procedures, see Background Analysis of the Potential Effects of P Minimum Univer- sal Pension System (MUPS), a final report prepared by ICF Incorpo- rated for the President’s Commission on Pension Policy and the De- partment of Labor, Pension and Welfare Benefit Programs, Ap- pendix B, April 1981.
1979 vested rates
Age and industry Alternative I ICF imputation
Total, aged 16 and older . 49 57
Age: 20-64............... 49 59 25-64............... 52 63 35-64............... 61 73 45-64............... 66 80
Industry: Manufacturing. . . . 50 55 Trade. . . . . . . . 44 56 Service. . . . . . 45 62 Construction . . . . . . . . 54 72 Mining. . . . . 51 57
Source: ICF, Inc. final report, April 1981, Appendix E, tables E-9 and E-10.
among vested and nonvested participants but are pri- marily nonvested. Years of participation, as discussed earlier, is by far the most important determinant of vested status. Age, size of firm, occupation, and type of employer plan also are related to vested status, but the magnitude of their effects are much smaller. Tables II and III compare “don’t know” participants with both nonvested and vested participants on each of these five characteristics. The data show that “don’t know” participants were much more similar to nonvested than to vested participants on years of participation, age, and occupation. To illustrate, 41 percent of “don’t know” and 44 percent of nonvested participants, compared with 15 percent of the vested participants, had been in their plans for only 1 or 2 years. Conversely, 23, 11, and 57 percent of these participants, respectively, had been in their plans for 10 or more years. Since “don’t know” participants resemble nonvested participants on key variables related to vested status, it is reasonable to as- sume that they are much more likely to be nonvested than vested. This conclusion is supported by results of the ICF imputation procedure: of participants who didn’t know if they were vested, approximately 80 per- cent were imputed to be nonvested.
Third, one of the objectives of this article is to com- pare changes in vested rates occurring between the 1972 and 1979 pension surveys in order to evaluate the effects of ERISA. Use of an imputation procedure, such as de- veloped by ICF, would have made it impossible to com- pare 1979 data with published 1972 data. It would also make comparisons with future pension surveys difficult.
Supplementary Tables Tables IV-XIV are presented for readers interested in
more detailed information than presented in the text.
24 For a discussion of how to handle “don’t know” responses and the assumption of randomness, see Hans Zeisel, Say It With Figures, 3d edition, Harper & Brothers, 1950; and Joe D. Francis and Law- rence Busch, “What We Know About ‘I Don’t Knows’,” The Public Opinion Quarterly, summer 1975, pages 207-218.
22 Social Security Bulletin, July 1981/Vol. 44, No. 7

Table I.-Vested rates obtained under alternative defi- Table II.-Years of participation and vested status, nitions of vested status, by employee characteristics, 1979: Full-time private workers participating in pension 1979: Full-time, private workers participating in pen- plans sion plans
Characteristic
Total. .................................
Years of plan participation: Lessthan ............................... 5-9 ................................ .... IO-14 ................................... 15ormore ................................
Age: Under30 ................................. 30-44 ................................... 45andolder ..............................
Earnings: Lessthan$lO,OOO .......................... $10,000-$14,999. .......................... $15,000-$19,999 ........................... $20,0000rmore ...........................
Sex: Men .................................... Women ..................................
Race: White ................................... Black ................................... Other ...................................
Occupation: White-collar workers .......................
Professional. technical workers. ............. Managerial, administrative workers .......... Sales workers. ........................... Clerical workers .........................
Blue-collar workers. ........................ Craftsmen, ............................. Operatives, ............................. Nonfarm laborerr ........................
Service workers. ...........................
Size of firm (number of employees): Fewerthan ............................. 25-99 ................................... 100-499 .................................. 500ormore ...............................
Union coverage: Union ................................... Nonunion ................................
Typeof employer plan: Single employer. ........................... Multiemployer ............................
Industry: Manufacturing ............................ Trade ................................... Services. ................................. Transportation, communications, utilities ....... Construction. ............................. Finance, insurance. real estate. ................ Mining.. ................................
T Alternative t
1
-- l
ii- --
-i-- -G
3
59 -
- 4 - 65
-
28 28 36 36 42 42 50 50 70 100 82 100 84 100 91 100
27 27 36 36 47 56 58 65 66 78 76 84
33 40 46 52 45 52 56 63 51 60 61 68 61 69 69 75
51 59 62 68 41 48 52 58
49 57 59 66 42 51 58 66 42 45 55 58
51 56 60 65 52 55 61 63 59 66 67 72 42 48 50 55 46 54 57 63 47 56 59 67 52 62 62 71 43 52 56 63 43 52 56 64 38 45 52 58
52 58 66 69 44 51 55 62 44 52 55 61 52 60 61 67
49 60 62 70 48 53 58 62
50 57 58 64 53 61 63 70
49 58 61 67 44 50 54 59 45 51 57 62 52 65 62 72 52 61 65 72 47 51 55 59 50 54 60 62‘ - - -
’ Refer to page21 fordescriptionof alternativedefinitions.
Tables IV-XIII display full responses to the vesting question-vested, not vested, and don’t know-by demographic, labor-force, and plan characteristics, many of which are categorized in more detail than sup- plied in the text tables. Each table presents data for all plan participants and for men and women participants
Years
Percentagedistribution
tl-rt
Percent Not Don’t responding
Vested vested know don’t know t Totalnumber(in thousands). ....... 13,397 9,305 4,691 ..... ...
Total percent. ................... 100 100 100 ..... ...
l-2 ............................... 15 44 41 24 3-4 ............................... 9 I7 I4 19 5-9 ............................... 19 27 22 17 IO-14 ............................. 21 7 I3 14 l5ormor.e ......................... 36 5 IO 8
I I I I
Table III.-Characteristics of plan participants by vest- ed status and years of participation, 1979: Full-time pri- vate workers participating in pension plans
Total:
Characteristic and years of participation c ‘we -
Not lon’t iestec <now
Percent aged 45 or older Percent in firms with less than25 employees. Percent in profewonal and managerial
occupanons Percent in multiemployer plans.
Median years of participation.
48 22 23 9 7 I2
31 26 20 26 22 27
11.7 3.7 4.3
Less than IO years of participation: Percent aged 45 or older Percent in firms with less than 25 employees. Percent in professional and managerial
occupations Percent in multiemployer plans.
25 I8 I4 14 8 II
32 27 22 27 22 27
Median years of participation 4.5 3.1 2.8
IO or more years participation: Percent aged 45 or older Percent in firms xith lest than25 employees. Percent in profewonal and managerial
occupations Percent in multiemployer plans.
65 56 54 5 4 II
Median year? of participation.
31 I9 I5 25 28 27
17.2 13.9 14.2
separately. Table XIV presents median years of partici- pation and the proportion of participants with 10 or more years of participation by each characteristic and sex.
Table I on page 11 of this issue presents the standard errors of estimated percentages of persons in the pen- sion survey. These standard errors can be used to con- struct confidence intervals about the estimated percent- ages presented in tables IV-XIII.
Reliability of Estimates Since the estimates in this report are based on a
sample, they may differ somewhat from the figures that would have been obtained had a complete census been taken using the same schedule, instructions, and enu- merators. There are two types of errors possible in an estimate based on a sample survey-sampling and non- sampling. The standard errors provided in table XV
Social Security Bulletin, July 1981 /Vol. 44, No. 7 23

Table IV.-Vested status by years of participation and sex, 1979: Percentage distribution among full-time private workers participating in pension plans
Number (in Percentage Total thousands) distribution 1 percent Vested
Vested status
Not vested
Don’t know Years
Total
2 28,843 100 100 48 33 18
11,418 42 100 28 49 23 6,186 22 100 42 41 17 4,062 I5 100 70 16 14 5,727 21 100 84 8 8
Total .............................
1-4 .................................. 5-9 .................................. 10-14 ................................ ISormore ............................
MelI
2 20,549 100 100 51 32 17
7,391 1 38 100 29 I 49 22
Total .............................
1-4 .................................. 5-9 .................................. 10-14 ................................ 15ormore ............................
4,369 22 3,077 16 4,724 24
100 41 41 18 100 72 15 13 100 84 9 7
Women
Total. ............................
1-4 .................................. 5-9 .................................. IO-14 ................................ 15ormore ............................
8,294 1 100 I 100 I 41 I 38 I 21
4,027 51 100 25 50 24 1,817 23 100 43 42 1s
985 13 100 63 16 20 1,002 13 100 83 7 10
’ Excludes those for whom years of participation are unknown. 2 Includes those for whom years of participation are unknown.
Table V.-Vested status by age and sex, 1979: Percentage distribution among full-time private workers participating in pension plans
.
AS
Total .............................
Under30 ............................. 30-44 ................................
30-34.. ........................... 35-39 .............................. 40-44 ..............................
45 or older ............................ 45-49.. ............................ 50-54.. ............................ 55 or older ..........................
55-59.. .......................... 60orolder .........................
Total .............................
Under30 ............................. 30-44 ................................
30-34 .............................. 35-39 .............................. 40-44.. ............................
45orolder ............................ 45-49.. ............................ 50-54 .............. ..: ............. 55orolder ..........................
55-59.. ............. ............ 6Oorolder .........................
Total. ............................
Under30 ............................. 30-44 ................................
30-34 .............................. 35-39.. ............................ 40-44 ..............................
45 or older ............................ 45-49 .............................. SO-54 .............................. 55orolder.. ........................
55-59.. .......................... 60 or older. ........................
I Vested status
Total percent Vested
Not Don’t vested know
Total
28,843
7,739 10,840 4,248 3,564 3,028
10,263 3,000 3,014 4,250 2,606 1,643
20,549
5,181r 7,932 3,077 2,663 2,192 7,436 2,176 2,154 3,106 1,944 1,162
100
26 38 15 12 10 36 10 10 15 9 6
100
100 100 100 100 100 100 100 100 100 100 100
h
48 33 18
27 48 25 47 34 19 38 41 21 51 31 17 54 28 17 66 21 13 60 26 14 67 22 11 69 18 13 69 19 12 70 15 15
51 32 17
28 48 24 50 33 17 38 41 20 55 30 15 58 25 16 69 19 12 63 24 13 72 18 9 71 16 13 70 17 13 72 13 15
100 I 100
---q-g-
13 100 11 100 36 100 11 100 ! 10 100 15 100 9 100 6 100
Women
100 100 41 38 I 21 8,294
2,558 31 100 24 49 27 2,908 35 100 40 38 22 1,171 14 100 37 41 22
901 11 100 41 37 22 836 10 100 44 35 21
2,828 34 100 58 27 I5 824 10 100 53 29 18 860 10 100 54 30 16
1,143 14 100 65 22 13 662 8 100 64 25 11 481 6 100 66 19 15
24 Social Security Bulletin, July 1981/Vol. 44, No. 7
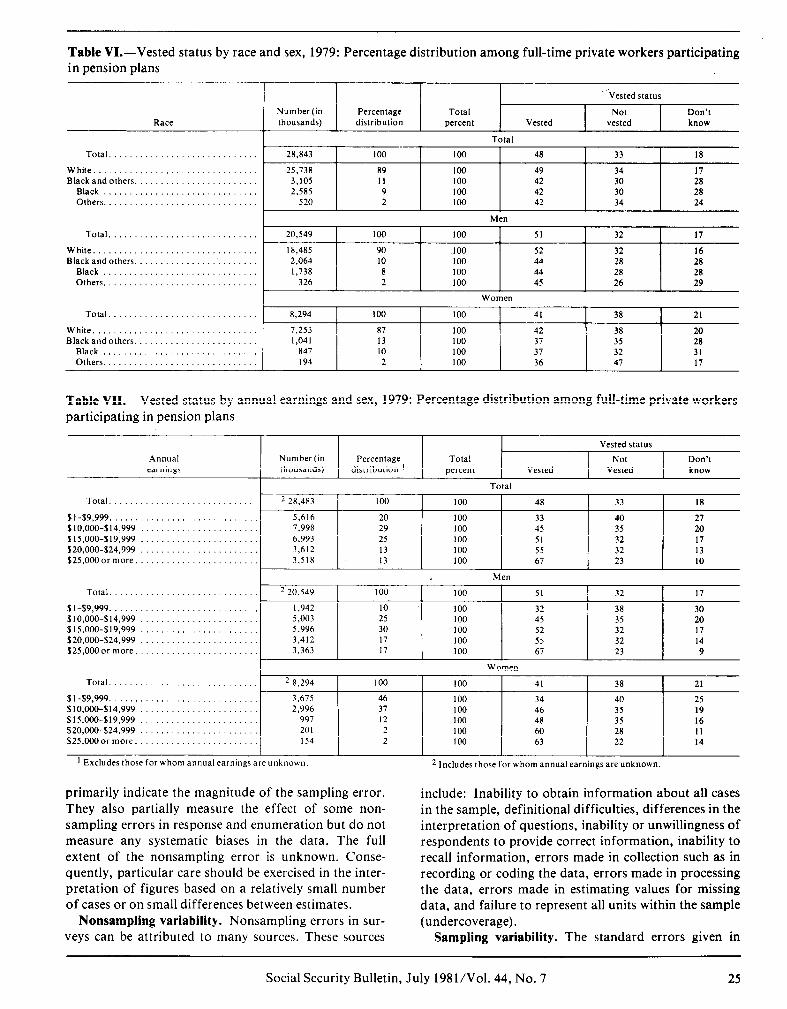
Table VI.-Vested status by race and sex, 1979: Percentage distribution among full-time private workers participating in pension plans
Race Number(in Percentage Total thousands) distribution percent Vested
-‘Vested status
Not vested
Don’t know
Total............................. 28,843
White................................ 25,738 Black and others. 3,105
Black 2,585 Others.............................. 520
Total
- 100 100 48 33 I8
89 100 49 34 17 11 100 42 30 28 9 loo 42 30 28 2 100 42 34 24
Total............................. 20,549
Men
White ................................ Black and others. .......................
Black .............................. Others ..............................
18,485 2,064 1,738
326
I Women
Total............................. I 8,294 1 100 I 100 I 41 I 38 I 21
White ................................ Black and others. .......................
Black.. ............................ Others ..............................
7,253 1,041
847 194
Table VII.-Vested status by annual earnings and sex, 1979: Percentage distribution among full-time private workers participating in pension plans
Annual earnings
Total
Total ............................. 2 28,483 100 100 48 33 18
$I-$9,999 ............................. 5,616 20 100 33 40 27 $10,000-$14,999 ....................... 7,998 29 100 45 35 20 $15,000-$19,999 _,_ $20,000-$24,999 $25.000 or more.
6,993 25 100 51 32 17 3,612 13
I 100
I 55
I 32 13
3.518 13 100 67 23 I 10
I Men
Total.. ,I 2 20,549 1 100 I 100 I 51 I 32 I 17
$1-19.999 ............................. 1,942 10 100 32 38 30 $10,000-$14,999 ....................... 5,003 25 100 45 35 20 $15,000-$19,999 ....................... 5,996 30 100 52 32 17 $20,000-$24,999 ....................... 3,412 17 100 5s 32 14 $25,0000rmore. ....................... 3,363 17 100 67 23 9
.............. .............. 1 Total Total ............................. 2 8,294 2 8,294
$l-59,999. $l-59,999 ............................. 3,675 3,675 SlO,OoC-$14.999 SlO,OoC-$14.999 ....................... .............. 2.996 2.996 $15,000-$19,999 $15,000-$19,999 ....................... .............. 997 997 $20,000-$24,999 $20,000-$24,999 ....................... 201 201 $25,000 or more. $25,000 or more. ....................... 154 154
l Excludes those ’ Excludes those for whom annual earnings are unknown. for whom annual earnings are unknown.
I Women
100 100 100
46 46 100 37 37 100 -----I- 12 12 100
2 2 100 2 2 100
100 41 41 38 38
100 34 34 40 40 100 46 46 35 35 100 48 35 100 60 28 100 63 22
2 Includes those for whom annual earnings are unknown.
I 48 60 I 35 28 I 16 11
2 Includes those for whom annual earnings are unknown.
21 21
25 25 19 19 16 11 14 I 63
I 22
I 14
primarily indicate the magnitude of the sampling error. include: Inability to obtain information about all cases They also partially measure the effect of some non- in the sample, definitional difficulties, differences in the sampling errors in response and enumeration but do not interpretation of questions, inability or unwillingness of measure any systematic biases in the data. The full respondents to provide correct information, inability to extent of the nonsampling error is unknown. Conse- recall information, errors made in collection such as in quently, particular care should be exercised in the inter- recording or coding the data, errors made in processing pretation of figures based on a relatively small number the data, errors made in estimating values for missing of cases or on small differences between estimates. data, and failure to represent all units within the sample
Nonsampling variability. Nonsampling errors in sur- (undercoverage). veys can be attributed to many sources. These sources Sampling variability. The standard errors given in
Social Security Bulletin, July 1981/Vol. 44, No. 7 25

Table VIII.-Vested status by occupation and sex, 1979: Percentage distribution among full-time private workers par- ticipating in pension plans
Occupation
Total ............................
White collar. ......................... Professional, technical. ............... Managerial, administrative. ............ Sales .............................. Clerical. ...........................
Blue collar ........................... Craftsmen ......................... Operatives ......................... Nonfarm laborers. ...................
Service workers .......................
Total ............................
White collar .......................... Professional, technical ................ Managerial, administrative. ............ Sales .............................. Clerical. ...........................
Bluecollar ........................... Craftsmen ......................... Operatives ......................... Nonfarm laborers. ...................
Service workers .......................
Total ............................
White collar. ......................... Professional, technical ................ Managerial, administrative. ............ Sales .............................. Clerical. ...........................
Bluecollar ........................... Craftsmen ......................... Operatives ......................... Nonfarm laborers. ...................
Service workers .......................
1 Farm occupations are included in distribut
I Vested status
Vested Not Don’t
vested know Number (in Percentage thousands) distribution t
Total percent
7 II
48 T-
33 18
51 34 16 52 34 14 59 29 12 42 42 16 46 35 19 47 33 20 52 -31 17 43 34 23 43 33 24 38 35 27
28,843 100
14.251 49 4,343 15 3,533 12 1,375 5 4,999 17
13,319 46 5,588 I9 6,497 23 1,234 4 1,177 4
100
100 100 100 100 100 100 100 100 100 100
20.549 100 I 51 32 I 17
8,655 42 100 55 32 3,232 16 100 55 32 2,910 14 100 61 28 1,100 5 100 45 42 1,413 7 100 51 31
11,249 55 100 49 32 5,366 26 100 53 31 4,768 23 100 46 32 1,114 5 100 43 32
562 3 100 38 35
14 13 II I3 18 19 16 22 25 27
Women
8.294 100 100 41
44 43 53 34 44 35 29 35 43 37
38 21
37 19 5.596 67 13 8 3
43 25
100 1,111
624 275
3,586 2,070
221 1,730
119 615
100 100 100 100 100 100 100 100 100
40 17 35 12 40 26 36 20 40 26 39 32 40 25 38 19 35 28
3 21
2 7
I but are not show”.
Table IX.-Vested status by size of firm and sex, 1979: Percentage distribution among full-time private workers par- ticipating in pension plans
Size of firm Number (in Percentage Total (number of employees) thousands) distribution 1 percent Vested
Vested status
Not vested
Don’t know
Total............................
l-24................................
Total
2 28,843 100 100 48 33 18
2,079 9 100 52 27 21 25-99 ............................... 100-499 ............................. SOOormore.. ........................
10 100 44 36 I9 I4 100 44 37 19 67 100 52 34 14
Me”
Total ............................ 2 20,549 100 100 51 32
l-24 ................................ 1,523 9 100 55 24 25-99 ............................... 1,767 10 100 47 34 100-499.. ........................... 2,169 13 100 49 34 SOOormore .......................... 11,544 68 100 55 32
20 18 17 13
Women
Total ............................ ’ 8,294
1-24 ................................ 556 25-99 ............................... 654 loo-499 ............................. 1,056 SOOormore.. ........................ 4,284
1 Excludes those for whom size of firm is unknown.
100
8 IO 16 65
100 41 38
100 44 35 100 36 42 100 35 42 100 45 38
2 Includes those for whom size of firm is unknown.
21
22 21 23 17
Social Security Bulletin, July 198 1 /Vol. 44, No. 7

Table X.-Vested status by industry and sex, 1979: Percentage distribution among full-time private workers partici- pating in pension plans
lndustry
Total ............................
Manufacturing. ....................... Durable ........................... Nondurable ........................
Trade ............................... Wholesale. ......................... Retail.. ...........................
Service .............................. Nonprofessional. .................... Professional, .......................
Transportation, communications, utilities Construction ......................... Finance, insurance, real estate ............ Mining ..............................
Total ............................
Manufacturing. ....................... Durable ........................... Nondurable ........................
Trade ............................... Wholesale. ......................... Retail, ............................
Service .............................. Nonprofessional ..................... Professional. .......................
Transportation, communications, utilities. .. Construction ......................... Finance, insurance, real estate ............ Mining ..............................
Total ............................
Manufacturing. ....................... Durable ........................... Nondurable ........................
Trade ............................... Wholesale. ......................... Retail.. ...........................
Service. ............................. Nonprofessional ..................... Professional. .......................
Transportation, communications, utilities. .. Construction ......................... Finance, insurance, real estate ............ Mining
I Number (in Percentage Total thousands) distribution 1 percent Vested
Vested status
Not vested
Don’t know
Total
48 33 18
49 32 18 49 33 17 49 30 20 44 38 18 44 39 I7 44 38 18 45 34 21 41 36 23 47 33 21 52 32 I6 52 28 20 47 38 15 50 34 I6
100
100 100 100 100 100 100 100 100 100 100 100 100 100
28,843
13.160 8,510 4,650 4,241 1,676 2,564 3,882
897 2,984 3,079 1,552 2,256
501
100
46 30 16 15 6 9
13 3
10 11 5 8 2
T
t
20.549 32 17 100
49 32 16 15 6 8 9 3 6
I2 7 5 2
100
100 100 100 100 100 100 100 100 100 100 100 loo 100
51
52 31 52 32 52 28 47 36 45 36 48 35 49 32 45 37 52 29 54 31 52 27 50 39 50 34
17 16 20 17 18 17 19 18 19 I5 20 I1 I6
10,019 6,658 3,361 3,030 1,321 1,709 1,947
681 1,266 2,43 I 1,482 1,039
459
Women
100 21 38
37 37 36 45 47 44 36 36 36
41
41 40 42 37 41 34 41 27 43 46 (2) 44 (2)
8,294
3,140 1,851 1,289 1,210
356 855
1,934 216
1,718 648
70 1,217
42
23 23 22 18 11 22 23 37 21
38 22 16 14 4
10 23
2 21
8 1
15
100 100 100 100 100 100 100 100 100 100 100 100 100
’ Agriculture is included in distribution but is not shown 2 Not shown; base is less than 150,000.
all possible samples; (2) approximately 90 percent of the intervals from 1.6 standard errors below the estimate to 1.6 standard errors above the estimate would include the average result of all possible samples; and (3) approximately 95 percent of the intervals from 2 standard errors below the estimate to 2 standard er- rors above the estimate would include the average re- sult of all possible samples.
table XV are primarily measures of sampling variability, that is, of the variation that occurred by chance because a sample rather than the entire population was sur- veyed. The sample estimate and its estimated standard error enable one to construct confidence intervals, ranges that would include the average result of all pos- sible samples with a known probability. For example, if all possible samples were selected, if each of those were surveyed under essentially the same general conditions and using the same sample design, and if an estimate and its estimated standard error were calculated from each sample, then-
(1) approximately 68 percent of the intervals from 1 standard error below the estimate to 1 standard error above the estimate would include the average result of
The average estimate derived from all possible samples is or is not contained in any particular computed in- terval. For a particular sample, however, one can say with a specified confidence that the average estimate de- rived from all possible samples is included in the confi- dence interval.
Social Security Bulletin, July 1981/Vol. 44, No. 7 27

Table XI.-Vested status by union representation and sex, 1979: Percentage distribution among full-time private workers participating in pension plans
Union Number (in Percentage Total representation thousands) distribution 1 percent
Total............................ 2 28,843 100 100
Union............................... 11,800 42 100 Nonunion. 16.580 58 100
Vested status
Not Don’t Vested vested know
Total
48 33 18
49 30 20 48 35 I7
Total............................
Men
2 20,549 100 100 I 51 32 17
Union ............................... Nonunion ............................
9,511 10,759
47 53
100 100
51 29 19 51 34 15
Women
Total ............................
Union ............................... Nonunion. ...........................
2 8,294 100 100 41 38 21
2,288 28 100 41 35 23 5,822 72 100 42 38 20
1 Excludes those for whom union representation is unknown. 2 Includes those for whom union representation is unknown.
Table XII.-Vested status by type of employer plan and sex, 1979: Percentage distribution among full-time private workers participating in pension plans
Type of Number (in Percentage Total employer plan thousands) distribution 1 percent Vested
Vested status
Not vested
Don’t know
Total.
Single employer Multiemployer.
Total. ............... Single employer ............... Multiemployer ...............
Total. ............... Single employer ............... Multiemployer. ...............
’ Excludes those for whom type of employer plan is unknown,
Women
2 8,294 100 100 41 38 21
5,092 81 100 43 40 17 1,225 19 100 47 37 16
Total
2 28,843 100 100 48 33 18
17,335 75 100 50 36 14 5,686 25 100 53 31 I6
Men
2 20,549 100 100 51 32 17
12,243 73 100 53 34 13 4,461 27 100 55 30 I5
2 Includes those for whom type of employer plan is unknown.
Table XIII.-Vested status by contributory status of plan by sex, 1979: Percentage distribution among full-time pri- vate workers participating in pension plans
Vested status
Contributory Number (in Percentage Total Not Don’t status of plan thousands) distribution t percent Vested vested know
- Total
Total............................ 2 28,843 100 100 48 33 18
Contributory . . 10,010 35 100 52 29 I9 Noncontributory 18,643 65 100 46 36 18
I Men
Total.
Contributory Noncontributory .
2 20,549 100 100 51 32 17
7,414 36 100 54 27 19 13,013 64 100 50 34 16
1 I I I I
Total............................
Contributory . Noncontributory .
Women
2 8,294 100 100 41 38 21
2,596 32 100 46 33 20 5,630 68 100 39 40 21
1 Excludes those for whom contributory status is unknown 2 Includes those for whom contributory status in unknown.
Social Security Bulletin, July 1981/Vol. 44, No. 7

Table XIV.-Years of participation by sex and selected characteristics, 1979: Full-time private workers participating in pension plans
Characteristic 1 .otal
Total ..............
Age: Under30 ............. 30-44 ................ 45-54 ................ 55 and older. ..........
Earnings: $l-$9,999 ............ $10,000-$14.999 ....... $15,000-$19,999 ....... $20,000-$24,999 ....... $25,000 or more.
Race: White. ............... Black and others
Black .............. Others .............
Occupation: White collar. ..........
Professional, technical. Managerial, administra-
tive .............. Sales. .............. Clerical. ............
Blue collar. ........... Craftsmen .......... Operatives .......... Nonfarm laborers. ....
Service workers ........
T Years of participation
Median
6.7 7.7 -
4.9 36 40 -
25
I.7 7.0
13.3 14.7
I.8 I.2 2 2 2 7.8 4.9 33 37 21
15.7 8.9 63 70 44 16.4 12.7 67 68 64
3.3 2.9 3.5 I9 21 19 5.8 6.0 5.8 30 30 28 8.1 8.3 7.3 41 42 34 9.2 9.2 8.0 47 47 43
II.4 II.6 8.8 56 57 42
7.0 8.0 4.7 37 41 26 5.6 5.9 5.1 27 31 19 6.0 6.2 5.1 29 32 23 4.6 4.6 4.6 I9 26 8
6.4 7.3 4.9 33 38 25 5.7 6.7 4.4 32 38 I7
7.9 8.8 5.0 40 43 29 4.4 4.6 3.5 23 22 26 5.9 8.2 5.2 32 43 26 7.6 8.3 4.7 39 42 28 8.9 9.1 4.9 45 46 27 6.8 7.5 4.6 36 38 28 6.4 6.4 4.9 34 34 25 5.2 5.8 4.8 26 28 23
- vlen -
I Not shown; base is less than 150,000.
.
Komet
ercem Total
th 1 - vlen
-
lr Years of participation
II I Median TF ‘went with 1Oor more
Characteristic Total
Industry: Manufacturing. .......... 7.7
Durable .............. 7.8 Nondurable ........... 7.7
Trade. ................. 5.0 Wholesale. ............ 4.8 Retail. ............... 5.2
Service. ................ 4.6 Nonprofessional. ....... 4.3 Professional ........... 4.5
Transportation, communica- tions, utlhtles .......... 10.0
Construction ............ 7.4 Finance, insurance, real
estate ............ ... 5.8 Mining. ................ 6.2
Union representation: Union ................. 8.9 Nonunion .............. 5.4
Sireof firm(numberof employee?):
l-24 ................... 4.9 25-99 .................. 5.0 100-499 ................ 5.2 500ormore ............. 8.0
Contributory status of plan: Contributory ............ 7.0 Noncontributory ......... 6.8
Type of employer plan: Single employer. ......... 7.2 Multiemployer. .......... 7.4
iz - Jomel
8.6 5.4 8.6 5.9 8.7 5.0 5.8 4.0 5.6 3.7 5.7 4.3 5.0 4.2 4.5 3.7 5.0 4.3
10.9 8.3 8.0 (1)
6.9 4.8 6.4 (1)
9.3 6.7 6.4 4.5
5.6 3.4 5.9 3.9 6.4 3.8 8.9 6.2
7.7 4.7 7.8 4.9
8.0 8.4
-
5.2 4.6
rota1 Metl - Yemen .
40 43 30 41 44 29 40 43 30 24 27 18 25 28 I5 24 27 20 23 29 I7 28 29 22 22 29 I7
50 52 39 40
43 (0
30 35 25 37 37 0)
45 47 36 29 33 21
23 27 12 28 31 20 28 32 I9 40 45 31
35 39 26 36 40 25
36 41 26 38 42 24
Social Security Bulletin, July 1981 /Vol. 44, No. 7 29