vesuvius, italy: a retrospective forward application to...
TRANSCRIPT
Bayesian Event Tree for Eruption Forecasting (BET_EF) at1
Vesuvius, Italy: a retrospective forward application to the 16312
eruption.3
4
Laura Sandri1, Emanuela Guidoboni1, Warner Marzocchi1, Jacopo Selva15
6
1- Istituto Nazionale di Geofisica e Vulcanologia, Sezione di Bologna, Italy7
8
9
Contacting author:10
Sandri Laura11
Istituto Nazionale di Geofisica e Vulcanologia, Sezione di Bologna12
Via Donato Creti, 1213
40128 Bologna14
Italy15
Tel: +39051415142216
Fax: +39051415149817
e-mail: [email protected]
19
20
21
Accepted for publication on Bull. Volcanol., Oct 8, 200822
2
Abstract1
Reliable forecasting of the next eruption at Vesuvius is the main scientific2
ingredient to define effective strategies to reduce volcanic risk in one of the3
most dangerous volcanic areas around the world. In this paper, we apply a4
recently developed probabilistic code for eruption forecasting to new and5
independent historical data related to the pre-eruptive phase of the 16316
eruption. The results obtained point out three main issues: 1) the7
importance of “cold” historical data (according to Guidoboni 2008) related8
to pre-eruptive phases for evaluating forecasting tools and possibly9
refining them; 2) the BET_EF code implemented for Vesuvius would have10
forecast the 1631 eruption satisfactorily, marking different stages of the11
pre-eruptive phase; 3) the code shows that pre-eruptive signals that12
significantly increase the probability of eruption were likely detected more13
than two months before the event.14
15
Keywords: cold historical data, Vesuvius, 1631 eruption, BET_EF code,16
eruption forecasting17
18
19
20
21
22
23
24
3
1. INTRODUCTION1
Vesuvius is one of the highest risk volcanoes. Besides being located in a2
densely populated area, with circa one million of people living on its flanks3
and in the surrounding area, Vesuvius experienced several large explosive4
eruptions in the past that re-opened the conduit, ending so-called “close5
conduit” phases (e.g., Marzocchi and Zaccarelli 2006) such as the current6
phase of the volcano. Over the last decades, this large threat for society7
pushed scientists and the Italian Civil Protection to devote a significant8
effort in order to mitigate volcanic risk in this area. One of the most9
relevant strategies adopted is the development of an Emergency Plan that10
is periodically revised and that includes, prior to an eruption, a massive11
evacuation of the area that is likely to be affected by pyroclastic flows,12
lahars, and heavy ash falls (the so-called Red Zone). Thus, a key scientific13
ingredient for an evacuation to be effective and successful is a reliable14
forecast of the time evolution of the reactivation of Vesuvius.15
Tracking quantitatively the evolution of the pre-eruptive phase of long-time16
dormant explosive volcanoes is the main purpose of a recent quantitative17
tool, named BET_EF (Bayesian Event Tree for Eruption Forecasting),18
developed by Marzocchi et al. (2004; 2008). The method makes19
probabilistic eruption forecasting, accounting for volcanological models,20
prior beliefs, past data, and monitoring measurements. Besides a general21
description of the probabilistic model that is potentially applicable to any22
explosive volcano, the papers also contain a set of monitoring parameters23
4
and relative thresholds, in order to apply the technique to pre-eruptive1
phases of Vesuvius.2
Although the method is scientific, since it provides probabilities that can be3
used to test the model with independent data, in practice its verification is4
hampered by the lack of quantitative pre-eruptive data, for Vesuvius as5
well as for almost all volcanoes of this type. In this respect, we argue that6
historical documents can partially fill this void, providing useful information7
about pre-eruptive phenomena. A remarkable example is given by8
historical reports of the pre-eruptive phase of the 1631 eruption9
(Guidoboni 2008). These new data give us an unusual opportunity to10
perform a retrospective forward test of the BET_EF model implemented for11
Vesuvius. The “forward” nature of the test is guaranteed by the fact that12
we use the same parameters published in previous papers, keeping13
“frozen” all the quantitative rules/parameters/thresholds. The test consists14
of three basic steps: at first,15
1. We translate, where possible, the historical information into16
reasonable values of some of the monitoring data required by the17
BET_EF model for eruption forecasting. In this step we keep18
separate, as clearly as possible, the “historical data” (in their so-19
called "cold" data form, i.e., not yet interpreted, see Guidoboni20
2008) from our interpretation.21
2. We run the BET_EF code to estimate the time evolution of the22
probability of eruption.23
5
3. We perform stability checks of the results, acknowledging that our1
quantitative interpretation of historical reports is subjective and2
cannot be univocal. In practice, we evaluate the stability of the3
results when different interpretations of historical reports are4
applied.5
6
The final goal of the paper is two-fold: beside testing the ability of BET_EF7
to forecast a large explosive eruption in a long-time quiescent volcano, we8
also highlight the importance of data coming from historical documents,9
as they can partly replace the lack of quantitative pre-eruptive data for10
large explosive eruptions.11
12
2. THE 1631 VESUVIUS ERUPTION, AND A DETAILED HISTORICAL13
CHRONOLOGY OF THE PRE-ERUPTIVE PHASE14
During its eruptive history, Vesuvius has produced several large explosive15
eruptions that devastated the surrounding area. It last erupted in 1944 with16
a VEI = 3 weakly explosive event. The most important previous eruptions17
were VEI = 4 events in 472 A.D. and 1631 (see, e.g., Scandone et al.18
1993), and the well-known Pompeii eruption in 79 AD. Presumably, all of19
these large explosive eruptions brought to an end a closed conduit phase,20
intended, as in Marzocchi and Zaccarelli (2006), as a dormancy of the21
volcano with no activity, lasting at least few decades (e.g., Guidoboni and22
Boschi 2006) or centuries (e.g., Cioni et al. 2003) and allowing the closure23
6
of the volcanic conduit due to viscous relaxation and cooling of rocks1
within it (Quareni and Mulargia 1993).2
After the reactivation of Vesuvius in 1631, volcanic activity switched to3
persistent activity typical of open conduit behavior, showing frequent4
eruptions of smaller size and intensity for decades to centuries. Persistent5
activity prevailed through the early 20th century until 1944. Since then,6
however, an unusually long repose (60 years and continuing) suggests7
this volcano may now be in a closed conduit condition (e.g., Marzocchi8
and Zaccarelli 2006).9
The 1631 event had a particular importance because it was considered, in10
a previous version of the Emergency Plan (Presidenza del Consiglio dei11
Ministri 1995), as a reference scenario for the definition of the “Maximum12
Expected Event” (e.g., Barberi et al. 1995; Barberi et al. 1990; Esposti13
Ongaro et al. 2002; Cioni et al. 2003). The revised Emergency Plan has14
modified this view, recognizing that an eruption similar to the one occurred15
in 1631 is not actually the maximum expected event, and not even the16
most likely (Marzocchi et al. 2004), but it could represent a reasonable17
reference scenario that balances cost/benefit for practical actions.18
Nevertheless, the 1631 event is also remarkable because, being the most19
recent explosive eruption, it has also some noticeable historical reports20
about the pre-eruptive phase. While Rosi et al. (1993) let us learn what21
happened during the eruptive phases of 1631 event, recent works by22
Guidoboni (2004; 2008) made available a large amount of new information23
on what happened weeks and months before the eruption (see comments24
in Bertagnini et al. 2006).25
26
2.1. The method and the materials studied: the role of “cold”27
historical data28
One of the main problems in the use of historical data to learn about the29
phenomena of the past, like the activity of volcanoes, is the continuous30
7
and uncontrollable interpretative intervention effected by the1
volcanologists directly upon the sources. The descriptions of the Vesuvius2
activity (and of other volcanoes of the Italian area) in the treatises written3
by contemporaries are especially rich in detail, inserted within a lengthy4
chronological development. Most of the phenomena described in those5
treatises can thus be pinpointed in time and in geographical space and be6
elaborated as a fully-fledged sequence of “cold” data, that is, defined7
before the scientific interpretation. This way of elaborating the historical8
data is a novelty within the volcanological field, because it allows the9
relationship between source and interpretation to be made transparent, a10
relationship that hitherto in the literature had always been presented as a11
single phase and a single process. The separation of the two levels, i.e.12
historical and volcanological, which instead has been effected here,13
obviously does not come without its surprises as well as some problems,14
because it lays bare some unresolved aspects – and also at times ones15
that are hard to resolve – possible contradictions between the examined16
texts, or neglected elements that are not secondary. As compared with17
the knowledge already gained in the literature, it appears to be a more18
realistic set of data, but also in some ways more problematic, nonetheless19
meaningful, for anyone who has to interpret such data within the20
volcanological sphere.21
In our opinion, no other paths can be followed for the critical use of a22
wealth of such particular historical data. The results presented here23
8
constitute a new way of using historical data in volcanology, which have1
been applied for the first time within the Exploris project (Guidoboni 2008).2
3
2.2.The description of the 1631 eruption in five contemporaries4
treatises5
On 16th December 1631 a violent eruption of Vesuvius started after a long6
period of silence that had led people to forget the danger of this volcano.7
In order of importance, that of 1631 is the third eruption occurring in the8
historical era, after those of 79 AD and 472 AD. This eruption in its most9
acute phase lasted several days, causing over a thousand deaths and10
substantial economic damage. The phenomenon ended completely only a11
few years later, but already in January 1632 a number of Neapolitan12
intellectuals were engaged in writing reports and treatises to recount,13
interpret, and explain that extraordinary reawakening of Vesuvius.14
Between 1632 and 1634 numerous pamphlets, notices, letters and reports,15
along with some treatises written in Italian, Latin and Spanish, were16
published in Naples. These writings represent a heterogeneous set of17
materials, as a whole invaluable for becoming acquainted with that18
scenario. The four treatises (see also Appendix A) presented here have19
been analysed in different steps: the texts of Carafa (1632), Mascolo20
(1632) and Varrone (1634), in Latin, have been translated and analysed21
within the scope of the EXPLORIS project (Guidoboni 2004); the text of22
Braccini (1634) is in Italian, analysed within the Vulcan-3 project - RU 1-23
Guidoboni (2005-2007) agreement with the Dipartimento della Protezione24
9
Civile and INGV. The text by Giovanni Domenico de Arminio (1632), which1
is a treatise in Latin up to now unknown to volcanological literature, has2
been translated and analysed for this work.3
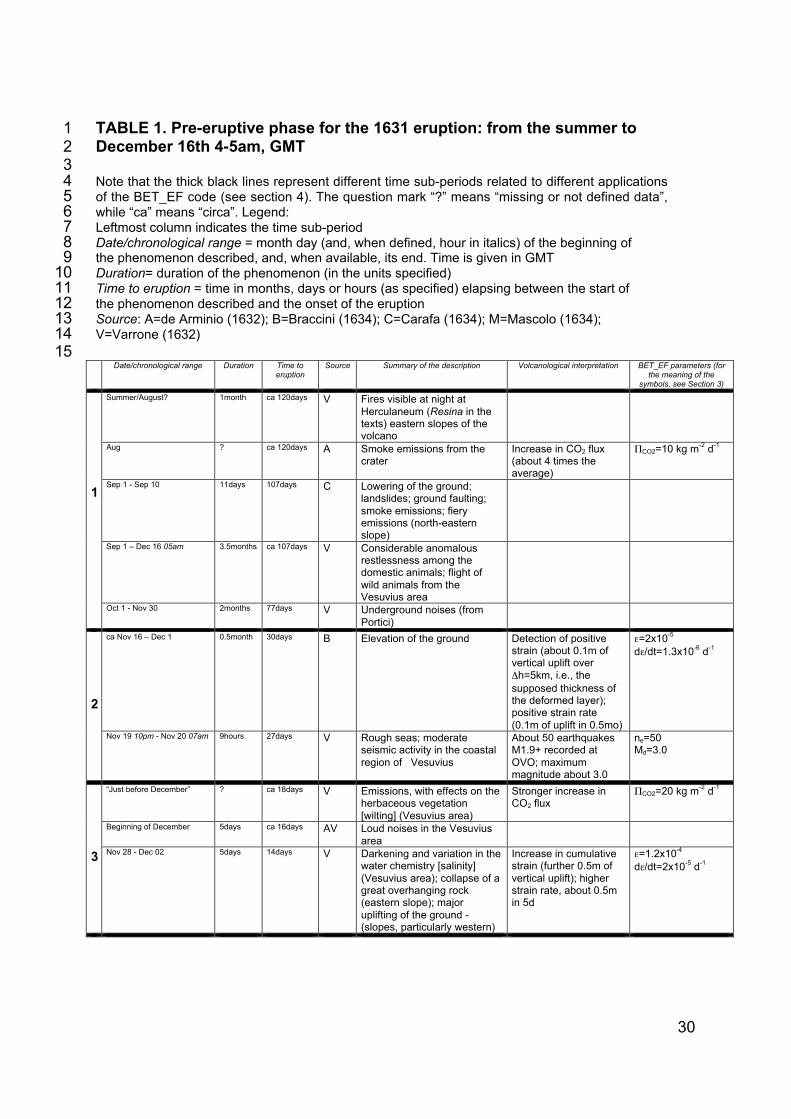
The list of chronologically ordered phenomena reported in the five treatises4
is given in table 1 (columns 1 to 5).5
One of the most interesting aspects and so far scarcely used of such texts6
is their reconstruction of the chronology of the described phenomena. The7
treatises analysed are situated within production of the witnesses to the8
1631 eruption. The authors, intellectuals and ecclesiastics of the day, were9
committed to analysing and explaining everything that they had previously10
observed before, during and after the eruption: obviously this was done11
within the cognitive frames of their times. The liveliness and immediacy of12
their descriptions accompany a literary scholarship, which was typical of13
the ecclesiastics and the men of law of that day and age.14
The description of the eruption is preceded, in all five treatises, by scores15
of pages dedicated to philological, etymological and historical16
disquisitions, which are an example of how the culture of the day dealt with17
the great natural events.18
The description of the events starts from the summer of 1631, that is,19
several months before the eruption of Vesuvius. Hence, the treatises give20
us the chance to observe, through the eyes of an intellectual of the day, a21
cinematic narrative of the events running up to the great eruption on 16th22
December 1631.23
24
10
3. BET_EF APPLICATION TO THE 1631 ERUPTION1
3.1 BET_EF rules for Vesuvius2
The BET_EF software package implements the Bayesian Event Tree for3
Eruption Forecasting model published by Marzocchi et al. (2008). The4
model is based on an event tree in which individual branches are5
alternative steps from a general prior event evolving into increasingly6
specific subsequent events. By merging volcanological information, past7
data and monitoring measurements through a Bayesian inferential8
method, BET_EF computes the long- and short-term probability at each9
node of the event tree; particularly interesting from a volcanological point10
of view are the probabilities of volcanic unrest, magmatic unrest, eruption,11
vent location and eruption size. BET_EF also provides estimates of12
aleatory and epistemic uncertainties on such probabilities.13
The upload of the available information regarding Vesuvius represents the14
main step in order to run BET_EF for this application. Here, we keep the15
same rules used by Marzocchi et al. (2008) during MESIMEX (Major16
Emergency SIMulation EXercise) experiment, in which the re-awakening17
of Vesuvius was simulated in order to test Civil Protection and Scientific18
Institution preparedness in case of such an event. On that occasion,19
BET_EF was run real-time, fed with the simulated monitoring data20
provided by a scientific pool of experts (Marzocchi et al. 2008).21
In Appendix B, we describe these rules in detail again.22
23
3.2 Strategy adopted for the volcanological interpretation of24
historical information25
In order to verify the eruption forecasting ability of the BET_EF code on26
independent data, we apply it to the 1631 pre-eruptive phase, according to27
the historical accounts provided by Guidoboni (2004) and Guidoboni28
(2008).29
11
We interpret the historical information in terms of some of the parameters1
routinely monitored at Vesuvius that are a direct input to the BET_EF2
code.3
We stress that, in the process of translation of historical information into4
volcanological input to BET_EF, we have to interpret “anomalous” events5
reported in the chronicles with respect to a background activity of the6
volcano. In doing so, we necessarily refer to our volcanological experience7
gained from Vesuvius and to its present background state. Thus, the8
values suggested in the last column of Table 1 represent our subjective9
perception of the anomaly reported in the historical accounts with respect10
to the present-day background values. Actually, we do not know if the11
present- day state of the volcano is similar to the one before 163112
eruption. The results we obtain might be indeed biased by this13
assumption.14
However, since the BET_EF code deals with monitoring measurements in15
a fuzzy approach (see Appendix B and Marzocchi et al. 2008), the results16
yielded by BET_EF do not change if we input a “wrong” value for a17
monitoring measure, provided that our value maintains a “degree of18
anomaly” similar to the one of the reality. For example, if the real occurred19
monthly largest magnitude is 2.1, but we give an interpretation of 3.0, the20
results will be exactly the same, since (see Table B2 in Appendix B) these21
values are both below the lowest threshold, thus their degree of anomaly22
is the same (in particular, they are indicative of NO anomaly). Similar23
considerations can be applied for any monitored variable that we consider.24
12
Since historical chronicles refer to ground uplift and not to the1
corresponding strain, for the deformation parameters (cumulative strain2
ε and strain rate dε/dt) we interpret the historical reports in terms of3
observed ground uplift (u ), and translate the uplift in terms of4
ε (i.e., ε=U/Δh, where U is the cumulative total uplift since the beginning of5
the unrest, and Δh is the supposed thickness of the deformed layer) and6
dε/dt (i.e., dε/dt =u/(Δh Δt), where Δt is the time interval during which the7
uplift is observed, derived directly from the chronicles). Bertagnini et al.8
(2006) set the depth of the source of deformation (by a simple Mogi9
model) to 4Km, implying a deformed layer 4Km thick. Here we assume10
Δh=5Km, a bit more conservative choice (because, given a ground uplift, it11
implies lower cumulative strain and lower strain rate).12
On purpose, we decide to translate into numerical values only the13
historical information undoubtedly linked to a specific monitoring14
parameter. For example, anomalous wild animal behavior (like fleeing from15
the Vesuvian area, as reported) might have been related to seismic16
activity, to rockfalls in the crater area, to anomalous gas emission, etc.; in17
few words, there is no specific and univocal phenomenon that caused the18
flee of wild animals from their usual territory. Therefore, we do not19
consider this information in BET_EF. Together with the fact that the20
historical information collected likely represents a subset of all the21
phenomena occurred in 1631 pre-eruptive phase, this choice implies that22
the results we will obtain are a lower limit on the eruption forecasting ability23
of BET_EF on independent data.24
13
1
3.3 Volcanological interpretation of historical information2
In Table 1 we provide our interpretation of the historical information in3
terms of some of the parameters routinely monitored at Vesuvius that are4
a direct input to the BET_EF code. In particular, in the two right-most5
columns of Table 1, we show our “verbal” interpretation of the information6
given on the rest of the table row (second last column), and its translation7
into the corresponding specific parameters and values of the monitoring8
data required as BET_EF input (last column).9
In the following, we will give detailed explanation for the interpretations10
adopted, in order of appearance in time (see also Table 1). Since11
Bertagnini et al. (2006) and Rosi et al. (1993) already interpreted some of12
the historical chronicles used in the present study, we will explicitly13
compare our interpretation to theirs.14
- “Smoke emissions” reported by C (see Table 1) on the beginning of15
September. We interpret this as a moderate increase (4 times the present16
average flux) in CO2 flux. In doing so, we postulate that fumaroles17
composition remains unchanged (similar to the present-day one), but the18
flux becomes larger, and fumaroles become visible.19
- “Elevation of the ground” reported by B between 16th November and 1st20
December. We interpret this as naked-eye detectable vertical ground uplift,21
i.e., around 10 cm, occurred during the period of observation (approx22
Δt=two weeks). Since BET_EF requires strain and strain rate, we transform23
14
this into ε=2x10⁻⁵ and dε/dt=1.3x10-6 d-1 as illustrated in the previous1
section.2
- “Moderate seismic activity in the coastal region of Vesuvius” reported by V3
between 19th and 20th November. Even if Bertagnini et al. (2006) suggest4
that this piece of Varrone’s chronicle is a “convoluted sentence” and that its5
interpretation might be doubtful, this is not our opinion, because the6
Varrone’s chronicle is not limited to the sentence reported by Bertagnini et7
al (2006). Indeed, the whole paragraph is undoubtably related to seismic8
activity felt by people on the coastal region of Vesuvius, thus we interpret9
this as an increase in the rate of earthquakes. At node 1, one of BET_EF’s10
seismic input is the monthly number of earthquakes with magnitude larger11
or equal to 1.9 recorded at OVO station, located on the volcano. We12
imagine that, with the term “moderate seismicity”, people might have felt a13
few earthquakes (let’s say 5) of magnitude around 3; considering a power14
law between the energy of earthquakes and their frequency, i.e., the15
Gutenberg-Richter (GR) relationship, we have Log(N1)=a-bM1, where N1=516
(earthquakes with magnitude larger or equal to 3), M1=3 (magnitude), and17
b=1. In order to compute N2, i.e., the number of earthquakes with18
magnitude larger or equal to 1.9, we consider again the GR law, i.e., Log19
N2=a-bM2, where M2=1.9. By differentiating these two expressions of the20
GR law, we obtain Log(N2/N1)=b(M1-M2) from which N2=N1x10^[b(M1-21
M2)]≈50. (Note that for this reason, from now on, every time the chronicles22
report “moderate seismic activity”, we add other 50 earthquakes to the23
monthly count.) For the maximum magnitude of this earthquake burst, again24
15
on a monthly basis at OVO station, we set 3.0, below the lower threshold of1
anomaly. We keep it low because seismicity is felt in Vesuvian area only.2
- “Emissions with effects on the herbaceous vegetation (wilting)” reported by3
V “just before December”. Similarly to Bertagnini et al. (2006), and to what4
observed during the last unrest episode at Long Valley Caldera (see e.g.5
Hill 1996), we interpret this as a further increase in CO2 flux, up to 206
kg/m2d-1.7
- “Major uplifting of the ground” occurring in 5 days and reported by V in the8
beginning of December. We interpret this as a ground uplift significantly9
larger than the one reported previously, thus we set a further uplift of 0.5 m10
in a time window Δ t=5 days, and translate this into ε=1.2x10⁻⁴ and11
dε/dt=2x10-5 d-1. Due to cumulative strain, which becomes now larger than12
the upper anomaly threshold, the eruption probability takes a large jump.13
- “Moderate seismic activity in the Vesuvius area” reported by V between 7th14
and 8th December. As mentioned above, we keep the same maximum15
magnitude but add other 50 earthquakes to the monthly count.16
- “Small uplifting of the ground” reported by V between 9th and 15th17
December. We interpret this a further uplift of 0.1 m (yielding a total18
cumulated strain ε=1.4x10⁻⁴), occurring in a time window Δt=7 days, thus19
lowering the strain rate to dε/dt=2.9x10-6 d-1.20
- “Emission of hot vapours (Vesuvian area)” reported by V in the same21
period. Similarly to Bertagnini et al. (2006), we interpret it as an increase of22
temperature of the fumaroles (T=110C, representing 15% of the present23
usual value).24
16
- “Moderate seismic activity (Vesuvian area)” reported by B on 10th1
December. As above, we keep the same maximum magnitude, but we add2
other 50 earthquakes to the monthly count.3
- “Repeated seismic activity felt at Naples and in the Vesuvius area, for a4
range of about 7.5Km” reported by C, V and M about 8 hours before the5
onset of the eruption. We interpret this as a major jump in the monthly count6
of earthquakes (further 150 events), and, more important, an acceleration of7
the seismic energy released (d2E/dt2=1), acknowledged also by Bertagnini8
et al. (2006); we also set a larger maximum magnitude (up to 4.0) motivated9
by the larger area in which earthquakes are felt.10
- “Seismic activity, opening of faults” reported by V about 1 hour before11
eruption onset. We interpret this as a further jump in the monthly count of12
earthquakes (further 200 events), and persisting acceleration of the seismic13
energy released (d2E/dt2=1). Furthermore, we also interpret the opening of14
faults as strain acceleration (d2ε/dt2=1). This is a very important parameter15
because, having a double weight, it implies a large jump in eruption16
probability.17
- “Opening of the mount in the Atria” reported by B about 1 hour before18
eruption onset. We interpret this as a major ground deformation (which19
possibly could be the same fact reported by V and just discussed above), in20
which cumulative strain exceeds rock strength; we set a further ground21
displacement of 1 m in a very short time window (Δ t=6 hours), giving22
ε=3.4x10⁻⁴ and dε/dt=8x10-4 d-123
17
- “Intense smoke emission” reported by V about 1 hour before eruption onset.1
We interpret this as a further strong increase in CO2 flux (ΠCO2=100 m-2 d-1).2
- “Rock expulsion (from central crater)” reported by V about 1 hour before3
eruption onset. We interpret this as occurrence of phreatic explosions4
(PE=1). This parameter also concurs in causing a large jump in eruption5
probability.6
7
3.4 BET_EF run (the “reference case”)8
At first, we divide the period of time considered into six different sub-9
periods, corresponding to (interpreted) significant changes in the10
monitoring parameters. For each sub-period, we run a BET_EF simulation11
in order to compute the various probability distributions of interest (valid in12
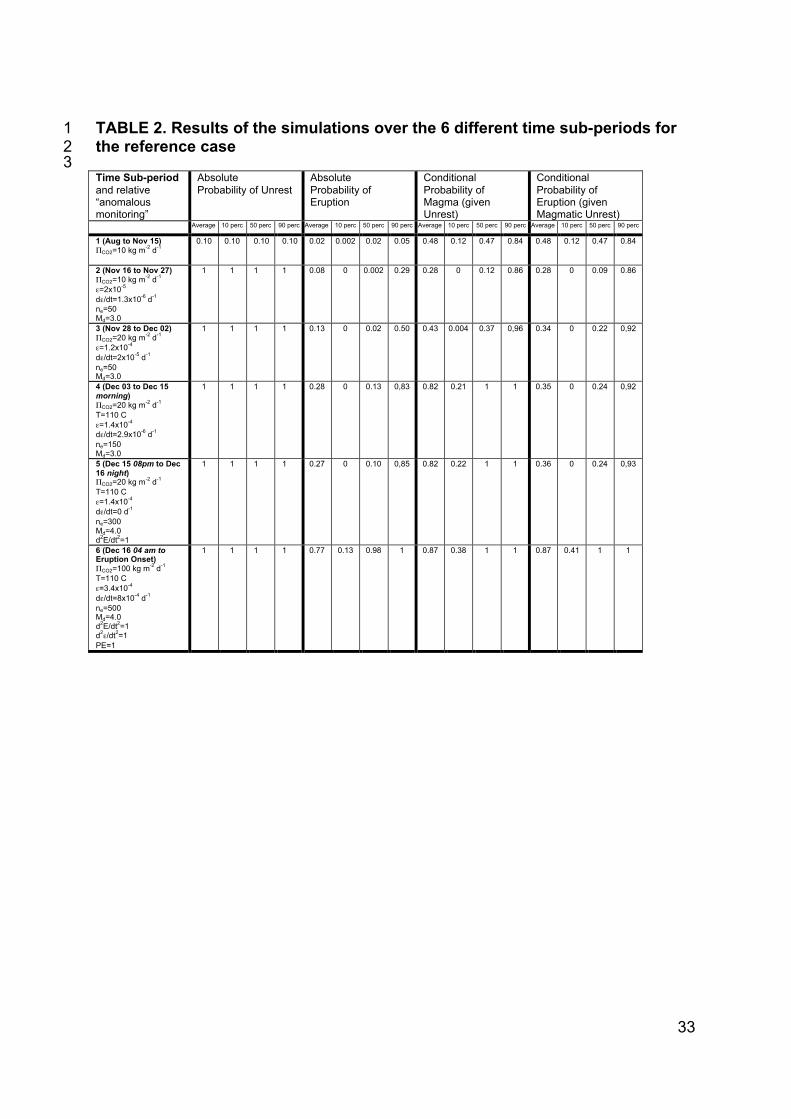
the sub-period of the simulation). The results are displayed in Table 2. For13
the sake of conciseness, for each simulation we show the average14
absolute probability of unrest and of eruption, the relative 10-, 50- and 90-15
th percentiles of their distributions, and the same quantities for the16
conditional probabilities of magmatic unrest given unrest and of eruption17
given magmatic unrest. We define this set of simulations the “reference18
case”.19
The most striking features of BET_EF results for the reference case are:20
immediate jump in the probability of unrest already from sub-period 121
(the long-term average for Vesuvius is in the order of 10-3 (see Marzocchi22
et al. 2008) while here in sub-period 1 the average jumps to about 10%),23
i.e., months before the eruption; however, the conditional probability of24
18
magma given unrest and of eruption given magmatic unrest are still1
around 50% because unrest is not yet completely clear;2
absolute probability of eruption has a constantly increasing trend; in3
particular this probability is low (around 10%) with a large uncertainty in4
sub-period 1, while it becomes quite high (more than 30%) about 7-105
days before the eruption (i.e., from sub-period 4); note that these6
probability values could justify the call for an evacuation on the basis of a7
rationale cost/benefit analysis (Marzocchi and Woo 2007);8
aleatory uncertainty on the probability of eruption is drastically reduced9
only few hours before the eruption (sub-period 6). This is a quite10
common feeling among present-day volcanologists who have dealt with11
large explosive eruptions (for example, the eruption of Mt Pinatubo in12
1991, see e.g. Cornelius and Voight 1996).13
14
3.5 Control experiments15
Since the interpretation of historical information is not univocal, we run16
some control experiments. The main idea is to assume that the monitoring17
parameters identified in Table 1 for each sub-period from the historical18
accounts are exact, but their specific values might change inside19
reasonable ranges, because our interpretation is intrinsically subjective. To20
account for this, we random vary the values of the monitoring parameters21
inside these ranges for 1000 times, by random sampling (1000 times) from22
uniform distributions. Then, we run 1000 control simulations for each sub-23
period. In doing so, we obviously must respect the temporal trend of the24
19
parameters through the pre-eruptive phase (for example, it is clear from1
the historical accounts that the monthly number of seismic events had2
been continuously increasing throughout the whole period). Furthermore,3
we do not vary the values of the yes/no parameters, i.e., the parameters4
related to the presence of phreatic explosions and to accelerations in5
seismic energy release and deformation, since they appear to be certain6
from the historical chronicles.7
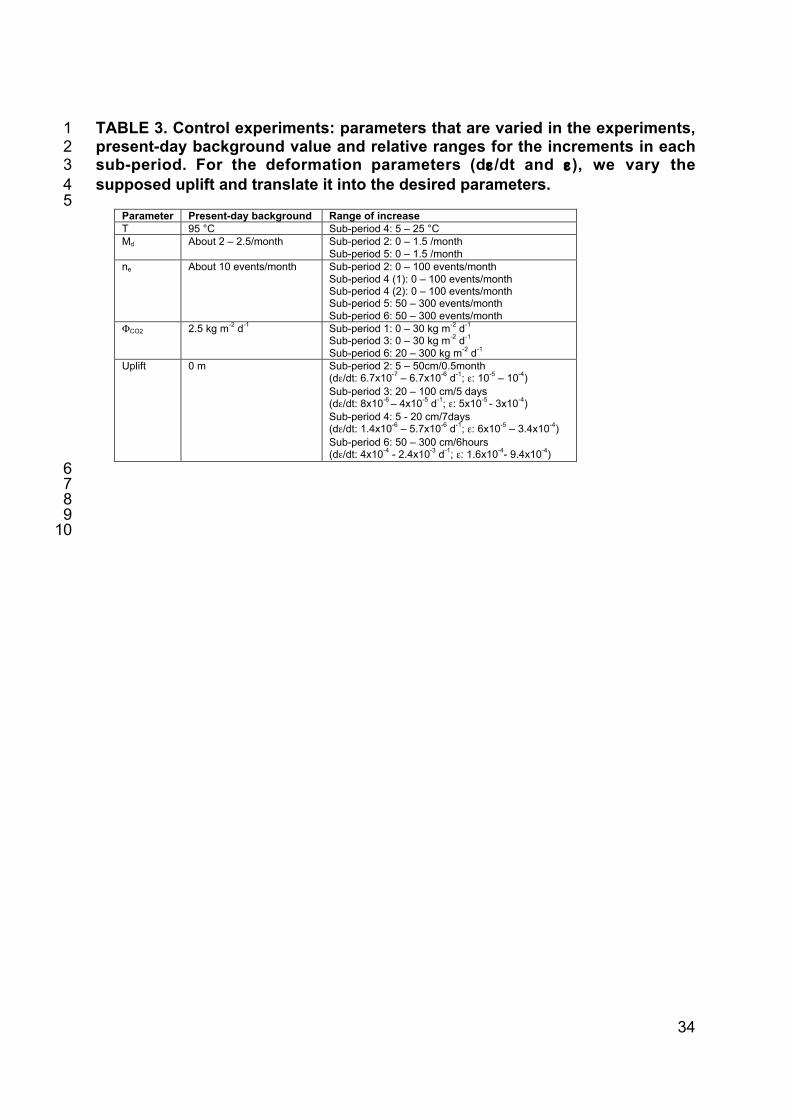
The monitoring parameters whose values are varied in the control8
experiments are ne, Md, ΦCO2, dε/dt, T and ε. For all of them, we start from9
the present-day background value from actual monitoring of Vesuvius10
(listed in Table 3), and then we set specific ranges in which the increase in11
their values can be uniformly random sampled, according to what reported12
in Table 1 from the historical chronicles. Except for T, whose value13
changes only once during the pre-eruptive crises, we define a range for14
the increase in the parameter for each time it is reported to have changed.15
In particular (see also Table 3):16
- T varies only in sub-period 4; we identify a reasonable increase in T in17
the order of 5 to 25 degrees Celsius with respect to the present18
temperature of the fumaroles, corresponding to a 5 to 30% increase.19
- Md varies twice, i.e. once in sub-periods 2 and once in 5. We identify a20
reasonable increase in Md in sub-period 2 in the order of 0 to 1.5 units of21
magnitudes with respect to the present monthly maximum magnitude of22
earthquakes. For sub-period 5, since chronicles report “seismic activity felt23
20
in Naples”, we define a further increase in the range of 0 to 1.5 units of1
magnitude.2
- ne varies in sub-periods 2 (once), 4 (twice), 5 (once) and 6 (once). We3
identify a reasonable increase in ne in sub-period 2 in the order of 0 to 1004
events, corresponding to a 0 to 10 times increase of the present rate.5
Equal ranges are assumed for the two further increases in sub-period 4.6
For sub-periods 5 and 6 we assume a more important increase (from 50 to7
300 events per month more) due to the specification of “repeated seismic8
activity” in the accounts.9
- ΦCO2 varies (once) in sub-periods 1, 3 and 6. For sub-periods 1 we define10
a reasonable range of increase between 0 and 30 kg m-2 d-1, and an equal11
range for the further increase in sub-period 3 is assumed. For the last sub-12
period we identify a larger increase (20 to 300 kg m-2 d-1, representing13
about 10 and 100 times the present background emission rate) due to the14
specification of “strong gas emission” in the historical report.15
- For the deformation parameters (ε and dε/dt), we define ranges for the16
increase in the observed ground uplift, and translate the uplift in terms of ε17
and dε/dt as in section 4.1. In this view, ground uplift varies (once) in sub-18
periods 2, 3, 4 and 6. In sub-period 2, the account simply reports19
“elevation of the ground” in 15 days. We assume that this might20
correspond to an uplift of 5 cm (about the minimum observable without21
instruments) to 50 cm. In terms of dε/dt this range corresponds to 6.7x10-722
d-1 to 6.7x10⁻⁶ d-1, while for ε this corresponds to 10-5 to 10-4. In sub-period23
3, we define a larger further uplift (“major ground uplifting” in 5 days)24
21
between 20 cm and 1 m. In terms of dε/dt this range corresponds to 8x10-61
d-1 to 4x10⁻⁵ d-1, while for ε this corresponds to a further increase of 5x10-52
to 3x10⁻⁴. In sub-period 4, we define a small uplift (“small uplifting of the3
ground" in 7 days) between 5 and 20 cm. In terms of dε/dt this range4
corresponds to 1.4x10⁻⁶ d-1 to 5.7x10⁻⁶ d-1, while for ε this corresponds to a5
further increase of 6x10⁻⁵ to 3.4x10⁻⁴. In sub-period 6, the deformation6
must be large and rapid (“opening of mount” in few hours, here we take7
Δt=6 hours), between 50 cm and 3 m. In terms of dε/dt this range8
corresponds to 4x10⁻⁴ d-1 to 2.4x10⁻³ d-1, while for ε this corresponds to9
1.6x10⁻⁴ to 9.4x10-4.10
In this way, we perform 1000 control experiments; in practice, we build up11
1000 different pre-eruptive phases, with the same anomalous parameters,12
but assuming different values for them. This is a way of controlling the13
dependence of BET_EF forecasting results on the thresholds fixed for14
Vesuvius and on the errors in input monitoring measurements. In15
particular, we want to check the stability of our best guess result (the16
average of the probability distribution) with respect to reasonable errors on17
our subjective interpretation. Since the best guess value is largely related18
to aleatory uncertainty, i.e., a measure of the intrinsic unpredictability of19
the system, with the control experiment we want to check how stable is the20
system predictability in relation to errors in our interpretation. Because of21
this, we will concentrate on the statistics of the control experiments’22
average, rather than on the statistics of the dispersion.23
22
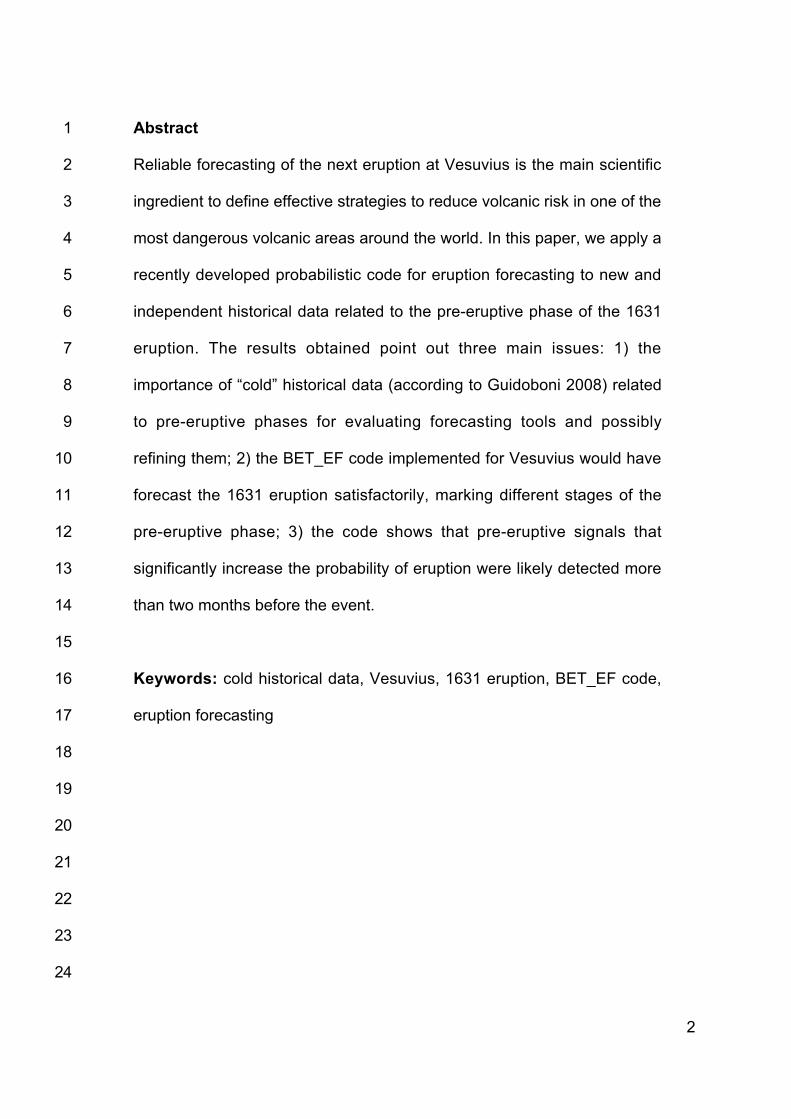
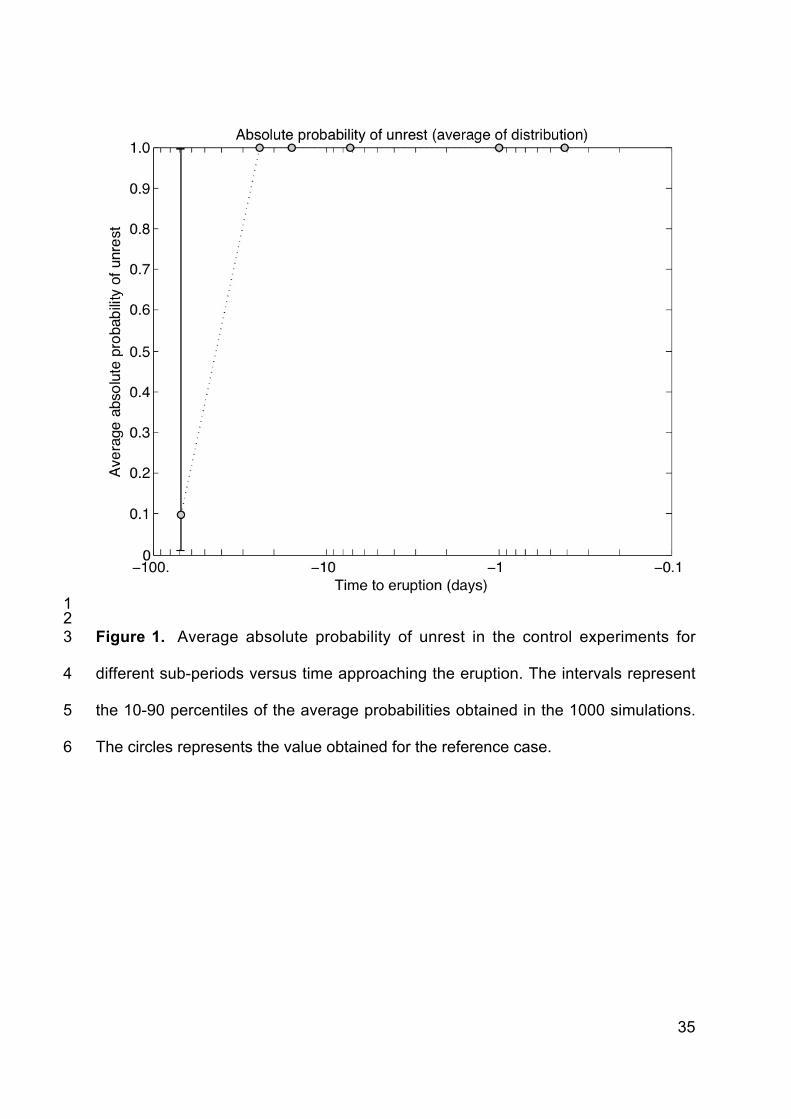
In figure 1 we show a plot of the dispersion in the estimate of the average1
probability of unrest versus time approaching the eruption among the 10002
control experiments. For comparison, we also show the results from the3
reference case. It is important to note that the increases of the monitoring4
parameters in the reference case are all contained in the ranges identified5
above and given in Table 3.6
From figure 1, we see that the BET_EF model immediately takes a jump in7
the probability of unrest some months before the eruption, and it8
recognizes undoubtedly an unrest phase about a month before the9
beginning of the eruption.10
11
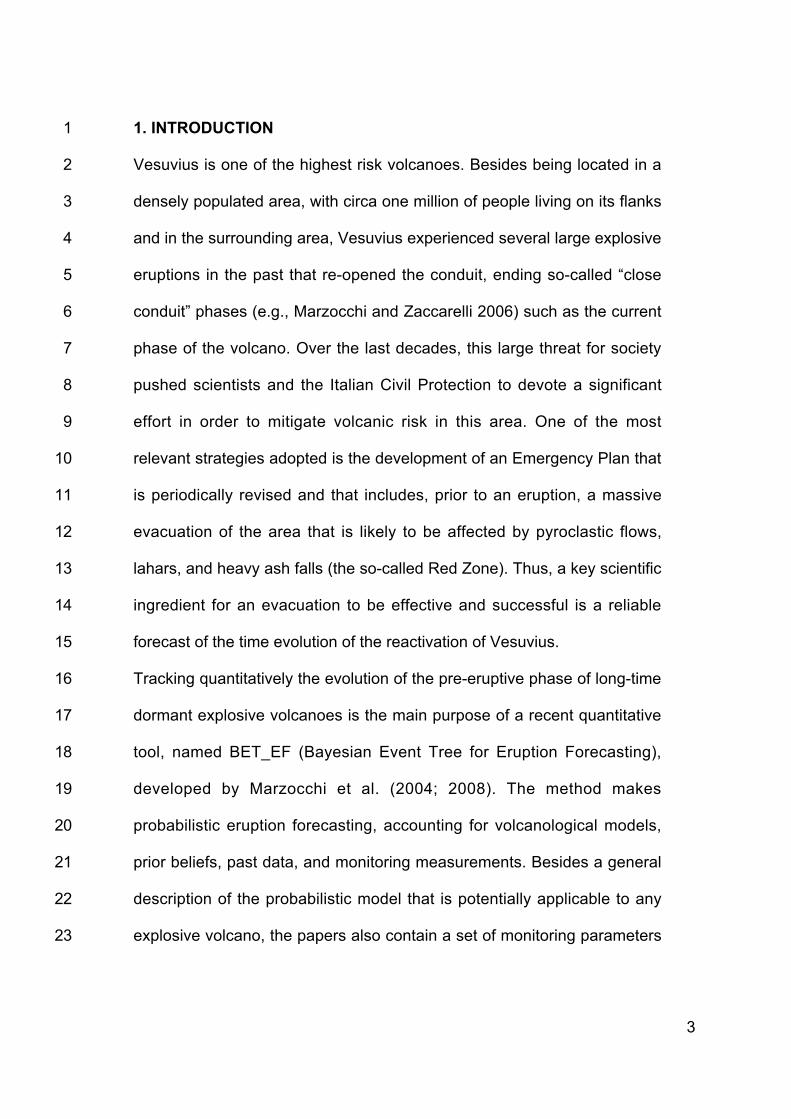
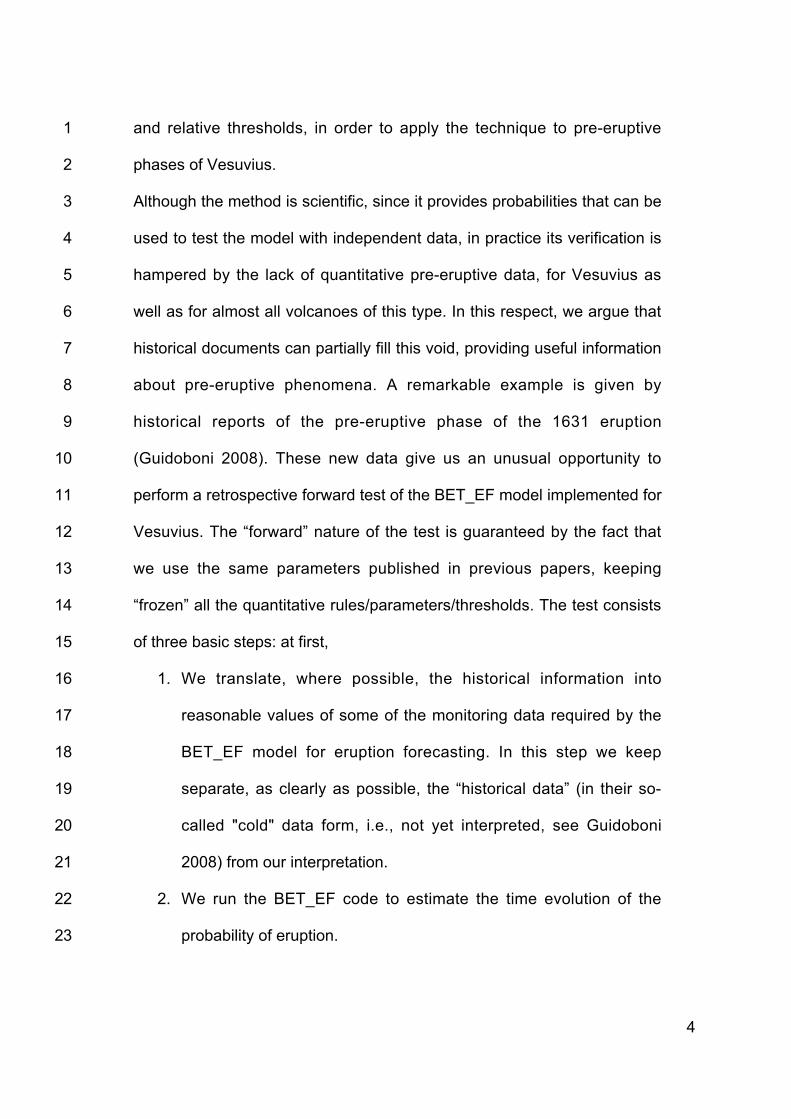
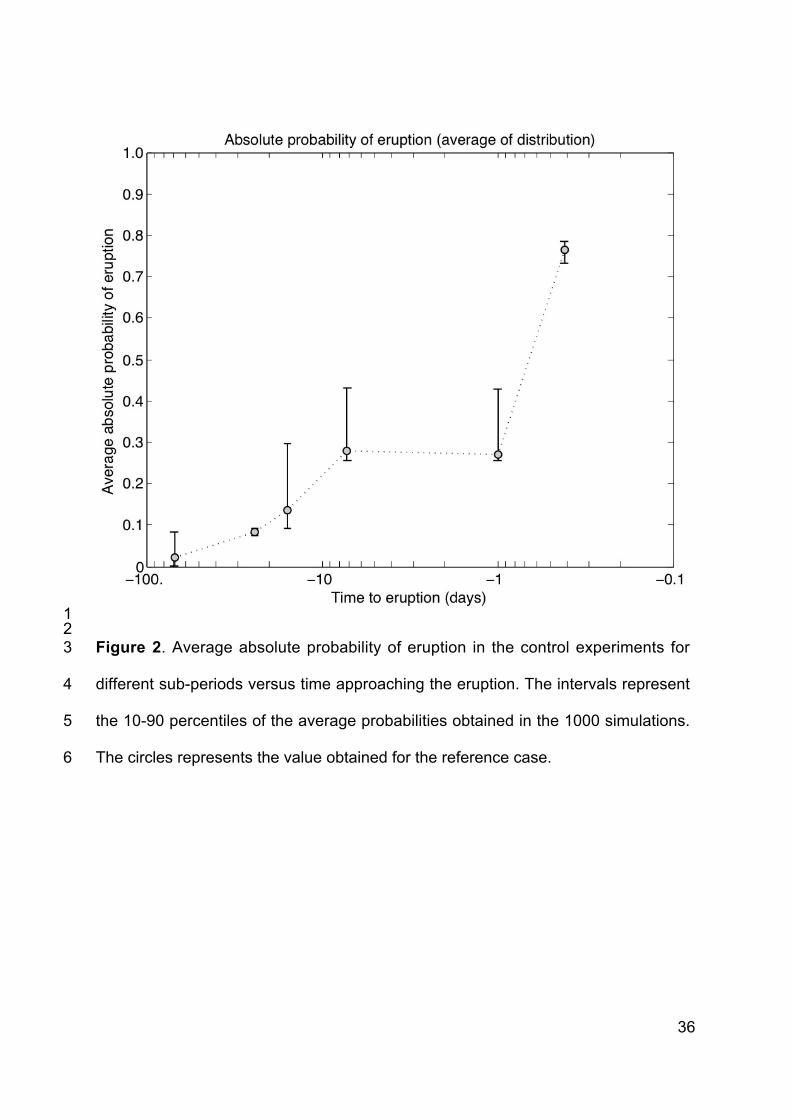
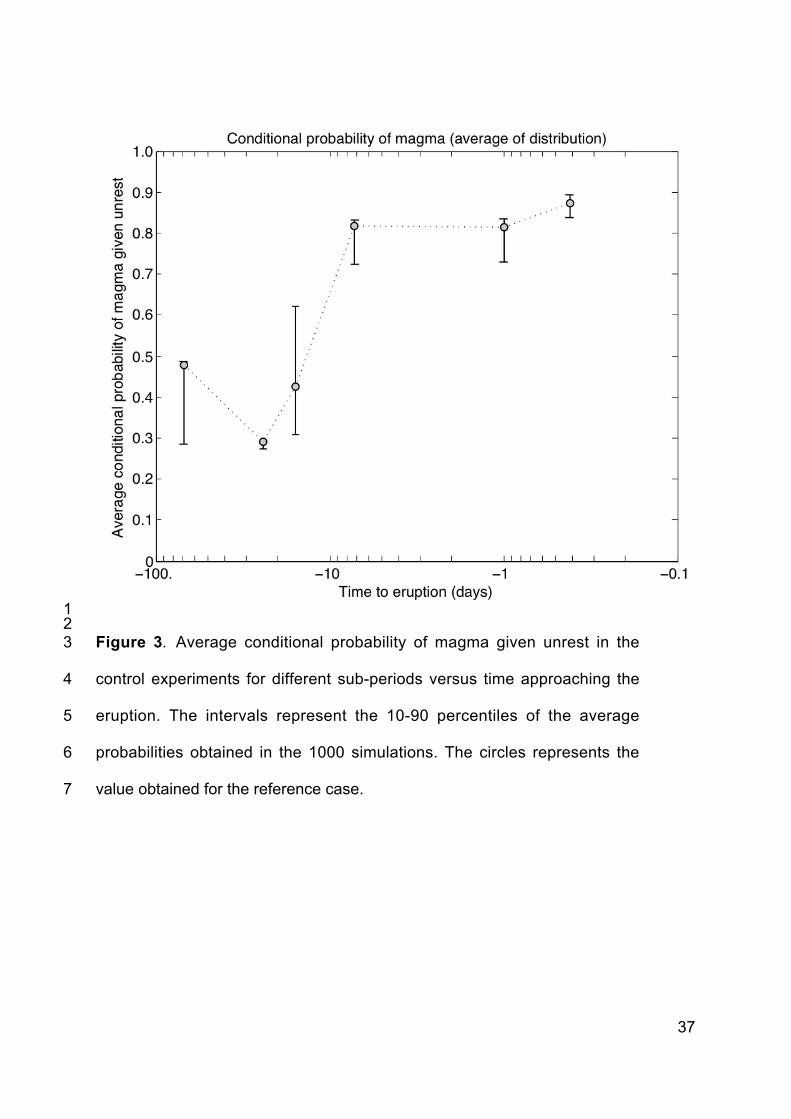
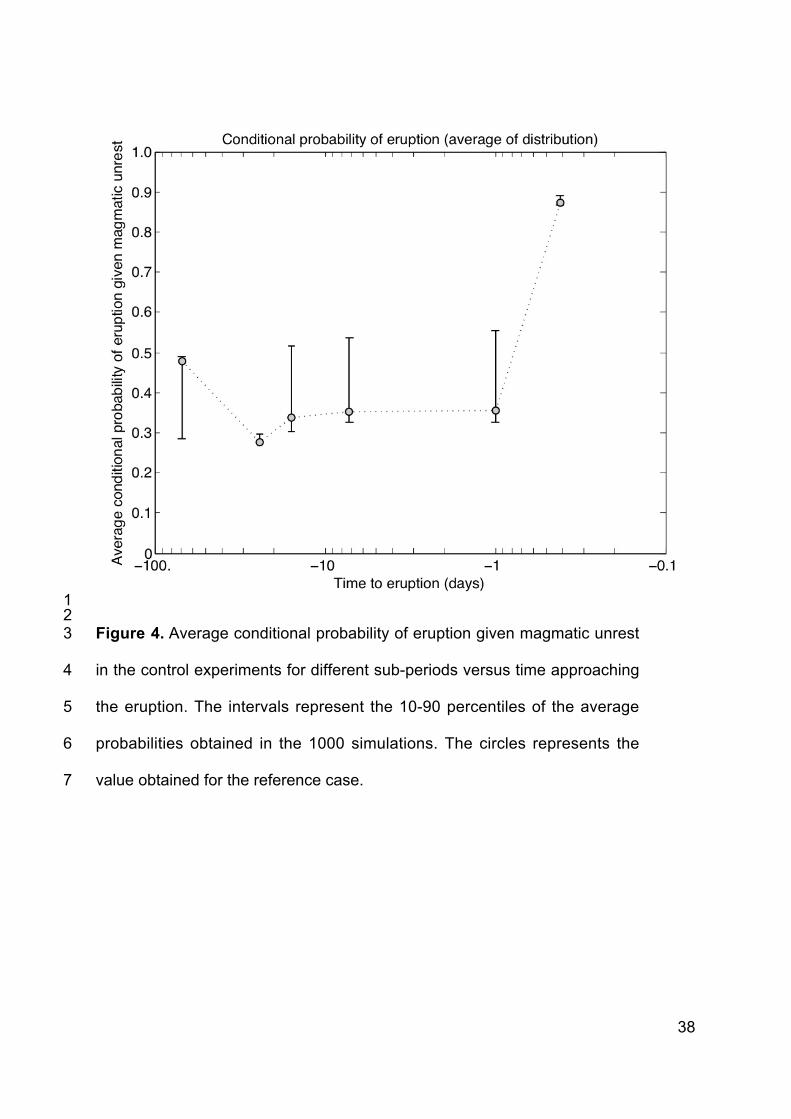
In figures 2, 3 and 4 we show the same as in figure 1, except that we show12
respectively the average absolute probability of eruption, the average13
conditional probability of magma given unrest, and the average conditional14
probability of eruption given magmatic unrest. These figures show that, as15
time approaches the eruption, an escalating trend towards an eruptive16
characterization of the crisis is evident (figure 2). The conditional17
probability of magma given unrest (figure 3) is very high (around 80%)18
already about 10 days before the eruption onset, while the conditional19
probability of eruption given magma (figure 4) is stable around 30-50%,20
except for a large step up to 90% in the few hours preceding the onset,21
implying a substantial reduction of the aleatory uncertainty on the eruption22
absolute probability (up to 70-80%). This is actually a common experience23
23
of present-day volcanologists who have witnessed a large explosive1
eruption.2
3
4. DISCUSSION AND CONCLUSIONS4
We have applied the BET_EF code (Marzocchi et al. 2004; Marzocchi et5
al. 2008) to characterize the time evolution of the 1631 pre-eruptive phase6
at Vesuvius, by using new and independent (i.e., they were not used to set7
up the model) “cold” historical data. This application highlights four major8
points.9
- Historical researches to study and to model pre-eruptive phases, overall10
for explosive volcanoes that do not have recent and monitored volcanic11
eruption, as for Vesuvius, are of prominent importance, as suggested also12
by Bertagnini et al. (2006).13
- BET_EF code (Marzocchi et al. 2004; Marzocchi et al. 2008) applied to14
the 1631 pre-eruptive phase is able to track the time evolution leading to15
the eruption, marking steps in probability of eruption as time approaches16
the eruption onset.17
- The 1631 pre-eruptive phase shows signals that were able to increase18
the absolute probability of eruption up to 10% about a month before the19
beginning of the eruption; this probability reaches more than 30% 7-1020
days before the onset of the event. In this respect, we do not agree with21
Bertagnini et al. (2006) when they conclude that “the anomalous22
phenomena reported before the end of November appear to be of doubtful23
significance and reliability”. Rather, we think that even if the chronicles24

24
report a filtered subset of occurred medium-term precursors, they are1
sufficient for estimating a 10% probability of eruption, a month in advance.2
We argue that also figures like these are worth being considered. In fact,3
Marzocchi and Woo (2007) showed that the call for an evacuation based4
on cost/benefit analysis is usually much lower than the higher probabilities5
usually adopted by volcanologists, for instance during the MESIMEX6
experiment.7
- The BET_EF aleatory uncertainty on eruption probability for 1631 event8
resembles the experience of present-day volcanologists who have9
witnessed large explosive eruption, i.e., the aleatory uncertainty on the10
eruption occurrence is low only hours before its onset.11
12
Finally, we want to remark that the translation of historical information into13
monitoring parameters always involves “subjective” choices. Here, we14
have deeply explored the stability of the results (“control experiments”) as15
a function of the assumptions made, and, in any case, we have usually16
chosen the most conservative options in order to not optimize the results.17
It is also worth remarking that these results could represent a lower bound18
of the BET_EF forecasting capability, because we use only a subset of the19
real pre-eruptive signals, i.e., we use monitoring parameters that produced20
signals felt by human beings and not only by instruments. We think that21
the inclusion of the latter type of signals can improve the results reported22
here.23
24
25
References1
Arminio, (de) Giovanni Domenico (1632), De terremotibus et incendiis eorumque2
causis et signis naturalibus et supranaturalibus Item de flagratione Vesuvii3
eiusque mirabilibus eventis et auspiciis, Xenodochii Incurabilium Neap. urbis a4
secretis, Naples.5
6
Braccini, Giulio Cesare (1632) Dell’incendio fattosi nel Vesuvio a XVI. di7
Dicembre M.DC.XXXI. e delle sue cause, ed effetti.| Con la narrazione di quanto8
è seguito in esso per tutto Marzo 1632. e con la Storia di tutti gli altri Incendij nel9
medesimo Monte avvenuti. Discorrendosi in fine delle Acque, le quali in questa10
occasione hanno danneggiato le campagne, e di molte altre cose curiose,11
dell’Abbate Giulio Cesare Braccini da Gioviano di Lucca Dottor di Leggi, e12
Protonotario Appostolico. Napoli.13
14
Barberi F, Macedonio G, Pareschi MT, Santacroce R (1990) Mapping the15
tephra fallout risk: An example from Vesuvius, Italy. Nature 344:142–14416
17
Barberi F, Principe C, Rosi M, Santacroce R (1995) Scenario eruttivo al Vesuvio18
nel caso di riattivazione a medio-breve termine. Aggiornamento al 20 gennaio19
1995. Rapporto GNV-Protezione Civile, pp 14 (in Italian)20
21
Bertagnini A, Cioni R, Guidoboni E, Rosi M, Neri A, Boschi E (2006) Eruption22
early warning at Vesuvius: The A.D. 1631 lesson. Geophys Res Lett23
33:L18317. DOI:10.1029/2006GL027297.24
25
26
Carafa, Gregorio (1632) In opusculum de novissima Vesuvij conflagratione,1
epistola isagogica, 2nd ed Naples2
3
Cioni R, Longo A, Macedonio G, Santacroce R, Sbrana R, Sulpizio R,4
Andronico D (2003) Assessing pyroclastic fall hazard through field data and5
numerical simulations: Example from Vesuvius. J Geophys Res 108:B2:2063.6
DOI:10.1029/2001JB0006427
8
Cornelius RR, Voight B (1996) Real-time Seismic Amplitude Measurement9
(RSAM) and Seismic Spectral Amplitude Measurement (SSAM) Analyses with10
the Materials Failure Forecast Method (FFM), June 1991 Explosive Eruption at11
Mount Pinatubo. In: Newhall CG, Punongbayan RS (Eds) Fire and Mud:12
Eruptions and Lahars of Mount Pinatubo, Phillipines. University of Washington13
Press, Seattle, WA, pp 249-26814
15
Esposti Ongaro T, Neri A, Todesco M, Macedonio G (2002) Pyroclastic flow16
hazard assessment at Vesuvius (Italy) by using numerical modeling II. Analysis17
of flow variables. Bull Volcanol 64:178–191. DOI:10.1007/s00445-0010190-118
19
Guidoboni E (2004) Analysis of three coeval Treatises on the 1631 Vesuvius20
eruption, finalised to the evidence of the precursors: Gregorio Carafa, Giovan21
Battista Mascolo, Salvatore Varonius. Internal Report D2.4 of the EU Project:22
Explosive eruption risk and decision support for EU population threatened by23
27
volcanoes, EXPLORIS, Contract no. CT-EVR1- 2002-40026, Coordinator Neri1
A, INGV2
3
Guidoboni (2005-2007). Vulcan-3 project - RU 1, Historical Research on the4
Volcanoes of the Campania Region: Campi Flegrei, Vesuvius, Ischia,5
agreement with the Dipartimento della Protezione Civile and INGV6
7
Guidoboni E, Boschi E (2006) Vesuvius before the 1631 Eruption. EOS,8
TRANSACTIONS AMERICAN GEOPHYSICAL UNION 87:40:4179
10
Guidoboni E (2008) Vesuvius: A Historical Approach To The 1631 Eruption -11
“Cold Data” From The Analysis Of Three Contemporary Treatises. J Volcanol12
Geotherm Res. DOI:10.1016/j.jvolgeores.2008.09.02013
14
Hill DP (1996) Earthquakes and carbon dioxide beneath Mammoth Mountain,15
California. Seismol Res Lett 67:8-1516
17
Marzocchi W, Sandri L, Gasparini P, Newhall CG, Boschi E (2004) Quantifying18
probabilities of volcanic events: the example of volcanic hazard at Mount19
Vesuvius. J Geophys Res 109:B11201. DOI:10.1029/2004JB00315520
21
Marzocchi W, Zaccarelli L (2006) A quantitative model for the time-size22
distr ibut ion of erupt ions. J Geophys Res 111:B04204.23
DOI:10.1029/2005JB00370924
28
1
Marzocchi W, Woo G (2007) Probabilistic eruption forecasting and the call for2
an evacuation. Geophys Res Lett 34:L22310. DOI:10.1029/2007GL0319223
4
Marzocchi W, Sandri L, Selva J (2008) BET_EF: a probabilistic tool for long-5
and short-term eruption forecasting. Bull Volcanol 70:623–632.6
DOI:10.1007/s00445-007-0157-y7
8
Mascolo, Giovan Battista (1634) De incendio Vesuvii excitato xvij. Kal. Ianuar.9
anno trigesimo primo sæculi Decimiseptimi libri X. Cum Chronologia superiorum10
incendiorum; & Ephemeride ultimi. Napoli11
12
Presidenza del Consiglio dei Ministri, Dipartimento della Protezione Civile,13
Pianificazione Nazionale d’emergenza dell’area vesuviana, 199514
15
Quareni F, Mulargia F (1993) Modeling of closure of volcanic conduits with an16
application to Mount Vesuvius. J Geophys Res 98:4221–422917
18
Scandone R, Giacomelli L, Gasparini P (1993) Mount Vesuvius: 2000 years of19
volcanological observations. J Volcanol Geotherm Res 58:5–2520
21
Varrone (Varonius), Salvatore (1634), Vesuviani incendii historiae libri tres,22
Naples23
24
Zollo A, Marzocchi W, Capuano P, Lomax A, Iannaccone G (2002) Space and25

29
Time Behavior of Seismic Activity at Mt. Vesuvius Volcano, Southern Italy. Bull1
Seismol Soc Am 92:625–6402
3
30
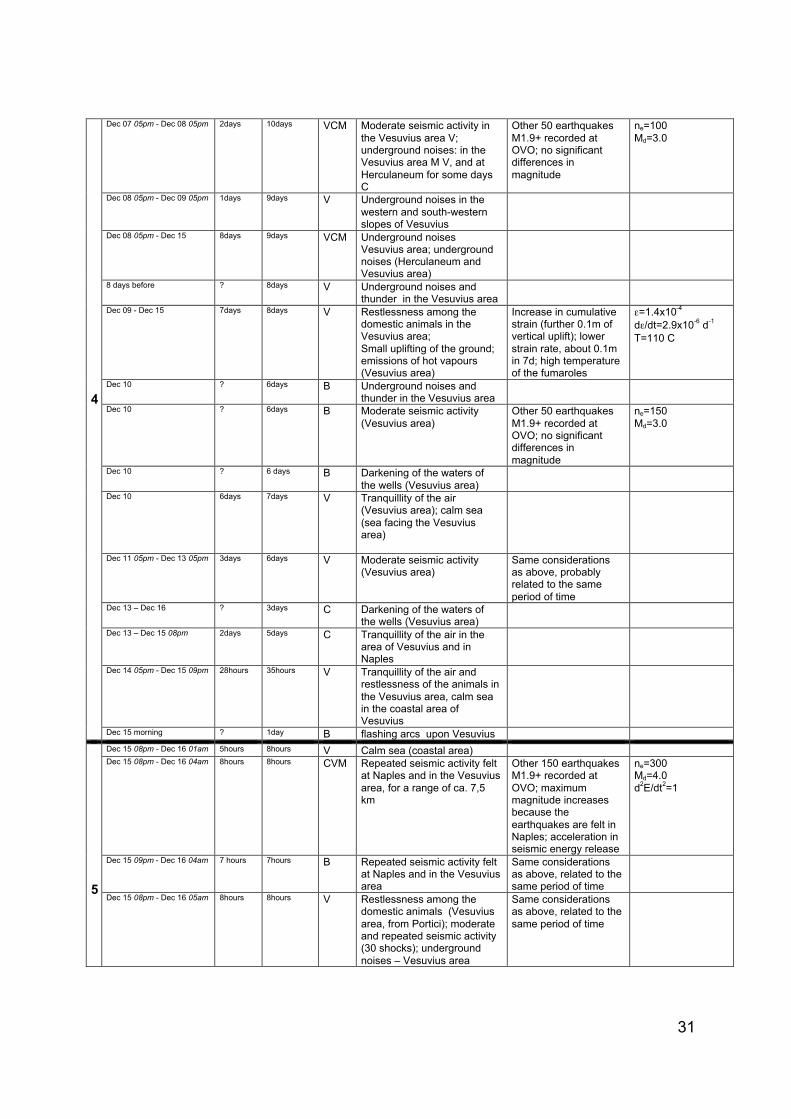
TABLE 1. Pre-eruptive phase for the 1631 eruption: from the summer to1December 16th 4-5am, GMT2
3Note that the thick black lines represent different time sub-periods related to different applications4of the BET_EF code (see section 4). The question mark “?” means “missing or not defined data”,5while “ca” means “circa”. Legend:6Leftmost column indicates the time sub-period7Date/chronological range = month day (and, when defined, hour in italics) of the beginning of8the phenomenon described, and, when available, its end. Time is given in GMT9Duration= duration of the phenomenon (in the units specified)10Time to eruption = time in months, days or hours (as specified) elapsing between the start of11the phenomenon described and the onset of the eruption12Source: A=de Arminio (1632); B=Braccini (1634); C=Carafa (1634); M=Mascolo (1634);13V=Varrone (1632)14
15Date/chronological range Duration Time to
eruptionSource Summary of the description Volcanological interpretation BET_EF parameters (for
the meaning of thesymbols, see Section 3)
Summer/August? 1month ca 120days V Fires visible at night atHerculaneum (Resina in thetexts) eastern slopes of thevolcano
Aug ? ca 120days A Smoke emissions from thecrater
Increase in CO2 flux(about 4 times theaverage)
ΠCO2=10 kg m-2 d-1
Sep 1 - Sep 10 11days 107days C Lowering of the ground;landslides; ground faulting;smoke emissions; fieryemissions (north-easternslope)
Sep 1 – Dec 16 05am 3.5months ca 107days V Considerable anomalousrestlessness among thedomestic animals; flight ofwild animals from theVesuvius area
1
Oct 1 - Nov 30 2months 77days V Underground noises (fromPortici)
ca Nov 16 – Dec 1 0.5month 30days B Elevation of the ground Detection of positivestrain (about 0.1m ofvertical uplift overΔh=5km, i.e., thesupposed thickness ofthe deformed layer);positive strain rate(0.1m of uplift in 0.5mo)
ε=2x10⁻⁵
dε/dt=1.3x10-6 d-1
2
Nov 19 10pm - Nov 20 07am 9hours 27days V Rough seas; moderateseismic activity in the coastalregion of Vesuvius
About 50 earthquakesM1.9+ recorded atOVO; maximummagnitude about 3.0
ne=50Md=3.0
“Just before December” ? ca 18days V Emissions, with effects on theherbaceous vegetation[wilting] (Vesuvius area)
Stronger increase inCO2 flux
ΠCO2=20 kg m-2 d-1
Beginning of December 5days ca 16days AV Loud noises in the Vesuviusarea
3 Nov 28 - Dec 02 5days 14days V Darkening and variation in thewater chemistry [salinity](Vesuvius area); collapse of agreat overhanging rock(eastern slope); majoruplifting of the ground -(slopes, particularly western)
Increase in cumulativestrain (further 0.5m ofvertical uplift); higherstrain rate, about 0.5min 5d
ε=1.2x10⁻⁴
dε/dt=2x10-5 d-1
31
Dec 07 05pm - Dec 08 05pm 2days 10days VCM Moderate seismic activity inthe Vesuvius area V;underground noises: in theVesuvius area M V, and atHerculaneum for some daysC
Other 50 earthquakesM1.9+ recorded atOVO; no significantdifferences inmagnitude
ne=100Md=3.0
Dec 08 05pm - Dec 09 05pm 1days 9days V Underground noises in thewestern and south-westernslopes of Vesuvius
Dec 08 05pm - Dec 15 8days 9days VCM Underground noisesVesuvius area; undergroundnoises (Herculaneum andVesuvius area)
8 days before ? 8days V Underground noises andthunder in the Vesuvius area
Dec 09 - Dec 15 7days 8days V Restlessness among thedomestic animals in theVesuvius area;Small uplifting of the ground;emissions of hot vapours(Vesuvius area)
Increase in cumulativestrain (further 0.1m ofvertical uplift); lowerstrain rate, about 0.1min 7d; high temperatureof the fumaroles
ε=1.4x10⁻⁴
dε/dt=2.9x10-6 d-1
T=110 C
Dec 10 ? 6days B Underground noises andthunder in the Vesuvius area
Dec 10 ? 6days B Moderate seismic activity(Vesuvius area)
Other 50 earthquakesM1.9+ recorded atOVO; no significantdifferences inmagnitude
ne=150Md=3.0
Dec 10 ? 6 days B Darkening of the waters ofthe wells (Vesuvius area)
Dec 10 6days 7days V Tranquillity of the air(Vesuvius area); calm sea(sea facing the Vesuviusarea)
Dec 11 05pm - Dec 13 05pm 3days 6days V Moderate seismic activity(Vesuvius area)
Same considerationsas above, probablyrelated to the sameperiod of time
Dec 13 – Dec 16 ? 3days C Darkening of the waters ofthe wells (Vesuvius area)
Dec 13 – Dec 15 08pm 2days 5days C Tranquillity of the air in thearea of Vesuvius and inNaples
Dec 14 05pm - Dec 15 09pm 28hours 35hours V Tranquillity of the air andrestlessness of the animals inthe Vesuvius area, calm seain the coastal area ofVesuvius
4
Dec 15 morning ? 1day B flashing arcs upon VesuviusDec 15 08pm - Dec 16 01am 5hours 8hours V Calm sea (coastal area)Dec 15 08pm - Dec 16 04am 8hours 8hours CVM Repeated seismic activity felt
at Naples and in the Vesuviusarea, for a range of ca. 7,5km
Other 150 earthquakesM1.9+ recorded atOVO; maximummagnitude increasesbecause theearthquakes are felt inNaples; acceleration inseismic energy release
ne=300Md=4.0d2E/dt2=1
Dec 15 09pm - Dec 16 04am 7 hours 7hours B Repeated seismic activity feltat Naples and in the Vesuviusarea
Same considerationsas above, related to thesame period of time5
Dec 15 08pm - Dec 16 05am 8hours 8hours V Restlessness among thedomestic animals (Vesuviusarea, from Portici); moderateand repeated seismic activity(30 shocks); undergroundnoises – Vesuvius area
Same considerationsas above, related to thesame period of time
32
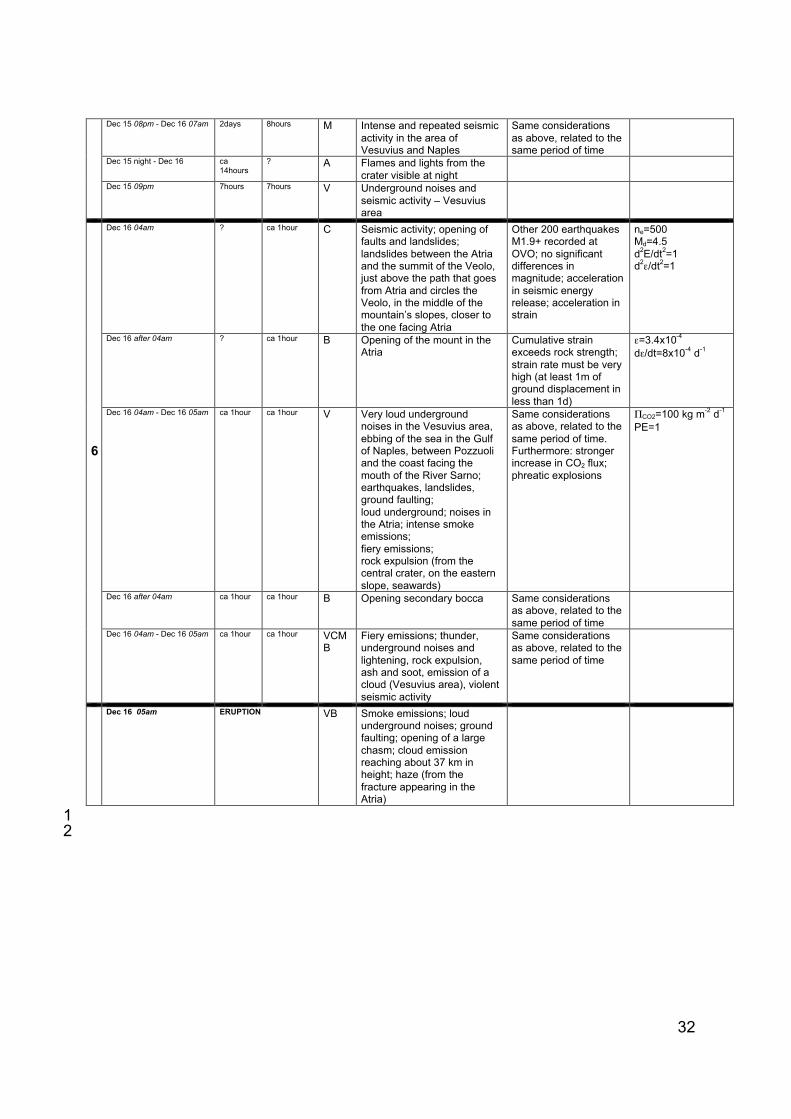
Dec 15 08pm - Dec 16 07am 2days 8hours M Intense and repeated seismicactivity in the area ofVesuvius and Naples
Same considerationsas above, related to thesame period of time
Dec 15 night - Dec 16 ca14hours
? A Flames and lights from thecrater visible at night
Dec 15 09pm 7hours 7hours V Underground noises andseismic activity – Vesuviusarea
Dec 16 04am ? ca 1hour C Seismic activity; opening offaults and landslides;landslides between the Atriaand the summit of the Veolo,just above the path that goesfrom Atria and circles theVeolo, in the middle of themountain’s slopes, closer tothe one facing Atria
Other 200 earthquakesM1.9+ recorded atOVO; no significantdifferences inmagnitude; accelerationin seismic energyrelease; acceleration instrain
ne=500Md=4.5d2E/dt2=1d2ε/dt2=1
Dec 16 after 04am ? ca 1hour B Opening of the mount in theAtria
Cumulative strainexceeds rock strength;strain rate must be veryhigh (at least 1m ofground displacement inless than 1d)
ε=3.4x10⁻⁴
dε/dt=8x10-4 d-1
Dec 16 04am - Dec 16 05am ca 1hour ca 1hour V Very loud undergroundnoises in the Vesuvius area,ebbing of the sea in the Gulfof Naples, between Pozzuoliand the coast facing themouth of the River Sarno;earthquakes, landslides,ground faulting;loud underground; noises inthe Atria; intense smokeemissions;fiery emissions;rock expulsion (from thecentral crater, on the easternslope, seawards)
Same considerationsas above, related to thesame period of time.Furthermore: strongerincrease in CO2 flux;phreatic explosions
ΠCO2=100 kg m-2 d-1
PE=1
Dec 16 after 04am ca 1hour ca 1hour B Opening secondary bocca Same considerationsas above, related to thesame period of time
6
Dec 16 04am - Dec 16 05am ca 1hour ca 1hour VCMB
Fiery emissions; thunder,underground noises andlightening, rock expulsion,ash and soot, emission of acloud (Vesuvius area), violentseismic activity
Same considerationsas above, related to thesame period of time
Dec 16 05am ERUPTION VB Smoke emissions; loudunderground noises; groundfaulting; opening of a largechasm; cloud emissionreaching about 37 km inheight; haze (from thefracture appearing in theAtria)
12
33
TABLE 2. Results of the simulations over the 6 different time sub-periods for1the reference case2
3Time Sub-periodand relative“anomalousmonitoring”
AbsoluteProbability of Unrest
AbsoluteProbability ofEruption
ConditionalProbability ofMagma (givenUnrest)
ConditionalProbability ofEruption (givenMagmatic Unrest)
Average 10 perc 50 perc 90 perc Average 10 perc 50 perc 90 perc Average 10 perc 50 perc 90 perc Average 10 perc 50 perc 90 perc
1 (Aug to Nov 15)ΠCO2=10 kg m-2 d-1
0.10 0.10 0.10 0.10 0.02 0.002 0.02 0.05 0.48 0.12 0.47 0.84 0.48 0.12 0.47 0.84
2 (Nov 16 to Nov 27)ΠCO2=10 kg m-2 d-1
ε=2x10⁻⁵
dε/dt=1.3x10-6 d-1
ne=50Md=3.0
1 1 1 1 0.08 0 0.002 0.29 0.28 0 0.12 0.86 0.28 0 0.09 0.86
3 (Nov 28 to Dec 02)ΠCO2=20 kg m-2 d-1
ε=1.2x10⁻⁴
dε/dt=2x10-5 d-1
ne=50Md=3.0
1 1 1 1 0.13 0 0.02 0.50 0.43 0.004 0.37 0,96 0.34 0 0.22 0,92
4 (Dec 03 to Dec 15morning)ΠCO2=20 kg m-2 d-1
T=110 C ε=1.4x10⁻⁴
dε/dt=2.9x10-6 d-1
ne=150Md=3.0
1 1 1 1 0.28 0 0.13 0,83 0.82 0.21 1 1 0.35 0 0.24 0,92
5 (Dec 15 08pm to Dec16 night)ΠCO2=20 kg m-2 d-1
T=110 C ε=1.4x10⁻⁴
dε/dt=0 d-1
ne=300Md=4.0d2E/dt2=1
1 1 1 1 0.27 0 0.10 0,85 0.82 0.22 1 1 0.36 0 0.24 0,93
6 (Dec 16 04 am toEruption Onset)ΠCO2=100 kg m-2 d-1
T=110 C ε=3.4x10⁻⁴
dε/dt=8x10-4 d-1
ne=500Md=4.0d2E/dt2=1d2ε/dt2=1PE=1
1 1 1 1 0.77 0.13 0.98 1 0.87 0.38 1 1 0.87 0.41 1 1
34
TABLE 3. Control experiments: parameters that are varied in the experiments,1present-day background value and relative ranges for the increments in each2sub-period. For the deformation parameters (dε /dt and ε), we vary the3supposed uplift and translate it into the desired parameters.4
5Parameter Present-day background Range of increaseT 95 °C Sub-period 4: 5 – 25 °CMd About 2 – 2.5/month Sub-period 2: 0 – 1.5 /month
Sub-period 5: 0 – 1.5 /monthne About 10 events/month Sub-period 2: 0 – 100 events/month
Sub-period 4 (1): 0 – 100 events/monthSub-period 4 (2): 0 – 100 events/monthSub-period 5: 50 – 300 events/monthSub-period 6: 50 – 300 events/month
ΦCO2 2.5 kg m-2 d-1 Sub-period 1: 0 – 30 kg m-2 d-1
Sub-period 3: 0 – 30 kg m-2 d-1
Sub-period 6: 20 – 300 kg m-2 d-1
Uplift 0 m Sub-period 2: 5 – 50cm/0.5month(dε/dt: 6.7x10⁻⁷ – 6.7x10⁻⁶ d-1; ε: 10-5 – 10-4)Sub-period 3: 20 – 100 cm/5 days(dε/dt: 8x10⁻⁶ – 4x10⁻⁵ d-1; ε: 5x10⁻⁵ - 3x10⁻⁴)Sub-period 4: 5 - 20 cm/7days(dε/dt: 1.4x10⁻⁶ – 5.7x10⁻⁶ d-1; ε: 6x10⁻⁵ – 3.4x10⁻⁴)Sub-period 6: 50 – 300 cm/6hours(dε/dt: 4x10⁻⁴ - 2.4x10⁻³ d-1; ε: 1.6x10⁻⁴- 9.4x10⁻⁴)
6789
10
35
12
Figure 1. Average absolute probability of unrest in the control experiments for3
different sub-periods versus time approaching the eruption. The intervals represent4
the 10-90 percentiles of the average probabilities obtained in the 1000 simulations.5
The circles represents the value obtained for the reference case.6
36
12
Figure 2. Average absolute probability of eruption in the control experiments for3
different sub-periods versus time approaching the eruption. The intervals represent4
the 10-90 percentiles of the average probabilities obtained in the 1000 simulations.5
The circles represents the value obtained for the reference case.6
37
12
Figure 3. Average conditional probability of magma given unrest in the3
control experiments for different sub-periods versus time approaching the4
eruption. The intervals represent the 10-90 percentiles of the average5
probabilities obtained in the 1000 simulations. The circles represents the6
value obtained for the reference case.7
38
12
Figure 4. Average conditional probability of eruption given magmatic unrest3
in the control experiments for different sub-periods versus time approaching4
the eruption. The intervals represent the 10-90 percentiles of the average5
probabilities obtained in the 1000 simulations. The circles represents the6
value obtained for the reference case.7
39
Appendix A: The authors of the five treatises examined1
The authors of these four texts were Neapolitan intellectuals, men of the cloth or2
ecclesiastic, all present at the eruption of Vesuvius in 1631. Here is their3
concise biography, that is useful in order to frame the cultural ambient those4
authors belonged to.5
Giovanni Domenico de Arminio. Hardly anything is known about this author,6
apart from the fact that he was a doctor at the Ospedale degli Incurabili of7
Naples, as he himself declares in the presentation of the Treatise. So he was a8
direct witness to what had happened, above all of what was seen in Naples. His9
treatise contains many theoretical elements on the causes of the eruption,10
mainly oriented to an almost anthropomorphic interpretation of the volcanic11
activity.12
Gregorio Carafa (1588–1675). Carlo Marcello (later Gregorio) Carafa was born13
in Naples. He was a philosopher and theologian; he joined the Teatini fathers of14
Naples, where he held the chair of Philosophy and Theology. It was in those15
years that he acquired great fame as a preacher and a cultured intellectual. The16
fame he earned among his contemporaries and his noble origins allowed him to17
obtain the highest positions in his order. he was also the Bishop of Cassano18
(Calabria) and Archbishop of Salerno. He held some diplomatic posts: he was19
the special diplomatic representative of the Emperor Philip IV of Spain with the20
Pope Innocence X.21
Giovanni Battista Mascolo (1583–1648). Born in Naples, he became a Jesuit22
at a very young age, in 1598. He taught Theology and Philosophy at the23
College of his order, of which he was the rector for some time; later he held a24
40
school of rhetoric at his home. He was famed for being a good Latin scholar.1
His treatise Vesuviani Incendii Historiae libri tres (Naples, 1634), his most2
complex work, was written in his full maturity, probably using some of his3
previous unpublished writings.4
Giulio Cesare Braccini (1570-1632) He was a man of law, later an ecclesiast5
and abbot, born at Gioviano di Lucca. He was appointed apostolic proto-notary6
by Urban VIII and between 1629 and 1632 he was in Naples, in touch with7
many leading political characters of the day. As regards Vesuvius, abbot8
Braccini published two texts: one was a letter to cardinal Girolamo Colonna,9
disseminated in the first few days after the eruption, to the extent that already10
between the end of December 1631 and the beginning of 1632 three editions11
had been published (Relazione dell’incendio del Vesuvio alli 16 dicembre 163112
in una lettera diretta all’Em.mo e Re. mo Signore Card. Colonna, printed in13
Naples at S. Roncagliolo); and the treatise examined here, printed in Naples in14
September 1632.15
Salvatore Varrone (1593–1656.) We have very little information about him. He16
became a Jesuit in 1612; he taught grammar, humanities and rhetoric, and for17
six years scholastic theology and morals. He was famous for being a very18
learned intellectual. In the period of the eruption of Vesuvius, Varrone was19
staying at Portici, a village on the slopes of Vesuvius, and therefore was an20
eyewitness to the whole eruption.21
41
Appendix B: Summarizing tables of the BET_EF rules for Vesuvius1
Here we show the rules uploaded in BET_EF in this application. They are2
exactly the same used in Marzocchi et al (2008).3
A summary of all the rules is provided in Table B1.4
At each node k of the Bayesian Event Tree we compute two different5
probability distributions, one by using only monitoring data and the other6
one by using only other kinds of data, e.g. models, past occurrence, expert7
opinions. These two probability distributions are indicated respectively by8
[θk(M)] and [θk
(NM)], where the index k stands for the k-th node and the9
square brackets denote a probability distribution. In order to compute the10
actual probability distribution at node k, we linearly combine [θk(M)] and11
[θk(NM)] with a relative weight that is function of the state of unrest. Both12
[θk(M)] and [θk
(NM)] are computed through the Bayes theorem, i.e., by13
starting from a prior distribution (based on models and beliefs for [θk(NM)],14
and on present monitoring for [θk(M)]). The prior distribution is characterized15
by a mean (Θk(NM) and Θk
(M) in the two cases), representing our best prior16
guess on the probability at node k, and by a measure of the variance that17
we call “equivalent number of data” (Λk(NM) and Λk
(M) in the two cases)18
because intuitively it translates the confidence we have in our prior guess19
in terms of number of data. The minimum possible “equivalent number of20
data” is 1 and it represents the maximum variance allowed, implying a very21
low confidence on our prior guess, while there is no upper limit to its22
maximum value. The prior distribution is then transformed into the23
posterior distribution through Bayes theorem, i.e., by multiplying it by the24
42
likelihood function, based on past frequencies of occurrence for [θk(NM)]1
and on past monitoring (if any) for [θk(M)].2
An important aspect of BET is the way it deals with monitoring3
measurements. Through a fuzzy approach, the measured values are4
translated into degrees of anomaly, from whom the mean of the monitoring5
probability distribution (Θk(M)) is derived (Marzocchi et al, 2008). In6
practice, for each monitoring parameter, we define a lower and an upper7
threshold, and an order relationship, used to infer the degree of anomaly8
for every specific measured value.9
In the following, we give a detailed account of the choices on all BET10
parameters for Mt. Vesuvius (see also Marzocchi et al, 2004; 2008), as11
frozen before this retrospective application.12
See Marzocchi et al (2008) for a deeper discussion on BET structure (the13
nodes), general rules and related concepts.14
15
B.1 First node: Unrest16
B.1.1 Non-monitoring part: [θ1(NM)]17
There is no theoretical model or expert belief to be used for assessing the18
probability of a volcano entering an unrest phase. Thus here we set up a19
maximum ignorance prior distribution with mean Θ1(NM)=0.5 and Λ1
(NM)=1.20
Regarding past data, we know that OVO seismic station (see Zollo et al.,21
2002) has been monitoring Mt. Vesuvius continuously since 1972. We22
assume that there has been no episode of unrest ever since. Thus, we23
have 0 unrest episodes out of 420 months (i.e., 35 years).24
43
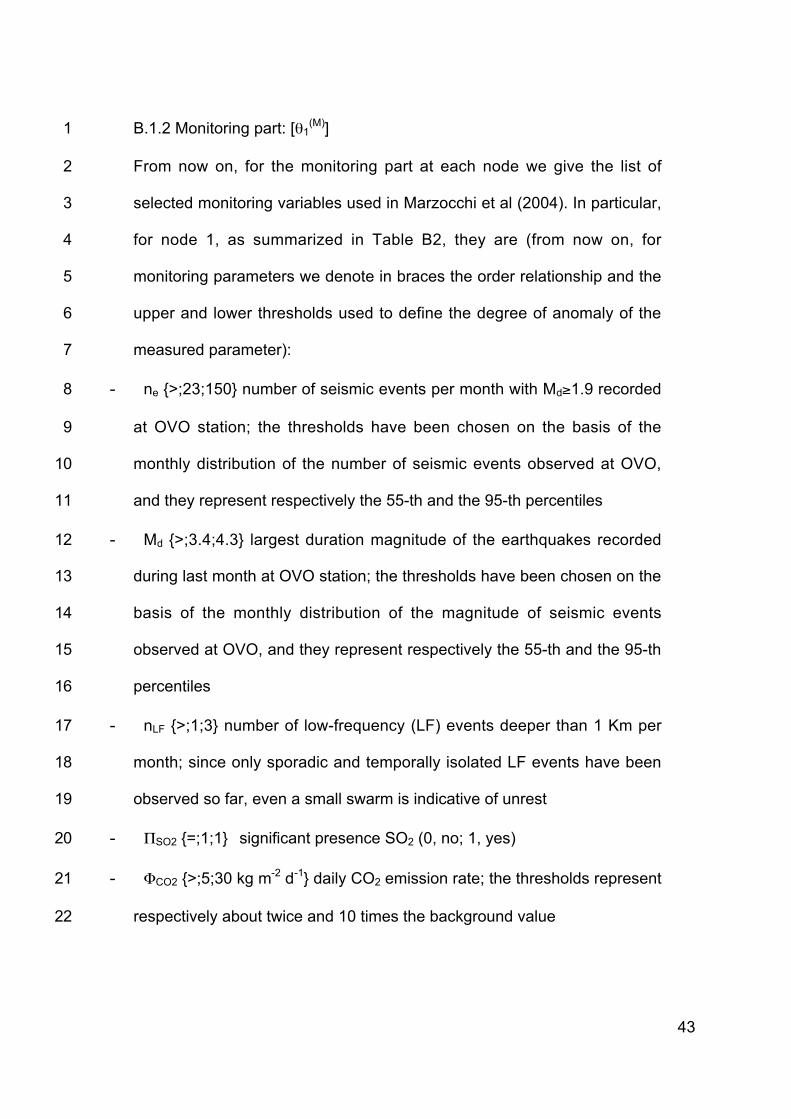
B.1.2 Monitoring part: [θ1(M)]1
From now on, for the monitoring part at each node we give the list of2
selected monitoring variables used in Marzocchi et al (2004). In particular,3
for node 1, as summarized in Table B2, they are (from now on, for4
monitoring parameters we denote in braces the order relationship and the5
upper and lower thresholds used to define the degree of anomaly of the6
measured parameter):7
- ne {>;23;150} number of seismic events per month with Md≥1.9 recorded8
at OVO station; the thresholds have been chosen on the basis of the9
monthly distribution of the number of seismic events observed at OVO,10
and they represent respectively the 55-th and the 95-th percentiles11
- Md {>;3.4;4.3} largest duration magnitude of the earthquakes recorded12
during last month at OVO station; the thresholds have been chosen on the13
basis of the monthly distribution of the magnitude of seismic events14
observed at OVO, and they represent respectively the 55-th and the 95-th15
percentiles16
- nLF {>;1;3} number of low-frequency (LF) events deeper than 1 Km per17
month; since only sporadic and temporally isolated LF events have been18
observed so far, even a small swarm is indicative of unrest19
- ΠSO2 {=;1;1} significant presence SO2 (0, no; 1, yes)20
- ΦCO2 {>;5;30 kg m-2 d-1} daily CO2 emission rate; the thresholds represent21
respectively about twice and 10 times the background value22
44
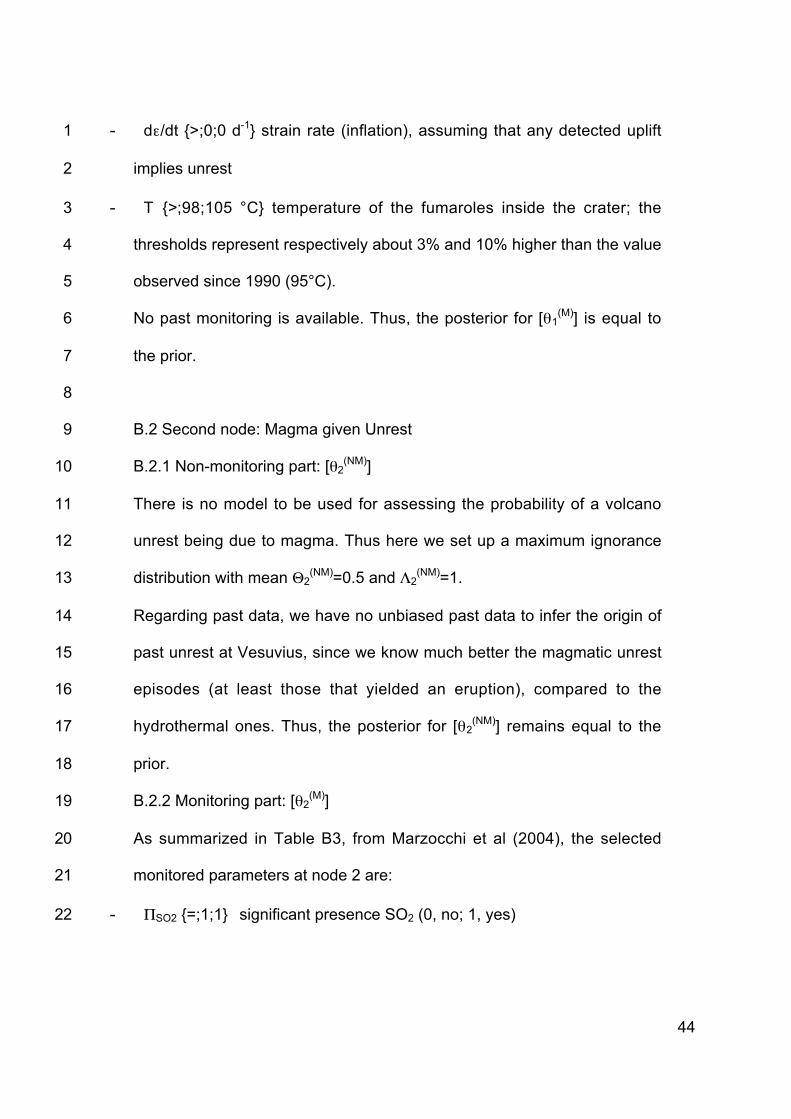
- dε/dt {>;0;0 d-1} strain rate (inflation), assuming that any detected uplift1
implies unrest2
- T {>;98;105 °C} temperature of the fumaroles inside the crater; the3
thresholds represent respectively about 3% and 10% higher than the value4
observed since 1990 (95°C).5
No past monitoring is available. Thus, the posterior for [θ1(M)] is equal to6
the prior.7
8
B.2 Second node: Magma given Unrest9
B.2.1 Non-monitoring part: [θ2(NM)]10
There is no model to be used for assessing the probability of a volcano11
unrest being due to magma. Thus here we set up a maximum ignorance12
distribution with mean Θ2(NM)=0.5 and Λ2
(NM)=1.13
Regarding past data, we have no unbiased past data to infer the origin of14
past unrest at Vesuvius, since we know much better the magmatic unrest15
episodes (at least those that yielded an eruption), compared to the16
hydrothermal ones. Thus, the posterior for [θ2(NM)] remains equal to the17
prior.18
B.2.2 Monitoring part: [θ2(M)]19
As summarized in Table B3, from Marzocchi et al (2004), the selected20
monitored parameters at node 2 are:21
- ΠSO2 {=;1;1} significant presence SO2 (0, no; 1, yes)22
45
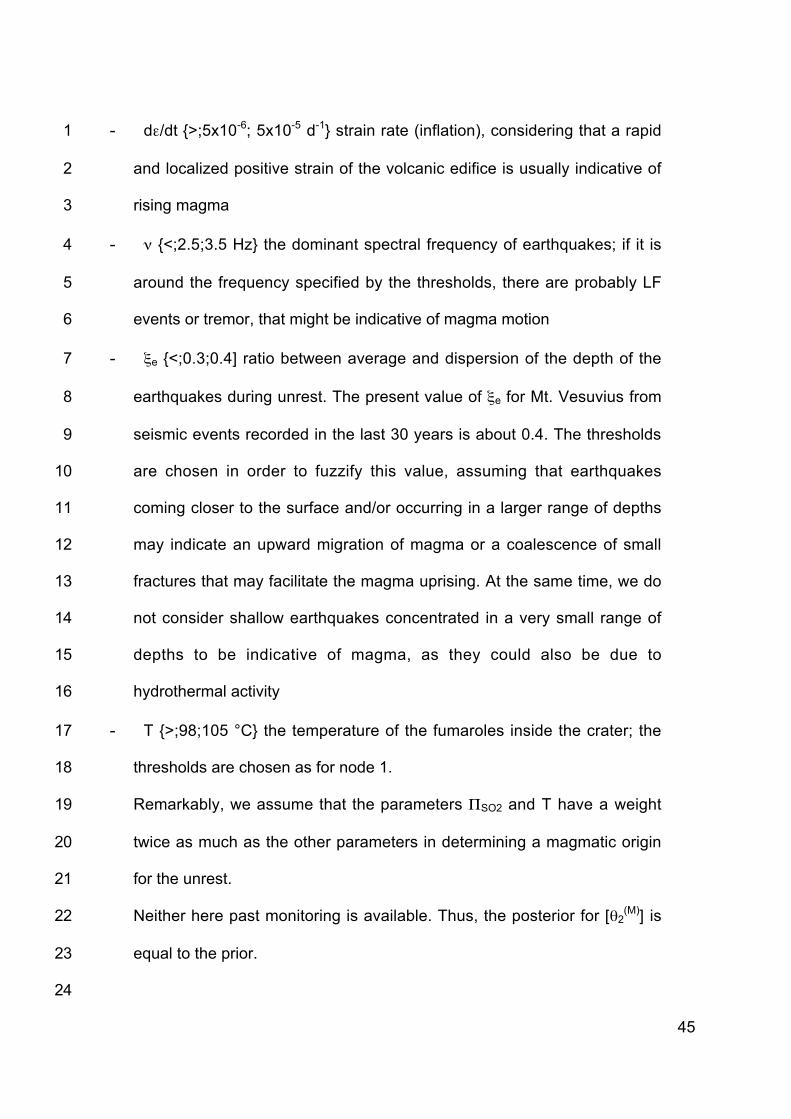
- dε/dt {>;5x10⁻⁶; 5x10⁻⁵ d-1} strain rate (inflation), considering that a rapid1
and localized positive strain of the volcanic edifice is usually indicative of2
rising magma3
- ν {<;2.5;3.5 Hz} the dominant spectral frequency of earthquakes; if it is4
around the frequency specified by the thresholds, there are probably LF5
events or tremor, that might be indicative of magma motion6
- ξe {<;0.3;0.4] ratio between average and dispersion of the depth of the7
earthquakes during unrest. The present value of ξe for Mt. Vesuvius from8
seismic events recorded in the last 30 years is about 0.4. The thresholds9
are chosen in order to fuzzify this value, assuming that earthquakes10
coming closer to the surface and/or occurring in a larger range of depths11
may indicate an upward migration of magma or a coalescence of small12
fractures that may facilitate the magma uprising. At the same time, we do13
not consider shallow earthquakes concentrated in a very small range of14
depths to be indicative of magma, as they could also be due to15
hydrothermal activity16
- T {>;98;105 °C} the temperature of the fumaroles inside the crater; the17
thresholds are chosen as for node 1.18
Remarkably, we assume that the parameters ΠSO2 and T have a weight19
twice as much as the other parameters in determining a magmatic origin20
for the unrest.21
Neither here past monitoring is available. Thus, the posterior for [θ2(M)] is22
equal to the prior.23
24
46
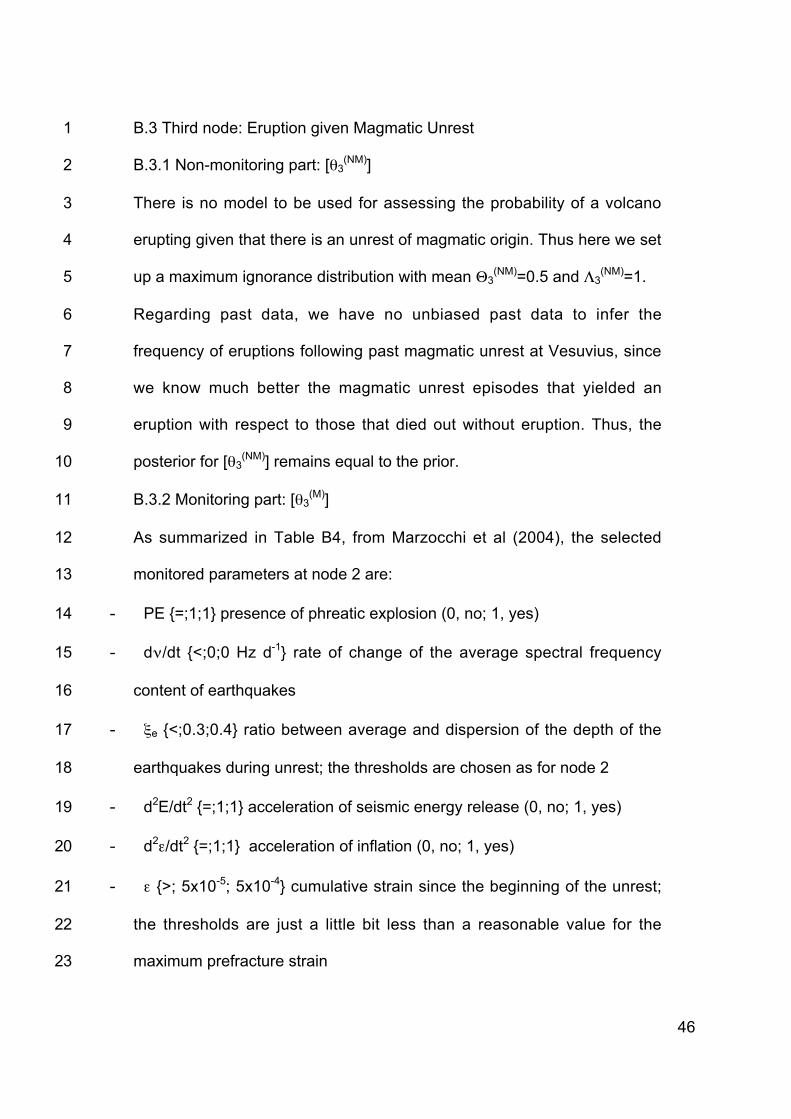
B.3 Third node: Eruption given Magmatic Unrest1
B.3.1 Non-monitoring part: [θ3(NM)]2
There is no model to be used for assessing the probability of a volcano3
erupting given that there is an unrest of magmatic origin. Thus here we set4
up a maximum ignorance distribution with mean Θ3(NM)=0.5 and Λ3
(NM)=1.5
Regarding past data, we have no unbiased past data to infer the6
frequency of eruptions following past magmatic unrest at Vesuvius, since7
we know much better the magmatic unrest episodes that yielded an8
eruption with respect to those that died out without eruption. Thus, the9
posterior for [θ3(NM)] remains equal to the prior.10
B.3.2 Monitoring part: [θ3(M)]11
As summarized in Table B4, from Marzocchi et al (2004), the selected12
monitored parameters at node 2 are:13
- PE {=;1;1} presence of phreatic explosion (0, no; 1, yes)14
- dν/dt {<;0;0 Hz d-1} rate of change of the average spectral frequency15
content of earthquakes16
- ξe {<;0.3;0.4} ratio between average and dispersion of the depth of the17
earthquakes during unrest; the thresholds are chosen as for node 218
- d2E/dt2 {=;1;1} acceleration of seismic energy release (0, no; 1, yes)19
- d2ε/dt2 {=;1;1} acceleration of inflation (0, no; 1, yes)20
- ε {>; 5x10⁻⁵; 5x10⁻⁴} cumulative strain since the beginning of the unrest;21
the thresholds are just a little bit less than a reasonable value for the22
maximum prefracture strain23
47
- dρ/dt {>;0;0} change of the ratios HCl/SO2 and/or HF/SO21
- REV {=;1;1} sudden reversal of at least one of the above parameters (0,2
no; 1, yes)3
For most of these parameters the thresholds are based on a “yes/no”4
choice. This is because we are mainly interested in the time trend of the5
parameters.6
We assume that the parameters d2ε/dt2 , PE and REV have a weight twice7
as much as the other parameters in determining the occurrence of the8
eruption. Neither here past monitoring is available. Thus, the posterior for9
[θ3(M)] is equal to the prior.10
11
B.4 Forth node: Location of vent given that there is an Eruption12
B.4.1 Non-monitoring part: [θ4(NM)]13
Since Mt. Vesuvius is a central volcano, and its activity has been mainly14
concentrated in the crater, we assume that there is a very high probability15
of vent opening in the crater area, and a very small one outside it. With16
this idea in mind, we divide the volcanic edifice into 5 areas: the crater17
area, and 4 outer, equal sized areas. We assume that next eruption will18
take place in one and only one of them. Because of these assumptions,19
we set up a Dirichlet distribution (see Marzocchi et al, 2008 for further20
details on such distribution) with mean Θ4(NM)(1)=0.99 in the crater area21
(area 1) and Θ 4(NM)(i)=0.0025 (i=2,...5) for the surrounding areas (i.e.,22
Areas 2, 3, 4 and 5). Since we are very confident on this assumption, we23
set Λ4(NM)=50, which is an (arbitrarily) high equivalent number of data.24

48
B.4.2 Monitoring part: [θ4(M)]1
BET allows to localize some or all of the monitored measurements used at2
previous nodes to assess the probability of vent opening in different areas,3
according to monitoring (see Marzocchi et al, 2008 for further details on4
this issue).5
6
B.5 Fifth node: Size of the Eruption given that there is an Eruption7
We parametrize the possible sizes with VEI. Since Mt. Vesuvius has been8
dormant for over 60 years now, it is presumably in a closed conduit9
regime. Therefore, we assume that next eruption will be at least of VEI=310
in order to have sufficient energy to re-open the system. For practical11
purposes, we define three classes of possible sizes, according to this idea:12
VEI=3, VEI=4 and VEI≥5.13
B.5.1 Non-monitoring part: [θ5(NM)]14
We use the observation that the worldwide log(frequency)-size relationship15
for volcanoes is a straight line, implying that the most frequent, and16
therefore likely, eruptions are the smaller, with a power law relationship.17
We translate this information by setting up a Dirichlet distribution for the18
three size classes. The mean of each class is set equal to the probability19
for that class given by the above mentioned worldwide relationship. In this20
way we have the following means: Θ5(NM)(1)=0.83 for VEI=3, Θ5
(NM)(2)=0.1421
for VEI=4 and Θ5(NM)(3)=0.03 for larger eruptions. We also assume the22
maximum variance on this model, thus Λ5(NM)=1.23
49
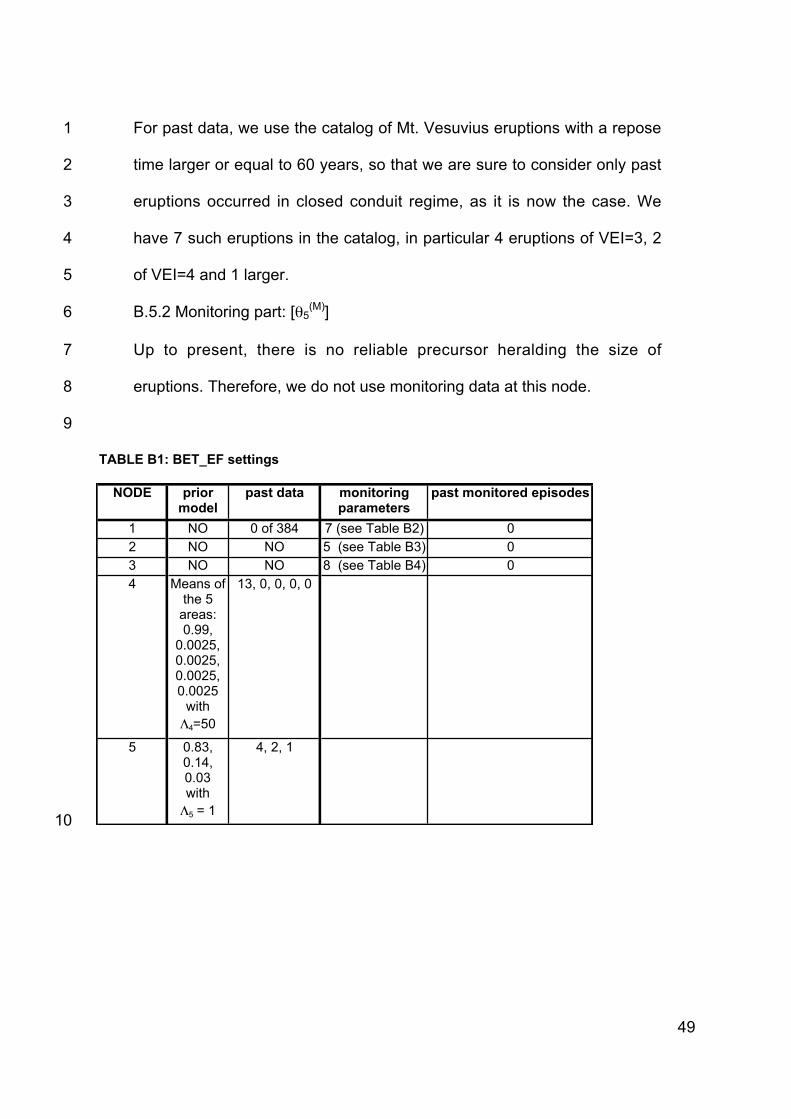
For past data, we use the catalog of Mt. Vesuvius eruptions with a repose1
time larger or equal to 60 years, so that we are sure to consider only past2
eruptions occurred in closed conduit regime, as it is now the case. We3
have 7 such eruptions in the catalog, in particular 4 eruptions of VEI=3, 24
of VEI=4 and 1 larger.5
B.5.2 Monitoring part: [θ5(M)]6
Up to present, there is no reliable precursor heralding the size of7
eruptions. Therefore, we do not use monitoring data at this node.8
9
TABLE B1: BET_EF settings
NODE prior model
past data monitoring parameters
past monitored episodes
1 NO 0 of 384 7 (see Table B2) 02 NO NO 5 (see Table B3) 03 NO NO 8 (see Table B4) 04 Means of
the 5 areas: 0.99,
0.0025, 0.0025, 0.0025, 0.0025
with Λ4=50
13, 0, 0, 0, 0
5 0.83, 0.14, 0.03 with Λ5 = 1
4, 2, 1
10
50
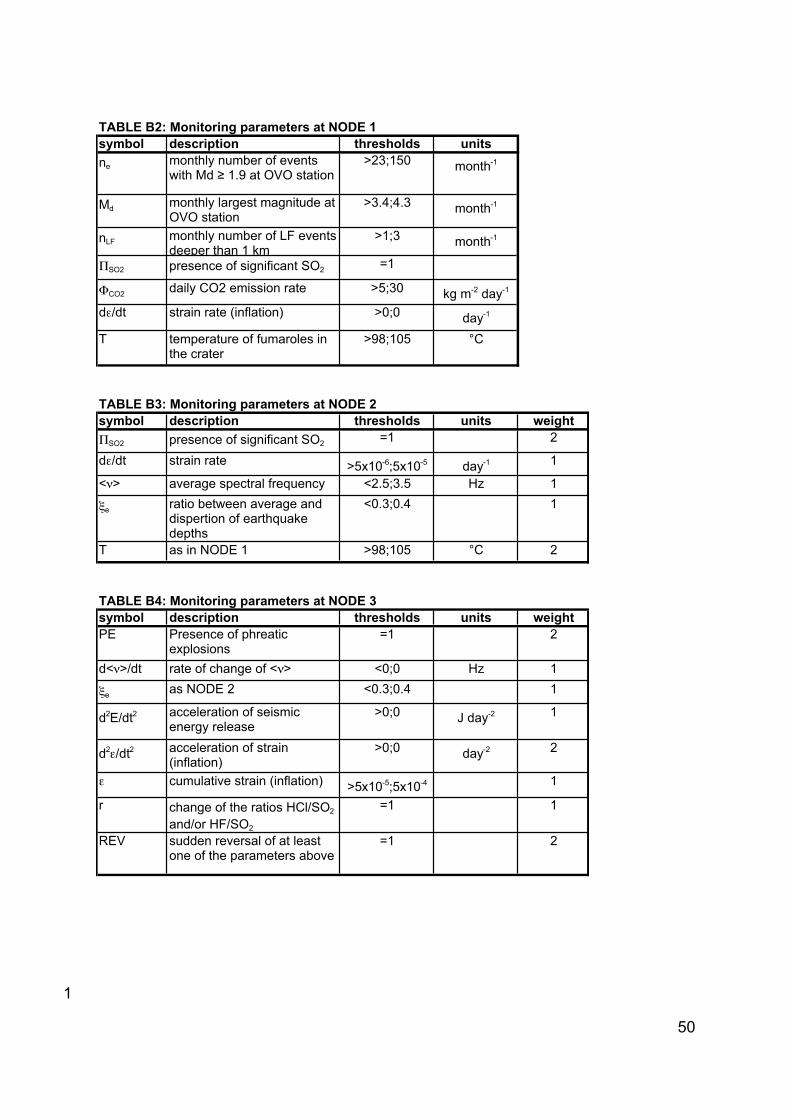
TABLE B2: Monitoring parameters at NODE 1symbol description thresholds unitsne monthly number of events
with Md ≥ 1.9 at OVO station>23;150 month-1
Md monthly largest magnitude at OVO station
>3.4;4.3 month-1
nLF monthly number of LF events deeper than 1 km
>1;3 month-1
ΠSO2 presence of significant SO2 =1
ΦCO2 daily CO2 emission rate >5;30 kg m-2 day-1
dε/dt strain rate (inflation) >0;0 day-1
T temperature of fumaroles in the crater
>98;105 °C
TABLE B3: Monitoring parameters at NODE 2symbol description thresholds units weightΠSO2 presence of significant SO2 =1 2
dε/dt strain rate >5x10⁻⁶;5x10⁻⁵ day-1 1
<ν> average spectral frequency <2.5;3.5 Hz 1
ξe ratio between average and dispertion of earthquake depths
<0.3;0.4 1
T as in NODE 1 >98;105 °C 2
TABLE B4: Monitoring parameters at NODE 3symbol description thresholds units weightPE Presence of phreatic
explosions=1 2
d<ν>/dt rate of change of <ν> <0;0 Hz 1
ξe as NODE 2 <0.3;0.4 1
d2E/dt2 acceleration of seismic energy release
>0;0 J day-2 1
d2ε/dt2 acceleration of strain (inflation)
>0;0 day-2 2
ε cumulative strain (inflation) >5x10⁻⁵;5x10⁻⁴ 1
r change of the ratios HCl/SO2
and/or HF/SO2
=1 1
REV sudden reversal of at least one of the parameters above
=1 2
1