veterinary immunology and immunopathologyhonavar/papers/tuggle2010.pdf · veterinary immunology and...
TRANSCRIPT

R
Mr
CYa
b
c
d
a
KPTISM
1
myilihaS
HT
0d
Veterinary Immunology and Immunopathology 138 (2010) 280–291
Contents lists available at ScienceDirect
Veterinary Immunology and Immunopathology
journa l homepage: www.e lsev ier .com/ locate /vet imm
esearch paper
ethods for transcriptomic analyses of the porcine host immuneesponse: Application to Salmonella infection using microarrays
.K. Tugglea,∗, S.M.D. Bearsonb, J.J. Uthea, T.H. Huanga, O.P. Couturea,
.F. Wanga, D. Kuharc, J.K. Lunneyc, V. Honavard
Department of Animal Science, and Center for Integrated Animal Genomics, 2255 Kildee Hall, Iowa State University, Ames, IA, United StatesNational Animal Disease Center, USDA-ARS, 2300 Dayton Road, Ames, IA, United StatesAnimal Parasitic Diseases Laboratory, ANRI, USDA-ARS, Beltsville, MD, United StatesDepartment of Computer Science, 226 Atanasoff Hall, Iowa State University, Ames, IA, United States
r t i c l e i n f o
eywords:orcineranscript profilingmmune responsealmonellaicroarray
a b s t r a c t
Technological developments in both the collection and analysis of molecular genetic dataover the past few years have provided new opportunities for an improved understandingof the global response to pathogen exposure. Such developments are particularly dramaticfor scientists studying the pig, where tools to measure the expression of tens of thousandsof transcripts, as well as unprecedented data on the porcine genome sequence, have com-bined to expand our abilities to elucidate the porcine immune system. In this review, wedescribe these recent developments in the context of our work using primarily microar-rays to explore gene expression changes during infection of pigs by Salmonella. Thus while
the focus is not a comprehensive review of all possible approaches, we provide links andinformation on both the tools we use as well as alternatives commonly available for tran-scriptomic data collection and analysis of porcine immune responses. Through this review,we expect readers will gain an appreciation for the necessary steps to plan, conduct, ana-lyze and interpret the data from transcriptomic analyses directly applicable to their research interests.. Introduction
Host-pathogen interactions have been studied at theolecular, cellular, tissue and organismal levels for many
ears (see, for example, the set of reviews in Current Opin-on in Immunology, 2007, Vol. 19). At the transcriptomicevel, a meta-analysis of microarray data detecting the
mmune response to many types of pathogens in differentuman cell types has shown that a core set of ∼500 genesre expressed in response to viruses, bacteria (includingalmonella) and immune stimulants such as LPS (Jenner∗ Corresponding author at: Department of Animal Science, 2255 Kildeeall, Iowa State University, Ames, IA 50010, United States.el.: +1 515 294 4252; fax: +1 515 294 2401.
E-mail address: [email protected] (C.K. Tuggle).
165-2427/$ – see front matter © 2010 Elsevier B.V. All rights reserved.oi:10.1016/j.vetimm.2010.10.006
© 2010 Elsevier B.V. All rights reserved.
and Young, 2005). Because of the ubiquity and abilityof Salmonella spp. to infect many important vertebratespecies, both animal models (Santos et al., 2001; van derSar et al., 2003) and cell culture systems (see below) havebeen used to understand Salmonella interactions with itshost. Early immune responses are thought to be critical inresistance to Salmonella (Wick, 2004), and a large num-ber of genes have been implicated in the host responseto Salmonella (Detweiler et al., 2001; Rodenburg et al.,2007). Many studies have used lipopolysaccaride (LPS) asa model of the transcriptomic response to bacteria (Wells
et al., 2003; Bliss et al., 2005; Wurfel et al., 2005; Becket al., 2006). A direct comparison of the transcriptomicresponse to LPS versus Salmonella showed significant sim-ilarity in both the genes responding and the magnitude ofthe response (Rosenberger et al., 2000).
gy and I
C.K. Tuggle et al. / Veterinary ImmunoloThe cytokine protein and RNA responses to Salmonellahave also been studied in the pig; most parameters andgenes involved appear to be very similar to those in mouse(Dvorak et al., 2006). Initial interactions of Salmonella withthe gut tissue have been studied in cell culture (Veldhuizenet al., 2006; Skjolaas et al., 2007), but also in explants ofPeyer’s patch tissue (Hyland et al., 2006). In the latter study,IL1B and IL8 RNA (but not TNF) were found to increase afterexposure to Salmonella enterica serovar Choleraesuis (SC)for 2 h. In IPEC-J2 cells, an in vitro model of porcine jejunalintestine, S. enterica serovar Typhimurium (ST) exposurefor 1.5 h increased RNA for TNF, IL8 and CCL20, but induc-tion of these cytokines was not observed in cells exposed toSC (Skjolaas et al., 2007). Using a separate porcine epithelialcell line, exposure to ST for 24 h induced RNA expressionfor the beta-defensin gene pBD-2 (Veldhuizen et al., 2006).
Immune responses of different types of porcine cells iso-lated from whole blood have also been studied. The in vitroresponse of pig peripheral blood mononuclear cells (PBMC)to Salmonella or mitogen treatment was characterized byincreased IL2, IL4, and IFNG RNA, with no effect on IL10expression, while bacterial F4 fimbrae increased expres-sion of IFNG RNA only (Verfaillie et al., 2001). This groupalso found cytokine protein levels generally correlated wellwith RNA expression for the first 24 h of exposure.
Raymond and Wilkie (2004) investigated porcine T cellresponses to stimulated dendritic cells (DCs), finding thatthe T cell response profile depended on how the DC wasstimulated and the cytokine milieu during stimulation.They also evaluated monocyte and DC responses to specificpathogen-associated molecular pattern (PAMP) molecules.Treatment with LPS induced expression of TLR4 and Thelper 1 (IFNG, IL12p35), T helper 2 (IL13) and regulatory T(IL10) cell response pathways. Cell-specific responses wereobserved for several of these genes; MHC Class II expressionwas greater after LPS stimulation in monocytes whereasB7 RNA increased in both cell types (Raymond and Wilkie,2005). In CD14+ cells isolated from pig spleen, LPS pre-treatment was shown to decrease TNF and IL8, but not IL1B.However, gene expression in response to re-application ofLPS indicated that pig monocytes undergo a similar LPS tol-erance response (Cagiola et al., 2006) to that reported formurine macrophages.
The RNA response of several Toll-like receptor andchemoattractant genes to S. enterica serovar Choleraesuis(SC) and S. Typhimurium (ST)inoculationof pigs has beenreported for a number of tissues (Burkey et al., 2007; Wanget al., 2007, 2008b). Relative to uninfected controls, quan-titative real-time PCR (QPCR) analysis showed ST infectiongreatly increased IL8 expression in MLN and decreasedexpression of MIF RNA in colon, while in SC infected ani-mals, TLR9 and MIF were decreased in colon and MIF andOPN were decreased in MLN (Burkey et al., 2007). Globaltranscriptional responses to pathogenic infections in thepig have been reported using microarrays (Afonso et al.,2004; Ledger et al., 2004; Li et al., 2004; Miller and Fox,
2004; Moser et al., 2004; Niewold et al., 2005; Zhao et al.,2006; Uthe et al., 2006; Uthe et al., 2007; Wang et al., 2007,2008b; Tuggle et al., 2008) and multiple-gene and largerscale QPCR methods (Raymond and Wilkie, 2004; Baltesand Gerlach, 2004; Royaee et al., 2004; Dawson et al., 2005).mmunopathology 138 (2010) 280–291 281
These studies (reviewed in Tuggle et al., 2007) have begunto identify immune genes involved in the host’s responseto different pathogen infections. Taken together they havecontributed to a better understanding of molecular path-ways relating to health and disease in pigs.
This review centers on our approaches to use suchtranscriptomic data to unravel important pathways con-trolling the porcine response to Salmonella. We will notdiscuss recent publications on the host transcriptomicresponse to viruses (Bates et al., 2008; Flori et al., 2008a,b;Durand et al., 2009; Fernandes et al., 2009; Shi et al.,2009; Li et al., 2010; Tomas et al., 2010), to mycobacteria(Galindo et al., 2009), to Actinobacillus pleuropneumoniae(Hedegaard et al., 2007; Moser et al., 2008), or to Toxo-plasma gondii (Okomo-Adhiambo et al., 2006) infections orto non-infectious stimuli or other contrasts (Dvorak et al.,2006; Chowdhury et al., 2007; Nino-Soto et al., 2008a,b;Ponsuksili et al., 2008; Wang et al., 2008a). However, theseauthors used similar approaches to the broadly applica-ble methods discussed below. We will also not describemethods to measure miRNAs in tissues of immunologi-cal importance, although recent reports have identifiedmiRNAs that are important in the immune response inother species (Pedersen and David, 2008; Bi et al., 2009). Anumber of reports have described miRNA identification inseveral porcine tissues focusing on reproduction or muscledevelopment, although single papers have described isola-tion of swine miRNAs from intestine (Sharbati et al., 2010),or miRNAs potentially interacting with swine influenzavirus (He et al., 2009).
2. Steps in producing and exploring transcriptomicdata on immune response
2.1. Experimental design and tool choice—what questiondo you want to ask?
The most important first step in transcriptomic anal-yses (and in all experiments in fact) is to determine thequestion to address. In many transcriptome studies, thequestion is broadly exploratory, along the lines of “whatare the genes and pathways that respond to the pathogenof interest in this tissue or cell type?” If so, then tools andprocesses that capture accurate and sensitive informationon the largest numbers of transcripts for the lowest costare optimal. Because of the lack of available space and com-plexity of these decisions for each lab, we cannot describeall possibilities but will briefly review the main choices fortechnologies in this area.
While we focus on the use of microarray technology tocollect transcriptomic data in this review, it is by far not theonly method, and other technologies such as DifferentialDisplay (DD), Suppression Subtractive Hybridization (SSH),and Serial Analysis of Gene Expression (SAGE) have beenused to identify differentially expressed (DE) genes duringthe immune response in pigs (Tuggle et al., 2007 and ref-
erences therein). These latter technologies, especially DDand SSH, require significant wet lab analyses, as many dif-ferent combination of primers are required to survey thetranscriptome significantly. The popularity of microarraysis due primarily for their breadth of coverage and relative
2 gy and I
seaidswsa
sltupGlfhi“eoaarThatiabcrtaccswIdprfs2totpS
2
a(Tm
82 C.K. Tuggle et al. / Veterinary Immunolo
ensitivity and simplicity over these other methods to gen-rate global RNA profiles. More recent technologies suchs RNA Seq (Wang et al., 2009) have not yet been reportedn porcine immunogenomics, but a number of groups areeveloping such data. It is anticipated that RNA-Seq andimilar methods based on the new sequencing technologiesill replace microarrays in the future, especially for initial
creening experiments, due to their anticipated lower costnd broader representation of the transcriptome.
In pigs, there are several options for collecting tran-criptomic data and the best approach depends on theevel of molecular and bioinformatic expertise available tohe lab. If such expertise is minimal, then data collectionsing a fee-for-service approach is probably most appro-riate. One such option is the use of the Affymetrix PorcineeneChip®, which requires only RNA preparation in one’s
aboratory; the RNA is then provided to a dedicated serviceacility which many universities and research institutesave available. Expression data is provided by the Facil-
ty ready for statistical analysis as described below. If morewet-lab” expertise is available, data collection can be lessxpensive, especially for a large project, through the usef custom oligonucleotide arrays in one’s laboratory. cDNArrays have been replaced by such oligonucleotide arrays,s synthesis costs have dropped significantly and algo-ithms to minimize cross-hybridization have improved.hus two major issues with cDNA arrays, the need forighly accurate clone and PCR product tracking duringrray production, and the concern of cross-hybridizationo common domains within multiple cDNAs, are signif-cantly diminished for oligonucleotide arrays, which canlso be created for less expense, at least on a per arrayasis, than purchased arrays. However, in any such costomparison it is important to consider the labor and mate-ials costs not only on the array production but also thearget labeling, hybridization and data acquisition, so thatll costs are recognized during the decision-making pro-ess. Finally, there are hybrid approaches, where severalompanies sell arrays for use in individual laboratories orelected universities print arrays for use in labs nation-ide, as is done for several of the swine long oligo arrays.
n pigs, sets of long (70-mer) oligonucleotides have beenesigned and validated for transcriptomics research in theast few years (Zhao et al., 2005; Steibel et al., 2009). Mostecently, an oligonucleotide array, the Pigoligoarray, withunctional annotation for 16,225 of the 18,524 porcine-pecific oligonucleotides has been evaluated (Steibel et al.,009). For the 4 tissues examined, the array was foundo be useful for accurate measurement of gene expressionn a global scale. In the work described below, we usedhe Porcine GeneChip®, from Affymetrix, which has 23,937robe sets with a total of 19,253 annotations currently (seeection 2.3; Couture et al., 2009).
.2. Statistical analysis of microarray data
There are many excellent reviews of the variouspproaches to statistical analysis of microarray dataQuackenbush, 2001; Quackenbush, 2002; Roberts, 2008).he MicroArray Quality Control (MAQC) project reviewedajor aspects of microarray data analysis in a special issue
mmunopathology 138 (2010) 280–291
of Nature Biotechnology (MAQC Consortium, 2006). Thefollowing is only a short general synopsis of this topic andfocuses on our specific approaches to assess expressionresponse using transcriptomics. We do want to emphasizethat any experimental design should incorporate as muchbiological replication as possible, while eliminating techni-cal replication that had been thought to be important earlyin the field but is no longer deemed important for microar-ray analysis. The earliest statistical analysesof microarraysdepended on the experimental design of comparing twodifferently labeled (Cy3, Cy5) samples hybridized to thesame array, thus many aspects of the technique that leadto nuisance variation are diminished (Schena et al., 1995).Such work compared levels of Cy3 and Cy5 expression,setting an ad hoc x-fold difference in expression as the cri-teria for declaring a gene as differentially expressed (DE).In many experiments the design was a comparison of testsamples to the same control sample (the reference design).
However, an analytical approach based only on a foldchange filter is simplistic and an insensitive method to findall differential expression. Experimental designs and dataanalyses have become statistically more rigorous; detailscan be found in the reviews listed above. In the work below,we describe our analysis of Affymetrix-based data forwhich company-provided software is used to produce anestimate of expression for the transcript in question. First,a unique Affymetrix algorithm combines the hybridizationsignals for a set of probes to estimate the signal for eachtranscript. The signal for each probeset across the Genechipis normalized. Data normalization is a significant field inits own right, and the type of normalization used dependson the specifics of the microarray technology as well asthe kinds of questions to be answered (Quackenbush,2002). Here we summarize normalization, carried outin the following experiments, as the method to adjustraw individual hybridization signals within a microar-ray experiment so that results across biological replicatescan be combined. Such normalizations often involve anadjustment based on the overall level of hybridizationacross the microarray, although many refinements includ-ing local background measurements and other methodscan be applied (Quackenbush, 2002). An ANOVA modelis then used to compare responses across time points ortreatments. As this method performs many thousands ofstatistical significance tests at the same time, it is impor-tant to correct for such multiple testing by estimating thefalse discovery rate (FDR) (Storey and Tibshirani, 2003). TheFDR q-value provides an estimate of the likelihood that themembers of a list of differentially expressed are incorrectlypredicted to be DE; commonly used q-values are 0.01–0.1,which indicate that no more than 1–10% of the genes arefalse discoveries; i.e., the higher the q value the more likelythe gene is NOT differentially expressed.
2.3. Bioinformatics analysis of microarray data
2.3.1. Microarray element annotationOnce the genes that differentially respond to infection,
treatments, or other variables, have been identified, we canproceed to explore specific biological questions of inter-est. As shown in Fig. 1, several immediate analyses can

C.K. Tuggle et al. / Veterinary Immunology and Immunopathology 138 (2010) 280–291 283
view o
Fig. 1. Overview of transcriptomic/bioinformatics analyses. A schematictranscriptomic data. See text in Sections 2.3.1–2.3.7 for details.be envisioned. Because all these studies focus on pig geneexpression, it is important to remember that most of theavailable tools rely on the transfer of gene function or anno-tations to the array elements in the target species (in ourcase, pig) from closely related and more widely studiedspecies, e.g., human or mouse, through sequence compar-ison. If it is found that a pig sequence is sufficiently similarto an annotated gene sequence in another species, com-parative analysis can be used to predict the identity andfunction(s) of the porcine transcript based on the anno-tations associated with the matching sequences in otherspecies. Thus, it is critical to obtain the most up to date andcomprehensive annotation of the gene sequences on themicroarray.
We have recently assembled all available cDNAsequences to create an Iowa Porcine Assembly (IPA)which is a set of ∼140,000 consensus porcine sequencesand ∼105,000 singletons for all known pig mRNAs(Fig. 2; Couture et al., 2009). We have annotated thesesequences using sequence similarity of the porcine con-sensus sequence to those annotations reported for human,mouse, rat, and bovine sequences in GenBank. These IPAsequences were then used to annotate the AffymetrixGenechip sequence elements; this resulted in excellent
annotation coverage (∼80%) of the Affymetrix elements.We are now applying our IPA annotation to the Pigoligoar-ray evaluated by Steibel and colleagues so that informationin the future can be more easily integrated across plat-forms (Couture et al., unpublished data). These annotationsf approaches our collaborative group has developed to analyze porcine
will be updated when the draft porcine genome sequenceis released, which is expected in late 2010. These annota-tions are available at www.anexdb.org, where a downloadfile provides up-to-date annotations of the major expres-sion platforms for the pig. In addition, the AnexDB.orgwebsite has been organized to assist in transcriptomeanalyses; we have created data storage, analysis and GEOsubmission tools (Fig. 2). This includes tools to store thenumerical data as well as sample preparation, hybridiza-tion protocols and data collection details. Such data canbe kept completely private in the database until publi-cation. Most journals now require that all publicationsreporting microarray data must make available the Min-imal Information About a Microarray Experiment (MIAME)information. At AnexDB.org, we provide tools that auto-mate much of this analysis pipeline, including generationof the correctly formatted ‘soft’ file containing all MIAMEinformation required for NCBI-GEO submission of microar-ray data.
2.3.2. Embedding the microarray results into currentliterature
A first step for transcriptomic experiments is to com-pare the list of DE genes with the current literature. This
primary step can help integrate the microarray data withknown responses at porcine immune response genes. Thiscan be done by individually checking genes for availablefunctional investigations by other groups in PubMed. Usingannotation information for the gene symbol of the tran-
284 C.K. Tuggle et al. / Veterinary Immunology and Immunopathology 138 (2010) 280–291
F and daS rce.
sgihaEuh(gMt(statvgim
2O
rlgoar
ig. 2. Schematic diagram of the major parts of the ANEXdb.org websiteection 2.3.1 for details on the main functions of this bioinformatic resou
cript of interest, a researcher can easily access relevantenome, cDNA and functional information that has beenntegrated at a number of databases. The most compre-ensive of these genome browsers are those availablet the NCBI web portal (www.ncbi.nlm.nih.gov) and theMBL web portal (www.ensembl.org/index.html). Partic-larly for the porcine genomics community, the latter siteas excellent resources for the analysis of the pig genomesee http://www.ensembl.org/Sus scrofa/Info/Index). Ourroup has found the Online Mendelian Inheritance inan (OMIM) database (www.ncbi.nlm.nih.gov/OMIM) and
he Online Mendelian Inheritance in Animals (OMIA)www.ncbi.nlm.nih.gov/omia) to be especially useful as atarting point to learn about specific genes. OMIM con-ains extensive information on the structure, function,nd phenotypes of known mutations in human genes andheir counterparts in model organisms. However, the realalue of microarray analyses is the power of measuringene expression of so many genes that the responses ofmportant pathways and networks can be recognized and
easured, as described below.
.3.3. Function clustering and analysis using Genentology and other gene annotation databases
Once individual genes in a list of differentiallyesponsive transcripts have been compared to available
iterature, a new type of exploratory analysis of theseenes can be performed. An important question to askf the data is: are there known functions or otherttributes—annotations—for genes in this list that are over-epresented compared to a background list of genes? Intabase for porcine transcriptomic data storage and analysis. See text in
other words, what are the enriched biological ‘signatures’or ‘clues’ hidden in this list that can help one understandthe immune response represented by the list? The mostwidely used set of annotations are those provided by theGene Ontology (GO) Consortium, which applies a set ofdescriptive terms from a defined vocabulary to genes forwhich some functional data is available. Terms coveringthree descriptive areas are available: Biological Process,Molecular Function, and Cellular Component.
To determine all annotations for a set of genes,there are a number of software tools that are avail-able. These are proprietary packages (such as Ingenuityor GeneSpring), software available as downloadable localprograms (such as GoMiner; http://discover.nci.nih.gov/gominer/index.jsp), as well as free web-based tools, suchas the Database for Annotation, Visualization and Inte-grated Discovery (DAVID) created by NIAID scientists(http://david.abcc.ncifcrf.gov/) (Dennis et al., 2003). WhileDAVID provides a number of different analytical tools, wehave primarily used DAVID to annotate lists of genes inwhole blood responding to Salmonella infection (Huang etal., manuscript in preparation) as well as a number of ourother projects (Lkhagvadorj et al., 2009; Lkhagvadorj et al.,2010). In the DAVID on-line tool, one uploads a list of genesto analyze as well as a background gene list. The DAVID toolcan calculate the frequency of GO terms associated with
all genes in the uploaded list, and calculates those termsthat are over-represented relative to the background. Over-representation of other gene annotations, such as KEGGpathways, Protein Information Resource (PIR) information,etc., can also be calculated depending on user specifi-
gy and I
C.K. Tuggle et al. / Veterinary Immunolocations; a recent detailed description of current DAVIDfunctionality is available (Huang da et al., 2009). We havealso developed our own specific list of GO terms related tospecific immune pathways and functions (a GO-Slim) byusing OBO-edit and used it to develop a better understand-ing of the immune-response specific pathways in genelists responsive to Salmonella infections (Wang et al., 2007,2008b).
A comment on the selection of the ‘background’ listof genes is warranted. The default for this list in DAVIDis the human genome; this may be inappropriate for anyporcine gene list, but especially for those lists created frommicroarray platforms for which there is either incompletegenome coverage or non-random selection of elementsrepresenting transcripts on the array. The modified Fisher’sExact test calculations used by DAVID to determine over-representation—finding a higher frequency of terms in aspecified list as compared to the background—depends onthe assumption that the background is a set of genes thathas a chance to be included in the differentially expressedlist. For example, if many genes with a specific term suchas “immune response” are present at 10% in a list of genesresponding to LPS in macrophage cells, but present at muchlower levels in a list of all human genes, this would bereturned as an over-represented term. However, it is likelythat many of the genes in a human genome backgroundlist, contributing to the overall frequencies of GO terms inthat list, were not expressed in immune cells and couldnot be in the DE list. Thus it is more appropriate to usethe largest set of genes that could have been in the DElist: the transcriptome for the tissue or cell type understudy. Therefore we define our transcriptome, and thus ourbackground list, as all those genes that show at least onehybridization signal above background across our entire setof Affymetrix chips for the tissue of interest. By using GOenrichment approaches such as these, we have shown thatannotations for genes up-regulated in mesenteric lymphnode from animals infected with SC are enriched in apopto-sis, innate immune response and defense response terms,while annotations for down-regulated genes in these tis-sues are enriched in cell adhesion and calcium ion bindingterms (Wang et al., 2008b).
2.3.4. Expression clustering to find genes with similartranscriptomic response to infection or stimulus
Depending on the type of experiment, a second valu-able global analysis approach is to identify groups of genesthat respond similarly to infection or immune stimulationat the RNA expression level. Several methods are availableto ‘cluster’ genes by expression pattern across experimen-tal samples. Such clustering methods (Belacel et al., 2006)can be broadly classified into (a) hierarchical methods ormodel based methods e.g., probabilistic mixture models(Medvedovic and Sivaganesan, 2002), and (b) model-freemethods e.g., spectral clustering (von Luxburg, 2007). Ineach of these categories, clustering algorithms can gener-
ate different types of clusters e.g., non-overlapping clustersof data points or hierarchical organization of clusters. Eachclass of methods has its own advantages and disadvantages,requiring care in the choice of specific methods in specificsettings (Belacel et al., 2006); we have primarily relied onmmunopathology 138 (2010) 280–291 285
hierarchical clustering, which work well for time coursedata such as response after infection. Clustering techniquescan be particularly powerful for a time course experiment,as not only can expression pattern gene clusters be iden-tified, but inferences can be made as to cause and effectduring the immune response. Further, combining expres-sion clustering with GO annotation of specific clusters canbe very illustrative. One can find enriched functions thatmay identify specific pathways activated (or repressed) atspecific times, allowing inference of multi-stage gene-geneinteractions. For example, a seminal paper in the use ofsystems biology tools in immunology showed that expres-sion clustering could identify murine regulatory pathwayscontrolling the response to LPS (Gilchrist et al., 2006). Thisgroup showed that specific transcription factors (TF) in acluster of up-regulated genes early in LPS treatment ofmouse macrophage cells in culture controlled the expres-sion of other sets of genes that clustered together with amaximal response later than the TF-dominated early clus-ter.
We have used GeneCluster software to identify sets ofgenes and their functions responding similarly to infectionin mesenteric lymph nodes of SC inoculated pigs (Wang etal., 2008b). As illustrated in Fig. 3 using TreeView software,we detect large clusters of genes down-regulated (GroupsA–B) or up-regulated (Groups C–F) at one or more timepoints during infection. Group A genes, down-regulatedfor the first 24 h post infection, are over-represented forribosomal annotations, while Group B genes, only down-regulated by 48 h, are enriched for extracellular matrixproteins (Fig. 3).
2.3.5. Using promoter sequences of co-expressed genes tofind common regulatory motifs
Genes with a similar response to an immune stim-ulus are co-expressed, and may be co-regulated; i.e.,there may be a common regulatory factor controlling thisco-expression response. To look for evidence of a com-mon regulatory factor controlling multiple genes in a list,one approach is to search in the promoter DNA of suchgenes for over-represented sequence motifs known tomediate TF action. At the time of writing, the porcinegenome community was close to completion of a fulldraft sequence for the pig, but the location of promot-ers near porcine genes has not yet been established.Due to lack of knowledge of promoter sequences forthe pig, we developed perl scripts to obtain the orthol-ogous human promoter sequences for porcine genesshown to be differentially up-regulated due to SC infec-tion. Within these human promoters, we searched forTF motifs using the TransFac database (http://www.gene-regulation.com/pub/databases.html), as well as both TFMExplorer (Defrance and Touzet, 2006) and Clover (Frithet al., 2004) packages to determine over-abundance ofmotifs in the Group E set of genes (Fig. 3) that were up-regulated by 8–24 h post-inoculation (Wang et al., 2008b).
We identified 95% of known NFkB-regulated genes in theGroup E gene list, as well as 51 genes that have not pre-viously been shown to be bound by NFkB. Similar resultswith slightly lower percentages were obtained for a set ofgenesup-regulated only by 48 hpi. These porcine genes that
286 C.K. Tuggle et al. / Veterinary Immunology and Immunopathology 138 (2010) 280–291
F erns tobA
w(tpra
2e
atcaidoasmaestamPliians
ig. 3. An example of using hierarchical clustering of gene expression patty such gene clusters.dapted from Wang et al. (2008b).
ere co-expressed with many known NFkB target genesactivated early in infection) and with NFkB motifs nearheir orthologous human promoters are proposed to bereviously unrecognized members of an NFkB-dependentegulatory pathway responding to SC infection (Wang etl., 2008b).
.3.6. Using ‘Knowledgebase’ text-mining tools tofficiently mine the available literature.
Once you have a list of genes that have some commonttribute such as a co-expression pattern or common func-ion, searching the voluminous primary literature to findommonalities among gene list members is of interest butn extremely time-consuming task. We have found valuen using a text-mining software tool, such as Pathway Stu-io (Ariadne Genomics, Inc.), which accelerates the processf such literature searches, and can provide new insights well. This software accepts a list of genes/proteins andearches a proprietary database that holds published infor-ation on relationships between genes, between proteins,
s well as gene-protein, small-molecule-gene interactions,tc. It is possible to select a specific type of relationship toearch for, such as “direct-regulator of”, and specify onlyhose genes/proteins that regulate two or more genes inlist. This would be an example of a search for a “com-on regulator” of the genes in the list. We recently used
athway Studio to find the known targets of the NFkB regu-atory complex in a list of genes up-regulated by SC early in
nfection (8–48 h post infection: Wang et al., 2008b). Thisnformation was then used to inform further exploratorynalyses such as those described above for gene regulatoryetworks. While we could have found such information byearching many published articles, the software was able tofind co-expressed clusters of genes and the general functions represented
dramatically cut down the time required for such searches,while providing a level of comprehensiveness and a repeat-able methodology to the search. A number of other PathwayStudiorelationship filters, such as “common target” (to lookfor common functions of the gene list), or relationshipswithin the gene list (to look at molecular or regulatoryinteractions among list members) are available. Further-more, the software can create publication-quality figuresdepicting such relationships (Wang et al., 2008b).
2.3.7. Immune network analysis in silico—towardsystems understanding of immune response
A higher level analysis that can integrate several ofthe above datasets is systems biology (Klipp et al., 2005;Bruggeman and Westerhoff, 2007; Gardy et al., 2009). Forexample, using a network analysis approach, an immunol-ogist could use visualization tools such as those availablein Cytoscape (www.cytoscape.org/) or InnateDB (Lynn etal., 2008; www.innatedb.org), to take datasets from manygene expression experiments and, combined with otherdata such as protein-protein interaction data, use corre-lations among datasets to draw network diagrams thatillustrate the connections between genes (Gardy et al.,2009; Zak and Aderem, 2009). A network diagram, wheregenes are the nodes and the relationship between anytwo genes are the edges drawn between those nodes, canhelp visualize important genes in the immune process;such important genes may have much higher number of
connections than on average and are called “hubs” in thenetwork. As well, networks are often drawn such that theedge lengths are related to the correlation values used tocreate the network; for example, two genes with very sim-ilar patterns of expression across many treatments would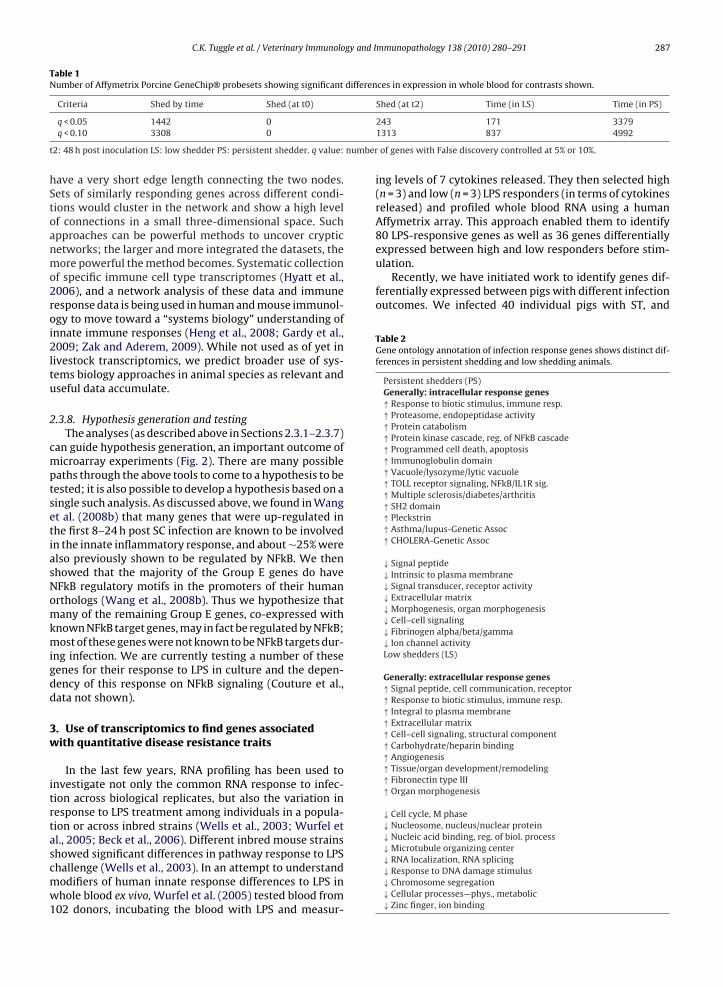
C.K. Tuggle et al. / Veterinary Immunology and Immunopathology 138 (2010) 280–291 287
Table 1Number of Affymetrix Porcine GeneChip® probesets showing significant differences in expression in whole blood for contrasts shown.
Criteria Shed by time Shed (at t0) Shed (at t2) Time (in LS) Time (in PS)
number
ulation.Recently, we have initiated work to identify genes dif-
ferentially expressed between pigs with different infectionoutcomes. We infected 40 individual pigs with ST, and
Table 2Gene ontology annotation of infection response genes shows distinct dif-ferences in persistent shedding and low shedding animals.
Persistent shedders (PS)Generally: intracellular response genes↑ Response to biotic stimulus, immune resp.↑ Proteasome, endopeptidase activity↑ Protein catabolism↑ Protein kinase cascade, reg. of NFkB cascade↑ Programmed cell death, apoptosis↑ Immunoglobulin domain↑ Vacuole/lysozyme/lytic vacuole↑ TOLL receptor signaling, NFkB/IL1R sig.↑ Multiple sclerosis/diabetes/arthritis↑ SH2 domain↑ Pleckstrin↑ Asthma/lupus-Genetic Assoc↑ CHOLERA-Genetic Assoc
↓ Signal peptide↓ Intrinsic to plasma membrane↓ Signal transducer, receptor activity↓ Extracellular matrix↓ Morphogenesis, organ morphogenesis↓ Cell–cell signaling↓ Fibrinogen alpha/beta/gamma↓ Ion channel activityLow shedders (LS)
Generally: extracellular response genes↑ Signal peptide, cell communication, receptor↑ Response to biotic stimulus, immune resp.↑ Integral to plasma membrane↑ Extracellular matrix↑ Cell–cell signaling, structural component↑ Carbohydrate/heparin binding↑ Angiogenesis↑ Tissue/organ development/remodeling↑ Fibronectin type III↑ Organ morphogenesis
↓ Cell cycle, M phase↓ Nucleosome, nucleus/nuclear protein↓ Nucleic acid binding, reg. of biol. process
q < 0.05 1442 0q < 0.10 3308 0
t2: 48 h post inoculation LS: low shedder PS: persistent shedder. q value:
have a very short edge length connecting the two nodes.Sets of similarly responding genes across different condi-tions would cluster in the network and show a high levelof connections in a small three-dimensional space. Suchapproaches can be powerful methods to uncover crypticnetworks; the larger and more integrated the datasets, themore powerful the method becomes. Systematic collectionof specific immune cell type transcriptomes (Hyatt et al.,2006), and a network analysis of these data and immuneresponse data is being used in human and mouse immunol-ogy to move toward a “systems biology” understanding ofinnate immune responses (Heng et al., 2008; Gardy et al.,2009; Zak and Aderem, 2009). While not used as of yet inlivestock transcriptomics, we predict broader use of sys-tems biology approaches in animal species as relevant anduseful data accumulate.
2.3.8. Hypothesis generation and testingThe analyses (as described above in Sections 2.3.1–2.3.7)
can guide hypothesis generation, an important outcome ofmicroarray experiments (Fig. 2). There are many possiblepaths through the above tools to come to a hypothesis to betested; it is also possible to develop a hypothesis based on asingle such analysis. As discussed above, we found in Wanget al. (2008b) that many genes that were up-regulated inthe first 8–24 h post SC infection are known to be involvedin the innate inflammatory response, and about ∼25% werealso previously shown to be regulated by NFkB. We thenshowed that the majority of the Group E genes do haveNFkB regulatory motifs in the promoters of their humanorthologs (Wang et al., 2008b). Thus we hypothesize thatmany of the remaining Group E genes, co-expressed withknown NFkB target genes, may in fact be regulated by NFkB;most of these genes were not known to be NFkB targets dur-ing infection. We are currently testing a number of thesegenes for their response to LPS in culture and the depen-dency of this response on NFkB signaling (Couture et al.,data not shown).
3. Use of transcriptomics to find genes associatedwith quantitative disease resistance traits
In the last few years, RNA profiling has been used toinvestigate not only the common RNA response to infec-tion across biological replicates, but also the variation inresponse to LPS treatment among individuals in a popula-tion or across inbred strains (Wells et al., 2003; Wurfel etal., 2005; Beck et al., 2006). Different inbred mouse strains
showed significant differences in pathway response to LPSchallenge (Wells et al., 2003). In an attempt to understandmodifiers of human innate response differences to LPS inwhole blood ex vivo, Wurfel et al. (2005) tested blood from102 donors, incubating the blood with LPS and measur-243 171 33791313 837 4992
of genes with False discovery controlled at 5% or 10%.
ing levels of 7 cytokines released. They then selected high(n = 3) and low (n = 3) LPS responders (in terms of cytokinesreleased) and profiled whole blood RNA using a humanAffymetrix array. This approach enabled them to identify80 LPS-responsive genes as well as 36 genes differentiallyexpressed between high and low responders before stim-
↓ Microtubule organizing center↓ RNA localization, RNA splicing↓ Response to DNA damage stimulus↓ Chromosome segregation↓ Cellular processes—phys., metabolic↓ Zinc finger, ion binding

288 C.K. Tuggle et al. / Veterinary Immunology and Immunopathology 138 (2010) 280–291
F to an effo (LS +1.5a n the cls e to Salm
misoot1oampdae(csdufgPtirietr
ig. 4. Genes with significant shed x infection interaction may be clues asf 448) showing high up-regulation response to infection in low sheddersnimals (PS −1.5). The response of such genes to infection is dependent ouch genes may be useful in understanding variation in immune respons
easured numbers of shed bacteria up to 21 days post-noculation (dpi, Uthe et al., 2009). Four pigs showedhedding only up to 7 dpi, with relatively low numbersf bacteria shed (low shedder phenotype, LS). On thether hand, six pigs shed continuously throughout theest period (Persistent Shedder phenotype, PS). In these0 animals, we have profiled using Affymetrix technol-gy the peripheral blood RNA before infection (t0) andt the early inflammatory stage (48 hpi, t2) when all ani-als are shedding bacteria (Huang et al., manuscript in
reparation). Interestingly, we find significant numbers ofifferentially expressed genes in whole blood between LSnd PS animals at t2, and many genes also show differ-ntial expression during infection in both shedding typesTable 1). Less that 5% of these expression differences areorrelated with the numbers of different cell types as mea-ured in complete blood counts (CBCs), indicating thatifferential expression is not due to changes in cell pop-lations (data not shown). To characterize pathways andunctions associated with these phenotypes, we selectedenes up-regulated or down-regulated in either Low orersistent shedders and annotated these genes to iden-ify Gene Ontology functions over- or under-representedn these gene lists (Table 2). This analysis found striking
esults. First, blood from animals with a PS phenotype hasncreased intracellular-oriented responses and decreasedxtracellular-oriented responses (data not shown). Second,he blood of LS phenotype animals had a nearly oppositeesponse; with increased expression of gene annotated inective immune response pathway. For example, nearly 50% of genes (215) are in common with high down-regulated genes in Persistent sheddingass of animal (LS or PS) in which they are present. The global function ofonella.
extracellular signaling pathways (Huang et al., manuscriptin preparation).
Of special interest is the large number of genes thatshow significant shed by time interaction, indicating theresponse to infection (time variable) depends on whichphenotypic class is examined (Table 1). To find thegenes that show high differences between the pheno-type classes, genes with significant shed x time interaction(q-value < 0.1) were sorted by Fold Change (FC) for time(response to infection), separately for LS and for PS ani-mals. Four lists were prepared (FC > +1.5 and FC < −1.5 foreach phenotype) and these lists were examined for over-lap (Fig. 4). While it is expected that genes with significantshed by time interactions would show different expressionbetween classes, the large numbers of genes with oppo-site expression patterns (totaling 348 genes; Fig. 4) clearlyshows that the immune pathways measured in blood arestrikingly different between these two phenotypes. Webelieve that these genes may indicate pathways controllinga more effective immune response to Salmonella infection,as their expression pattern correlates with bacterial loadas measured by fecal shedding, and we plan to carefullystudy these genes for their roles in controlling variation indisease phenotypes during bacterial infection.
4. Summary and future
Clearly the porcine immune response community is juststarting to use the tools of trancriptomics and boinformat-

gy and I
C.K. Tuggle et al. / Veterinary Immunoloics to unravel the intricacies of host-pathogen interactions.If we can look to human and mouse studies as a guide, thereare tremendous advances in store for researchers usingsuch genomic approaches to study and manipulate porcineimmunology and immunogenetics. With the increased useof high-throughput sequencing approaches, researcherswill have access to whole-genome datasets with little tono technological limitations in the biological interpretationof the data. The limitations will be only in the imagina-tions of the scientists to design the optimal experiments totake advantage of these truly extraordinary opportunitiesfor advancing molecular, cellular, and physiological knowl-edge and to turn such knowledge into understanding andpractical application.
Conflict of interest statement
The authors declare there are no conflicts of interestto be disclosed. Funding of several aspects of the workdescribed in this manuscript performed in the authors’laboratories came from the USDA-NRICGP, Iowa StateUniversity Center for Integrated Animal Genomics, USDA-Food Safety Consortium, USDA-ARS, and the National PorkBoard. None of these study sponsors had a role in writingor submission of this manuscript.
References
Afonso, C.L., Piccone, M.E., Zaffuto, K.M., Neilan, J., Kutish, G.F., Lu, Z., Balin-sky, C.A., Gibb, T.R., Bean, T.J., Zsak, L., Rock, D.L., 2004. African swinefever virus multigene family 360 and 530 genes affect host interferonresponse. J. Virol. 78, 1858–1864.
Baltes, N., Gerlach, G.F., 2004. Identification of genes transcribed byActinobacillus pleuropneumoniae in necrotic porcine lung tissue byusing selective capture of transcribed sequences. Infect. Immun. 72,6711–6716.
Bates, J.S., Petry, D.B., Eudy, J., Bough, L., Johnson, R.K., 2008. Differentialexpression in lung and bronchial lymph node of pigs with high andlow responses to infection with porcine reproductive and respiratorysyndrome virus. J. Anim. Sci. 86, 3279–3289.
Beck, G.C., Rafat, N., Brinkkoetter, P., Hanusch, C., Schulte, J., Haak, M.,van Ackern, K., van der Woude, F.J., Yard, B.A., 2006. Heterogeneityin lipopolysaccharide responsiveness of endothelial cells identifiedby gene expression profiling: role of transcription factors. Clin. Exp.Immunol. 143, 523–533.
Belacel, N., Wang, Q., Cuperlovic-Culf, M., 2006. Clustering methods formicroarray gene expression data. OMICS 10, 507–531.
Bi, Y., Liu, G., Yang, R., 2009. MicroRNAs: novel regulators during theimmune response. J. Cell. Physiol. 218, 467–472.
Bliss, T.W., Dohms, J.E., Emara, M.G., Keeler Jr., C.L., 2005. Geneexpression profiling of avian macrophage activation. Vet. Immunol.Immunopathol. 105, 289–299.
Bruggeman, F.J., Westerhoff, H.V., 2007. The nature of systems biology.Trends Microbiol. 15, 45–50.
Burkey, T.E., Skjolaas, K.A., Dritz, S.S., Minton, J.E., 2007. Expression of Toll-like receptors, interleukin 8, macrophage migration inhibitory factor,and osteopontin in tissues from pigs challenged with Salmonellaenterica serovar Typhimurium or serovar Choleraesuis. Vet. Immunol.Immunopathol. 115, 309–319.
Cagiola, M., Giulio, S., Miriam, M., Katia, F., Paola, P., Macri, A., Pasquali, P.,2006. In vitro down regulation of proinflammatory cytokines inducedby LPS tolerance in pig CD14+ cells. Vet. Immunol. Immunopathol.112, 316–320.
Chowdhury, S.R., King, D.E., Willing, B.P., Band, M.R., Beever, J.E., Lane, A.B.,Loor, J.J., Marini, J.C., Rund, L.A., Schook, L.B., Van Kessel, A.G., Gaskins,
H.R., 2007. Transcriptome profiling of the small intestinal epitheliumin germfree versus conventional piglets. BMC Genomics 8, 215.Couture, O., Callenberg, K., Koul, N., Pandit, S., Younes, R., Hu, Z.L., Dekkers,J., Reecy, J., Honavar, V., Tuggle, C., 2009. ANEXdb: an integrated animalANnotation and microarray EXpression database. Mamm. Genome 20,768–777.
mmunopathology 138 (2010) 280–291 289
Dawson, H.D., Beshah, E., Nishi, S., Solano-Aguilar, G., Morimoto, M., Zhao,A., Madden, K.B., Ledbetter, T.K., Dubey, J.P., Shea-Donohue, T., Lun-ney, J.K., Urban Jr., J.F., 2005. Localized multigene expression patternssupport an evolving Th1/Th2-like paradigm in response to infectionswith Toxoplasma gondii and Ascaris suum. Infect. Immun. 73, 1116–1128.
Defrance, M., Touzet, H., 2006. Predicting transcription factor bindingsites using local over-representation and comparative genomics. BMCBioinform. 7, 396.
Dennis Jr., G., Sherman, B.T., Hosack, D.A., Yang, J., Gao, W., Lane, H.C.,Lempicki, R.A., 2003. DAVID: database for annotation, visualization,and integrated discovery. Genome Biol. 4, P3.
Detweiler, C.S., Cunanan, D.B., Falkow, S., 2001. Host microarray analysisreveals a role for the Salmonella response regulator phoP in humanmacrophage cell death. Proc Natl. Acad. Sci. U.S.A. 98, 5850–5855.
Durand, S.V., Hulst, M.M., de Wit, A.A., Mastebroek, L., Loeffen, W.L., 2009.Activation and modulation of antiviral and apoptotic genes in pigsinfected with classical swine fever viruses of high, moderate or lowvirulence. Arch. Virol. 154, 1417–1431.
Dvorak, C.M., Hirsch, G.N., Hyland, K.A., Hendrickson, J.A., Thompson,B.S., Rutherford, M.S., Murtaugh, M.P., 2006. Genomic dissectionof mucosal immunobiology in the porcine small intestine. Physiol.Genomics 28, 5–14.
Fernandes, L.T., Tomas, A., Bensaid, A., Perez-Enciso, M., Sibila, M., Sanchez,A., Segales, J., 2009. Exploratory study on the transcriptional profileof pigs subclinically infected with porcine circovirus type 2. Anim.Biotechnol. 20, 96–109.
Flori, L., Rogel-Gaillard, C., Cochet, M., Lemonnier, G., Hugot, K., Chardon,P., Robin, S., Lefevre, F., 2008a. Transcriptomic analysis of the dia-logue between Pseudorabies virus and porcine epithelial cells duringinfection. BMC Genomics 9, 123.
Flori, L., Rogel-Gaillard, C., Mariani, V., Lemonnier, G., Cochet, M., Hugot,K., Chardon, P., Robin, S., Lefevre, F., 2008b. A combined transcrip-tomic approach to analyse the dialogue between pseudorabies virusand porcine cells. Dev. Biol. (Basel) 132, 99–104.
Frith, M.C., Fu, Y., Yu, L., Chen, J.F., Hansen, U., Weng, Z., 2004. Detectionof functional DNA motifs via statistical over-representation. NucleicAcids Res. 32, 1372–1381.
Galindo, R.C., Ayoubi, P., Naranjo, V., Gortazar, C., Kocan, K.M., de la Fuente,J., 2009. Gene expression profiles of European wild boar naturallyinfected with Mycobacterium bovis. Vet. Immunol. Immunopathol.129, 119–125.
Gardy, J.L., Lynn, D.J., Brinkman, F.S., Hancock, R.E., 2009. Enabling a sys-tems biology approach to immunology: focus on innate immunity.Trends Immunol. 30, 249–262.
Gilchrist, M., Thorsson, V., Li, B., Rust, A.G., Korb, M., Roach, J.C., Kennedy,K., Hai, T., Bolouri, H., Aderem, A., 2006. Systems biology approachesidentify ATF3 as a negative regulator of Toll-like receptor 4. Nature441, 173–178.
He, T., Feng, G., Chen, H., Wang, L., Wang, Y., 2009. Identification of hostencoded microRNAs interacting with novel swine-origin influenza A(H1N1) virus and swine influenza virus. Bioinformation 4, 112–118.
Hedegaard, J., Skovgaard, K., Mortensen, S., Sorensen, P., Jensen, T.K.,Hornshoj, H., Bendixen, C., Heegaard, P.M., 2007. Molecular charac-terisation of the early response in pigs to experimental infection withActinobacillus pleuropneumoniae using cDNA microarrays. Acta Vet.Scand. 49, 11.
Heng, T.S., Painter, M.W., Immunological Genome Project Consortium,2008. The Immunological Genome Project: networks of gene expres-sion in immune cells. Nat. Immunol. 9, 1091–1094.
Huang da, W., Sherman, B.T., Lempicki, R.A., 2009. Systematic and integra-tive analysis of large gene lists using DAVID bioinformatics resources.Nat. Protoc. 4, 44–57.
Hyatt, G., Melamed, R., Park, R., Seguritan, R., Laplace, C., Poirot, L., Zuc-chelli, S., Obst, R., Matos, M., Venanzi, E., Goldrath, A., Nguyen, L.,Luckey, J., Yamagata, T., Herman, A., Jacobs, J., Mathis, D., Benoist, C.,2006. Gene expression microarrays: glimpses of the immunologicalgenome. Nat. Immunol. 7, 686–691.
Hyland, K.A., Brown, D.R., Murtaugh, M.P., 2006. Salmonella enter-ica serovar Choleraesuis infection of the porcine jejunal Peyer’spatch rapidly induces IL-1beta and IL-8 expression. Vet. Immunol.Immunopathol. 109, 1–11.
Jenner, R.G., Young, R.A., 2005. Insights into host responses against
pathogens from transcriptional profiling. Nat. Rev. Microbiol. 3,281–294.Klipp, E., Herwig, R., Kowald, A., Wierling, C., Lehrach, H., 2005. SystemsBiology in Practice. Wiley-VCH.
Ledger, T.N., Pinton, P., Bourges, D., Roumi, P., Salmon, H., Oswald, I.P.,2004. Development of a macroarray to specifically analyze immuno-

2 gy and I
L
L
L
L
L
M
M
M
M
M
N
N
N
O
P
P
Q
Q
R
R
R
R
R
90 C.K. Tuggle et al. / Veterinary Immunolo
logical gene expression in swine. Clin. Diagn. Lab. Immunol. 11,691–698.
i, J., Yu, Y.J., Feng, L., Cai, X.B., Tang, H.B., Sun, S.K., Zhang, H.Y., Liang,J.J., Luo, T.R., 2010. Global transcriptional profiles in peripheral bloodmononuclear cell during classical swine fever virus infection. VirusRes. 148, 60–70.
i, L., Zhang, J., Block, E.R., Patel, J.M., 2004. Nitric oxide-modulated markergene expression of signal transduction pathways in lung endothelialcells. Nitric Oxide 11, 290–297.
khagvadorj, S., Qu, L., Cai, W., Couture, O.P., Barb, C.R., Hausman, G.J., Net-tleton, D., Anderson, L.L., Dekkers, J.C., Tuggle, C.K., 2009. Microarraygene expression profiles of fasting induced changes in liver and adi-pose tissues of pigs expressing the melanocortin-4 receptor D298Nvariant. Physiol. Genomics 38, 98–111.
khagvadorj, S., Qu, L., Cai, W., Couture, O.P., Barb, C.R., Hausman, G.J.,Nettleton, D., Anderson, L.L., Dekkers, J.C., Tuggle, C.K., 2010. Geneexpression profiling of the short-term adaptive response to acutecaloric restriction in liver and adipose tissues of pigs differing in feedefficiency. Am. J. Physiol. Regul. Integr. Comp. Physiol. 298, R494–507.
ynn, D.J., Winsor, G.L., Chan, C., Richard, N., Laird, M.R., Barsky, A., Gardy,J.L., Roche, F.M., Chan, T.H., Shah, N., Lo, R., Naseer, M., Que, J., Yau, M.,Acab, M., Tulpan, D., Whiteside, M.D., Chikatamarla, A., Mah, B., Mun-zner, T., Hokamp, K., Hancock, R.E., Brinkman, F.S., 2008. InnateDB:facilitating systems-level analyses of the mammalian innate immuneresponse. Mol. Syst. Biol. 4, 218.
AQC Consortium, 2006. The MicroArray Quality Control (MAQC) projectshows inter- and intraplatform reproducibility of gene expressionmeasurements. Nat. Biotechnol. 24, 1151–1161.
edvedovic, M., Sivaganesan, S., 2002. Bayesian infinite mixture modelbased clustering of gene expression profiles. Bioinformatics 18,1194–1206.
iller, L.C., Fox, J.M., 2004. Apoptosis and porcine reproductive and respi-ratory syndrome virus. Vet. Immunol. Immunopathol. 102, 131–142.
oser, R.J., Reverter, A., Kerr, C.A., Beh, K.J., Lehnert, S.A., 2004. A mixed-model approach for the analysis of cDNA microarray gene expressiondata from extreme-performing pigs after infection with Actinobacilluspleuropneumoniae. J. Anim. Sci. 82, 1261–1271.
oser, R.J., Reverter, A., Lehnert, S.A., 2008. Gene expression profiling ofporcine peripheral blood leukocytes after infection with Actinobacilluspleuropneumoniae. Vet. Immunol. Immunopathol. 121, 260–274.
iewold, T.A., Kerstens, H.H., van der Meulen, J., Smits, M.A., Hulst, M.M.,2005. Development of a porcine small intestinal cDNA micro-array:characterization and functional analysis of the response to enterotox-igenic E. coli. Vet. Immunol. Immunopathol. 105, 317–329.
ino-Soto, M.I., Jozani, R.J., Bridle, B., Mallard, B.A., 2008a. Analysis of geneexpression patterns by microarray hybridization in blood mononu-clear cells of SLA-DRB1 defined Canadian Yorkshire pigs. BMC Res.Notes 1, 31.
ino-Soto, M.I., Jozani, R.J., Bridle, B., Mallard, B.A., 2008b. CDNA microar-ray analysis of gene expression patterns in blood mononuclear cellsof SLA-DRB1-defined Yorkshire pigs. Dev. Biol. (Basel) 132, 321–325.
komo-Adhiambo, M., Beattie, C., Rink, A., 2006. cDNA microarray anal-ysis of host-pathogen interactions in a porcine in vitro model forToxoplasma gondii infection. Infect. Immun. 74, 4254–4265.
edersen, I., David, M., 2008. MicroRNAs in the immune response.Cytokine 43, 391–394.
onsuksili, S., Murani, E., Wimmers, K., 2008. Porcine genome-wide geneexpression in response to tetanus toxoid vaccine. Dev. Biol. (Basel)132, 185–195.
uackenbush, J., 2001. Computational analysis of microarray data. Nat.Rev. Genet. 2, 418–427.
uackenbush, J., 2002. Microarray data normalization and transformation.Nat. Genet. 32 (Suppl.), 496–501.
aymond, C.R., Wilkie, B.N., 2004. Th-1/Th-2 type cytokine profiles ofpig T-cells cultured with antigen-treated monocyte-derived dendriticcells. Vaccine 22, 1016–1023.
aymond, C.R., Wilkie, B.N., 2005. Toll-like receptor, MHC II. B7 andcytokine expression by porcine monocytes and monocyte-deriveddendritic cells in response to microbial pathogen-associated molecu-lar patterns. Vet. Immunol. Immunopathol. 107, 235–247.
oberts, P.C., 2008. Gene expression microarray data analysis demystified.Biotechnol. Annu. Rev. 14, 29–61.
odenburg, W., Bovee-Oudenhoven, I.M., Kramer, E., van der Meer, R.,
Keijer, J., 2007. Gene expression response of the rat small intestinefollowing oral Salmonella infection. Physiol. Genomics 30, 123–133.osenberger, C.M., Scott, M.G., Gold, M.R., Hancock, R.E., Finlay, B.B., 2000.Salmonella typhimurium infection and lipopolysaccharide stimu-lation induce similar changes in macrophage gene expression. J.Immunol. 164, 5894–5904.
mmunopathology 138 (2010) 280–291
Royaee, A.R., Husmann, R.J., Dawson, H.D., Calzada-Nova, G., Schnitzlein,W.M., Zuckermann, F.A., Lunney, J.K., 2004. Deciphering the involve-ment of innate immune factors in the development of the hostresponse to PRRSV vaccination. Vet. Immunol. Immunopathol. 102,199–216.
Santos, R.L., Zhang, S., Tsolis, R.M., Kingsley, R.A., Adams, L.G., Baumler,A.J., 2001. Animal models of Salmonella infections: enteritis versustyphoid fever. Microbes Infect. 3, 1335–1344.
Schena, M., Shalon, D., Davis, R.W., Brown, P.O., 1995. Quantitative mon-itoring of gene expression patterns with a complementary DNAmicroarray. Science 270, 467–470.
Sharbati, S., Friedländer, M.R., Sharbati, J., Hoeke, L., Chen, W., Keller,A., Stähler, P.F., Rajewsky, N., Einspanier, R., 2010. Deciphering theporcine intestinal microRNA transcriptome. BMC Genomics 11, 275.
Shi, Z., Sun, J., Guo, H., Tu, C., 2009. Genomic expression profiling of periph-eral blood leukocytes of pigs infected with highly virulent classicalswine fever virus strain Shimen. J. Gen. Virol. 90, 1670–1680.
Skjolaas, K.A., Burkey, T.E., Dritz, S.S., Minton, J.E., 2007. Effects ofSalmonella enterica serovar Typhimurium, or serovar Choleraesuis.Lactobacillus reuteri and Bacillus licheniformis on chemokine andcytokine expression in the swine jejunal epithelial cell line, IPEC-J2.Vet. Immunol. Immunopathol. 115, 299–308.
Steibel, J.P., Wysocki, M., Lunney, J.K., Ramos, A.M., Hu, Z.L., Rothschild,M.F., Ernst, C.W., 2009. Assessment of the swine protein-annotatedoligonucleotide microarray. Anim. Genet..
Storey, J.D., Tibshirani, R., 2003. Statistical significance for genomewidestudies. Proc. Natl. Acad. Sci. U.S.A. 100, 9440–9445.
Tomas, A., Fernandes, L.T., Sanchez, A., Segales, J., 2010. Time course dif-ferential gene expression in response to porcine circovirus type 2subclinical infection. Vet. Res. 41, 12.
Tuggle, C.K., Wang, Y., Couture, O., 2007. Advances in swine transcrip-tomics. Int. J. Biol. Sci. 3, 132–152.
Tuggle, C.K., Wang, Y.F., Couture, O.P., Qu, L., Uthe, J.J., Kuhar, D., Lunney,J.K., Nettleton, D., Dekkers, J.C., Bearson, S.M., 2008. Computationalintegration of structural and functional genomics data across speciesto develop information on the porcine inflammatory gene regulatorypathway. Dev. Biol. (Basel) 132, 105–113.
Uthe, J.J., Royaee, A., Lunney, J.K., Stabel, T.J., Zhao, S.H., Tuggle, C.K.,Bearson, S.M., 2007. Porcine differential gene expression in responseto Salmonella enterica serovars Choleraesuis and Typhimurium. Mol.Immunol. 44, 2900–2914.
Uthe, J.J., Stabel, T.J., Zhao, S.H., Tuggle, C.K., Bearson, S.M., 2006. Analy-sis of porcine differential gene expression following challenge withSalmonella enterica serovar Choleraesuis using suppression subtrac-tive hybridization. Vet. Microbiol. 114, 60–71.
Uthe, J.J., Wang, Y., Qu, L., Nettleton, D., Tuggle, C.K., Bearson, S.M., 2009.Correlating blood immune parameters and a CCT7 genetic variant withthe shedding of Salmonella enterica serovar Typhimurium in swine.Vet. Microbiol. 135, 384–388.
van der Sar, A.M., Musters, R.J., van Eeden, F.J., Appelmelk, B.J.,Vandenbroucke-Grauls, C.M., Bitter, W., 2003. Zebrafish embryos asa model host for the real time analysis of Salmonella typhimuriuminfections. Cell Microbiol. 5, 601–611.
Veldhuizen, E.J., Hendriks, H.G., Hogenkamp, A., van Dijk, A., Gaastra, W.,Tooten, P.C., Haagsman, H.P., 2006. Differential regulation of porcinebeta-defensins 1 and 2 upon Salmonella infection in the intestinalepithelial cell line IPI-2I. Vet. Immunol. Immunopathol. 114, 94–102.
Verfaillie, T., Cox, E., To, L.T., Vanrompay, D., Bouchaut, H., Buys, N., God-deeris, B.M., 2001. Comparative analysis of porcine cytokine produc-tion by mRNA and protein detection. Vet. Immunol. Immunopathol.81, 97–112.
von Luxburg, U., 2007. A tutorial on spectral clustering. Stat. Comput. 17,395–416.
Wang, J., Chen, L., Li, P., Li, X., Zhou, H., Wang, F., Li, D., Yin, Y., Wu,G., 2008a. Gene expression is altered in piglet small intestine byweaning and dietary glutamine supplementation. J. Nutr. 138, 1025–1032.
Wang, Y., Couture, O.P., Qu, L., Uthe, J.J., Bearson, S.M., Kuhar, D., Lunney,J.K., Nettleton, D., Dekkers, J.C., Tuggle, C.K., 2008b. Analysis of porcinetranscriptional response to Salmonella enterica serovar Choleraesuissuggests novel targets of NFkappaB are activated in the mesentericlymph node. BMC Genomics 9, 437.
Wang, Y., Qu, L., Uthe, J.J., Bearson, S.M., Kuhar, D., Lunney, J.K., Couture,O.P., Nettleton, D., Dekkers, J.C., Tuggle, C.K., 2007. Global transcrip-tional response of porcine mesenteric lymph nodes to Salmonellaenterica serovar Typhimurium. Genomics 90, 72–84.
Wang, Z., Gerstein, M., Snyder, M., 2009. RNA-Seq: a revolutionary tool fortranscriptomics. Nat. Rev. Genet 10, 57–63.

gy and I
C.K. Tuggle et al. / Veterinary ImmunoloWells, C.A., Ravasi, T., Faulkner, G.J., Carninci, P., Okazaki, Y., Hayashizaki,Y., Sweet, M., Wainwright, B.J., Hume, D.A., 2003. Genetic control ofthe innate immune response. BMC Immunol. 4, 5.
Wick, M.J., 2004. Living in the danger zone: innate immunity to
Salmonella. Curr. Opin. Microbiol. 7, 51–57.Wurfel, M.M., Park, W.Y., Radella, F., Ruzinski, J., Sandstrom, A., Strout,J., Bumgarner, R.E., Martin, T.R., 2005. Identification of high and lowresponders to lipopolysaccharide in normal subjects: an unbiasedapproach to identify modulators of innate immunity. J. Immunol. 175,2570–2578.
mmunopathology 138 (2010) 280–291 291
Zak, D.E., Aderem, A., 2009. Systems biology of innate immunity. Immunol.Rev. 227, 264–282.
Zhao, S.H., Recknor, J., Lunney, J.K., Nettleton, D., Kuhar, D., Orley, S., Tuggle,C.K., 2005. Validation of a first generation of porcine long oligonu-
cleotide microarray for transcriptional profiling in the pig. Genomics86, 618–625.Zhao, S.H., Kuhar, D., Lunney, J.K., Dawson, H., Guidry, C., Uthe, J.J., Bearson,S.M., Recknor, J., Nettleton, D., Tuggle, C.K., 2006. Gene expression pro-filing in Salmonella Choleraesuis-infected porcine lung using a longoligonucleotide microarray. Mamm. Genome 17, 777–789.