vha & the national academy of sciences may 2019 facilities ... · project management databases...
TRANSCRIPT

©2019 EAB Global, Inc. • All Rights Reserved • eab.com
Facilities Performance Metrics in Higher EdBetter Serving Institutions Through Impactful Dashboards
Facilities Forum
Lisa BerglundSenior [email protected]
VHA & the National Academy of SciencesMay 2019

©2019 EAB Global, Inc. • All Rights Reserved • eab.com
2
Oakland A’s Use “Moneyball” Metrics to Make Playoffs, Despite Low Budget
Source: Mark Adams, “The Man Behind Moneyball,” https://www.domo.com/blog/the-man-behind-moneyball-the-billy-beane-story; Ryan Wright, “Moneyball,” http://bleacherreport.com/articles/858470-moneyball-a-look-inside-major-league-baseball-and-the-oakland-as; EAB interviews and analysis.
Winning on a Shoestring Budget
Oakland A’s execute 20-game winning streakand make 2002 playoffs with one of lowest budgets in the league
Following 2001 season, Oakland Athletics losethree talented free agents to larger market teams
Rather than traditional scout observations, A’s recruit inexpensive players based on data analyses of key metrics
A’s General Manager Billy Beaneidentifies on-base percentage and total bases earned as key indicators of player performance
Wik
iped
ia.
Oakland Athletics Recruit Undervalued Players Based on Key Metrics

©2019 EAB Global, Inc. • All Rights Reserved • eab.com
3
Facilities Struggles to Translate Reams of Data into Actionable Insights
Source: EAB interviews and analysis.
1) Computerized Maintenance Management System.
Data Overload
• Utilities
• Sustainability
• Building Condition
• Facilities Workforce
• Operating and Capital Costs
• Campus Cleanliness
• Work Orders and Maintenance
• Space Management
• Capital Projects
• Safety and Compliance
• Computerized Maintenance Management Systems (CMMS)
• Geographic InformationSystems (GIS)
• Space Information Management Systems (SIMS)
• Building Meters
• Project Management Databases
• Customer Satisfaction Surveys
• Post-Work Order Surveys
• Fiscal Management Systems
Facilities Tasked With Tracking More Data…
…and Has More Data Sources to Manage

©2019 EAB Global, Inc. • All Rights Reserved • eab.com
4
Private Companies Across All Sectors Use Dashboards to Inflect Performance
Source: Mazzotta J, "Web Design"; MicroStrategy, “Customer Case Study: Retail”; MicroStrategy, “MicroStrategy and eHarmony”; MicroStrategy, “MicroStrategy and GUESS”; EAB interviews and analysis.
A Proven Solution
e-Harmony
McDonald’s The Container Store
GUESS

©2019 EAB Global, Inc. • All Rights Reserved • eab.com
5
Work Order Dashboard Facilitates Targeted Interventions at OSU
The Power of Data
Source: The Ohio State University, Columbus, Ohio; EAB interviews and analysis.
422Labor hours recouped annually
Fewerannual trips to stockroom374
Multiple Facilities shops not meeting service call lead time expectations
Delayed work orders fuel customer dissatisfaction 20%
Reduction in service calllead time (from 49 to 39 days)
Changes Save Time and Money at The Ohio State University (OSU)
Slow Work Orders Frustrate Customers
SFO Implements New Dashboard and Processes
Facilities develops real-time work order aging dashboard
Begins sending automated monthly aging work order report to maintenance zone leaders to facilitate continuous improvement
Dashboard helps SFO pinpoint new processes and procedures to accelerate work orders
Shops not following standard procedures for planned work

©2019 EAB Global, Inc. • All Rights Reserved • eab.com
6
Source: EAB interviews and analysis.
Differentiating Dashboards from Scorecards
ScorecardDashboard
Capsule Description
Overview of progress toward strategic objectives
Overview of performance on core operational measures
Principal Aim Demonstrate the alignment between unit activities and institution’s strategic goals
Uncover meaningful trends in core metric performance that merit responsive action
Strategic objectives, initiatives, and performance on associated progress measures
Data on metric performance relative to targets, historical performance, and related metrics
Contents
Limitation Does not measure strategic initiative impact on advancement of key priorities
Does not allow for analysis of pace of progress or of non-strategic indicators
Audience President, Provost, CBO, and other institutional leaders
SFO, Facilities leadership, and CBO; in some cases, campus-wide audience

©2019 EAB Global, Inc. • All Rights Reserved • eab.com
7
Source: EAB interviews and analysis.
Three Major Types of Facilities Dashboards
Sustainability Facilities Management
Function/ Department
Industry Prevalence 60%30% 10%
Numberof Metrics 6-3015-20 8-12
Description Tracks institution- and unit-level energy/utility metrics; shared with broad campus audience to track sustainability efforts
Tracks most critical Facilities metrics; SFOs use to gauge and improve operational performance
Tracks function-specific operational metrics; department leaders use to assess performance
Examples • The New School
• Arizona State University
• Columbia University
• Northwestern University
• California State University-East Bay
• Western Michigan University
• University of Minnesota

©2019 EAB Global, Inc. • All Rights Reserved • eab.com
8
Strategies to Overcome Common Dashboard Challenges
Source: EAB interviews and analysis.
Building an Effective Facilities Dashboard
Three Main Challenges Today’s Areas of Focus
Select Key Performance Indicators (KPIs)
Deciding which metrics to elevate1
Set Principled Targets and Action Triggers
Choosing appropriate targets and triggers
2 Employ User-Friendly Layout and Format
Displaying metrics in compelling format
3

©2019 EAB Global, Inc. • All Rights Reserved • eab.com
ROAD MAP9
Select Key Performance Indicators (KPIs)1
2 Gauge Performance Through Customer Service Metrics
3 Employ User-Friendly Layout and Format
4 Set Principled Targets and Action Triggers

©2019 EAB Global, Inc. • All Rights Reserved • eab.com
10
Screening Process Helps Narrow Core Metrics from Long Starting List
Source: EAB interviews and analysis.
Bringing Metric Selection to Life
100’s of Potential Metrics
15-20 KPIs
Consideration Description
Apply a Reality Check
Set aside metrics not readily accessible,regularly tracked, supported by reliable data, or easily communicated to others
Map toStrategic Objectives
Identify metrics that most directly measure progress on Facilities’ strategic objectives
Swap Lagging for Leading Metrics
Where feasible, identify leading indicators in lieu of measures providing information “after the fact”
Account for High-Priority Imperatives
Add “hot-seat” metrics that shed light on pressing yet temporary areas of concern
Ensure Balance of Metric Categories
Force trade-offs in overrepresented areas by sorting metrics by function or strategic perspective
Five-Step Metric Selection Filtering Process
1
2
3
4
5

©2019 EAB Global, Inc. • All Rights Reserved • eab.com
11
Four Pragmatic Screens to Determine Metric Viability
Consideration 1
Source: EAB interviews and analysis.
Apply a Reality Check
Suggested Screens
Metric Screen Description Rationale
Accessibilityof Data
Information system must possess the capability to generate data on metrics.
Time-consuming to manually pull and analyze data for each metric.
Frequencyof Tracking
Metrics elevated to unit dashboard should be monitored at regular intervals (e.g., monthly or quarterly).
Infrequent (e.g., annual) data updates hamper ability to assess performance at regular intervals.
Reliability of Data
Data available from information system should be accurate, consistently defined, and measured across the institution.
Absence of trustworthy data results in stakeholder suspicion toward performance, often resulting in inaction.
Communicabilityof Data
Definition and rationale for metrics should be easy to communicate and understand.
Lack of understanding about metric drivers and relevance hinders ability to inflect performance.

©2019 EAB Global, Inc. • All Rights Reserved • eab.com
12
Ideal Metrics Prompt “Yes” for Every Question in List
Tool: Reality Check Screening for Metrics
Accessibility of Data
1. Is the data for this metric collected via an automated system?
2. If not, can someone collect and report the data within a few hours?
3. Is the system capable of calculating and reporting the results for this metric?
Frequency of Tracking
4. Can this metric be tracked more than once a year?
5. Can this metric be tracked frequently enough to inform action?
Reliability of Data
6. Do all departments use the same definition for this metric?
7. Is the metric calculated by an automated system?
8. Can you ensure the accuracy of the reported data?
9. Do managers trust the data for decision making?
Communicability of Data
10. Is this metric easily explained to and understood by leaders outside your unit?
11. Do managers typically agree on the definition of this metric?
12. Are managers aware of the importance of tracking the metric?
13. Do managers understand how performance on this metric impacts institutional goals?
Source: EAB interviews and analysis.

©2019 EAB Global, Inc. • All Rights Reserved • eab.com
13
Confirm Metrics Directly Measure Strategic Objectives Rather than Initiatives
Consideration 2
Source: EAB interviews and analysis.
Map to Strategic Objectives
Strategic Priorities
Strategic Objectives KPIs Targets Strategic
Initiatives
Des
crip
tion
• Backbone for strategy;roughly four to eight
• Usually derived from mission statement
• Stem from strategic priorities;typically 40 to 60
• Adapted annually to every few years
Indicators that track progress toward objectives
• Indicator goals that motivate performance
• Frequently reset to ensure continuous improvement
Set of actions to raise metrics above target levels
Exam
ple
Operational Efficiency
Prioritize preventive maintenance (PM) work to decrease resources spent on reactive work
PM/RM Ratio (Ratio of preventive maintenance to reactive maintenance tasks completed)
70%/30%
Develop prioritized PM schedule that reflects condition and strategic important of assets
Framework to Map Metrics to Institutional Strategic Priorities
Many institutions mistakenly track metrics that assess strategic initiative progress
Metrics should flow directly from strategic objectives

©2019 EAB Global, Inc. • All Rights Reserved • eab.com
14
Consideration 3
Source: EAB interviews and analysis.
Swap Lagging for Leading Metrics
Percentage of buildings passing area inspections
Employee training compliance rate
OSHA recordable injuries
Percentage of offers accepted Time to fill Vacancy rate
Vacancy rate Total number of overtime hours utilized Payroll expense
Lagging IndicatorPotential Leading Metrics
Comparing Leading and Lagging Indicators in Facilities
Whether metrics leading or lagging depends on purpose for tracking

©2019 EAB Global, Inc. • All Rights Reserved • eab.com
15
Source: EAB interviews and analysis.
Identifying Leading Metrics
Questions to Consider
For each core metric, brainstorm potential leading metrics, considering the questions below.
• What are the key drivers of the core metric?
• Which metrics make up the formula for the core metric?
• Which metrics have a defensible link to the challenge the original metric was intended to monitor?
• What processes drive success or failure in the core metric?
• Is there a leading metric for the leading metric—a metric even further upstream?

©2019 EAB Global, Inc. • All Rights Reserved • eab.com
16
Elevate “Hot-Seat” Metrics in Response to External and Internal Pressures
Consideration 4
Source: EAB interviews and analysis.
Account for High-Priority Imperatives
2015 Dashboard 2016 Dashboard 2017 Dashboard
Metric Status
Work order cycle time
Campus safety rating
Acre per grounds FTE
MBTU/square foot
Waste diversion rate
Leadership roles filled by underrepresented minorities
Metric Status
Work order cycle time
Campus safety rating
Acre per grounds FTE
MBTU/square foot
Internal promotion rate
Percentage of managers completing training hours
Metric Status
Work order cycle time
Campus safety rating
Acre per grounds FTE
MBTU/square foot
Operating budget execution
Capital project spending per gross square foot
New president appointed; identifies workforce diversity and sustainability as high priorities
State budget cuts force Facilities to identify operational efficiencies
Facilities turnover rate spikes; SFO develops employee training and engagement initiatives
2015 2016 2017
Example Pressures that Drive New Metrics to Dashboard

©2019 EAB Global, Inc. • All Rights Reserved • eab.com
17
Equitably Distribute Metrics Across Facilities Functions or Strategic Pillars
Consideration 5
Source: EAB interviews and analysis.
Ensure Balance of Metric Categories
The most straightforward categorization scheme is to group metrics based on Facilities functions or capabilities, ensuring a balance of metrics across all responsibilities.
A second categorization scheme sorts metrics by institutional strategic pillars, which helps illustrate the link between Facilities initiatives and overall institution success.
Sample Facilities Functions
› Campus Operations
› Fiscal Management
› Service Delivery
› Safety and Compliance
Sample Strategic Pillars
› Student Success
› Enrollment
› Research and Scholarly Excellence
› Financial Strength and Stewardship
Option 2: Strategic or Institutional Perspective
Option 1: Function or Capability

©2019 EAB Global, Inc. • All Rights Reserved • eab.com
18
Metrics that Measure Progress Toward Strategic Objectives Become KPIs
Source: EAB interviews and analysis.
Getting from Metrics to KPIs
100’s of Potential Metrics
15-20 KPIs
20% Volume indicators: raw numbers that provide information on volume or scale (e.g., number of work orders completed annually)
Relative indicators: calculations of multiple metrics that provide relative information (e.g., percentage of work orders categorized as emergency)
80%
Key performance indicators (KPIs) are metrics that indicate progress toward strategic and operational objectives. KPIs should break down to be:
Metrics are quantifiable measurements collected to track organizational activities and processes

©2019 EAB Global, Inc. • All Rights Reserved • eab.com
ROAD MAP19
Select Key Performance Indicators (KPIs)1
2 Gauge Performance Through Customer Service Metrics
3 Employ User-Friendly Layout and Format
4 Set Principled Targets and Action Triggers

©2019 EAB Global, Inc. • All Rights Reserved • eab.com
20
Customer Satisfaction Surveys Efficiently Gauge Facilities Service Perceptions
Quantify Current Customer Perceptions Through Facilities-Focused Satisfaction Survey
Four Benefits to Measuring Customer Satisfaction
Source: EAB interviews and analysis.
Put rigorous figures to customer perceptions
Accurately Gauge Customer Perceptions
Signal Facilities commitment to measuring and improving performance
Demonstrate Customer Focus to Campus
Measure performance year over year to understand trends and track improvement
Track Customer Satisfaction Over Time
Better Target Service Interventions
Use results to understand what customers value most and direct resources there

©2019 EAB Global, Inc. • All Rights Reserved • eab.com
21
PWOSs Offer Immediate Feedback, But Not a Holistic Evaluation
Post-Work Order Surveys Only a Partial View
Source: EAB interviews and analysis.
Benefits
Benefits and Drawbacks of a Post–Work Order Survey (PWOS)
Drawbacks
Feedback on specific staff members allows managers to commend high performers and target training for poor performers
Evaluates Individual Staff MembersWork order surveys only provide information from those who request a service; they do not collect information on overall satisfaction with Facilities
Focuses on Specific Events
Analysis of survey results can surface trends that help Facilities see how to better meet immediate customer needs
Aids Short-Term PlanningCustomers are most likely to respond when extremely satisfied or dissatisfied with Facilities performance or staff member providing service
Elicits Extreme Feedback
Surveys ensure Facilities is adequately responding to customer requests before closing work orders
Tracks Performance on Work Order Responses
Only customers who request work orders will fill out a survey; PWOSs do not reach the broader campus audience affected by Facilities in other ways
Relies on a Skewed Sample

©2019 EAB Global, Inc. • All Rights Reserved • eab.com
22Bringing Customer Expectations into Focus
Source: EAB interviews and analysis.
Survey Design:Ask Targeted Questions to Get the Right Data
Institutions fail to set clear goals for their survey, and as a result, do not get good information
Survey Deployment:Create an Outreach Plan to Maximize Response Rates
Surveys struggle to reach important constituents and achieve reasonable response rates
Survey Analysis:Use Feedback to Make Customer-Centric Decisions
Even when institutions have well-designed surveys, they don’t know how to analyze the data to inform operational decision making
Elements of Effective SurveysBarriers to Effective Customer Satisfaction Surveys

©2019 EAB Global, Inc. • All Rights Reserved • eab.com
23
Demographic Prompts Enable Leaders to Sort Results by Constituency
Survey Design
The Power of Demography
Source: St. John‘s University, Queens, NY; EAB interviews and analysis.
Role
Faculty
Staff
Student
Department Affiliation
Advancement Office
Biology
Chemistry
Engineering
Financial Aid
Finance and Administration
History
Level
Undergraduate
Graduate
Adjunct Professor
Associate Professor
Full Professor
Dean
Manager
Demographic questions should have dropdown response options rather than free space to simplify response sorting
Sample Demographic Questions
Understanding Faculty vs. Student Needs at St. John’s UniversitySt. John’s University in Queens, New York released a customer satisfaction survey in 2014. The majority of faculty responses focused building temperature issues; however, when Facilities staff broke out student results separately, they discovered students were most concerned with Wi-Fi access and availability of electrical outlets for charging their mobile devices.

©2019 EAB Global, Inc. • All Rights Reserved • eab.com
24
Use Variety of Questions from Proven Survey Categories
Don’t Reinvent the WheelSurvey Design
Source: EAB interviews and analysis.
Demographic Questions
Likert-Scale Questions
Open-Ended Questions
Snapshot of EAB’s Customer Satisfaction Question Bank

©2019 EAB Global, Inc. • All Rights Reserved • eab.com
25
Three Strategies to Optimize Deployment and Maximize Participation
Achieve Your Desired Response RateSurvey Deployment
Source: EAB interviews and analysis.
SURVEY LENGTH
• Maximum survey duration before drop-off rate increases (according to SurveyMonkey)
• Shorter surveys (30 to 40 questions max) are likely to generate higher response rate
• Facilities should ask a few people to test the survey for completion time
Limit Survey Length to No More Than Eight Minutes
INTERNAL VETTING
• Institutional Research (IR) department staff have expertise in designing questions, sending surveys, and analyzing results
• IR may assist in coordinating survey deployment across units (particularly if customer satisfaction survey is embedded in broader administrative survey)
Leverage Institutional Research Expertise
TIMING AND INCENTIVES
• Surveys deployed in particularly busy times are likely to get lost and have fewer responses
• February and April are typically less busy months that avoid holiday breaks, midterms, and finals
• Incentives (e.g., raffle for one of several large prizes) can increase participation rates
Maximize Response Rate Through Timing and Incentives

©2019 EAB Global, Inc. • All Rights Reserved • eab.com
26
New Mexico State University (NMSU) Triages Comments to Unit Leaders
Survey Analysis
Use Comments to Solicit Actionable Feedback
Source: New Mexico State University, Las Cruces, NM; EAB interviews and analysis.
Facilities sorts comments by unit. By seeing which unit receives the most comments, Facilities can identify the services most important to customers.
1
Comments are distributed to the relevant unit head, who is tasked with generating a plan to address the comments.
2
Unit heads submit their plans for addressing the comments to the Facilities leader, who approves plans for execution.
3
NMSU’s Process for Addressing Customer Comments
18%
10%
36%
7%
18%
1%
10%
Administrative Services and Project Development
Grounds Services
BuildingOverall
Survey Instrument
Custodial Care Sustainability
NMSU’s Comment ThemesFall 2015

©2019 EAB Global, Inc. • All Rights Reserved • eab.com
27Pinpoint Most Urgent Improvement OpportunitiesSurvey Analysis
Source: EAB interviews and analysis.
Facilities Performance Aligns with Customer Importance
Facilities Performance Does Not Align with Customer Importance
Proposed Satisfaction and Value Analysis
Below Customer Expectations
Above Customer Expectations
Val
ue
Satisfaction
Custodial Services
Sustainability
CampusPlanning
Landscaping
Operations and Maintenance
Administrative Services
Environmental Health and Safety
Dining Services

©2019 EAB Global, Inc. • All Rights Reserved • eab.com
ROAD MAP28
Select Key Performance Indicators (KPIs)1
2 Gauge Performance Through Customer Service Metrics
3 Employ User-Friendly Layout and Format
4 Set Principled Targets and Action Triggers

©2019 EAB Global, Inc. • All Rights Reserved • eab.com
29
Effective Dashboard Design Critical to Convey Information and Drive Action
Source: EAB interviews and analysis.
More Questions Than Answers
Three Major Dashboard Design Mistakes Lead to Stakeholder Confusion
Too Much Information
Overly Complex Visualizations
Insufficient Context
• What do the different colors mean?
• How do I interpret this graph?
• What’s the difference between the trend lines?
• Is the metric above or below the target?
• Should the metric increase or decrease?
• How does this compareto historical data?
• Where should I focus my attention?
• What are the most important metrics?
• Can you summarizethis for me?
Representative Stakeholder Questions

©2019 EAB Global, Inc. • All Rights Reserved • eab.com
30
Source: EAB interviews and analysis.
Maximizing Dashboard Impact
Characteristic Description Sample Dashboard
Concise Static dashboards limited to three pages or less; interactive dashboards include drop-down menus or variable inputs to allow audience to display desired amount of information
• Arizona State University • Columbia University • Western Michigan University
Accessible Data Visualizations
Uses visualizations to simplify complex metrics and trends;most effective elements are bar charts, pie graphs, and trend line graphs
• Columbia University• The New School• University of Washington
Metrics in Context Includes trends over time, performance targets, action triggers, clearly labeled graphic titles, and brief metric definitions when necessary
• Northwestern University• The New School• University of Washington
Directionality Uses arrows or icons to convey metric trend and/or goal directionality
• Northwestern University• University of Washington
Color-Coded Deploys color-coding to indicate progress and enhance visualizations; binary color scheme (e.g., red and green) the simplest way to track progress, but multi-chromatic scheme can enable more complex data visualizations
• The New School• Northwestern University• CSU-East Bay
ConsistentTime Frame
Clearly indicates time interval for metric collection and assessment; timeframes may differ based on metric type and goal (e.g., monthly work order completion rates, annual customer satisfaction scores)
• Northwestern University• University of Washington• University of Minnesota
Mapped to Strategic Goals
Where possible, maps metrics to broader Facilities themes or goals; some dashboards signal metric owner (i.e., Facilities staff member accountable for metric)
• University of Washington• Northwestern University
Characteristics of Effective Dashboard Layouts

©2019 EAB Global, Inc. • All Rights Reserved • eab.com
31
Institutional Dashboard Examples to Support Implementation Efforts
Source: EAB interviews and analysis.
Resources Available Now
Access examples of institutional dashboards by clicking on the logos above.
Example Institutional Dashboards Available
Screenshots of Institutional Dashboards

©2019 EAB Global, Inc. • All Rights Reserved • eab.com
32
NU Relies on Microsoft Suite for Simple Yet Effective Dashboards
Microsoft Suite
Source: Northwestern University Key Performance Indicators, Northwestern University, Evanston, IL; EAB interviews and analysis.
Northwestern University (NU)
Screenshot of Vertical Transportation Equipment (VTE) Dashboard in Excel
Screenshot of Facilities Management Dashboard in PowerPoint
©2019 EAB Global, Inc. • All Rights Reserved • eab.com
33
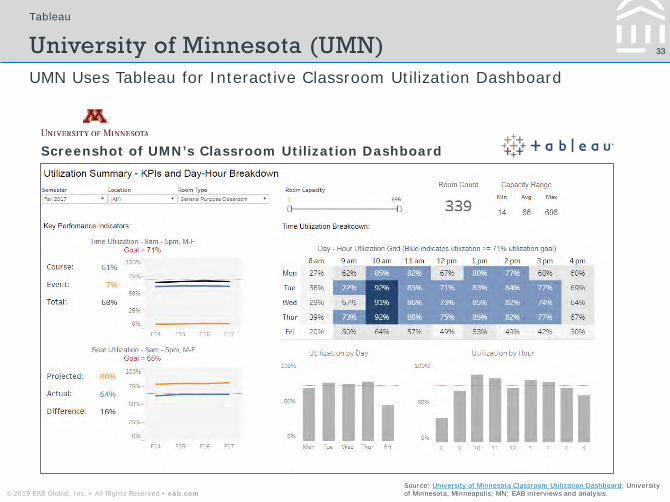
UMN Uses Tableau for Interactive Classroom Utilization Dashboard
Tableau
Source: University of Minnesota Classroom Utilization Dashboard, University of Minnesota, Minneapolis; MN; EAB interviews and analysis.
University of Minnesota (UMN)
Screenshot of UMN’s Classroom Utilization Dashboard

©2019 EAB Global, Inc. • All Rights Reserved • eab.com
34
External Software Generates CU’s Interactive, Public Sustainability Dashboard
Lucid
Source: Columbia University Building Dashboard, Columbia University, New York, NY; EAB interviews and analysis.
Columbia University (CU)
Screenshots of Columbia University’s Sustainability Dashboard

©2019 EAB Global, Inc. • All Rights Reserved • eab.com
ROAD MAP35
Select Key Performance Indicators (KPIs)1
2 Gauge Performance Through Customer Service Metrics
3 Employ User-Friendly Layout and Format
4 Set Principled Targets and Action Triggers

©2019 EAB Global, Inc. • All Rights Reserved • eab.com
36
Data Alone Does Not Force Action
Source: EAB interviews and analysis.
Analysis Paralysis
Capital Project Cost Overruns Double at Representative Institution
Q1 Q2 Q3 Q4
Leaders unconvinced of magnitude of problem, request more granular data
Data indicates capital projects consistently exceed budget
Task force formed to analyze root cause of cost overruns
Leaders research strategies to improve project spending habits
Cost overruns double before strategies implemented, customers highly dissatisfied

©2019 EAB Global, Inc. • All Rights Reserved • eab.com
37
Targets Drive Performance on Metrics, Triggers Mandate Corrective Action
Source: EAB interviews and analysis.
Differentiating Targets and Triggers
Action Trigger
DefinitionThreshold that signals underperformance on core metrics and mandates corrective action
PurposeClarifies when corrective action is required to maintain minimum performance levels
Performance Target
DefinitionFixed or ranged performance goal set by leaders each year
PurposeProvides concrete goals and drives performance on core metrics
ExamplePerformance target to complete 90% of monthly preventive maintenance (PM) work orders
ExampleAction trigger to intervene if monthly PM work order completion rate dips below 60%

©2019 EAB Global, Inc. • All Rights Reserved • eab.com
38
Performance Targets
Source: EAB interviews and analysis.
Performance Target Options
Four Main Options for Setting Metric Targets
Crowdsource with Staff
Rely on frontline staff expertise to establish aspirational yet realistic metric goals
Continuous Improvement
Establish ambition to continually improve metric within defined
timeframe (e.g., monthly, quarterly)
Institutional Mandate
Defer to institutional or compliance requirements when applicable (e.g.,
carbon footprint reduction, workforce diversity, safety and compliance)
Benchmarks
Leverage industry association standards (e.g., APPA, FEA1), peer performance, and regional standards (e.g., construction costs for local businesses)
1) Facility Engineering Associates.

©2019 EAB Global, Inc. • All Rights Reserved • eab.com
39
Trigger Type Definition Benefits Limitations
Specialty Triggers Static action triggers mandate continuous improvement to guard against performance plateaus (e.g., “lack of improvement” as a trigger)
Easy to calculate and manage against
May be perceived as unprincipled and therefore ignored by stakeholders
100% triggers signal metrics that demand perfect performance (e.g., employees completing safety training)
Avoids significantnegative consequences
Only applicable for specific metrics (e.g., safety, compliance)
Fixed Triggers Minimum performance thresholds designed to guard against significant performance declines that, without corrective action, would likely cause units to miss non-negotiable targets (e.g., trigger for a board-mandated budget cap)
Easy to calculateand communicate
Not applicable for many Facilities metrics
Relative Triggers Self-adjusting thresholds that consider current performance relative to the target, past performance, and/or related metrics to identify concerning trends (e.g., average parking shuttle wait time)
Applicable for a wide range of metrics; self-adjustment ensures longevity
More complex anddifficult to managethan other triggers
Type of Action Trigger Dependent on Metric Goal
Action Triggers
Source: EAB interviews and analysis.
Action Trigger Options
Three Types of Action Triggers
Q1 Q4Q2 Q3

©2019 EAB Global, Inc. • All Rights Reserved • eab.com
40
Trigger Type Questions Yes No
Specialty Triggers 1. Is continual improvement (regardless of degree) in metricperformance a strategic priority?
2. Is it a strategic priority that metric performance be at 100%?
If “no” is answered for both questions, continue to questions 3-4. If “yes” is answered for either question, then static or 100% trigger is most appropriate.
Fixed Triggers 3. Are you working toward an absolute (and non-negotiable) target?
4. Are you guarding against exceeding an absolute (andnonnegotiable) cap on performance?
If “no” is answered for both questions, continue to questions 5-8. If “yes” is answered for either question, a fixed trigger is most appropriate.
Relative Triggers 5. Are you seeking to identify when current performance deviates significantly from past performance?
6. Are you seeking to detect statistically significant performance trends?
7. Are you seeking to routinely compare a metric’s currentperformance against cumulative performance towards target?
8. Are you seeking to uncover simultaneous changes in performance among related metrics?
If “yes” is answered for any question, then establish a relative trigger.
Questions Help Leaders Identify Appropriate Trigger Type
Action Triggers
Source: EAB interviews and analysis.
Tool: Action Trigger Diagnostic
Q1 Q4Q2 Q3

©2019 EAB Global, Inc. • All Rights Reserved • eab.com
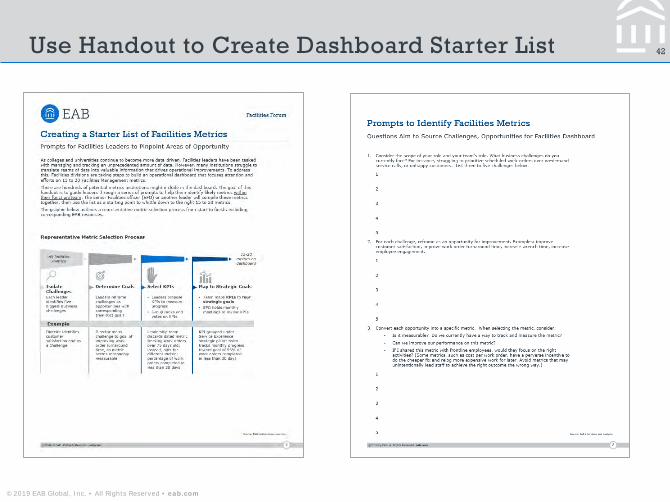
42Use Handout to Create Dashboard Starter List

©2019 EAB Global, Inc. • All Rights Reserved • eab.com
LEGAL CAVEAT
EAB Global, Inc. (“EAB”) has made efforts to verify the accuracy of the information it provides to members. This report relies on data obtained from many sources, however, and EAB cannot guarantee the accuracy of the information provided or any analysis based thereon. In addition, neither EAB nor any of its affiliates (each, an “EAB Organization”) is in the business of giving legal, accounting, or other professional advice, and its reports should not be construed as professional advice. In particular, members should not rely on any legal commentary in this report as a basis for action, or assume that any tactics described herein would be permitted by applicable law or appropriate for a given member’s situation. Members are advised to consult with appropriate professionals concerning legal, tax, or accounting issues, before implementing any of these tactics. No EAB Organization or any of its respective officers, directors, employees, or agents shall be liable for any claims, liabilities, or expenses relating to (a) any errors or omissions in this report, whether caused by any EAB organization, or any of their respective employees or agents, or sources or other third parties, (b) any recommendation by any EAB Organization, or (c) failure of member and its employees and agents to abide by the terms set forth herein.
EAB is a registered trademark of EAB Global, Inc. in the United States and other countries. Members are not permitted to use these trademarks, or any other trademark, product name, service name, trade name, and logo of any EAB Organization without prior written consent of EAB. Other trademarks, product names, service names, trade names, and logos used within these pages are the property of their respective holders. Use of other company trademarks, product names, service names, trade names, and logos or images of the same does not necessarily constitute (a) an endorsement by such company of an EAB Organization and its products and services, or(b) an endorsement of the company or its products or services by an EAB Organization. No EAB Organization is affiliated with any such company.
IMPORTANT: Please read the following.
EAB has prepared this report for the exclusive use of its members. Each member acknowledges and agrees that this report and the information contained herein (collectively, the “Report”) are confidential and proprietary to EAB. By accepting delivery of this Report, each member agrees to abide by the terms as stated herein, including the following:
1. All right, title, and interest in and to this Report is owned by an EAB Organization. Except as stated herein, no right, license, permission, or interest of any kind in this Report is intended to be given, transferred to, or acquired by a member. Each member is authorized to use this Report only to the extent expressly authorized herein.
2. Each member shall not sell, license, republish, distribute, or post online or otherwise this Report, in part or in whole. Each member shall not disseminate or permit the use of, and shall take reasonable precautions to prevent such dissemination or use of, this Report by (a) any of its employees and agents (except as stated below), or (b) any third party.
3. Each member may make this Report available solely to those of its employees and agents who (a) are registered for the workshop or membership program of which this Report is a part, (b) require access to this Report in order to learn from the information described herein, and (c) agree not to disclose this Report to other employees or agents or any third party. Each member shall use, and shall ensure that its employees and agents use, this Report for its internal use only. Each member may make a limited number of copies, solely as adequate for use by its employees and agents in accordance with the terms herein.
4. Each member shall not remove from this Report any confidential markings, copyright notices, and/or other similar indicia herein.
5. Each member is responsible for any breach of its obligations as stated herein by any of its employees or agents.
6. If a member is unwilling to abide by any of the foregoing obligations, then such member shall promptly return this Report and all copies thereof to EAB.
Facilities Forum
Program ManagerAnn Forman Lippens
Contributing ConsultantsLisa Berglund, MPPKimberly DillinghamBen Wohl
Design ConsultantSarah Ostrander
Managing DirectorJohn Workman, PhD

Washington DC Richmond Birmingham Minneapolis
P 202-747-1000 F 202-747-1010 eab.com