via electronic delivery - new york public … electronic delivery honorable kathleen h. burgess ......
TRANSCRIPT

300 Erie Blvd. West, A-4, Syracuse, New York 13202 T: 315/428-3411M: 315/[email protected] www.nationalgrid.com
December 31, 2015 VIA ELECTRONIC DELIVERY Honorable Kathleen H. Burgess Secretary New York State Public Service Commission Three Empire State Plaza, 19th Floor Albany, New York 12223-1350
RE: Case 14-M-0101 – Proceeding on Motion of the Commission in Regard to Reforming the Energy Vision
Case 15-M-0252 – In the Matter of Utility Energy Efficiency Programs
New York Standard Approach for Estimating Energy Savings from Energy Efficiency Programs – Residential, Multi-Family, and Commercial/Industrial Measures, Version 3 Measure Updates
Dear Secretary Burgess: In accordance with the requirements set forth in the Order Adopting Regulatory Policy Framework and Implementation Plan issued by the Commission on February 26, 2015 in Case 14-M-0101, Niagara Mohawk Power Corporation d/b/a National Grid, The Brooklyn Union Gas Company d/b/a National Grid NY and KeySpan Gas East Corporation d/b/a National Grid (collectively “National Grid”), Central Hudson Gas and Electric Corporation, Consolidated Edison Company of New York, Inc., National Fuel Gas Distribution Corporation, New York State Electric & Gas Corporation, Orange and Rockland Utilities, Inc., and Rochester Gas and Electric Corporation (collectively the “Joint Utilities”) assumed responsibility for maintaining the New York Standard Approach for Estimating Energy Savings from Energy Efficiency Programs– Residential, Multi-Family, and Commercial/Industrial Measures (“NY TRM”) on June 2, 2015. Pursuant to the Joint Utilities’ Technical Resource Manual Management Plan filed with the Commission on June 1, 2015, a Technical Resource Manual Management Committee (“TRM MC”) was established upon receipt of the NY TRM, Version 3, from the New York State Department of Public Service Staff.
Janet M. Audunson, P.E., Esq. Senior Counsel II

Hon. Kathleen H. Burgess, Secretary NY Technical Resource Manual – Measure Updates December 31, 2015 Page 2 of 4 The TRM MC has met regularly, and in the course of so doing, has reviewed and unanimously approved the nineteen (19) measure updates attached hereto to Version 3 of the NY TRM to be effective January 1, 2016. Respectfully submitted,
THE BROOKLYN UNION GAS COMPANY d/b/a NATIONAL GRID NY, KEYSPAN GAS EAST CORPORATION d/b/a NATIONAL GRID AND NIAGARA MOHAWK POWER CORPORATION d/b/a NATIONAL GRID
By: /s/ Janet M. Audunson Janet M. Audunson Senior Counsel II National Grid Legal Dept., A-4 300 Erie Boulevard West Syracuse, NY 13202 Tel.: 315-428-3411 Email: [email protected]
CENTRAL HUDSON GAS & ELECTRIC CORPORATION
By: /s/ Paul A. Colbert Paul A. Colbert Associate General Counsel – Regulatory Affairs Central Hudson Gas & Electric Corporation 284 South Avenue Poughkeepsie, NY 12601 Tel.: 845-486-5831 Email: [email protected]

Hon. Kathleen H. Burgess, Secretary NY Technical Resource Manual – Measure Updates December 31, 2015 Page 3 of 4 CONSOLIDATED EDISON COMPANY
OF NEW YORK, INC. and ORANGE AND ROCKLAND UTILITIES, INC.
By: /s/ Daniel W. Rosenblum Daniel W. Rosenblum Associate Counsel Consolidated Edison Company of New York, Inc. 4 Irving Place Room 1875-S New York, NY 10009 Tel.: 212-460-4461 Email: [email protected] NATIONAL FUEL GAS DISTRIBUTION CORPORATION
By: /s/ Randy C. Rucinski
Randy C. Rucinski Assistant General Counsel Rates and Regulatory Affairs National Fuel Gas Distribution Corporation 6363 Main Street Williamsville, New York 14221 Tel.: 716-857-7237 Email: [email protected]
NEW YORK STATE ELECTRIC & GAS CORPORATION and ROCHESTER GAS AND ELECTRIC CORPORATION
By: /s/ Joni J. Fish-Gertz Joni J. Fish-Gertz Manager, Energy Efficiency Programs 7760 Industrial Park Road
Hornell, New York 14843 Tel.: 607-725-3936 Email: [email protected]

Hon. Kathleen H. Burgess, Secretary NY Technical Resource Manual – Measure Updates December 31, 2015 Page 4 of 4 Enc. cc: Christina Palmero, DPS Staff, w/enclosure (via electronic mail) Debra LaBelle, DPS Staff, w/enclosure (via electronic mail) Peggy Neville, DPS Staff, w/enclosure (via electronic mail) Kevin Manz, DPS Staff, w/enclosure (via electronic mail) Joseph Hitt, DPS Staff, w/enclosure (via electronic mail) Robert Roby, DPS Staff, w/enclosure (via electronic mail) Peter Sheehan, DPS Staff, w/enclosure (via electronic mail) Denise Gerbsch, DPS Staff, w/enclosure (via electronic mail) Cathy Hughto-Delzer, w/enclosure (via electronic mail) Gayle Pensabene, w/enclosure (via electronic mail) Stephen Bonanno, w/enclosure (via electronic mail) Angela Turner, w/enclosure (via electronic mail) Christopher Yee, w/enclosure (via electronic mail) Amanda DiMaso, Central Hudson, w/enclosure (via electronic mail) Thomas Rizzo, Central Hudson, w/enclosure (via electronic mail) Jin Jin Huang, Con Edison, w/enclosure (via electronic mail) Vicki Kuo, Con Edison, w/enclosure (via electronic mail) Paul Romano, Con Edison, w/enclosure (via electronic mail) Rosanna Jimenez, Con Edison, w/enclosure (via electronic mail) Steve Mysholowsky, Con Edison, w/enclosure (via electronic mail) Charmaine Cigliano, O&R, w/enclosure (via electronic mail) Barbara Devito, O&R, w/enclosure (via electronic mail) Jeremy Scott, O&R, w/enclosure (via electronic mail) Evan Crahen, National Fuel, w/enclosure (via electronic mail) Douglas Keddie, National Fuel, w/enclosure (via electronic mail) Deborah Pickett, NYSEG, w/enclosure (via electronic mail) Dimple Gandhi, PSEG-LI, w/enclosure (via electronic mail) Caroline Reuss, NYSERDA, w/enclosure (via electronic mail)

New York Standard Approach for Estimating Energy
Savings from Energy Efficiency Programs –
Residential, Multi-Family, and Commercial/Industrial Measures
Version 3.1
Issue Date - January 1, 2016 Effective Date – January 1, 2016
New York State Department of Public Service Markets and Innovation, Office of Clean Energy
3 Empire State Plaza Albany, New York 12223

Table of Revisions / Additions
Issue Date - January 1, 2016 Effective Date – January 1, 2016
Revisions and additions to the measures listed below were undertaken by the Joint Utilities (Technical Resource Manual) TRM Management Committee between July and December of 2015. These revisions are to be incorporated into Version 3.1 of the New York Standard Approach for Estimating Energy Savings from Energy Efficiency Programs–Residential, Multi-family, and Commercial/Industrial Measures effective January 1, 2016.
R / A Number Measure Description of Change Location/Page
in TRM Version 3 R 1-16-1 Glossary Revised HDD Definition pp. 503-507R 1-16-2 R/MF - HVAC - Furnaces (and Boilers) Updates Minimum Efficiencies as per NYCECC and ECCCNYS. p. 95
R 1-16-3 R/MF - Lighting - Compact Fluorescent Lamp and Other Lighting Technologies Revisions to Deemed LED Factor and Leakage Factor p. 118 R 1-16-4 C/I - HVAC – Furnaces and Boilers Updates Minimum Efficiencies as per NYCECC and ECCCNYS. p. 182 R 1-16-5 C/I - HVAC – Control Revised Programmatic thermostat to include WiFi enabled devices p. 190 R 1-16-6 C/I - Lighting Designate HVAC IF for Auto Related (24/7) p. 196R 1-16-7 C/I - Lighting – Control –Interior Lighting Control Deletion of quantity of sensors controlling the same circuit load p. 202 R 1-16-8 C/I - Refrigeration – Control Revision to Fan Control Calculation p. 223R 1-16-9 Appendix G Revision to NYC SFDC EFLH Values pp. 404-409A 1-16-10 R/MF – Appliance Control –Advanced Power Strip Addition of Advanced (Smart) Power Strip Devices N/A A 1-16-11 R/MF - Lighting – Bi-Level Lighting Fixtures Addition of Bi-Level Lighting Fixtures N/A A 1-16-12 R/MF - HVAC – Control –TRV Addition of Thermostatic Radiator Valves for One Pipe Steam Systems N/A A 1-16-13 R/MF - HVAC – Control -EMS Addition of Multi-Family EMS measure N/A A 1-16-14 C/I - HVAC – BPM BPM Motor Retrofit for Existing Furnaces N/AA 1-16-15 C/I - Appliance Recycling -Room Air Conditioner Addition of RAC for commercial applications N/A A 1-16-16 C/I - Refrigeration Addition of Strip Curtains for Walk-In Units N/AA 1-16-17 C/I - Refrigeration Addition of Door Gaskets Repair for Reach-In Display Cases N/A A 1-16-18 C/I - DHW – Control Addition of Low Flow Spray Valve N/AR 1-16-19 R/MF - HVAC – Control Revised Programmatic thermostat to include WiFi enabled devices p. 114

Glossary Record of Revision 1-16-1 GLOSSARY
ABBREVIATIONS, ACRONYMS, AND EQUATION VARIABLES
COP Average coefficient of performance Energy efficiency (0 -100%)
η Average energy efficiency (0 -100%)
Δ T Average temperature difference EER Seasonal average energy efficiency ratio over the cooling season BTU/watt-hour,
(used for a particular climate/building) Δ kW Peak coincident demand electric savings Δ kWh Annual electric energy savings Δ Q Heat difference/loss Δ T Temperature difference Δ therms Annual gas energy savings Δ Change, difference, or savings A Amperage AC Air conditioning ACCA Air Conditioning Contractors of America ACEEE American Council for an Energy-Efficient Economy ACH Air change per hour AFUE Annual fuel utilization efficiency, seasonal energy efficiency for fuel heating
equipment AHAM Association of Home Appliance Manufacturers AHRI Air Conditioning Heating and Refrigeration Institute AHU Air handling unit AIA American Institute of Architects ANSI American National Standards Institute APU Auxiliary power unit area Extent of space or surface ARI Air-Conditioning & Refrigeration Institute ARRA American Recovery and Reinvestment Act of 2009 ASHP Air source heat pump ASHRAE American Society of Heating, Refrigeration, and Air Conditioning Engineers BLDC Brushless DC electric motor BTU British Thermal Unit BTUh British Thermal Units per hour CAC Central air conditioner CAV Constant air volume CBECS Commercial Buildings Energy Consumption Survey CDD Cooling degree days CEC State of California Energy Commission CF Coincidence factor CFL Compact fluorescent lamp CFM Cubic foot per minute CHW Chilled water CHWP Chilled water pump

Glossary Record of Revision 1-16-1 CLH Cooling load hours CMU Concrete masonry COP Coefficient of performance, ratio of output energy/input energy CV Constant volume CW Condenser water CWP Condenser water pump D Demand DC Direct current DCV Demand controlled ventilation DEER Database for Energy Efficiency Resources, California DF Demand diversity factor DFP Default functional period DHW Domestic hot water DLC DesignLights Consortium® DOAS Dedicated outdoor air system DOE 2.2 US DOE building energy simulation, and cost calculation tool DPS Department of Public Service, New York State DSF Demand savings factor DX Direct expansion ECCC NYC Energy Conservation Construction Code of New York City ECCC NYS Energy Conservation Construction Code of New York State EC Electronically commutated Econ Economizer Ecotope Ecotope Consulting, Redlands, CA EEPS Energy Efficiency Portfolio Standard EER Energy efficiency ratio under peak conditions EF Energy factor Eff Efficiency Effc Combustion efficiency Efficiency Vermont
State of Vermont Energy and Efficiency Initiatives
Efft Thermal efficiency EFLH Equivalent full-load hoursEIA Energy Information Administration, US EISA Energy Independence and Security Act (EISA) of 2007 ENERGY STAR®
U.S. Environmental Protection Agency voluntary program
Energy Trust Energy Trust of Oregon, Inc. EPA Environmental Protection Agency (EPA), US EPACT Energy Policy and Conservation Act of 2005 EPDM Ethylene propylene diene monomer roofing membrane ERV Energy recovery ventilation ESF Energy savings factor EUL Effective useful life Evapfan Evaporator fan Exh Exhaust

Glossary Record of Revision 1-16-1 F Savings factor FEMP Federal Energy Management Program FLH Full-load hours FLOW Nozzle flow FPFC Four pipe fan coil ft2 Square foot GDS GDS Associates, Marietta, GA Glazing area Aperture area of glazing GPD Gallons per day GSHP Ground source heat pump HDD Heating degree day - The number of degrees that a day's average temperature is
below 65oFahrenheit). The temperature below which buildings need to be heated. HID High intensity discharge lamp hp Horsepower HP High performance hrs hours hrsoperating Operating hours HSPF Heating seasonal performance factor, total heating output (supply heat) in BTU
(including electric heat) during the heating season / total electric energy heat pump consumed (in watt/hr)
ht Height HVAC Heating, ventilation, and air conditioning HVACc HVAC interaction factor for annual electric energy consumption HVACd HVAC interaction factor at utility summer peak hour HVACg HVAC interaction factor for annual natural gas consumption HW Hot water IECC International Energy Conservation Code IEER Integrated energy efficiency ratio IESNA Illuminating engineering Society of North America IPLV Integrated Part-Load Value, a performance characteristic, typically of a chiller
capable of capacity modulation. k Thermal conductivity KBTUhinput Annual gas input rating kBTUhoutput Annual gas output rating kW Kilowatt L Length LBNL Lawrence Berkeley National Laboratory leakage Estimate of percent of units not installed in service territory LED Light emitting diode LEED Leadership in Energy and Environmental Design LPD Lighting power density LRAC Long-run avoided cost LSAF Load shape adjustment factor MEC Metropolitan Energy Center NAECA National Appliance Energy Conservation Act of 1987 NBI New Buildings Institute

Glossary Record of Revision 1-16-1 NEA National Energy Alliances NEAT National Energy Audit Tool NEMA National Electrical Manufacturers Association NREL National Renewable Energy Laboratory NRM National Resource Management NSTAR Operating company of Northeast utilities NWPPC Northwest Power Planning Council NWRTF Northwest Regional Technical Forum NY DPS New York State Department of Public Service NYISO New York Independent System Operator NYSERDA New York State Energy Research and Development Authority oF Degrees Fahrenheit OSA Outdoor supply air PA Consulting PA Consulting Group PF Power factor Phase Number of phases in a motor (1 or 3) Single Phase is a type of motor with low
horsepower that operates on 120 or 240 volts, often used in residential appliances. Three phase is a motor with a continuous series of three overlapping AC cycles offset by 120 degrees. Three-phase is typically used in commercial applications.
PLR Power loss reduction PNNL Pacific Northwest National Laboratory PSC Public Service Commission, New York State PSF Proper sizing factor PSZ Packaged single zone PTAC Package terminal air conditioner PTHP Packaged terminal heat pump Q Heat Qreduced Reduced heat Qreject Total heat rejection r Radius RA Return air RAC Room air conditioner RE Recovery efficiency RECS Residential Energy Consumption Survey RESNET Residential Energy Services Network RH Reduced heat RLF Rated load factor RPM Revolutions per minute R-value A measure of thermal resistance particular to each material S Savings SAPA State Administrative Procedure Act SBC System Benefit Charge SCFM Standard cubic feet per minute @ 68 oF and 14.7 psi standard condition SEER Seasonal average energy efficiency ratio over the cooling season, BTU/watt-hour,
(used for average U.S. location/region) sf Square foot

Glossary Record of Revision 1-16-1 SHGC Solar heat gain coefficient SL Standby heat loss
Staff NYS Department of Public Service Staff T Temperature TAF Temperature adjustment factor TEFC Totally enclosed fan cooled th Thickness therm Unit of heat THR Total heat rejection
TMY Typical meteorological year tons Tons of air conditioning tons/unit Tons of air conditioning per unit, based on nameplate data TRC Total Resources Cost TRM Technical Resource Manual UA Overall heat loss coefficient (BTU/hr-°F) unit Measure units Number of measures installed under the program UPC Uniform Plumbing Code under the International Association of Plumbing and
Mechanical Officials US DOE United States Department of EnergyUS EPA United States Environmental Protection Agency U-value Measure of heat loss in a building element/overall heat transfer co-efficient V Volt v Volume VAV Variable air volume VSD Variable speed drive W Watts w Width Wisconsin PSC State of Wisconsin Public Service Commission
Record of Revision Record of Revision Number Issue Date
1-16-1 1-1-2016
Return to Table of Contents

Residential and Multi-Family Measures Record of Revision 1-16-2
FURNACE AND BOILER
Measure Description
This measure includes high efficiency gas fired furnaces, boilers, and unit heaters in low-rise
residential building applications.
Method for Calculating Annual Energy and Peak Coincident Demand Savings
Annual Electric Energy Savings
kWh = N/A
Peak Coincident Demand Savings
kW = N/A
Annual Gas Energy Savings
∆therms = Units x (kBTUhin
unit) x (
ɳ ee
ɳ baseline− 1) x (
𝐸𝐹𝐿𝐻 ℎ𝑒𝑎𝑡𝑖𝑛𝑔
100)
where:
kWh = Annual electric energy savings
kW = Peak coincident demand electric savings
therms = Annual gas energy savings
units = Number of measures installed under the program
kBTUhin = Fuel Input Rating
ɳ ee = Energy efficient condition or measure
ɳ baseline = Baseline condition or measure
𝐸𝐹𝐿𝐻 ℎ𝑒𝑎𝑡𝑖𝑛𝑔 = Equivalent full-load hours
100 = Conversion factor, (kBTU / Therm)
Summary of Variables and Data Sources
Variable Value Notes
kBTUhin / unit Nominal heating input capacity is the nameplate input
rating of the unit in kBTU/ hr, from application.
baseline
See Baseline
Efficiency
Baseline established by applicable energy
conservation code, climatic zone, equipment type and
size, fuel source, as well as system configuration.
ee
See Compliance
Efficiency
From application; use metrics consistent with baseline
EFLHheating Lookup based on building type and location, Appendix G
Efficiency is expressed as the ratio between the fuel input relative to the output. The efficiency
of furnace, boilers, and unit heaters is customarily evaluated on the basis of one or more of three
standards, and are referred to as Thermal Efficiency (Et), Combustion Efficiency, (Ec) or Annual

Residential and Multi-Family Measures Record of Revision 1-16-2
Fuel Utilization Efficiency (AFUE) values respectively.
Presently the AFUE value is only applicable to smaller units. For larger units use thermal and
combustion efficiencies referenced on manufacturer’s nameplate data in accordance with
nationally recognized standards and testing agencies.
Coincidence Factor (CF)
The recommended value for the coincidence factor is N/A.
Baseline Efficiencies From Which Savings are Calculated
The baseline efficiency for residential furnaces, boilers, and unit heaters (base ) is defined by
the Code of Federal Regulations (CFR) and subsequently adopted by the Energy Conservation Code of New York State¹, and the New York City Energy Conservation Code² as shown below:

Residential and Multi-Family Measures Record of Revision 1-16-2
Equipment Type (natural
gas) Size Range
ECCCNYS Minimum
Efficiency for climate
zones 4, 5, and-6
NYCECC Minimum
Efficiency for
NYC boroughs in climate
zone 4
Warm Air Furnace, gas fired
< 225 kBtu/h 78% AFUE or 80% AFUE or
80% Et 80% Et
≥ 225 kBtu/h and < 500 kBtu/h
80% Et 81% Et ≥ 500 kBtu/h and < 1,000 kBtu/h
≥ 1,000 kBtu/h
Warm Air Unit Heaters,
gas fired All Capacities 80% Ec 80% Ec
Boiler, non-condensing, hot
water, gas fired
< 300 kBtu/h 80% AFUE 82% AFUE
≥ 300 kBtu/h and < 500 kBtu/h
80% Et 83% Et ≥ 500 kBtu/h and < 1,000 kBtu/h
≥ 1,000 kBtu/h and ≤ 2,500 kBtu/h
> 2,500 kBtu/h 82% Ec 85% Ec
Boiler, condensing, hot water,
gas fired
< 300 kBtu/h 80% AFUE 82% AFUE
≥ 300 kBtu/h and < 500 kBtu/h
80% Et 83% Et ≥ 500 kBtu/h and < 1,000 kBtu/h
≥ 1,000 kBtu/h and ≤ 2,500 kBtu/h
> 2,500 kBtu/h 82% Ec 85% Ec
Boilers, steam, all except
natural draft
< 300 kBtu/h 75% AFUE 80% AFUE
≥ 300 kBtu/h and 79% Et 80% Et
≤ 2,500 kBtu/h
> 2,500 kBtu/h 79% Et 80% Et
Boilers, steam, natural draft
< 300 kBtu/h 75% AFUE 80% AFUE
≥ 300 kBtu/h and 77% Et 79% Et
≤ 2,500 kBtu/h
> 2,500 kBtu/h 77% Et 79% Et

Residential and Multi-Family Measures Record of Revision 1-16-2
Compliance Efficiencies From Which Incentives are Calculated
Equipment Type
(natural gas) Size Range
Minimum Compliance
Efficiency for climate
zones 4, 5, and-6
Minimum Compliance
Efficiency for
NYC boroughs in climate
zone 4
Warm Air Furnace, gas fired
< 225 kBtu/h 92% AFUE 92% AFUE
≥ 225 kBtu/h and < 500 kBtu/h
90% Et 90% Et ≥ 500 kBtu/h and < 1,000 kBtu/h
≥ 1,000 kBtu/h
Warm Air Unit Heaters,
gas fired All Capacities 83% Ec 83% Ec
Boiler, non-condensing, hot
water, gas fired
< 300 kBtu/h 85% AFUE 85% AFUE
≥ 300 kBtu/h and < 500 kBtu/h
85% Et 85% Et ≥ 500 kBtu/h and < 1,000 kBtu/h
≥ 1,000 kBtu/h and ≤ 2,500 kBtu/h
> 2,500 kBtu/h 88% Ec 88% Ec
Boiler, condensing, hot water, gas fired
< 300 kBtu/h 90% AFUE 90% AFUE
≥ 300 kBtu/h and < 500 kBtu/h
90% Et 90% Et ≥ 500 kBtu/h and < 1,000 kBtu/h
≥ 1,000 kBtu/h and ≤ 2,500 kBtu/h
> 2,500 kBtu/h 93% Ec 93% Ec
Boilers, steam, all except
natural draft
< 300 kBtu/h 82% AFUE 82% AFUE
≥ 300 kBtu/h and 82% Et 82% Et
≤ 2,500 kBtu/h
> 2,500 kBtu/h 82% Ec 82% Ec
Boilers, steam, natural draft
< 300 kBtu/h 82% AFUE 82% AFUE
≥ 300 kBtu/h and 82% Et 82% Et
≤ 2,500 kBtu/h
> 2,500 kBtu/h 82% Ec 82% Ec
Operating Hours
Heating equivalent full-load hours were calculated from a DOE-2.2 simulation of prototypical
single and multi-family residential buildings. Operating hour assumptions for the prototypical
building models are described in Appendix A. The heating EFLH for commercial buildings in
NY are shown in Appendix G.
Effective Useful Life (EUL)³
Furnaces, Gas Fired 18 Years
Unit Heater, Gas Fired 13 Years
Boilers, Hot Water – Steel Water Tube 24 Years
Boilers, Hot Water – Steel Fire Tube 25 Years
Boilers, Hot Water – Cast Iron 35 Years
Boilers, Steam – Steel Water Tube 30 Years
Boilers, Steam – Steel Fire Tube 25 Years
Boilers, Steam – Cast Iron 30 Years
Residential and Multi-Family Measures Record of Revision 1-16-2
Ancillary Fossil Fuel Savings Impacts
Ancillary Electric Savings Impacts
High efficiency furnaces may be packaged with high efficiency cooling equipment and/or electronically commutated blower motors, which may provide electricity savings. Draft fans,
when present, will increase electricity consumption.
References
1. ECCCNYS 2010
2. NYCECCC 2014
3. Comparison of Service Life Estimates, 2015 ASHRAE Handbook - Applications
Record of Revision
Record of Revision Number Issue Date
1 10/15/2010
6-15-7 6/1/2015
1-16-2 1/1/2016
Return to Table of Contents

Single and Multi-Family Residential Measures Record of Revisions 1-16-3
LIGHTING
LIGHT EMITTING DIODE (LED), COMPACT FLUORESCENT LAMP (CFL),
AND OTHER LIGHTING TECHNOLOGIES
Measure Description
This section covers energy-efficient lighting equipment, such as energy-efficiency lamps,
energy-efficiency ballasts, compact fluorescent lamps, LED lamps, and improved lighting
fixtures. These technologies, taken separately or combined into an energy-efficient lighting
fixture, provide the required illumination at reduced input power.
Standard Calculation Method for Annual Energy and Peak Coincident Demand Savings
Annual Electric Energy Savings
kWh = (units × (1-leakage)) × ΔW / 1,000 × hrsop. × (1 + HVACc)
Peak Coincident Demand Savings
kW = ((units × (1-leakage)) × ΔW / 1,000 × (1 + HVACd) × 0.08
Annual Gas Energy Savings
therms = ((units × (1-leakage)) × (kWh × 3.412 BTU) × HVACg
Alternative Calculation Method for Annual Energy and Peak Coincident Demand Savings
Annual Electric Energy Savings
kWh = (units × (1-leakage)) × (W x F) / 1,000 × hrsop. × (1 + HVACc)
Peak Coincident Demand Savings
kW = ((units × (1-leakage)) × (W x F) / 1,000 × (1 + HVACd) × 0.08
Annual Gas Energy Savings
therms = ((units × (1-leakage)) × ((W x F) × 3.412 BTU)) × HVACg

Single and Multi-Family Residential Measures Record of Revisions 1-16-3
where:
kWh = Annual Electric Energy Savings
kW = Peak Coincident Demand Savings
therms = Annual Gas Energy Savings
Units = Number of Measures Installed
1,000 = Conversion factor, one kW equals 1,000 watts
leakage = Percentage of Units Not Installed in Service Territory, Estimated Percentage
Δ = Change, Savings or Consumption
W = Watts, Rated Wattage of Lamp and/or Fixture
baseline = Baseline Condition
ee = Energy Efficient Measure
0.08 = Coincidence Factor, Average Summer Value
hrsop. = Operating Hours
F = Conversion Factor, Alternative Method, see Table for value
3.412 = Conversion Factor, one watt/h equals 3.412142 BTU
HVACc = HVAC Interaction Factor for annual electric energy consumption
HVACd = HVAC Interaction Factor at utility summer peak hour
HVACg = HVAC Interaction Factor for annual natural gas consumption
Summary of Variables and Data Sources
Variable Value Notes
units From application, invoices or other documentation.
Equal to number of lamps installed and operating.
F see Table for value Conversion Factor, Alternative Method
W Energy Efficient measure watts, for use with Alternative
Method
ΔW Wattsbaseline –
Wattsee
For LEDs, CFLs and other lighting (not including
incandescent or halogen lamp replacement), For use with
Standard Method
hrsoperating 1,168 (lamps)
913 (fixtures) Lighting operating hours
Coincidence
factor 0.08 Use average summer value
HVACc
HVAC interaction factor for annual electric energy
consumption. Vintage and HVAC type weighted
average by city (see Appendix D)
HVACd
HVAC interaction factor at utility summer peak hour.
Vintage and HVAC type weighted average by city (see
Appendix D)
HVACg
HVAC interaction factor for annual natural gas
consumption. Vintage and HVAC type weighted
average by city (see Appendix D)

Single and Multi-Family Residential Measures Record of Revisions 1-16-3
Estimated Conversion Factor when Using the Alternative Calculation Method
F Conversion Factor for Replacement Lamps
2.53 Replacement of Incandescent with Compact Fluorescent Lamp (CFL)
1.55 Replacement of Halogen with Compact Fluorescent Lamp (CFL)
4.94 Replacement of Incandescent with Light Emitting Diode Lamp (LED)
0.53 Replacement of Compact Fluorescent Lamp with Light Emitting Diode Lamp (LED)
The alternative calculation method is only applicable when the rated wattage of the unit to be
replaced cannot otherwise be determined. When the type of lamp to be replaced is not known, it
is assumed that the lamp is incandescent.
Operating Hours
Lamps
Hours of operation for lamps are estimated to be 3.2 operating hours per day or 1168 (3.2 x 365)
hours per year. The 3.2 operating hours per day is a value derived from an extended (nine month
– May through February) logger study conducted during 2003 in Massachusetts, Rhode Island,
and Vermont.1 The Connecticut 2008 Program Savings Documentation uses 2.6 hours per day,
based on a 2003 Connecticut-based study. A study of the 2005-2006 residential lighting
program for Efficiency Maine reports daily hours of use at 4.8 hours from the markdown
program component and 3.2 from the coupon program component.2 This value represents a
trade-off among factors that may affect the extent to which any out-of New York State value is
applicable to NY. These include such factors as differences between the study area and NY,
related to maturity of the CFL markets, program comparability, consumer knowledge of CFLs,
and mix of locations within the house (which affects average hours of use). On balance, in
considering the data and reports reviewed to date, 3.2 appears to be the most reasonable prior to
New York-specific impact studies. This value is appropriate for interior applications only.
Fixtures
Hours of operation for fixtures are estimated to be 2.5 operating hours per day or 913 (2.5 x 365)
hours per year. The 2.5 operating hours per day is a value derived from an extended (nine month
– May through February) logger study conducted during 2003 in Massachusetts, Rhode Island,
and Vermont.3 The Connecticut 2008 Program Savings Documentation uses 2.6 hours per day,
1 “Extended residential logging results” by Tom Ledyard, RLW Analytics Inc. and Lynn Heofgen, Nexus Market
Research Inc., May 2, 2005, p.1. 2 Process and Impact Evaluation of the Efficiency Maine Lighting Program, RLW Analytics, Inc, and Nexus
Market Research Inc., April 10, 2007, Table 1-2, p. 12. 3 “Extended residential logging results” by Tom Ledyard, RLW Analytics Inc. and Lynn Heofgen, Nexus Market
Research Inc., May 2, 2005, p.1.

Single and Multi-Family Residential Measures Record of Revisions 1-16-3
based on a 2003 Connecticut-based study. A study of the 2005-2006 residential lighting
program for Efficiency Maine reports daily hours of use at 2.4 for interior fixtures.4 The
proposed value represents a trade-off among factors that may affect the extent to which any
value from outside of New York State is applicable to NY. These include such factors as
differences between the study area and NY related to maturity of the CFL markets, program
comparability, consumer knowledge of CFLs, and mix of locations within the house (which
affects average hours of use). On balance, in considering the data and reports reviewed to date,
2.5 appears to be the most reasonable prior to New York specific impact studies.
Leakage (In-Service Rate) This defined term is used to describe unit that may not ultimately be placed in to service within
the utility territory. Leakage occurs primarily in retail and educational (upstream) programs,
where the Program Administrator does not have control over either who purchases the lamps or
where they are ultimately installed therefore reducing the anticipated savings.
The values are used to estimate savings per lamp, and must be multiplied by the number of lamps
installed and operating. For some programs, such as upstream programs, an adjustment to the
unit count must be made for lamps that may have been placed in inventory and not sold, sold to
customers living outside New York State, or placed into storage and not used.
Coincidence Factor (CF)
The coincidence factors were derived from an examination of studies throughout New England
that calculated coincident factors based on the definition of system peak period at the time, as
specified by the New England Power Pool and later, ISO-New England.
Lighting Summer On-Peak Hours
(1PM-5PM) Coincidence Factor
June 0.07 July 0.09
August 0.09 Average Summer 0.08
Lighting Winter On-Peak Hours
(5pm – 7pm) Coincidence Factor
December 0.28 January 0.32
Average Winter 0.30
Baseline Efficiencies from which Savings are Calculated
The Baseline Efficiency is defined as the fixture wattage of the lamp or lighting fixture. The
baseline condition is assumed to be the existing operational lamp or lighting fixture in all
applications other than when required by the applicable energy conservation code to be replaced
with minimally compliant lamps or fixtures. When labeled ratings are not available, see table of
standard fixture wattages in Appendix C.
4 Process and Impact Evaluation of the Efficiency Maine Lighting Program, RLW Analytics, Inc, and Nexus
Market Research Inc., April 10, 2007, Table 1-2, p. 12.

Single and Multi-Family Residential Measures Record of Revisions 1-16-3
Compliance Efficiencies from which Savings are Calculated
Effective Useful Life (EUL)
See Appendix P: Effective Useful Life (EUL)
Ancillary Fossil Fuel Savings Impacts
Ancillary Electric Savings Impacts
References
1. This method is based on the documentation provided in the CL&P and UI Program
Savings Documentation for 2008 Program Year.
2. Other similar reports under review include the Efficiency Vermont and Efficiency Maine
Technical Reference User Manuals.
3. Impact evaluations of residential lighting programs in several New England states
reviewed in preparing the proposed hours-of-use values and coincidence factors include:
a. Impact Evaluation of the Massachusetts, Rhode Island, and Vermont 2003
Residential Lighting Programs, prepared for Cape Light Compact, Vermont
Public Service Department, National Grid Massachusetts and Rhode Island,
Western Massachusetts Electric Company, NSTAR Electric, Fitchburg G&E by
Nexus Market Research Inc., and RLW Analytics Inc., Oct 1, 200;
4. “Extended residential logging results” memo to Angela Li, National Grid, by Tom
Ledyard, RLW Analytics Inc., and Lynn Hoefgen, Nexus Market Research Inc., May 2,
2005;
5. Market Progress and Evaluation Report for the 2005 Massachusetts ENERGY STAR
Lighting Program, prepared for Cape Light Compact, National Grid – Massachusetts,
NSTAR, Western Massachusetts Electric Company by Nexus Market Research Inc, RLW
Analytics, Inc., Shel Feldman Management Company, Dorothy Conant. September 29,
2006;
6. Process and Impact Evaluation of the Efficiency Maine Lighting Program, prepared for
Efficiency Maine by Nexus Market Research Inc. and RLW Analytics Inc., April 10,
2007;
7. Coincidence Factor Study Residential and Commercial & Industrial Lighting Measures -
For use as an Energy Efficiency Measures/Programs Reference Document for the ISO
Forward Capacity Market (FCM), prepared for the New England State Program Working
Group by RLW Analytics Inc., Spring 2007
8. CFL to incandescent lamp wattage equivalency ratios taken from the 2008 Database for
Energy Efficiency Resources (DEER) update. See www.deeresources.com for more
information.
Single and Multi-Family Residential Measures Record of Revisions 1-16-3
Record of Revision
Record of Revision Number Issue Date
1 10/15/2010
7-13-2 7/31/2013
6-15-3 6/1/2015
1-16-3 1/1/2016
Return to Table of Contents

Commercial and Industrial Measures Record of Revision 1-16-4
FURNACE AND BOILER
Measure Description
This measure includes high efficiency gas fired furnaces, boilers, and unit heaters in buildings except
low-rise residential building applications.
Method for Calculating Annual Energy and Peak Coincident Demand Savings
Annual Electric Energy Savings
kWh = N/A
Peak Coincident Demand Savings
kW = N/A
Annual Gas Energy Savings
∆therms = units x (kBTUhin
unit) x (
ɳ ee
ɳ baseline− 1) x (
𝐸𝐹𝐿𝐻 ℎ𝑒𝑎𝑡𝑖𝑛𝑔
100)
where:
kWh = Annual electric energy savings
kW = Peak coincident demand electric savings
therms = Annual gas energy savings
units = Number of measures installed under the program
kBTUhin = Fuel input rating
ɳ ee = Energy efficient condition or measure
ɳ baseline = Baseline condition or measure
𝐸𝐹𝐿𝐻 ℎ𝑒𝑎𝑡𝑖𝑛𝑔 = Equivalent full-load hours
100 = Conversion factor, (kBTU / Therm)
Summary of Variables and Data Sources
Variable Value Notes
kBTUhin / unit Nominal heating input capacity is the nameplate input rating
of the unit in kBTU/ hr, from application.
baseline See Baseline
Efficiency
Baseline established by applicable energy conservation
code, climatic zone, equipment type and size, fuel source, as
well as system configuration.
ee See Compliance
Efficiency
From application; use metrics consistent with baseline
EFLHheating Lookup based on building type and location, Appendix G
Efficiency is expressed as the ratio between the fuel input relative to the output. The efficiency of
furnace, boilers, and unit heaters is customarily evaluated on the basis of one or more of three
standards, and are referred to as Thermal Efficiency (Et), Combustion Efficiency, (Ec) or Annual
Fuel Utilization Efficiency (AFUE) values respectively.
Presently the AFUE value is only applicable to smaller units. For larger units use thermal and
combustion efficiencies referenced on manufacturer’s nameplate data in accordance with nationally
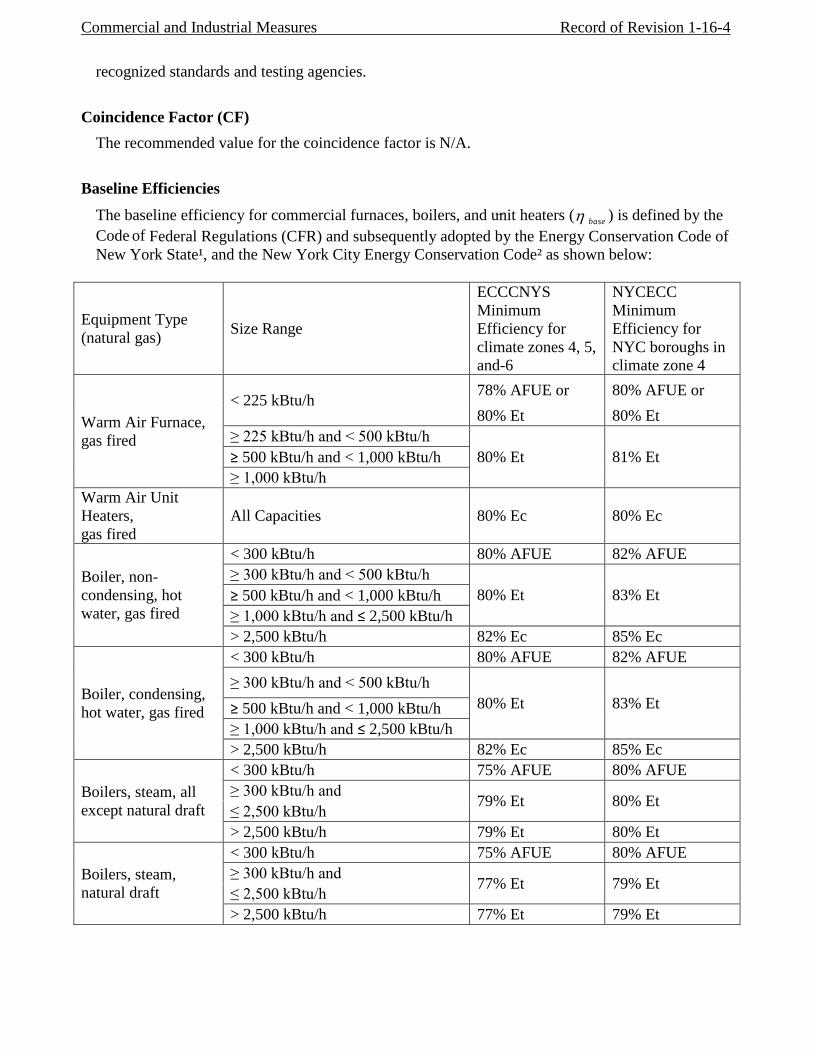
Commercial and Industrial Measures Record of Revision 1-16-4
recognized standards and testing agencies.
Coincidence Factor (CF)
The recommended value for the coincidence factor is N/A.
Baseline Efficiencies
The baseline efficiency for commercial furnaces, boilers, and unit heaters (base ) is defined by the
Code of Federal Regulations (CFR) and subsequently adopted by the Energy Conservation Code of
New York State¹, and the New York City Energy Conservation Code² as shown below:
Equipment Type
(natural gas) Size Range
ECCCNYS
Minimum
Efficiency for
climate zones 4, 5,
and-6
NYCECC
Minimum
Efficiency for
NYC boroughs in
climate zone 4
Warm Air Furnace,
gas fired
< 225 kBtu/h 78% AFUE or 80% AFUE or
80% Et 80% Et
≥ 225 kBtu/h and < 500 kBtu/h
80% Et 81% Et ≥ 500 kBtu/h and < 1,000 kBtu/h
≥ 1,000 kBtu/h
Warm Air Unit
Heaters,
gas fired
All Capacities 80% Ec 80% Ec
Boiler, non-
condensing, hot
water, gas fired
< 300 kBtu/h 80% AFUE 82% AFUE
≥ 300 kBtu/h and < 500 kBtu/h
80% Et 83% Et ≥ 500 kBtu/h and < 1,000 kBtu/h
≥ 1,000 kBtu/h and ≤ 2,500 kBtu/h
> 2,500 kBtu/h 82% Ec 85% Ec
Boiler, condensing,
hot water, gas fired
< 300 kBtu/h 80% AFUE 82% AFUE
≥ 300 kBtu/h and < 500 kBtu/h
80% Et 83% Et ≥ 500 kBtu/h and < 1,000 kBtu/h
≥ 1,000 kBtu/h and ≤ 2,500 kBtu/h
> 2,500 kBtu/h 82% Ec 85% Ec
Boilers, steam, all
except natural draft
< 300 kBtu/h 75% AFUE 80% AFUE
≥ 300 kBtu/h and 79% Et 80% Et
≤ 2,500 kBtu/h
> 2,500 kBtu/h 79% Et 80% Et
Boilers, steam,
natural draft
< 300 kBtu/h 75% AFUE 80% AFUE
≥ 300 kBtu/h and 77% Et 79% Et
≤ 2,500 kBtu/h
> 2,500 kBtu/h 77% Et 79% Et

Commercial and Industrial Measures Record of Revision 1-16-4
Compliance Efficiencies
Equipment Type
(natural gas) Size Range
Minimum
Compliance
Efficiency for
climate zones 4, 5,
and-6
Minimum
Compliance
Efficiency for
NYC boroughs in
climate zone 4
Warm Air Furnace,
gas fired
< 225 kBtu/h 92% AFUE 92% AFUE
≥ 225 kBtu/h and < 500 kBtu/h
90% Et 90% Et ≥ 500 kBtu/h and < 1,000 kBtu/h
≥ 1,000 kBtu/h
Warm Air Unit
Heaters,
gas fired
All Capacities 83% Ec 83% Ec
Boiler, non-
condensing, hot
water, gas fired
< 300 kBtu/h 85% AFUE 85% AFUE
≥ 300 kBtu/h and < 500 kBtu/h
85% Et 85% Et ≥ 500 kBtu/h and < 1,000 kBtu/h
≥ 1,000 kBtu/h and ≤ 2,500 kBtu/h
> 2,500 kBtu/h 88% Ec 88% Ec
Boiler, condensing,
hot water, gas fired
< 300 kBtu/h 90% AFUE 90% AFUE
≥ 300 kBtu/h and < 500 kBtu/h
90% Et 90% Et ≥ 500 kBtu/h and < 1,000 kBtu/h
≥ 1,000 kBtu/h and ≤ 2,500 kBtu/h
> 2,500 kBtu/h 93% Ec 93% Ec
Boilers, steam, all
except natural draft
< 300 kBtu/h 82% AFUE 82% AFUE
≥ 300 kBtu/h and 82% Et 82% Et
≤ 2,500 kBtu/h
> 2,500 kBtu/h 82% Ec 82% Ec
Boilers, steam,
natural draft
< 300 kBtu/h 82% AFUE 82% AFUE
≥ 300 kBtu/h and 82% Et 82% Et
≤ 2,500 kBtu/h
> 2,500 kBtu/h 82% Ec 82% Ec
Operating Hours
Heating equivalent full-load hours were calculated from a DOE-2.2 simulation of prototypical small
commercial buildings. Operating hour assumptions for the prototypical building models are described
in Appendix A. The heating EFLH for commercial buildings in NY are shown in Appendix G.
Effective Useful Life (EUL)³
Furnaces, Gas Fired 18 Years
Unit Heater, Gas Fired 13 Years
Boilers, Hot Water – Steel Water Tube 24 Years
Boilers, Hot Water – Steel Fire Tube 25 Years
Boilers, Hot Water – Cast Iron 35 Years
Boilers, Steam – Steel Water Tube 30 Years
Boilers, Steam – Steel Fire Tube 25 Years
Boilers, Steam – Cast Iron 30 Years

Commercial and Industrial Measures Record of Revision 1-16-4
Ancillary Fossil Fuel Savings Impacts
Ancillary Electric Savings Impacts
High efficiency furnaces may be packaged with high efficiency cooling equipment and/or
electronically commutated blower motors, which may provide electricity savings. Draft fans, when
present, will increase electricity consumption.
References
1. ECCCNYS 2010
2. NYCECCC 2014
3. Comparison of Service Life Estimates, 2015 ASHRAE Handbook - Applications
Record of Revision
Record of Revision Number Issue Date
1 10/15/2010
6-15-7 6/1/2015
1-16-4 1/1/2016
Return to Table of Contents

Commercial and Industrial Measures Record of Revision 1-16-5
HEATING, VENTILATION AND AIR CONDITIONING (HVAC) – CONTROL
THERMOSTAT
PROGRAMMABLE SETBACK (NON-COMMUNICATING) AND WIFI
(COMMUNICATING)
MEASURE DESCRIPTION
This section covers programmable setback thermostats (non-communicating) and Wi-Fi communicating thermostats applied to air conditioners, heat pumps and/or furnaces and boilers in small commercial buildings.
Measure Description
Programmable setback thermostats applied to air conditioners, heat pumps and/or furnaces and boilers in small commercial buildings.
Method for Calculating Annual Energy and Peak Coincident Demand Savings
Annual Electric Energy Savings
ΔkWh = units × (tons/unit × SEER
12
× EFLHcooling × ESFcooling) + (
unit
kBTUhout ×
HSPF
EFLH heating × ESFheating)
Peak Coincident Demand Savings
ΔkW = N/A
Annual Gas Energy Savings
Δtherms = units ×
unit
kBTUh in × 100
EFLH heating × ESFheating
where: ΔkWh = Annual electric energy savings ΔkW = Peak coincident demand electric savings Δtherms = Annual gas energy savings units = Number of measures installed under the program CF = Coincidence factor tons/unit = Tons of air conditioning per unit, based on nameplate data heating = Heating system cooling = Cooling system out = Output capacity in = Input capacity

Commercial and Industrial Measures Record of Revision 1-16-5
12 = kBTUh/ton of air conditioning capacity ESF = Energy savings factor SEER = Seasonal average energy efficiency ratio over the cooling season, BTU/watt-hour,
(used for average U.S. location/region)
HSPF = Heating seasonal performance factor (BTU/watt-hr), a measure of the seasonal
average efficiency of the heat pump in the heating mode EFLH = Equivalent full-load hours
Summary of Variables and Data Sources
Variable Value Notes
tons
From application, or use 5 ton as default. Use 0 if no central cooling
SEERbaseline 10 EFLHcooling Vintage weighted average by city. ESFcooling 0.09 If heat pump:
kBTUh/unitout
The nominal rating of the heating output capacity of the heat pump in kBTU/hr (including supplemental heaters), from application.
HSPFbaseline 6.8 If furnace:
kBTUhin/unit
The nominal rating of the heating input capacity of furnace or boiler kBTUh, from application.
If boiler: kBTUhin/unit From application.
EFLHheating Vintage weighted average by city. ESFheating 0.068 The SEER is an estimate of the seasonal energy efficiency for an average US city. The EERpk is an estimate of the efficiency of the unit under peak summer conditions. See the section on packaged air conditioners above for more information. The HSPF is an estimate of the seasonal heating energy efficiency for an average US city. See section on air source heat pumps above for more information. The average seasonal efficiency of the furnace is the ratio of the heating output to the fuel input (in consistent units) over a heating season. See section on high efficiency furnaces above for more information. The nominal rating of the cooling capacity of the air conditioner or heat pump should set equal to the rated capacity of all cooling equipment controlled by a setback thermostat in the building. The nominal rating of the heating capacity of the furnace should set equal to the rated input capacity of all heating equipment controlled by a setback thermostat in the commercial facility. Nameplate capacity for heat pumps should include the full output heating capacity of the heat pump system, including backup electric resistance heaters. The Energy Savings Factor (ESF) is the ratio of the energy savings resulting from installation of a programmable setback thermostat to the annual cooling energy.

Commercial and Industrial Measures Record of Revision 1-16-5
Coincidence Factor (CF)
The recommended value for the coincidence factor is N/A
Baseline Efficiencies from which Savings are Calculated
The baseline efficiency for air conditioners and heat pumps should be set to according to the sections on air conditioner and heat pump efficiency above. Studies of residential heating thermostat set point behavior indicate some amount of manual setback adjustment in homes without programmable thermostats. This behavior is assumed to be present in the small commercial buildings addressed in this Tech Manual.
Compliance Efficiency from which Incentives are Calculated
The energy savings factor (ESF) assumption is taken from a study of programmable thermostat savings in Massachusetts conducted by GDS Associates for KeySpan Energy Delivery. The study estimated an energy savings of 3.6% of the annual heating energy consumption for programmable setback thermostats in residential applications. This assumption is also applied to the small commercial buildings addressed in this Tech Manual.
Operating Hours
Heating equivalent full-load hours calculated from building energy simulation models described in Appendix A and summarized in Appendix G.
Effective Useful Life (EUL)
Years: 11 Source: DEER
Ancillary Fossil Fuel Savings Impacts
Ancillary Electric Savings Impacts
References
1. Energy Saving Factor for setback thermostats taken from “Programmable Thermostats. Report to KeySpan Energy Delivery on Energy Savings and Cost Effectiveness,” GDS Associates, Marietta, GA. 2002.
Record of Revision
Record of Revision Number Issue Date 1 10/15/2010
Return to Table of Contents

Commercial and Industrial Measures Record of Revision 1-16-5
THERMOSTAT – Wi-Fi (COMMUNICATING)
Measure Description This section covers Wi-Fi communicating thermostats applied to small commercial buildings with natural gas heat boilers or furnaces, electric heat pumps, electric resistance heating or central air conditioners. These communicating thermostats allow set point adjustment via a remote application. The unit must contain an outdoor air temperature algorithm in the unit’s control logic to operate the primary heating and cooling systems. Method for Calculating Annual Energy and Peak Coincident Demand Savings Unit savings are deemed based on a recent evaluation study from New England1. Annual Gas Energy Savings
Δtherms = Annual gas savings per thermostat unit of 63 therms. Annual Electric Energy Savings (Cooling) ΔkWh = Annual electric energy savings per thermostat unit of 104 kWh. Peak Coincident Demand Savings ΔkW = Annual peak demand savings per thermostat unit of 0.23 kW.
Baseline Efficiencies from which Savings are Calculated The baseline efficiency is an HVAC system using natural gas or electricity to provide space heating with either a manual or a programmable thermostat. Compliance Efficiency from which Incentives are Calculated The higher energy efficiency level is an HVAC system that has a Wi-Fi thermostat installed.
Effective Useful Life (EUL) Years: 11 Source: DEER
Record of Revision
Record of Revision Number Issue Date 1-16-5 1/1/2016
Return to Table of Contents
1 Cadmus Group (September 2012) Wi-Fi Programmable Controllable Thermostat Pilot Program Evaluation for the Electric and Gas Program Administrators of Massachusetts

Commercial and Industrial Measures Record of Revisions 1-16-6
LIGHTING
INTERIOR AND EXTERIOR LAMPS AND FIXTURES
Measure Description
This section covers energy-efficient lighting equipment, such as energy-efficiency lamps,
energy-efficiency ballasts, compact fluorescent lamps, LED lamps, and improved lighting
fixtures. Energy-efficient lamps may include fluorescent lamps, LED lamps, HID lamps, and
incandescent lamps. Improved lighting fixtures may include reflectors and other optical
improvements to lighting fixtures. These technologies, taken separately or combined into an
energy-efficient lighting fixture, provide the required illumination at reduced input power.
Method for Calculating Annual Energy and Peak Coincident Demand Savings
Annual Electric Energy Savings
ΔkWh =
1,000
units) (W units) (W eebaseline × hrsoperating × (1 + HVACc)
Peak Coincident Demand Savings
ΔkW =
1,000
units) (W units) (W eebaseline × (1+ HVACd) × CF
Annual Gas Energy Savings
Δtherm = units × ΔkWh × HVACg
New construction, space renovations, or remodels may require a building permit that includes
compliance with local or state energy codes. In these instances, the applicable energy code
defines the baseline. The energy consumption of the efficient and baseline lighting systems are
defined in terms of the lighting power density (LPD) in watts per square foot. An alternate form
of the lighting equations based on LDP is as follows:
Annual Electric Energy Savings
ΔkWh = area ×
1,000
LPD LPD eebaseline × hrsoperating × (1+ HVACg)
Peak Coincident Demand Savings
ΔkW = area ×
1,000
LPD LPD eebaseline× (1 + HVACd) × CF

Commercial and Industrial Measures Record of Revisions 1-16-6
Annual Gas Energy Savings
Δtherm = units × ΔkWh × HVACg
where:
kWh = Annual electric energy savings
kW = Peak coincident demand electric savings
therms = Annual gas energy savings
units = Number of measures installed under the program
CF = Coincidence factor
ee = Energy efficient condition or measure
baseline = Baseline condition or measure
area = Extent of space or surface
1,000 = Conversion factor, one kW equals 1,000 watts
LPD = Lighting power density
W = Watts
hrsoperating = Lighting operating hours
HVACc = HVAC interaction factor for annual electric energy consumption
HVACd = HVAC interaction factor at utility summer peak hour
HVACg = HVAC interaction factor for annual natural gas consumption
Summary of Variables and Data Sources
Variable Value Notes
Unitsbaseline Number of baseline measures, from application, set equal
to Unitsee if unknown
Unitsee Number of energy efficient measures installed under the
program, from application.
Wee Watts Connected load of the energy-efficient unit, from
application
Wbaseline Watts Connected load of the baseline unit(s) displaced, from
application
hrsoperating Lighting operating hours. From application or default, as
listed below in the Operating Hours table.
LPDbaseline
Lighting power density (W/SF) for baseline measure, from
application, based on NY State Energy Conservation code.
New construction or major renovation only.
LPDee
Lighting power density (W/SF) for energy efficient
measure, from application, based on installed system
design. New construction or major renovation only.
area floor area illuminated by lighting system (SF)
HVACd
HVAC interaction factor at utility summer peak hour,
lookup by building type with weighted average across
HVAC types. Average upstate values or NYC. Use 0 for
lights in unconditioned space.
HVACc HVAC interaction factor for annual electric energy

Commercial and Industrial Measures Record of Revisions 1-16-6
Variable Value Notes
consumption, lookup by building type with weighted
average across HVAC types. Average upstate values or
NYC. Use 0 for lights in unconditioned space.
HVACg
HVAC interaction factor for annual natural gas
consumption, lookup by building type with weighted
average across HVAC types. Average upstate values or
NYC. Use 0 for lights in unconditioned space.
Building type From application.
City From application
Fixture
location Indoor, outdoor
From application; assume indoor if not known
Wattsee is defined as the fixture wattage of the efficient lighting fixture. See table of standard
fixture wattages in Appendix C. Manufacturers’ cut sheet data for fixture watts can be
substituted for the typical values in Appendix C if available.
Wattsbaseline is defined as the fixture wattage of the baseline lighting fixture. The baseline
condition is assumed to be the existing and operational lighting fixture in all applications other
than new construction or extensive renovations that trigger the building code. See table of
standard fixture wattages in Appendix C.
Code LPD shall be taken from New York State Energy Conservation Code that is based on
ASHRAE 90.1-2007. Use the appropriate LPD based on the building type or space occupancy
as applicable.
Coincidence Factor (CF)
Defined as the ratio of the peak lighting demand operating at the time of the system peak to the
connected load. Because not all of the fixtures in the population are operating at all times, the
peak lighting demand is often less than the connected load. Occupant control of the lighting
systems and burned-out lamps cause some portion of the fixtures to be non-operational. In
lighting retrofit programs, the pre-retrofit (baseline) demand diversity factor is often lower than
the post-retrofit demand diversity factor, due to burned out lamps that are replaced as part of the
program.
For many utilities, summer peak demand occurs in the afternoon, indicating a recommended
value for the coincidence factor for interior lighting is 1.0, and since exterior lighting is generally
off during daylight hours, the recommended value is 0.0
The HVAC system interaction factor is defined as the ratio of the cooling energy reduction per
unit of lighting energy reduction. Most of the input energy for lighting systems is converted to
heat that must be removed by the HVAC system. Reductions in lighting heat gains due to
lighting power reduction decrease the need for space cooling and increase the need for space
Commercial and Industrial Measures Record of Revisions 1-16-6
heating. HVAC interaction factors vary by climate, HVAC system type and building type.
Recommended values for HVAC interaction factors for lighting energy and peak demand
savings are shown in Appendix D. Lighting systems in unconditioned spaces or on the building
exterior will have interaction factors of 0.0. The building types for the HVAC interactive effect
factors by facility type are shown in the lighting Operating Hours table below.
Baseline Efficiencies from which Savings are Calculated
The baseline condition is assumed to be the existing and operational lighting fixture in all
applications other than new construction or extensive renovations that trigger the building code.
See table of standard fixture wattages in Appendix C. Note, depending on local codes, new
construction, space renovations or remodels may require a building permit that includes
compliance with local or state energy codes. In these instances, the applicable energy code
defines the baseline.
Compliance Efficiency from which Incentives are Calculated
Efficient lighting fixtures as defined by the program. See table of standard fixture wattages in
Appendix C. Manufacturers’ cut sheets may substitute for the standard fixture watts in
Appendix C if available. In new construction or major renovation projects, the new lighting
system power consumption should be expressed as a lighting power density (LPD) in watts per
square foot.
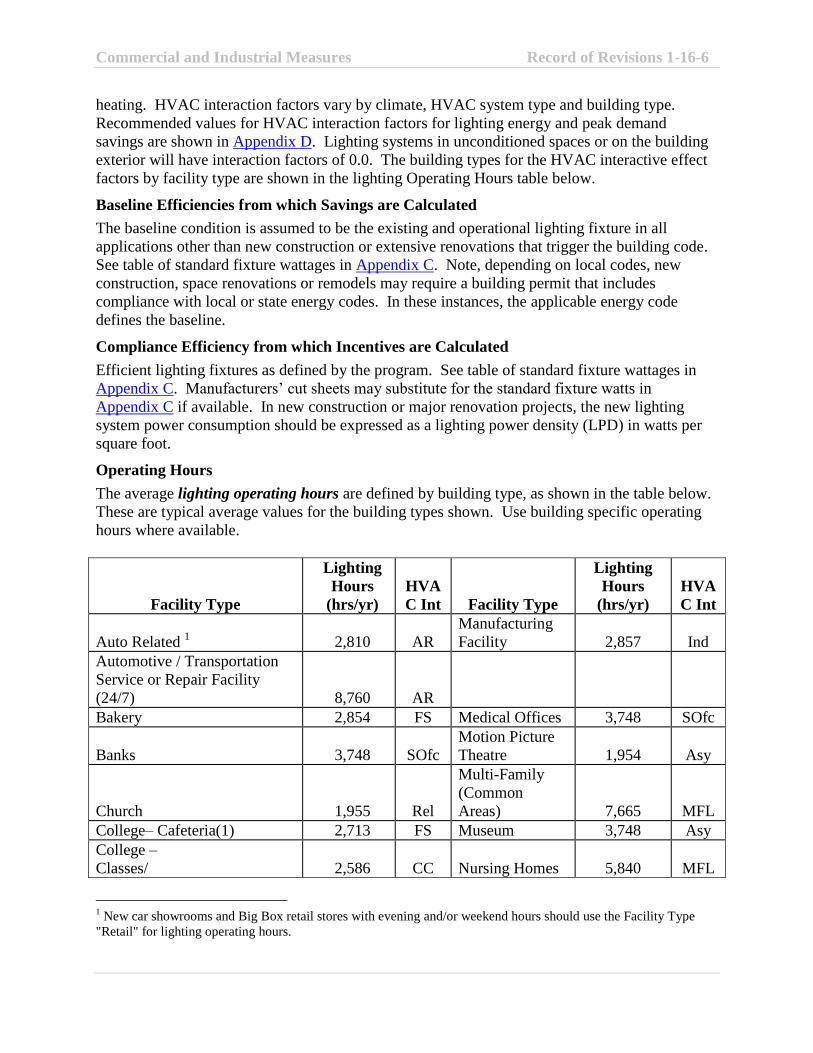
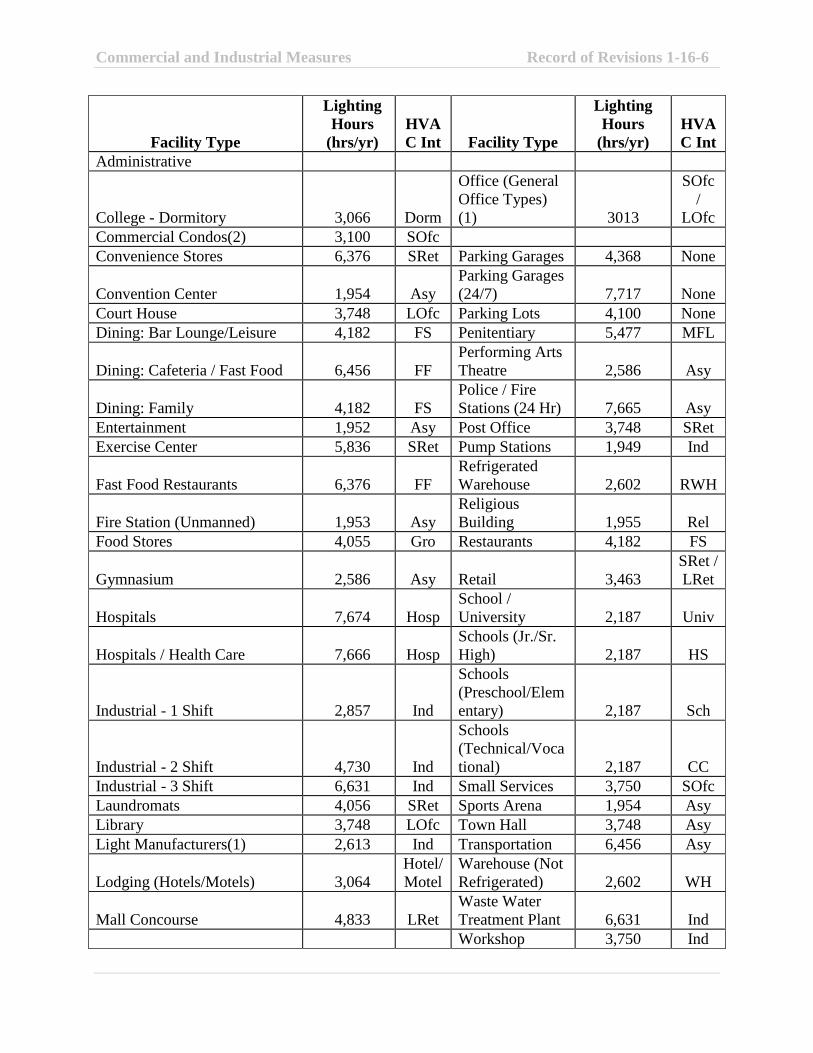
Operating Hours
The average lighting operating hours are defined by building type, as shown in the table below.
These are typical average values for the building types shown. Use building specific operating
hours where available.
Facility Type
Lighting
Hours
(hrs/yr)
HVA
C Int Facility Type
Lighting
Hours
(hrs/yr)
HVA
C Int
Auto Related 1 2,810 AR
Manufacturing
Facility 2,857 Ind
Automotive / Transportation
Service or Repair Facility
(24/7) 8,760 AR
Bakery 2,854 FS Medical Offices 3,748 SOfc
Banks 3,748 SOfc
Motion Picture
Theatre 1,954 Asy
Church 1,955 Rel
Multi-Family
(Common
Areas) 7,665 MFL
College– Cafeteria(1) 2,713 FS Museum 3,748 Asy
College –
Classes/ 2,586 CC Nursing Homes 5,840 MFL
1 New car showrooms and Big Box retail stores with evening and/or weekend hours should use the Facility Type
"Retail" for lighting operating hours.
Commercial and Industrial Measures Record of Revisions 1-16-6
Facility Type
Lighting
Hours
(hrs/yr)
HVA
C Int Facility Type
Lighting
Hours
(hrs/yr)
HVA
C Int
Administrative
College - Dormitory 3,066 Dorm
Office (General
Office Types)
(1) 3013
SOfc
/
LOfc
Commercial Condos(2) 3,100 SOfc
Convenience Stores 6,376 SRet Parking Garages 4,368 None
Convention Center 1,954 Asy
Parking Garages
(24/7) 7,717 None
Court House 3,748 LOfc Parking Lots 4,100 None
Dining: Bar Lounge/Leisure 4,182 FS Penitentiary 5,477 MFL
Dining: Cafeteria / Fast Food 6,456 FF
Performing Arts
Theatre 2,586 Asy
Dining: Family 4,182 FS
Police / Fire
Stations (24 Hr) 7,665 Asy
Entertainment 1,952 Asy Post Office 3,748 SRet
Exercise Center 5,836 SRet Pump Stations 1,949 Ind
Fast Food Restaurants 6,376 FF
Refrigerated
Warehouse 2,602 RWH
Fire Station (Unmanned) 1,953 Asy
Religious
Building 1,955 Rel
Food Stores 4,055 Gro Restaurants 4,182 FS
Gymnasium 2,586 Asy Retail 3,463
SRet /
LRet
Hospitals 7,674 Hosp
School /
University 2,187 Univ
Hospitals / Health Care 7,666 Hosp
Schools (Jr./Sr.
High) 2,187 HS
Industrial - 1 Shift 2,857 Ind
Schools
(Preschool/Elem
entary) 2,187 Sch
Industrial - 2 Shift 4,730 Ind
Schools
(Technical/Voca
tional) 2,187 CC
Industrial - 3 Shift 6,631 Ind Small Services 3,750 SOfc
Laundromats 4,056 SRet Sports Arena 1,954 Asy
Library 3,748 LOfc Town Hall 3,748 Asy
Light Manufacturers(1) 2,613 Ind Transportation 6,456 Asy
Lodging (Hotels/Motels) 3,064
Hotel/
Motel
Warehouse (Not
Refrigerated) 2,602 WH
Mall Concourse 4,833 LRet
Waste Water
Treatment Plant 6,631 Ind
Workshop 3,750 Ind

Commercial and Industrial Measures Record of Revisions 1-16-6
(1) Lighting operating hours data from the 2008 California DEER Update study
(2) Lighting operating hours data for offices used
Effective Useful Life (EUL)
Measure Years Source
CFL Lamp 9,000 hours /annual lighting operating
hours See note below
CFL Light Fixture 12 DEER Interior & Exterior, including
linear fluorescent 70,000 hours /annual lighting operating
hours or 15 years (whichever is less) DEER
Interior Dry Transformers 25 Conservative estimate
based on DOE value
LEDs Fixtures and Screw-In
Lamps (other than refrigerated
case)
35,000 or 50,000 hours DLC
35,000 hours Energy Star
15,000 hours(decorative) or 25,000 (all
other) Energy Star
25,000 hours Uncertified Refrigerated Case LED 6 NW RTF
Ancillary Fossil Fuel Savings Impacts
Reduction in lighting power increases space heating requirements. Interactions with the heating
system must be applied to the calculations as shown in the equations above.
Ancillary Electric Savings Impacts
References
1. Lighting operating hour data taken from the CL&P and UI Program Savings
Documentation for 2008 Program Year, with exceptions as noted.
2. Additional lighting operating hour data taken from 2008 DEER Update – Summary of
Measure Energy Analysis Revisions, August, 2008. Available at www.deeresources.com
3. Small Business Direct Install Program Evaluation Review, Prepared for the New York
State Department of Public Service-E2 Working Group, by the Small Commercial EM&V
Review subcommittee, April 3, 2015
Record of Revision
Record of Revision Number Issue Date
1 10/15/2010
6-15-4 6/1/2015
1-16-6 1/1/2016
Return to Table of Contents

Commercial and Industrial Measures Record of Revision 1-16-7
LIGHTING – CONTROL
INTERIOR LIGHTING CONTROL
Measure Description
This section covers lighting control measures, including occupancy sensors, photocell controls,
time clocks, stepped and dimming day lighting controls, dimmers and programmable control
systems. These systems save energy and peak demand by shutting off power to lighting fixtures
when the space is unoccupied or illumination is not required. They also save energy and demand
by reducing power to lighting systems to correct for over-illumination due to excessive lamp
output or the presence of daylight.
Method for Calculating Annual Energy and Peak Coincident Demand Savings
Annual Electric Energy Savings
kWh = (Wctrl / 1,000) × (hrs operating, baseline – hrs operating, ee) × (1 + HVACc)
Peak Coincident Demand Savings
kW = (Wctrl / 1,000) × (1 + HVACd) × DSF × CF
Annual Gas Energy Savings
therms = ΔkWh × HVACg
where:
kWh = Annual electric energy savings
kW = Peak coincident demand electric savings
therms = Annual gas energy savings
units = Number of measures installed under the program
1,000 = Conversion factor, one kW equals 1,000 watts
W = Watts
ctrl = Control
baseline = Baseline condition or measure
ee = Energy efficient condition or measure
CF = Coincidence factor
DSF = Demand savings factor
hrsoperating = Lighting operating hours
HVACc = HVAC interaction factor for annual electric energy consumption
HVACd = HVAC interaction factor at utility summer peak hour
HVACg = HVAC interaction factor for annual natural gas consumption

Summary of Variables and Data Sources
Variable Value Notes
Wctrl Watts
Connected load of controlled lighting fixtures, from
application
Control type From application
hrs operating,
baseline Lighting operating hours. From application
hrs operating, ee Lighting operating hours. From application
HVACd
HVAC interaction factor at utility summer peak hour,
Lookup by building type with weighted average across
HVAC types. Average upstate values or NYC. Use 0 for
lights in unconditioned space.
HVACc
HVAC interaction factor for annual electric energy
consumption, lookup by building type with weighted
average across HVAC types. Average upstate values or
NYC. Use 0 for lights in unconditioned space.
HVACg
HVAC interaction factor for annual natural gas
consumption, lookup by building type with weighted
average across HVAC types. Average upstate values or
NYC. Use 0 for lights in unconditioned space.
Building type From application.
City From application
Fixture
location Indoor, outdoor From application; assume indoor if not known
The demand savings factor (DSF) is the maximum hourly reduction in lighting demand
achieved by a particular control measure. Lighting controls save energy and demand by
reducing or shutting off power input to lighting fixtures in response to a control signal. Demand
savings can be achieved by the following controllers and their respective control actions:
Occupancy sensors - Switching off lights when the space is unoccupied.
Daylight sensing controls - Reducing electric lighting levels according to the availability
of daylight.
Dimming controls - Reducing lighting levels to suit the occupant.
Time clocks - Switching off lights according to a fixed schedule.
Photocells - Controlling outdoor lights according to the availability of daylight. These
may be combined with time clock control.
Programmable control systems - Sophisticated lighting controllers that combine many of
the above functions into a single unit and may also be coupled to the building security
system.

Coincidence Factor (CF)
Defined as the ratio of the peak lighting demand operating at the time of the system peak to the
connected load. Because not all of the fixtures in the population are operating at all times, the
peak lighting demand is often less than the connected load. Occupant control of the lighting
systems and burned-out lamps cause some portion of the fixtures to be non-operational. In
lighting retrofit programs, the pre-retrofit (baseline) demand diversity factor is often lower than
the post-retrofit demand diversity factor, due to burned out lamps that are replaced as part of the
program.
For many utilities, summer peak demand occurs in the afternoon, indicating a coincidence factor
of 1.0 for commercial indoor lighting measures. Since exterior lighting is generally off during
daylight hours, the coincidence factor for exterior lighting is 0.0.
See Appendix D for HVAC interaction factors.
Baseline Efficiencies from which Savings are Calculated
Baseline calculations assume no lighting controls are installed, except those required by local
energy code as applicable.
Compliance Efficiency from which Incentives are Calculated
Lighting controls designed and installed in accordance with manufacturers’ and/or designer
recommendations.
Operating Hours
The baseline lighting operating hours are the average operating hours for all fixtures subject to
lighting control measures before the lighting controls are installed. Lighting operating hours for
a variety of commercial and residential buildings are discussed in the lighting efficiency section
above. The measure lighting operating hours can be entered directly if known, or calculated
from:
hrs operating, ee = hrs operating, baseline × (1 – ESF)
where:
ESF = energy savings factor
hrs operating = lighting operating hours
baseline = Baseline condition or measure
ee = Energy efficient condition or measure
Energy Savings Factors for Various Automatic Control Options
Control Type DSF
Occupancy sensor 0.30
Programmable control 0.15
Daylight dimming control 0.30
Daylight stepped control 0.20
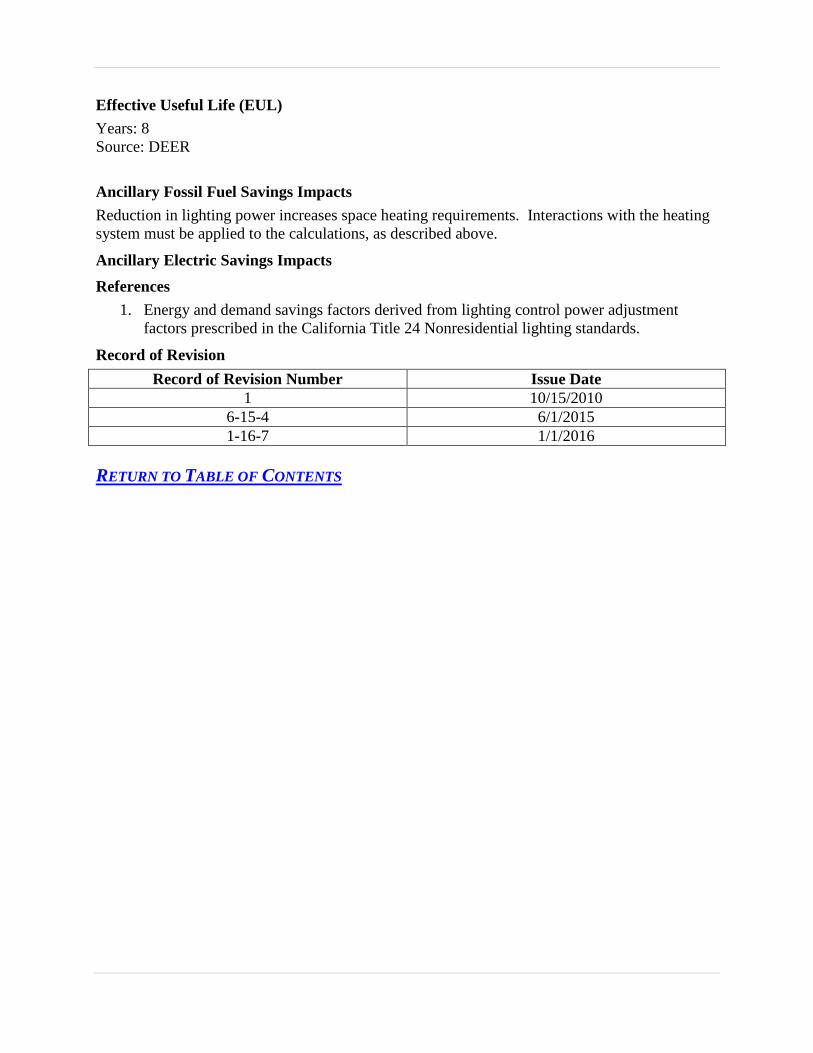
Effective Useful Life (EUL)
Years: 8
Source: DEER
Ancillary Fossil Fuel Savings Impacts
Reduction in lighting power increases space heating requirements. Interactions with the heating
system must be applied to the calculations, as described above.
Ancillary Electric Savings Impacts
References
1. Energy and demand savings factors derived from lighting control power adjustment
factors prescribed in the California Title 24 Nonresidential lighting standards.
Record of Revision
Record of Revision Number Issue Date
1 10/15/2010
6-15-4 6/1/2015
1-16-7 1/1/2016
RETURN TO TABLE OF CONTENTS

Commercial and Industrial Measures Record of Revision 1-16-8
EVAPORATOR FAN CONTROL
Measure Description
Walk-in cooler and freezer evaporator fans often run continually, requiring more air to be blown
across the evaporator than needed to cool the evaporator. This measure consists of a control
system that turns the fan on only when the unit’s thermostat is calling for the compressor to
operate, shutting the fan off shortly after the desired temperature is reached and the compressor
is turned off.
Method for Calculating Annual Energy and Peak Coincident Demand Savings
Annual Electric Energy Savings
kWh = kWh Evapoff + kWh Evapreduced + kWh Comp_Evapctrl
where:
kWh Evapoff = Savings due to Evaporator Fan being off
kWh Evapreduced = Savings due to reduced heat from Evaporator Fans
kWh Comp_Evapctrl = Savings due to the electronic controls on compressor and evaporator
kWh Evapoff = kWfan × FLHfan × Foff
where:
kWfan = Fan kW (V × A × √𝑃ℎ𝑎𝑠𝑒 fan × PFfan)
Vfan = Nameplate fan volts
Afan = Nameplate fan amperage
Phasefan = Number of phases (1 or 3)
PFfan = Power factor for fan motor
FLHfan = Annual operating hours
Fanoff = Fraction of time that Evaporator Fan is turned off.
kWh Evapreduced = kWh Evapoff × 0.285 × kW/ton
where:
kWh Evapoff = Savings due to Evaporator Fan being off.
kW/ton = Compressor efficiency (kW/ton)
0.285 = Conversion factor, one kW equals 0.285388 ton
kWh Comp_Evapctrl = (kWcomp × ((FLHW) + (FLHs)) × Fctrl) + (kWfan × FLHfan × (1-Foff )× Fctrl)
where:
kWcomp = Compressor kW (Vcomp × Acomp × √𝑃ℎ𝑎𝑠𝑒 comp × PFcomp)
Vcomp = Compressor nameplate volts
Acomp = Compressor nameplate amps
Phasecomp = Number of phases (1 or 3)
PFcomp = Power factor for compressor

Commercial and Industrial Measures Record of Revision 1-16-8
FLHs = Compressor summer FLH = Cyclesummer × hrsummer
FLHw = Compressor winter FLH = Cyclewinter × hrwinter
Foff = Fraction of time that Evaporator Fan is turned off.
Fctrl = Fraction of time compressor and fans are off due to electronic controls
Acomp = Nameplate Amps of Compressor
Vcomp = Nameplate Volts of Compressor
Phasecomp = Phase of Compressor (1 or 3)
Peak Coincident Demand Savings
kW = kWfan × DF
Summary of Variables and Data Sources
Variable Value Notes
PFfan 0.55 National Resource Management (NRM) - Program Implementer
PFcomp 0.85 National Resource Management (NRM) - Program Implementer
Op hr 8760 Hours per year
Ton/kW 0.285 Unit conversion
Foff 0.352 Estimate by NRM based on downloads of hours of use data from
the electronic controller.
kW/ton 1.6 Typical refrigeration system kA/ton
Cyclesummer 0.55 Average summer duty cycle
Hrsummer 6565 Summer season hours/yr
Cyclewinter 0.35 Average winter duty cycle
Hrwinter 2195 Winter season hours/yr
DF 0.228 Based on New England Power Service Co. report “Savings from
Walk-In Cooler Air Economizers and Evaporator Fan Controls”,
HEC, June 28, 1996
Coincident Factor (CF)
The recommended value for the coincident factor is 0.8
Baseline Efficiencies from which Savings are Calculated
The savings from this measure is highly dependent on the type, size and condition of the coolers
and freezers fitted with fan controls. As a result, an estimate of the typical unit must be based on
the program’s projection of what types and sizes of units will be served and the condition of
those units to function. In general, this estimate approach must be made for the typical units that
the program is expected to control.
Compliance Efficiency from which Incentives are Calculated
Operating Hours
Included in formula above

Commercial and Industrial Measures Record of Revision 1-16-8
Effective Useful Life (EUL)
Years: 16
Source: DEER
Ancillary Fossil Fuel Savings Impacts
Ancillary Electric Savings Impacts
References
1. Diversity factor taken from “New England Power Service Co. study of Economizers and
Evaporator Fan Controls”, HEC, June 28, 1996.
Record of Revision
Record of Revision Number Issue Date
1 10/15/2010
7-13-16 7/31/2013
1-16-8 1/1/2016
Return to Table of Contents

Appendix G: Heating and Cooling Full Load Hours
APPENDIX G
EQUIVALENT FULL-LOAD HOURS (EFLH), FOR HEATING AND COOLING
Analysis used to develop parameters for the energy and demand savings calculations are based
on DOE-2.2 simulations of a set of prototypical residential buildings. The prototypical
simulation models were derived from the residential building prototypes used in the California
Database for Energy Efficiency Resources (DEER)1 study, with adjustments made for local
building practices and climate.
Four separate models were created to represent general vintages of buildings:
1. Built prior to 1940, uninsulated masonry buildings. This vintage is referred to as “Pre-
war uninsulated brick ”
2. Built prior to 1979 when the NYS Energy Code (known as the Energy Conservation
Construction Code of New York State – ECCCNYS) went into effect, poorly insulated
wood-frame buildings This vintage is referred to as “Prior to 1979”
3. Built from 1979 through 2006, with insulation conforming to 1980s era building codes
(1979 ECCCNYS.) This vintage is referred to as “From 1979 through 2006.”
4. Built from 2007 through the present, new construction with insulation conforming to the
2007 ECCCNYS for residential buildings and the New York City Energy Conservative
Construction Code (if applicable.) This vintage is referred to as “From 2007 through the
present.”
1 2004-2005 Database for Energy Efficiency Resources (DEER) Update Study, Final Report, Itron, Inc. Vancouver,
WA. December 2005. Available at
www.calmac.org/publications/2004-05_DEER_Update_Final_Report-Wo.pdf

Appendix G: Heating and Cooling Full Load Hours
SINGLE-FAMILY DETACHED COOLING EFLH BY VINTAGE AND CITY City Old Average New Albany 322 310 279 Binghamton 199 197 158 Buffalo 334 322 276 Massena 258 250 210 Poughkeepsie 496 470 464 NYC 670 649 630 Syracuse 310 296 268
MULTI-FAMILY LOW-RISE COOLING EFLH BY VINTAGE AND CITY
City Prior to 1979 From 1979 Through 2006 From 2007 Through the
Present Albany 295 286 279 Binghamton 219 217 210 Buffalo 274 270 256 Massena 230 228 218 NYC 562 550 507 Poughkeepsie 421 423 397 Syracuse 297 284 265
MULTI-FAMILY HIGH-RISE COOLING EFLH BY VINTAGE AND CITY2
City Prior to 1979 From 1979 Through 2006 From 2007 Through the
Present Albany 782 647 594 Binghamton 684 539 479 Buffalo 773 637 572 Massena 668 571 532 NYC 954 843 793 Poughkeepsie 812 669 626 Syracuse 845 665 592
2 Note, there are no cooling values for the “Pre-war uninsulated brick vintage, due to a typical lack of any central
cooling. This vintage assumes one room air conditioner (RAC) within the unit. For the savings calculation method,
see the Air Conditioner – Room (RAC) measure listed in the Single and Multi-family Residential Measures section
of this manual.

Appendix G: Heating and Cooling Full Load Hours
Heating equivalent full-load hours for residential buildings were originally calculated from a
DOE-2.2 simulation of prototypical residential buildings. The prototype building characteristics
are described in Appendix A. The revised heating EFLH are shown below:3
SINGLE-FAMILY DETACHED HEATING EFLH BY VINTAGE AND CITY City Old Average New Albany 1,042 978 925 Binghamton 1,086 1,029 963 Buffalo 1,072 1,032 957 Massena 1,125 1,061 1,009 NYC 867 786 725 Poughkeepsie 931 862 807 Syracuse 1,098 1,042 972
MULTI-FAMILY LOW-RISE HEATING EFLH BY VINTAGE AND CITY
City Pre-war
uninsulated brick Prior to 1979 From 1979 Through 2006
From 2007 Through the Present
Albany 1,111 1,030 1,012 729 Binghamton 1,397 1,320 1,245 899 Buffalo 1,281 1,219 1,215 883 Massena 1,433 1,306 1,326 964 NYC4 999 757 723 503 Poughkeepsie 857 894 868 616 Syracuse 1,395 1,175 1,206 845
MULTI-FAMILY HIGH-RISE HEATING EFLH BY VINTAGE AND CITY
City Pre-war
uninsulated brick Prior to 1979 From 1979 Through 2006
From 2007 Through the Present
Albany 975 786 626 363 Binghamton 1,102 1,006 831 484 Buffalo 1,181 966 813 471 Massena 1,111 1,016 873 552 NYC5 1,012 526 395 219 Poughkeepsie 922 656 510 291 Syracuse 1,063 889 787 474
3 The original EFLH numbers have been adjusted according to the recommendations contained in the statewide
evaluation performed by Opinion Dynamics, New York Statewide Residential Gas High-Efficiency Heating
Equipment Programs – Evaluation of 2009-2011 Programs, August 2014. Recommendations regarding EFLH hours
located on page 81. 4 NYC building only incorporates a higher thermostatic set point of 73
oF instead of 70
oF based on reported data.
The other cities listed use the thermostatic set-point of 70700 F. Overheating in Hot Water and Steam-Heated Multi-
family Buildings, U.S. Dept. of Energy, Jordan Dentz, Kapil Varshney and Hugh Henderson, October 2013. 5 IBID

SMALL COMMERCIAL COOLING EFLH Building Albany Binghamton Buffalo Massena NYC Poughkeepsie Syracuse Assembly 478 436 497 415 669 574 506 Auto Repair 272 244 264 223 426 302 298 Big Box Retail 769 760 826 688 1279 1024 831 Fast Food Restaurant 512 501 519 436 645 579 544 Full Service Restaurant 437 514 460 389 574 506 466 Grocery 769 760 826 688 1279 1024 831 Light Industrial 400 435 423 370 549 475 429 Motel 734 959 1084 997 1233 1143 1072 Primary School 297 264 244 257 394 346 274 Religious Worship 227 1006 190 204 279 230 246 Small Office 742 714 745 671 955 849 768 Small Retail 642 644 666 599 882 762 678 Warehouse 234 194 212 228 400 284 243 Other 501 572 535 474 736 623 553
LARGE COMMERCIAL COOLING EFLH Building System Albany Binghamton Buffalo Massena NYC Poughkeepsie Syracuse
Community College
CAV econ 585 433 520 509 846 706 609 CAV noecon 773 586 693 692 1,128 997 811 VAV econ 470 376 456 353 658 532 455
Dormitory6 Fan Coil* 736 657 752 693 800 760 763 High School CAV econ 348 304 323 318 466 407 388
CAV noecon 713 727 741 727 861 787 764 VAV econ 237 203 215 215 341 289 256
Hospital CAV econ 1,038 918 1,114 1,038 1,424 1,231 1,147 CAV noecon 1,728 1,662 1,908 1,730 2,237 1,983 1,906 VAV econ 961 855 1,026 962 1,217 1,089 1,050
Hotel CAV econ 2,744 3,078 2,744 2,807 2,918 3,039 3,471 CAV noecon 2,945 3,270 2,945 3,021 3,108 3,253 3,653 VAV econ 2,702 3,046 2,702 2,745 2,929 2,937 3,437
Large Office CAV econ 706 534 587 610 720 713 667 CAV noecon 1,894 1,786 2,016 1,827 2,250 2,072 2,156 VAV econ 623 519 504 505 716 670 572
Large Retail CAV econ 858 721 849 753 1,068 920 858
6 Dormitories consist of individual rooms with small heating/cooling coils. Constant Air Volume (CAV) or Variable Air Volume (VAV) with Economizers
(econ) are not typically used.

Building System Albany Binghamton Buffalo Massena NYC Poughkeepsie Syracuse CAV noecon 1,656 1,613 1,763 1,545 1,751 1,670 1,656 VAV econ 704 594 713 611 886 757 704
University CAV econ 680 496 610 567 882 706 699 CAV noecon 936 723 870 811 1,208 1,030 951 VAV econ 526 432 518 413 690 568 523
SMALL COMMERCIAL HEATING EFLH Building Albany Binghamton Buffalo Massena NYC Poughkeepsie Syracuse Assembly 961 1006 990 1158 603 782 903 Auto Repair 3325 3455 3331 3649 1910 2642 3271 Big Box Retail 554 509 557 620 191 373 522 Fast Food Restaurant 1426 1526 1491 1690 813 1120 1351 Full Service Restaurant 1502 1602 1567 1746 821 1162 1419 Grocery 554 509 557 620 191 373 522 Light Industrial 1278 1320 1188 1286 714 996 1200 Motel 1037 787 789 832 619 603 778 Primary School 1300 1290 1357 1311 840 1070 1236 Religious Worship 954 202 978 1015 722 802 962 Small Office 747 793 760 861 431 589 750 Small Retail 984 1006 1020 1134 545 765 969 Warehouse 916 1023 940 1094 452 642 888 Other 1195 1156 1194 1309 681 917 1136
LARGE COMMERCIAL HEATING EFLH Building System Albany Binghamton Buffalo Massena NYC Poughkeepsie Syracuse Community College
CAV econ 1,111 1,072 1,047 1,301 1,431 1,171 1,259 CAV noecon 1,052 1,042 1,006 1,177 1,268 1,050 1,177
VAV econ 607 1,161 1,040 606 434 389 554 Dormitory* Fan Coil* 594 678 753 687 465 507 673 High School CAV econ 776 782 808 822 901 898 960
CAV noecon 701 725 741 759 840 829 902 VAV econ 326 300 384 382 268 303 395
Hospital CAV econ 3,084 2,847 2,897 2,782 3,366 2,886 3,062 CAV noecon 2,733 2,423 2,516 2,353 3,137 2,514 2,704
VAV econ 763 766 642 739 296 481 771 Hotel CAV econ 1,230 1,177 1,220 1,239 1,077 1,054 1,175
CAV noecon 962 907 941 1,032 753 794 919 VAV econ 552 482 518 661 229 376 464
Large Office CAV econ 2,136 2,047 2,020 2,349 2,034 2,142 2,218

Building System Albany Binghamton Buffalo Massena NYC Poughkeepsie Syracuse CAV noecon 2,097 1,965 1,976 2,307 2,072 2,133 2,219
VAV econ 484 476 485 544 291 367 441 Large Retail CAV econ 2,167 2,148 2,147 2,243 2,101 2,030 2,144
CAV noecon 2,057 1,983 2,015 2,106 2,033 1,913 2,030 VAV econ 859 735 777 927 664 632 783
University CAV econ 1,464 1,573 1,531 1,589 1,191 1,352 1,390 CAV noecon 1,439 1,438 1,461 1,456 1,104 1,308 1,356
VAV econ 1,060 569 1,206 1,224 684 761 624
Record of Revision
Record of Revision Number Issue Date
0 10/15/2010
6-15-8 6/1/2015
1-16-9 1/1/2016
Return to Table of Contents

Residential and Multi-Family Measure Record of Revision 1-16-10 APPLIANCE - CONTROL
ADVANCED POWER STRIP Measure Description This measure describes savings associated with the use of an Advanced Power Strip (APS) to minimize energy use. An APS makes use of a control plug to disconnect the additional strip regular plugs when the load on the control plug power is reduced below the threshold. Therefore, the overall load of a centralized group of equipment (i.e. entertainment centers and home offices) can be reduced. Method for Calculating Annual Energy and Peak Coincident Demand Savings Annual Electric Energy Savings
ΔkWh = units × (Deemed Annual Electric Energy Savings) Peak Coincident Demand Savings
ΔkW = units × (Deemed Peak Coincident Demand Savings) × CF
Annual Gas Energy Savings Δtherms = N/A
Deemed Annual Electric Energy Savings
5-plug Tier 1 - Advanced Power Strip - 56.5 kWh 6-plug Tier 1 - Advanced Power Strip - 80.0 kWh 7-plug Tier 1 - Advanced Power Strip - 102.8 kWh
Deemed Peak Coincident Demand Savings 5-plug Tier 1 - Advanced Power Strip - 0.0063 kW 6-plug Tier 1 - Advanced Power Strip - 0.0089 kW 7-plug Tier 1 - Advanced Power Strip - 0.012 kW
where: ΔkWh = annual energy savings ΔkW = coincident demand savings Δtherms = annual gas energy savings units = the number of units installed CF = coincidence factor Summary of Variables and Data Sources This measure characterization provides savings for a 5-plug, 6-plug, and a 7-plug strip.
Variable Value Notes ΔkWh 56.5 kWh 5-plug tier-1 power strip ΔkWh 80.0 kWh 6-plug tier-1 power strip ΔkWh 102.8 kWh 7-plug tier-1 power strip
Coincidence Factor (CF) The recommended value for the coincidence factor is 0.0

Residential and Multi-Family Measure Record of Revision 1-16-10 Baseline Efficiencies from which Savings are Calculated Baseline case assumes no control of electronics. Compliance Efficiency from which Incentives are Calculated Efficient Case is a 5, 6 or 7 plug strip with a control plug in use. Description of Advanced Power Strip (APS) tiered technology:
APS Tier 1 technology differs from standard power strips due to APS's three distinctive sockets: switched, control and always on. All electronics in the "switched" socket (e.g. home theater, DVD player, stereo, printer, etc.) are shut down when the "control' device (e.g. television, game console, computer) is turned off. Separate from the control and switched sockets, the APS has spaces for devices that need to be "always on" (e.g. clock, cable box, etc.). Reducing the standby power with APS devices would have an immediate effect on the large percentage of wasted energy.
Tier 2 APS products also address active power consumption. APS Tier 2 technology has the capacity
to reduce active energy by sensing when consumers are not using a device. Therefore, despite Tier 2 APS products recently entering the market, they have a higher savings potential than Tier 1 APS products.
Operating Hours Annual hours when controlled standby loads are turned off is 7,149 Effective Useful Life (EUL) Years: 4 years Source: NEEP Mid-Atlantic Technical Reference Manual V2.0 July 2011 Ancillary Annual Fossil Fuel Savings Impact – N/A Ancillary Annual Electric Savings Impact – N/A References
1. NEEP Mid-Atlantic Technical Reference Manual V2.0 July 2011 Record of Revision
Record of Revision Number Issue Date 1-16-10 1-1-2016
Return to Table of Contents

Commercial and Industrial Measures Record of Revision 1-16-11
LIGHTING - CONTROL
BI-LEVEL LIGHTING
Measure Description
Stairwell Bi-Level lighting fixtures provide lighting to spaces that are infrequently used, such as
stairwells, where a minimum level of illumination is desired when unoccupied and a higher level
when occupied. These fixtures are controlled by an integral occupancy sensor and are
customarily available as replacements for existing fixtures. These fixtures are available with
both fluorescent and LED lamps. Light levels are adjustable from 10% to 100% of nominal light
output and are also available with battery back up to provide minimally code compliant
illumination for a period of ninety minutes. These fixtures, when installed as a replacement
fixture, provide electrical savings without compromising safety.
Method for Calculating Annual Energy Savings and Peak Coincident Demand Savings
Annual Electric Energy Savings
kWh = units 𝑥 [(𝑊𝑒𝑥𝑖𝑠𝑡
1000 𝑥 8760) – ((
𝑊𝑜𝑐
1000 𝑥𝐹𝐿𝐻𝑜𝑐 ) + (
𝑊𝑢𝑛
1000) 𝑥 𝐹𝐿𝐻𝑢𝑛 ))]
Peak Coincident Demand Savings
kW = units 𝑥 [(𝑊𝑒𝑥𝑖𝑠𝑡
1000−
𝑊𝑜𝑐
1000) + ((
𝑊𝑜𝑐− 𝑊𝑢𝑛
1000 ) 𝑥 (
𝐹𝐿𝐻𝑢𝑛
8760))] 𝑥 CF
Annual Gas Energy Savings
therms = N/A
where:
kWh = Annual electric energy savings
kW = Peak coincident demand electric savings
therms = Annual gas energy savings units = Number of measures installed
Wexist = Wattage of the baseline unit
Woc = Wattage of the energy efficient fixture when occupied
Wun = Wattage of the energy efficient fixture when unoccupied
FLH = Full Load Hours of the baseline unit
FLHoc = Full Load Hours of energy efficient fixture when occupied
FLHun = Full Load Hours of energy efficient fixture when unoccupied (standby)
CF = Coincidence Factor
8760 = Conversion Factor, Hours to Year

Commercial and Industrial Measures Record of Revision 1-16-11
Summary of Variables and Data Source
Variables Value Notes
units From application, invoices or other documentation.
Equal to number of lamps installed and operating.
Wexist From application, connected load of existing unit.
Woc From application, connected load of the energy
efficient unit when occupied.
Wun From application, connected load of the energy
efficient unit when unoccupied (standby).
FLHoc 438 hours Full Load Hours of energy efficient fixture when
occupied.
FLHun
8,322 hours
Full Load Hours of energy efficient fixture when
unoccupied (standby).
Coincidence Factor (CF)
As stairwell lighting is required for life safety at all times in accordance with regulations the
coincidence factor is assumed to be 1.0.
Operating Hours
Based on market research the stairwells are occupied only 5% of the time. Therefore 95% of the
time the new fixture will be in the reduced wattage mode.
Reduced Wattage
Bi-level fixture from the leading lighting manufactures produce lights that will reduce the
capacity to 33% or below during the unoccupied mode, when actual fixture data is not available
assume that during the unoccupied mode the rated wattage will be reduced by 50%.
Effective Useful Life (EUL)
See Appendix P: Effective Useful Life (EUL)
Ancillary Fossil Fuel Savings Impacts
Ancillary Electric Savings Impacts
References
1. Field Test DELTA Snapshots with Staff and NYSERDA inputs. Staircase Lighting
Sponsored by LaMar Lighting and NYSERDA. March 2004.

Commercial and Industrial Measures Record of Revision 1-16-11
2. The 33% unoccupied mode capacity is based on actual lighting specifications of installed
fixtures with Staff and NYSERDA inputs. The 50% unoccupied mode capacity is based
on the common bi-level application where one of two bulbs in the fixture is turned off
during the unoccupied mode.
Record of Revision
Record of Revision Number Issue Date
1-16-11 1/1/2016
Return to Table of Contents

Residential and Multi-Family Measure Record of Revision 1-16-12 THERMOSTATIC RADIATOR VALVE – ONE PIPE STEAM RADIATOR
Measure Description
Thermostatic Radiator Valves (TRV) are self-contained, self-operated valves that do not require
ancillary power. They provide local control of room temperature by regulating the flow of hot water or
steam to free-standing radiators, convectors, or baseboard heating units. TRV are available for a variety
of installation conditions utilizing either remote-mounted sensors or integral-mounted sensors by means
of remote or integral set point adjustment. This measure is specifically a TRV in combination with an
air vent installed at one or more radiators in a one-pipe steam space heating system.
Method for Calculating Annual Energy and Peak Coincident Demand Savings
Annual Electric Energy Savings
kWh = N/A
Peak Coincident Demand Savings
kW = N/A
Annual Gas Energy Savings
therms = Units × therms/HDD × HDDavg
where:
kWh = Annual electric energy savings
kW = Peak coincident demand electric savings
therms = Annual gas energy savings
units = Number of TRV’s installed
therms/HDD = Annual gas energy savings per Heating Degree Day (HDD), per TRV
HDDavg = Average Heating Degree Days
Summary of Variables and Data Sources
Variable Value Notes
units Number of TRV’s installed, from application
Δ Therms/HDD 0.004318 Average gas savings per HDD per unit1
HDDavg 4805 Heating Degree Days for New York City2
1Thermostatic Radiator Valve (TRV) Demonstration Project . Prepared by NYSERDA, Project manager Norine Karins
and the EME Group project manager Michael McNamara. NYSERDA report 95-14. September 1995. 22009 International Energy Conservation Code, Table D-1, US & US Territory Climate Data

Residential and Multi-Family Measure Record of Revision 1-16-12 Coincidence Factor (CF)
N/A
Baseline Efficiencies from which Savings are Calculated
The baseline condition is an existing space heating system with manual control valves at free-
standing radiators, convectors, or baseboard heating units.
Compliance Efficiency from which Incentives are Calculated
The measure is defined as the existing radiator, convector, or baseboard heater unit controlled by the thermostatic radiator valve.
Operating Hours
N/A
Effective Useful Life (EUL)
Years: 12
Source: NYS DPS
Ancillary Fossil Fuel Savings Impacts
Ancillary Electric Savings Impacts
References
1. Thermostatic Radiator Valve (TRV) Demonstration Project. Prepared by NYSERDA, Project
manager Norine Karins and the EME Group project manager Michael McNamara. NYSERDA
report 95-14. September 1995.
2. 2009 International Energy Conservation Code, Table D-1, US & US Territory Climate Data.
Record of Revision
Record of Revision Number Issue Date
1-16-12 1/1/2016
Return to Table of Contents

Single and Multi-Family Residential Measures Record of Revision 1-16-13 ENERGY MANAGEMENT SYSTEM (EMS)
Measure Description
An Energy Management System (EMS) is a computer system designed specifically for the automated
control and monitoring of building systems which optimize the use of energy, as consumed by heating,
ventilation, air conditioning, and domestic hot water heating. An EMS operates building functions as
efficiently as possible while maintaining a specified level of comfort through the use of electro-
mechanical control mechanisms. In multifamily buildings, an EMS installed with indoor temperature
sensors in apartments and other heated spaces can reduce energy consumption by optimizing boiler
operation based on seasonal weather variations, use patterns, and self-diagnostic functions. The measure
is defined as the installation of a new EMS, consisting of a central boiler control system that allows for
staging/control of multiple boilers and monitors indoor temperature, stack temperature, outdoor
temperature, and supply or return water temperature.
Method for Calculating Annual Energy and Peak Coincident Demand Savings
Annual Electric Energy Savings
kWh = N/A
Peak Coincident Demand Savings
kW = N/A
Annual Gas Energy Savings
therms = BTUhin
100,000 × EFLHheating × ESF
where:
kWh = Annual electric energy savings
kW = Peak coincident demand electric savings
therms = Annual gas energy savings
BTUhin = Furnace or boiler input rating
EFLHheating = Equivalent full-load hours
ESF = Energy Savings Factor for EMS
100,000 = Conversion factor, (BTUh/Therm)
Summary of Variables and Data Sources
Variable Value Notes
BTUhin From application, furnace or boiler input rating, in
Btu/hr.
EFLHheating Lookup based on building type and location.
ESF 0.22 Energy Savings Factor, from US Energy Group study1
1Thermostatic Radiator Valve (TRV) Demonstration Project . Prepared by NYSERDA, Project manager Norine Karins
and the EME Group project manager Michael McNamara. NYSERDA report 95-14. September 1995.

Single and Multi-Family Residential Measures Record of Revision 1-16-13
Coincidence Factor (CF)
N/A
Baseline Efficiencies from which Savings are Calculated
The baseline condition is an existing boiler control system based on outdoor temperature reset. Compliance Efficiency from which Incentives are Calculated
The measure is defined as the new installation of a complete EMS with the capability of controlling an existing boiler system based on indoor and outdoor temperature.
Operating Hours
Heating equivalent full-load hours were calculated from a DOE-2.2 simulation of prototypical small commercial buildings. The EFLH values for commercial buildings are identified in Appendix G. Effective Useful Life (EUL)
Years: 15
Source: DEER
Ancillary Fossil Fuel Savings Impacts
Ancillary Electric Savings Impacts
References
1. US Energy Group Case Study #241, prepared by Sherri Jean Katz.
Record of Revision
Record of Revision Number Issue Date
1-16-13 1/1/2016
Return to Table of Contents

Commercial and Industrial Measures Record of Revisions 1-16-14
ELECTRONICALLY CONTROLLED BRUSHLESS PERMANENT MAGNET (BPM) MOTORS
FOR HVAC CIRCULATION (BLOWER) FAN
Measure Description
Electronically Controlled Brushless Permanent Magnet Motors, also commonly referred to as
electronically commutated motors provide increased efficiency by using a micro-processor to obtain
variable speed response and improve both efficiency and reliability by means of eliminating friction
attributable to brushes. While such technology has been available for some time and available to a wide
variety of applications such motors are now being widely adopted by HVAC equipment manufacturers
and contractors as a substitute for existing permanent-split capacitor motors. This measure addresses the
specific application of BPM motors on a retro-fit basis for circulating fans of one Horsepower (HP) or
less in HVAC air distribution equipment employing heating and/or cooling.
Method for Calculating Annual Energy and Peak Coincident Demand Savings
Annual Electric Energy Savings
kWh = kWhheat + kWhcool
Electric Energy Savings during Cooling Season
kWhcool =(Wpsc x Wcool)
1000 × LF × EFLHcool × (1 + HVACc)
Electric Energy Savings during Heating Season
kWhheat =(Wpsc x Wheat)
1000 × LF × EFLHheat × (1 + HVACc)
Peak Coincident Demand Savings
kWcool =(Wpsc x Wcool)
1000 × LF × CF × (1 + HVACd)
where:
kWh = Annual electric energy savings
𝑘𝑊ℎ𝑐𝑜𝑜𝑙 = Electric energy savings during cooling season
𝑘𝑊ℎℎ𝑒𝑎𝑡 = Electric energy savings during heating season
kWcool = Peak coincident demand savings
Wpsc = Baseline PSC motor wattage
Wheat = Energy efficient BPM motor wattage percentage savings, heating season¹
Wcool = Energy efficient BPM motor wattage percentage savings, cooling season¹
LF = Motor load factor
CF = Coincidence factor
EFLHheat = Equivalent full load hours during heating season
EFLHcool = Equivalent full load hours during cooling season
HVACc = HVAC interactive effects multipliers for annual electric energy consumption
HVACd = HVAC interactive effects multipliers at summer utility peak hour

Commercial and Industrial Measures Record of Revisions 1-16-14
Summary of Variables and Data Sources
Variable Value Notes
Wpsc # Watts Baseline PSC Motor Wattage Nameplate Data or Default
Motor Wattage Value Table
Wheat 23% Energy Efficient BPM Motor Wattage Percentage
Savings During Heating Season¹
Wcool 38% Energy Efficient BPM Motor Wattage Percentage
Savings During Cooling Season¹
LF 0.9 Default Value
CF 0.8 Default Value
EFLHheat # Hours Appendix G: Equivalent Full Load Hours
EFLHcool # Hours Appendix G: Equivalent Full Load Hours
HVACc # Appendix D: HVAC Interactive Effects
HVACd # Appendix D: HVAC Interactive Effects Multipliers at
Summer Utility Peak Hour
HP # Motor Rated Horsepower
Circulation Fan Default Motor Wattage Value Table
Motor Type Motor Category (Default Output Watts ²)
1/6 HP 1/4 HP 1/3 HP ½ HP 3/4 HP
PSC Motor 311 403 460 713 1150
Coincidence Factor (CF)
The recommended coincidence factor for this measure is 0.8 consistent with all commercial air
conditioning applications.
Baseline Efficiencies from which Savings are Calculated
The baseline condition is a standard efficiency PSC motor.
Compliance Efficiency from which Incentives are Calculated
The measure is defined as a BPM motor of equivalent HP.
Operating Hours
See Appendix G: Equivalent Full Load Hours for both Heating and Cooling Season Operating Hours.
Effective Useful Life (EUL)
Years: 15
Source: Appendix P: Effective Useful Life
Ancillary Fossil Fuel Savings Impacts
Ancillary Electric Savings Impacts

Commercial and Industrial Measures Record of Revisions 1-16-14
References
1. Evaluation of Retrofit Variable-Speed Furnace Fan Motors, R. Aldrich and J. Williamson,
Consortium for Advanced Residential Buildings, U.S. Department of Energy Building
Technologies Office, January 2014
2. NIDEC Motor Corporation, Residential and Commercial HVACR Standard Motor Catalog, 2015
Record of Revision
Record of Revision Number Issue Date
1-16-14 1-1-2016
Return to Table of Contents
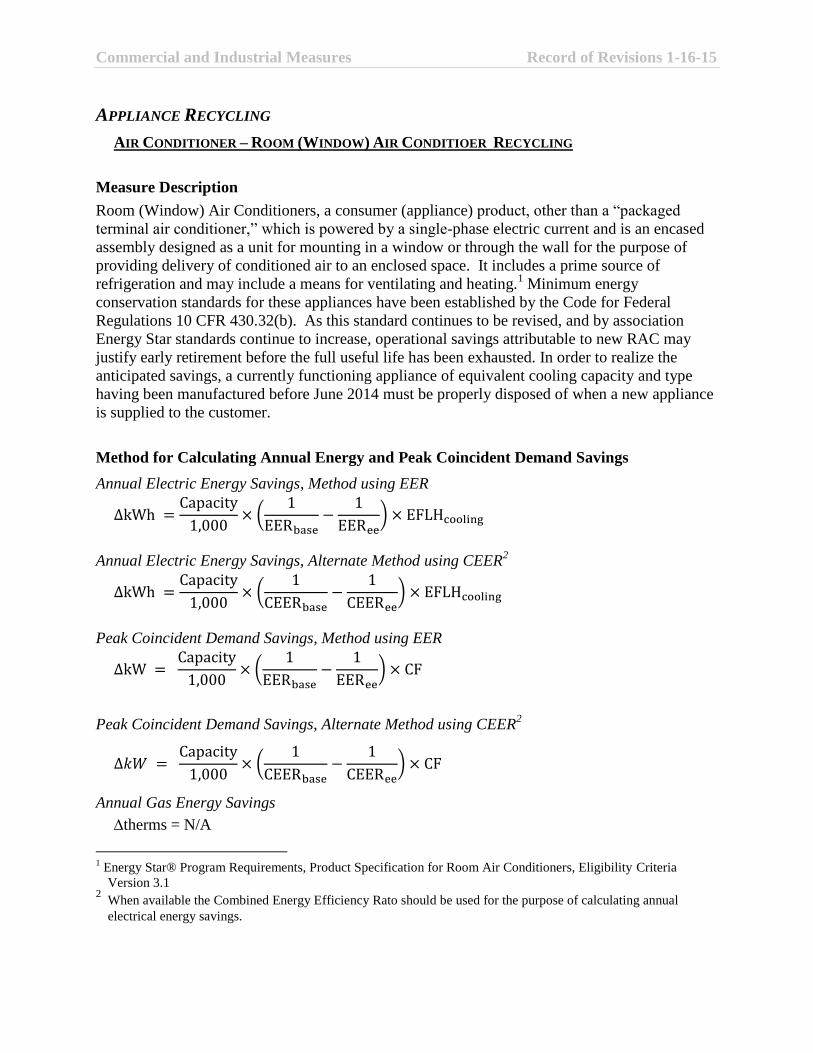
Commercial and Industrial Measures Record of Revisions 1-16-15
APPLIANCE RECYCLING
AIR CONDITIONER – ROOM (WINDOW) AIR CONDITIOER RECYCLING
Measure Description
Room (Window) Air Conditioners, a consumer (appliance) product, other than a “packaged
terminal air conditioner,” which is powered by a single-phase electric current and is an encased
assembly designed as a unit for mounting in a window or through the wall for the purpose of
providing delivery of conditioned air to an enclosed space. It includes a prime source of
refrigeration and may include a means for ventilating and heating.1 Minimum energy
conservation standards for these appliances have been established by the Code for Federal
Regulations 10 CFR 430.32(b). As this standard continues to be revised, and by association
Energy Star standards continue to increase, operational savings attributable to new RAC may
justify early retirement before the full useful life has been exhausted. In order to realize the
anticipated savings, a currently functioning appliance of equivalent cooling capacity and type
having been manufactured before June 2014 must be properly disposed of when a new appliance
is supplied to the customer.
Method for Calculating Annual Energy and Peak Coincident Demand Savings
Annual Electric Energy Savings, Method using EER
∆kWh =Capacity
1,000× (
1
EERbase−
1
EERee) × EFLHcooling
Annual Electric Energy Savings, Alternate Method using CEER2
∆kWh =Capacity
1,000× (
1
CEERbase−
1
CEERee) × EFLHcooling
Peak Coincident Demand Savings, Method using EER
∆kW = Capacity
1,000× (
1
EERbase−
1
EERee) × CF
Peak Coincident Demand Savings, Alternate Method using CEER2
∆𝑘𝑊 = Capacity
1,000× (
1
CEERbase−
1
CEERee) × CF
Annual Gas Energy Savings
therms = N/A
1 Energy Star® Program Requirements, Product Specification for Room Air Conditioners, Eligibility Criteria
Version 3.1 2 When available the Combined Energy Efficiency Rato should be used for the purpose of calculating annual
electrical energy savings.

Commercial and Industrial Measures Record of Revisions 1-16-15
where:
kWh = Annual electric energy savings
kW = Peak coincident demand electric savings
therms = Annual gas energy savings
Capacity = Cooling output rating, in BTU/hr
EFLHcooling = Cooling Equivalent Full-Load Hours
CF = Coincidence Factor
CEER = Combined Energy Efficiency Ratio
EER = Energy Efficiency Ratio
ee = Energy efficient condition or measure
baseline = Baseline condition or measure
1,000 = Conversion factor (1,000 Watts / Kilowatt)
Packaged Terminal Air Conditioner (PTAC) is defined as a wall sleeve and a separate unencased combination of heating and cooling assemblies specified by the builder and intended for
mounting through the wall. RAC with louvered sides have exterior side vents to facilitate airflow over the outdoor coil.
RAC with reverse cycle are appliances that may reverse the refrigeration cycle so as to serve as
heating equipment, also known as a heat pump.
Summary of Variables and Data Sources
Variable Value Notes
Capacity From application.
EFLHcooling Cooling equivalent full-load hours by building type,
Appendix G.
CEERbaseline From application, or lookup from table below based on unit
capacity when unknown.
CEERee From application.
EERbaseline
From application, or lookup from table below based on unit
capacity when unknown.
EERee From application.
Coincidence Factor (CF)
The recommended value for the coincidence factor is 0.8
Baseline Efficiencies from which Savings are Calculated
Baseline efficiency assumptions for normal replacement of units manufactured between the years
2000 - 2014. Baseline efficiency of air conditioners manufactured after June 2014 will be the
compliance efficiency.

Commercial and Industrial Measures Record of Revisions 1-16-15
Room Air Conditioners
Capacity (BTU/hr) with Louvered Sides (EERbase) without Louvered Sides (EERbase)
< 6,000 ≤ 9.7 ≤ 9.0
6,000 - 8,000 ≤ 9.7 ≤ 9.0
8,000 – 13,999 ≤ 9.8 ≤ 8.5
14,000 – 19,999 ≤ 9.7 ≤ 8.5
20,000– 24,999 ≤ 8.5 ≤ 8.5
25,000 ≤ 8.5 ≤ 8.5
Room Air Conditioners - Casement
Capacity (BTU/hr) Casement Only (𝐸𝐸𝑅𝑏𝑎𝑠𝑒) Casement - Slider (𝐸𝐸𝑅𝑏𝑎𝑠𝑒)
All ≤ 8.7 ≤ 9.5
Room (Air Conditioners with Reverse Cycle) Heat Pumps
Capacity (BTU/hr) with Louvered Sides (𝐸𝐸𝑅𝑏𝑎𝑠𝑒) without Louvered Sides (𝐸𝐸𝑅𝑏𝑎𝑠𝑒)
< 6,000 ≤ 9.0 ≤ 8.5
6,000 - 8,000 ≤ 9.0 ≤ 8.5
8,000 – 13,999 ≤ 9.0 ≤ 8.5
14,000 – 19,999 ≤ 9.0 ≤ 8.0
20,000 ≤ 8.5 ≤ 8.0
Compliance Efficiency from which Incentives are Calculated
Units will be treated as early retirement and total lifetime energy savings will be calculated based
on remaining years of useful life (RUL) of the existing baseline unit. Units greater than 15 years
old will be considered normal replacements and will be given incremental savings. Incremental
savings are defined as the difference between the annual kWh consumption of minimally
compliant with Federal appliance standards and the annual kWh consumption of the new unit.
Room Air Conditioners
Capacity (BTU/hr) with Louvered Sides (𝐸𝐸𝑅𝑒𝑒) withouot Louvered Sides (𝐸𝐸𝑅𝑒𝑒)
< 6,000 11.0 10.0
6,000 - 8,000 11.0 10.0
8,000 – 13,999 10.9 9.6
14,000 – 19,999 10.7 9.5
20,000– 24,999 9.4 9.3
25,000 9.0 9.4
Room Air Conditioners - Casement
Capacity (BTU/hr) Casement Only (𝐸𝐸𝑅𝑒𝑒) Casement - Slider (𝐸𝐸𝑅𝑒𝑒)
All ≤ 9.5 ≤ 10.4
Room (Air Conditioners with Reverse Cycle) Heat Pumps

Commercial and Industrial Measures Record of Revisions 1-16-15
Capacity (BTU/hr) with Louvered Sides (𝐸𝐸𝑅𝑒𝑒) withouot Louvered Sides (𝐸𝐸𝑅𝑒𝑒)
< 6,000 ≤ 9.8 ≤ 9.3
6,000 - 8,000 ≤ 9.8 ≤ 9.3
8,000 – 13,999 ≤ 9.8 ≤ 9.3
14,000 – 19,999 ≤ 9.8 ≤ 8.7
20,000– 24,999 ≤ 9.3 ≤ 8.7
Operating Hours
Refrence Apendix G for applicable value for specific building use type and geographic location.
Effective Useful Life (EUL)
Years: 15
Source: 2005 DEER
Remaining Useful Life (RUL)
RUL = 15 year – (2014 – Year Manufactured)
Ancillary Fossil Fuel Savings Impacts
Ancillary Electric Savings Impacts
References
1. EFLH taken from Coincidence Factor Study Residential Room Air Conditioners,
conducted by RLW Analytics, 2008.
a. neep.org/.../2008-6-23_Final_Report_Coincidence_Factor_Study_Residential
_Room_Air_Conditioners_SPWG.pdf
2. Replacement factor taken from the Nexus Market Research. December 2005. Impact
Process and Market Study of the Connecticut Appliance Retirement Program: Overall
Report. Cambridge, Mass.: Nexus Market
Record of Revision
Record of Revision Number Issue Date
1-16-15 1/1/2016
Return to Table of Contents

Commercial and Industrial Measures Record of Revisions 1-16-16
REFRIGERATION
FREEZER AND COOLER DOOR STRIP CURTAIN
Measure Description
Strip Curtains on both freezers (AKA low temperature) or coolers (AKA medium temperature)
refrigerated walk-in units serve to prevent air infiltration during periods when the main door is
open for routine stocking activity. When damaged and/or missing the warmer, more humid air,
present in the store will infiltrate the unit increasing the demands on the electrical energy
consumed by the refrigeration system and often reducing the efficiency of the evaporator unit as
frost accumulates impairing its effectiveness. This measure applies to strip curtains on the main
door of walk-in units typical of supermarkets, convenience stores, and restaurants.
Method for Calculating Annual Energy and Peak Coincident Demand Savings
Annual Electric Energy Savings
kWhcooler = SFdoor × kWhcooler,per SF
kWhfreezer = SFdoor × kWhfreezer,per SF
Peak Coincident Demand Savings
kWcooler = SFdoor ×kWhcooler,per SF
8760× CF
kWfreezer = SFdoor ×kWhfreezer,per SF
8760 × C𝐹
Annual Gas Energy Savings
N/A
where:
∆kWhcooler = Annual electric energy savings for cooler
∆kWhfreezer = Annual electric energy savings for freezer
∆kWcooler = Peak coincident electrical demand savings for cooler
kW𝑓𝑟𝑒𝑒𝑧𝑒𝑟 = Peak coincident electrical demand savings for freezer
∆kWhcooler, per SF = Annual electric energy savings per square foot of cooler door opening
∆kWhfreezer, per SF = Annual electric energy savings per square foot of freezer door opening
CF = Coincidence Factor
SFdoor = Area of cooler or freezer door opening, in square feet
8,760 = Annual cooler or freezer operating hours per year

Commercial and Industrial Measures Record of Revisions 1-16-16
Summary of Variables and Data Sources
Variable Value Notes
∆kWhcooler, per SF 159 kWh/SF Supermarket, Annual Energy Savings Attributable to
Replacement Strip Curtains at a Cooler (> 32° F)
18 kWh/SF Restaurant, Annual Energy Savings Attributable to
Replacement Strip Curtains at a Cooler (> 32° F)
14 kWh/SF Convenience Store, Annual Energy Savings Attributable
to Replacement Strip Curtains at a Cooler (> 32° F)
∆kWhfreezer, per SF 409 kWh/SF Supermarket, Annual Energy Savings Attributable to
Replacement Strip Curtains at a Freezer (< 32° F)
77 kWh/SF Restaurant, Annual Energy Savings Attributable to
Replacement Strip Curtains at a Freezer (< 32° F)
16 kWh/SF Convenience Store, Annual Energy Savings Attributable
to Replacement Strip Curtains at a Freezer (< 32° F)
CF 0.8 Default Value
SFdoor # SF The entire area of the main door opening expressed as
Square Feet
Coincidence Factor (CF)
The recommended coincidence factor for this measure is 0.8 consistent with all commercial air
conditioning applications.
Baseline Efficiencies from which Savings are Calculated
The baseline efficiency is premised on a door with damaged and or missing strip curtains in
excess of 15% of the door area.
Compliance Efficiency from which Incentives are Calculated
The compliance efficiency is premised on the replacement of the entire door strip curtain
Operating Hours
Operational hours in which the door is open is the primary determinant of associated savings and
therefore the different patterns established by supermarkets, convenience stores, and restaurants
each utilize a unique value.
Effective Useful Life (EUL)
Years: 4
Source: ADM Evaluation

Commercial and Industrial Measures Record of Revisions 1-16-16
Ancillary Fossil Fuel Savings Impacts
Ancillary Electric Savings Impacts
References
1. ADM Associates, Inc. “Commercial Facilities Contract Group 2006-2008 Direct Impact Evaluation”
February 18, 2010, California Public Utilities Commission Energy Division
http://www.calmac.org/publications/ComFac_Evaluation_V1_Final_Report_02-18-2010.pdf\
Record of Revision
Record of Revision Number Issue Date
1-16-16 1-1-2016
Return to Table of Contents

Commercial and Industrial Measures Record of Revisions 1-16-17
REFRIGERATION – FREEZER AND COOLER DOOR GASKETS
Measure Description
Door Gaskets on both freezers (AKA low temperature) or coolers (AKA medium temperature)
refrigerated reach-in display cases are subject to damage due to normal use and/or the failure of
anti-condensate heater elements. When damaged and/or missing the warmer, more humid air,
present in the store will infiltrate the case increasing the demands on the electrical energy
consumed by the refrigeration system and often reducing the efficiency of the evaporator unit as
frost accumulates impairing its effectiveness. This measure applies to gaskets on both reach-in
doors and the main door of walk-in units typical of supermarkets, convenience stores, and
restaurants.
Method for Calculating Annual Energy and Peak Coincident Demand Savings
Annual Electric Energy Savings
kWhcooler = LFdoor × kWhcooler,per LF
kWhfreezer = LFdoor × kWhfreezer,per LF
Peak Coincident Electric Demand Savings
kWcooler = LFdoor ×kWhcooler,per LF
8760× CF
kWfreezer = LFdoor ×kWhfreezer,per LF
8760 × CF
Annual Gas Energy Savings
N/A
where:
kWhcooler = Annual electric energy savings for cooler
kWhfreezer = Annual electric energy savings for freezer
∆kWhcooler, per LF = Annual electric energy savings for cooler door gasket per foot
∆kWhfreezer, per LF = Annual electric energy savings for freezer door gasket per foot
kWcooler = Peak coincident electrical demand savings for cooler
kWfreezer = Peak coincident electrical demand savings for freezer
CF = Coincidence Factor
LFdoor = Linear Feet Damaged / Missing Door Gasket
Summary of Variables and Data Sources
Variable Value Notes
kWhcooler 20 kWh/Linear
Foot
Annual Energy Savings Attributable to Replacement
Door Gasket at a Cooler (> 32° F), Missing /
Damaged Weighted Average¹

Commercial and Industrial Measures Record of Revisions 1-16-17
kWhfreezer 152 kWh/Linear
Foot
Annual Energy Savings Attributable to Replacement
Door Gasket at a Freezer (< 32° F), Missing /
Damaged Weighted Average¹
CF 0.8 Default Value
LFdoor # LF Length of Damaged or Missing Gaskets expressed as
Linear Feet
Coincidence Factor (CF)
The recommended coincidence factor for this measure is 0.8 consistent with all commercial air
conditioning applications.
Baseline Efficiencies from which Savings are Calculated
The baseline efficiency is premised on a door with damaged and or missing gaskets. A weighted
average is used to proportion energy savings between both these conditions premised on the
survey results conducted by the referenced study, Table 5-4.
Compliance Efficiency from which Incentives are Calculated
The compliance efficiency is premised on the replacement of the entire door gasket so as to
achieve a minimum 1.5% or less infiltration rate.
Operating Hours
N/A
Effective Useful Life (EUL)
Years: 4
Source: ADM Evaluation
Ancillary Fossil Fuel Savings Impacts
Ancillary Electric Savings Impacts
References
1. ADM Associates, Inc. “Commercial Facilities Contract Group 2006-2008 Direct Impact
Evaluation” February 18, 2010, California Public Utilities Commission Energy Division
http://www.calmac.org/publications/ComFac_Evaluation_V1_Final_Report_02-18-
2010.pdf\

Commercial and Industrial Measures Record of Revisions 1-16-17
Record of Revision
Record of Revision Number Issue Date
1-16-17 1-16-2016
Return to Table of Contents

Commercial and Industrial Measures Record of Revisions 1-16-18
LOW- FLOW PRE-RINSE SPRAY VALVE
Measure Description
Pre-Rinse Spray Valves (PRSV) —often used in commercial and institutional kitchens—are designed to
remove food waste from dishes prior to dishwashing. Retrofitting existing standard PSRV’s in locations
where service water is supplied by electric or natural gas fired hot water heaters with new low flow pre-
rinse spray nozzles reductions in hot water consumption result in corresponding fuel savings.
Method for Calculating Annual Energy and Peak Coincident Demand Savings
Annual Electric Energy Savings
kWh = units × ((GPMbaseline - GPMee) × 60) × hrsop × (Theater - Tmain) ×( 8.33 lb
1 𝑔𝑎𝑙 ×
1 BTU
𝑙𝑏℉ ×
1 kWh
3412 𝐵𝑇𝑈 )×
1
𝐸𝐹ele
Peak Coincident Electrical Demand Savings
kW = kW x 0.3
Annual Gas Energy Savings
therms = units × ((GPMbaseline - GPMee) × 60) × hrsop × (Theater - Tmain) × (8.33 lb
1 𝑔𝑎𝑙 ×
1 BTU
𝑙𝑏℉ ×
1 Therm
100,000 𝐵𝑇𝑈 ) ×
1
𝐸𝐹gas
where:
kWh = Annual electric energy savings
kW = Peak coincident demand electric savings
kW = Rated wattage of electrical water heater
therms = Annual gas energy savings
units = Number of PRSV installed
GPMbaseline = Gallons per minute for the baseline condition
GPMee = Gallons per minute for the energy efficient measure
hrsop = Operating hours
Theater = Water temperature at PRSV output, default value 130℉
Tmain = Average water supply input temperature, see table
EFgas = Gas fired water heater efficiency, energy factor
EFele = Electric water heater efficiency, energy factor
0.3 = Confidence Factor, proportionate to reduced water consumption ( GPMbaseline - GPMee
GPMbaseline
)
8.33 = Energy required (BTU’s), to heat one gallon of water by one degree Fahrenheit
60 = Conversion factor, Minutes to Hour
3,412 = Conversion factor, one kW equals 3,412 BTU/h
100,000 = Conversion factor (BTU/therm), one therm equals 100,000 BTU’s

Commercial and Industrial Measures Record of Revisions 1-16-18
Summary of Variables and Data Sources
Variable Value Notes
units # From application, quantity of PRSV’s installed
GPMbaseline 1.6 PRSV Minimum Standard1 effective 2006
GPMee 1.12 LF PRSV GPM default value
Theater 130 Average water temperature output at the PRSV
Tmain # Average Water Supply Input Temperature
EFele # Electric Efficiency Factor, see Table
EFgas # Gas Efficiency Factor, see Table
Average Water Supply Input Temperature
City Annual average outdoor
temperature (°F) T main (°F)
Albany 48.2 54.2
Binghamton 46.9 52.9
Buffalo 48.3 54.3
Massena 44.7 50.7
Syracuse 48.6 54.6
Upstate average 47.3 53.3
Long Island 56.5 62.5 NYC 56.5 55.0
Current Minimum Federally Mandated Efficiency Energy Factors (Manufactured AFTER April 16, 2015) Rated
Storage
Volume ‘Tankless” 30 40 50 65 80 120
Gas .82 .63 .62 .60 .75 .75 .74
Electric .95 .95 .95 .95 1.98 1.97 1.92
Current Minimum Federally Mandated Efficiency Energy Factors (Manufactured BETWEEN January 20,2004 and April 16, 2015) Rated
Storage
Volume 20 30 40 50 65 80 120
Gas .62 .61 .62 .60 .75 .75 .74
Electric .94 .93 .92 .90 .88 .86 .81
Coincidence Factor (CF)
The recommended coincidence factor for this measure is 0.8.
Baseline Efficiencies from which Savings are Calculated
The baseline condition is a standard efficiency PRSV.
1Energy Policy Act of 2005 (EPAct 2005).
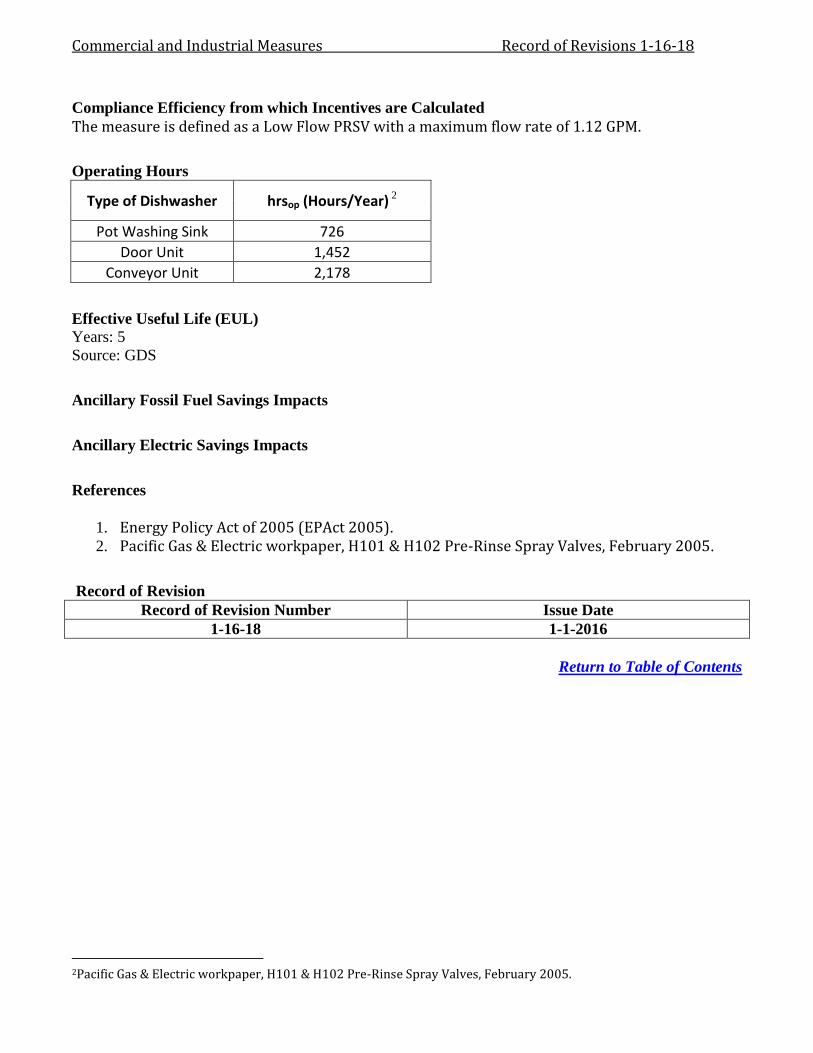
Commercial and Industrial Measures Record of Revisions 1-16-18
Compliance Efficiency from which Incentives are Calculated
The measure is defined as a Low Flow PRSV with a maximum flow rate of 1.12 GPM.
Operating Hours
Type of Dishwasher hrsop (Hours/Year) 2
Pot Washing Sink 726
Door Unit 1,452
Conveyor Unit 2,178
Effective Useful Life (EUL)
Years: 5
Source: GDS
Ancillary Fossil Fuel Savings Impacts
Ancillary Electric Savings Impacts
References
1. Energy Policy Act of 2005 (EPAct 2005).
2. Pacific Gas & Electric workpaper, H101 & H102 Pre-Rinse Spray Valves, February 2005.
Record of Revision
Record of Revision Number Issue Date
1-16-18 1-1-2016
Return to Table of Contents
2Pacific Gas & Electric workpaper, H101 & H102 Pre-Rinse Spray Valves, February 2005.

Residential and Multi-Family Measure Record of Revision 1-16-19 THERMOSTAT
PROGRAMMABLE SETBACK (NON-COMMUNICATING) AND WIFI (COMMUNICATING)
MEASURE DESCRIPTION
This section covers programmable setback thermostats (non-communicating) and Wi-Fi communicating thermostats applied to single-family and multi-family residential air conditioners, heat pumps, boilers, furnaces and electric resistance baseboard heating systems.
THERMOSTAT – PROGRAMMABLE SETBACK (NON-COMMUNICATING)
Measure Description
Programmable setback thermostats applied to single-family and multi-family residential air conditioners, heat pumps, boilers, furnaces and electric resistance baseboard heating systems. Method for Calculating Annual Energy and Peak Coincident Demand Savings Annual Electric Energy Savings
ΔkWh = units × tons/unit × [
SEER
12
× EFLHcooling × Fcooling +
unit
kBTUhout
×
HSPF
EFLHheating
×
Fheating ] Peak Coincident Demand Savings
ΔkW = N/A Annual Gas Energy Savings
Δtherms = units ×
unit
kBTUh in ×
100
EFLHheating × Fheating
where: ΔkWh = Annual electric energy savings ΔkW = Peak coincident demand electric savings Δtherms = Annual gas energy savings units = The number of air conditioning units installed under the program tons/unit = Tons of air conditioning per unit, based on nameplate data SEER = Seasonal average energy efficiency ratio over the cooling season, BTU/watt-hour,
(used for average U.S. location/region)seasonal average energy efficiency ratio (BTU/watt-hour)
12 = kBTUh/ton of air conditioning capacity 100 = Conversion factor, kBTUh/therm Fheating = Energy factor for heating

Residential and Multi-Family Measure Record of Revision 1-16-19 Fcooling = Energy factor for cooling kBTUhout = Annual gas output rating kBTUhin = Annual gas input rating HSPF = Heating seasonal performance factor EFLH = Equivalent full-load hours heating = Heating cooling = Cooling
Summary of Variables & Data Sources
Variable Value Notes
tons From application or use 3 as default. Use 0 if no central cooling
SEERbaseline 10 EFLHcooling Vintage weighted average by city. Fcooling 0.09 Energy factor for cooling EFLHheating Vintage weighted average by city. Fheating 0.068 Energy factor for heating If heat pump: kBTUh/unitout From application or use 70 kBTU/hr as default
HSPFbaseline 6.8
Heating seasonal performance factor, total heating output (supply heat) in BTU (including electric heat) during the heating season / total electric energy heat pump consumed (in watt/hr)
if furnace
kBTUhin/unit
From application or use 90 kBTU/hr as a default. Use wt average of furnace and boiler if system type unknown.
if boiler
kBTUhin/unit
From application or use 110 kBTU/hr as default. Use wt average of furnace and boiler if system type unknown.
If resistance heater
kBTUhin/unit From application or use 12 kBTU/hr (3.5 kW) as default
HSPFbaseline 3.412 Equivalent to COP = 1 The nominal rating of the cooling capacity of the air conditioner or heat pump should set equal to the rated capacity of all cooling equipment controlled by a setback thermostat in the home. The energy savings should be calculated per residence rather than per thermostat. The nominal rating of the heating capacity of the heat pump should set equal to the rated capacity of all heating equipment controlled by a setback thermostat in the home. The energy savings should be calculated per residence rather than per thermostat.

Residential and Multi-Family Measure Record of Revision 1-16-19 Coincidence Factor (CF)
The recommended value for the coincidence factor is: N/A
Operating Hours
Nameplate capacity for heat pumps should include the full heating capacity of the heat pump system, including backup electric resistance heaters. Cooling and heating EFLH data by location, building type and vintage are tabulated in Appendix G.
Baseline Efficiencies from which Savings are Calculated
The baseline efficiency for air conditioners and heat pumps should be set according to the sections on air conditioner and heat pump efficiency above. Electric resistance heating systems should use an HSPF = 3.412, which is equivalent to a coefficient of performance of 1.0. Studies of residential heating thermostat set point behavior indicate some amount of manual setback adjustment in homes without programmable thermostats. This behavior is accounted for in the prototypical building simulation model used to calculate heating equivalent full-load hours, as described in Appendix A. An assumption of 3°F of night time setback behavior is embedded in the models.
Compliance Efficiency from which Incentives are Calculated
The energy savings factor for heating (Fheating) is the ratio of the energy savings resulting from installation of a programmable setback thermostat to the annual heating energy. The heating energy savings factor assumption is taken from a study of programmable thermostat savings in Massachusetts conducted by RLW Analytics. The study estimated an energy savings of 6.8% of the annual heating energy consumption for programmable setback thermostats in residential applications. The cooling energy savings factor (Fcooling) is the ratio of the energy savings resulting from installation of a programmable setback thermostat to the annual cooling energy. The cooling energy savings factor assumption is taken from the Energy Star website. The Energy Star calculator estimates an energy savings of 3% of the annual cooling energy consumption per degree of setback for programmable setback thermostats in residential applications. Assuming an average of 3 degrees of setback, the recommended value for the cooling energy savings factor is 9%.
Operating Hours
Cooling and heating equivalent full-load hours calculated from building energy simulation models are described in Appendix A and summarized in Appendix G.
Effective Useful Life (EUL)
Years: 11 Source: DEER

Residential and Multi-Family Measure Record of Revision 1-16-19 Ancillary Fossil Fuel Savings Impacts
Ancillary Electric Savings Impacts
References
1. For examples of studies on residential thermostat set point behavior, see the literature review conducted for the California Energy Commission project “Residential Thermostats: Comfort Controls in California Homes,” CEC-500-03-026, available at http://comfortcontrols.lbl.gov/pdf/tstats-lit-review.pdf.
2. Baseline thermostat setback assumptions taken from: Conner, C.C. and Lucas, R.L. 1990. Thermostat Related Behavior and Internal Temperatures Based on Measured Data in Residences. PNL-7465, Pacific Northwest Laboratory. Richland, WA.
3. The RLW study on thermostat energy savings can be found at www.cee1.org/eval/db_pdf/933.pdf
4. Programmable thermostat savings for the cooling season taken from the Energy Star website: www.energystar.gov
5. Electric resistance systems generally require line voltage thermostats capable of controlling the rated current of the baseboard unit. Programmable line voltage thermostats are not common, but are available. Thermostats controlling heat pumps should have a heat pump recovery mode to minimize operation of electric resistance heaters during the temperature recovery period.
Record of Revision
Record of Revision Number Issue Date 0 10/15/2010
Return to Table of Contents
Residential and Multi-Family Measure Record of Revision 1-16-19 THERMOSTAT – Wi-Fi (COMMUNICATING)
Measure Description This section covers Wi-Fi communicating thermostats applied to single-family and multi-family residential air conditioners, heat pumps, boilers, furnaces and electric resistance baseboard heating systems. These communicating thermostats allow set point adjustment via a remote application. The unit must contain an outdoor air temperature algorithm in the unit’s control logic to operate the primary heating and cooling systems. Method for Calculating Annual Energy and Peak Coincident Demand Savings Unit savings are deemed based on a recent evaluation study from New England1. Annual Gas Energy Savings
Δtherms = Annual gas savings per thermostat unit of 63 therms. Annual Electric Energy Savings (Cooling) ΔkWh = Annual electric energy savings per thermostat unit of 104 kWh. Peak Coincident Demand Savings ΔkW = Annual peak demand savings per thermostat unit of 0.23 kW.
Baseline Efficiencies from which Savings are Calculated The baseline efficiency is an HVAC system using natural gas or electricity to provide space heating with either a manual or a programmable thermostat. Compliance Efficiency from which Incentives are Calculated The higher energy efficiency level is an HVAC system that has a Wi-Fi thermostat installed.
Effective Useful Life (EUL) Years: 11 Source: DEER
Record of Revision
Record of Revision Number Issue Date 1-16-19 1/1/2016
Return to Table of Contents 1 Cadmus Group (September 2012) Wi-Fi Programmable Controllable Thermostat Pilot Program Evaluation for the Electric and Gas Program Administrators of Massachusetts