via electronic filing 3.7-4.2 ghz... · in the top 40 peas in the broadcast incentive auction was...
TRANSCRIPT

601 Pennsylvania Ave., NW
Suite 800
Washington, DC 20004
202-654-5900
June 15, 2018
VIA ELECTRONIC FILING
Ms. Marlene H. Dortch, Secretary
Federal Communications Commission
445 12th Street, S.W.
Washington, D.C. 20554
Re: Written Ex Parte Communication
GN Docket No. 17-183, Expanding Flexible Use in Mid-Band Spectrum Between 3.7 and
24 GHz; and
GN Docket No. 18-122, Expanding Flexible Use of the 3.7 GHz to 4.2 GHz Band.
Dear Ms. Dortch:
T-Mobile USA, Inc. (“T-Mobile”)1/ appreciates the Commission’s continued efforts to make
mid-band spectrum available for terrestrial wireless use. As the record in the above proceedings
demonstrates, countries around the world are pursuing mid-band spectrum as a critical input for
fifth generation wireless (“5G”) networks.2/ The 3.7-4.2 GHz band presents the Commission
with an important opportunity to ensure that the U.S. remains at the forefront of 5G
development. The band’s propagation characteristics and available bandwidth make it ideal for
next generation wireless services. T-Mobile therefore applauds Chairman Pai’s announcement
that he will introduce a Notice of Proposed Rulemaking (“NPRM”) proposing more intensive,
terrestrial use of the 3.7-4.2 GHz band at the Commission’s July meeting.3/
As many have noted, in order to maximize the utility of the 3.7-4.2 GHz band for 5G wireless
terrestrial use, the Commission must address the presence of satellite incumbents in the
1/ T-Mobile USA, Inc. is a wholly owned subsidiary of T-Mobile US, Inc., a publicly traded
company.
2/ See, e.g., Comments of CTIA, GN Docket No. 18-122, at 3 (filed May 31, 2018) (“Across the
globe, the race for 5G is on and mid-band spectrum is increasingly viewed as a key component to
unlocking the benefits of 5G connectivity.”); Comments of Nokia, GN Docket No. 17-183, at 5 (filed Oct.
2, 2017) (“The 3.55-4.2 GHz range is also being considered in other regions and countries for 5G and has
a potential to become a globally harmonized range.”).
3/ Remarks of FCC Chairman Ajit Pai at the Wireless Infrastructure Association Connectivity Expo,
Charlotte, NC (May 23, 2018), https://docs.fcc.gov/public/attachments/DOC-350919A1.pdf.
2
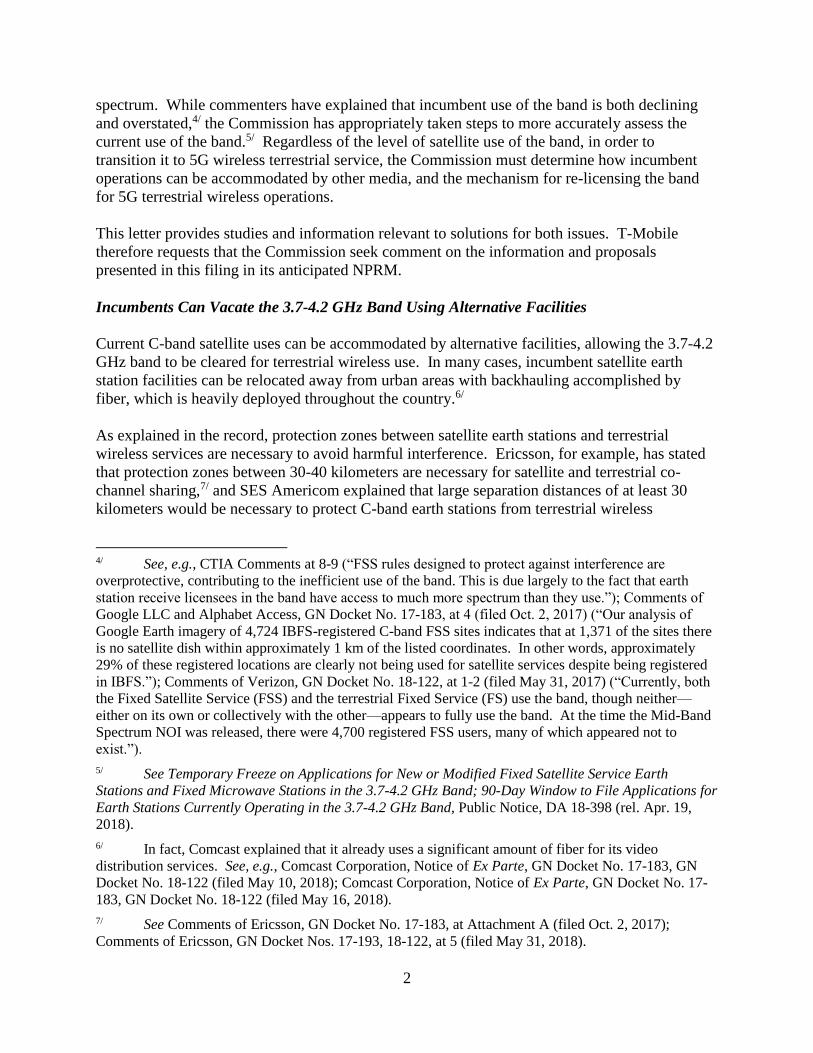
spectrum. While commenters have explained that incumbent use of the band is both declining
and overstated,4/ the Commission has appropriately taken steps to more accurately assess the
current use of the band.5/ Regardless of the level of satellite use of the band, in order to
transition it to 5G wireless terrestrial service, the Commission must determine how incumbent
operations can be accommodated by other media, and the mechanism for re-licensing the band
for 5G terrestrial wireless operations.
This letter provides studies and information relevant to solutions for both issues. T-Mobile
therefore requests that the Commission seek comment on the information and proposals
presented in this filing in its anticipated NPRM.
Incumbents Can Vacate the 3.7-4.2 GHz Band Using Alternative Facilities
Current C-band satellite uses can be accommodated by alternative facilities, allowing the 3.7-4.2
GHz band to be cleared for terrestrial wireless use. In many cases, incumbent satellite earth
station facilities can be relocated away from urban areas with backhauling accomplished by
fiber, which is heavily deployed throughout the country.6/
As explained in the record, protection zones between satellite earth stations and terrestrial
wireless services are necessary to avoid harmful interference. Ericsson, for example, has stated
that protection zones between 30-40 kilometers are necessary for satellite and terrestrial co-
channel sharing,7/ and SES Americom explained that large separation distances of at least 30
kilometers would be necessary to protect C-band earth stations from terrestrial wireless
4/ See, e.g., CTIA Comments at 8-9 (“FSS rules designed to protect against interference are
overprotective, contributing to the inefficient use of the band. This is due largely to the fact that earth
station receive licensees in the band have access to much more spectrum than they use.”); Comments of
Google LLC and Alphabet Access, GN Docket No. 17-183, at 4 (filed Oct. 2, 2017) (“Our analysis of
Google Earth imagery of 4,724 IBFS-registered C-band FSS sites indicates that at 1,371 of the sites there
is no satellite dish within approximately 1 km of the listed coordinates. In other words, approximately
29% of these registered locations are clearly not being used for satellite services despite being registered
in IBFS.”); Comments of Verizon, GN Docket No. 18-122, at 1-2 (filed May 31, 2017) (“Currently, both
the Fixed Satellite Service (FSS) and the terrestrial Fixed Service (FS) use the band, though neither—
either on its own or collectively with the other—appears to fully use the band. At the time the Mid-Band
Spectrum NOI was released, there were 4,700 registered FSS users, many of which appeared not to
exist.”).
5/ See Temporary Freeze on Applications for New or Modified Fixed Satellite Service Earth
Stations and Fixed Microwave Stations in the 3.7-4.2 GHz Band; 90-Day Window to File Applications for
Earth Stations Currently Operating in the 3.7-4.2 GHz Band, Public Notice, DA 18-398 (rel. Apr. 19,
2018).
6/ In fact, Comcast explained that it already uses a significant amount of fiber for its video
distribution services. See, e.g., Comcast Corporation, Notice of Ex Parte, GN Docket No. 17-183, GN
Docket No. 18-122 (filed May 10, 2018); Comcast Corporation, Notice of Ex Parte, GN Docket No. 17-
183, GN Docket No. 18-122 (filed May 16, 2018).
7/ See Comments of Ericsson, GN Docket No. 17-183, at Attachment A (filed Oct. 2, 2017);
Comments of Ericsson, GN Docket Nos. 17-193, 18-122, at 5 (filed May 31, 2018).

3
operations.8/ The higher the population within the protection zones, the greater the potential
impact on mobile use of the spectrum. Accordingly, relocating earth stations outside of urban
areas will reduce the likelihood of interference to mobile services and vice versa. Traffic from
the new earth station location could then be backhauled to the original site.
Such relocation to alternative facilities is readily achievable. The attached case study
demonstrates the feasibility of clearing all earth station use within 60 kilometers of the Phoenix
Cellular Market Area (“CMA”).9/ The Phoenix Study includes a map and list of the relocated
stations. The Phoenix Study considered two primary options. The first option examines a case
in which a user has another receive earth station located farther outside of Phoenix, and
backhauls traffic from the farther station via fiber to the current nearer station.10/ Earth stations
operated by the Associated Press, Cable One, Cox, and Fox fall under this option. The second
case examines a situation in which a user does not have access to alternative facilities, so an
antenna farm is created outside the Phoenix metropolitan area with traffic then backhauled to the
current earth station location.11/ All other earth stations studied fall under this option. Maps
demonstrating these two options are included in the study. The Phoenix Study shows the earth
stations that would be affected by reallocating the 3.7-4.2 GHz band for 5G wireless terrestrial
use and demonstrates how traffic currently received at those earth stations could be re-
configured. This approach would fully accommodate end user requirements while permitting the
3.7-4.2 GHz band to be used to meet critical 5G wireless terrestrial mid-band spectrum needs.
Roberson and Associates, LLC conducted a similar analysis, examining how traffic received by
earth stations in Chicago can be accommodated in a reallocation of the 3.7-4.2 GHz band.12/ A
copy of this study is also attached. The Roberson Study assumes the same goal as the Phoenix
Study – clearing all satellite receivers from C-band downlink spectrum in an urban area. The
Roberson Study, however, suggests that there may be additional alternatives to continuing to
receive content via backhauled satellite transmissions. The primary option – as in the Phoenix
Study – would be the relocation of current satellite earth stations to areas outside the urban core.
An alternative the Roberson Study considers is receipt of content exclusively via fiber links,
rather than through earth station locations. As the Roberson Study demonstrates, there are
multiple fiber providers, including Internet Service Providers (“ISPs”), in the Chicago area.13/
And over half of the ISPs mentioned in the study have more than 80% coverage in Chicago.14/
In addition to presenting options for accommodating traffic received by current C-band earth
stations, the Roberson Study examined the cost models for each of the proposed options.
8/ See Reply Comments of SES Americom, GN Docket No. 17-183, at 18-20 (filed Nov. 15, 2017).
9/ THE PHOENIX STUDY (2018).
10/ Id. at 5-9.
11/ Id. at 5, 10.
12/ ROBERSON AND ASSOCIATES, LLC, MID-BAND ASSESSMENT: COST FACTORS AFFECTING FIBER
AS AN ALTERNATIVE TO SATELLITE (2018).
13/ Id. at 19, 23.
14/ Id. at 23.

4
According to the estimates, implementing the two options in the Chicago area would cost
approximately $8 million – a minimal amount in comparison to the value of spectrum in
Chicago.15/
The Commission Should Auction the 3.7-4.2 GHz Band
As the analyses discussed above demonstrate, it is possible to clear a significant portion of the
3.7-4.2 GHz spectrum while still meeting the operational requirements of the band’s incumbents.
The Commission should therefore maximize the opportunity for 5G wireless terrestrial mid-band
spectrum use by making all of the spectrum in the 3.7-4.2 GHz band available in an auction and
using the techniques noted above and the market-based auction mechanisms described here to
address incumbent operations.
As T-Mobile has recognized in the past, the presence of incumbent operations means that the
Commission may wish to consider auction processes that incorporate market forces that can help
expedite incumbent relocation processes.16/ The SES, Intel, and Intelsat proposal,17/ which
would use market-based approaches to incentivize relocation, is a step in the right direction. But
as T-Mobile previously detailed,18/ the proposal has several flaws. Most notably, there is no
guarantee that any spectrum would actually be made available for wireless use. And where
spectrum is made available, the sellers would have a monopoly they could use to demand prices
that a truly competitive market would not support, which would make less than the socially
optimal amount of spectrum available for terrestrial use. The Commission should therefore not
adopt the SES, Intel, and Intelsat proposal as it has been presented. Any licensing and relocation
mechanism the Commission adopts should promote the greatest possible amount of terrestrial
15/ See, e.g., The Incentive Auction “By the Numbers,” FCC,
https://docs.fcc.gov/public/attachments/DOC-344398A1.pdf (stating that the average price/MHz-pop sold
in the Top 40 PEAs in the broadcast incentive auction was $1.31); Phil Goldstein, Analysts: Bidding in
NYC, LA and Chicago in AWS-3 Auction Is 94% Above Average Prices, FIERCEWIRELESS (Dec. 19,
2014, 11:47 AM), https://www.fiercewireless.com/wireless/analysts-bidding-nyc-la-and-chicago-aws-3-
auction-94-above-average-prices (discussing the AWS-3 auction and estimates that “‘the three largest
U.S. cities are going for a price of $4.29 per MHz/POP (including paired and unpaired)--or 94% above
the average price.’”).
16/ See Reply Comments of T-Mobile USA, Inc., GN Docket No. 17-183, at 16 (filed Nov. 15, 2017)
(“[A] licensee with sufficient incentive may be able to clear spectrum and find alternative means for
meeting service requirements more quickly and efficiently than an incumbent forced to clear pursuant to a
mandate.”).
17/ Intelsat, Intel, and SES propose a consortium of satellite operators that would clear “a target” of
approximately 100 megahertz of spectrum and that would negotiate secondary market agreements with
terrestrial mobile service providers for access to specific spectrum blocks on a market-by-market basis.
Terrestrial providers would then apply to the Commission for licenses authorizing them to provide service
in the agreed-upon market areas and spectrum blocks. See SES Americom, Inc. and Intelsat Corporation,
Notice of Ex Parte, GN Docket No. 17-183 (filed Feb. 9, 2018).
18/ See, e.g., T-Mobile USA, Inc. Notice of Ex Parte, GN Docket Nos. 17-183, 17-258, and 14-177,
at 4 (filed Feb. 14, 2018); Reply Comments of T-Mobile USA, Inc., GN Docket No. 17-183, at 13-14
(filed Nov. 15, 2017).

5
mobile use and eliminate the potential for monopoly pricing or actions by a single licensee to
block access to the band.
T-Mobile therefore proposes an outline of an alternative method for conducting an auction of the
3.7-4.2 GHz band for 5G wireless terrestrial use. T-Mobile’s proposal is intended to promote the
availability of spectrum in all geographic areas and would allow satellite operators to participate
in an auction process to determine the value of the spectrum for satellite service relative to
terrestrial mobile service. The proposal presented here is not intended to provide all the relevant
details regarding how the auction would be conducted – T-Mobile expects that responses to the
NPRM will provide the Commission with feedback on the additional auction components, some
of which are identified below.
The proposal’s core framework is an incentive auction with a descending amount of spectrum, in
which a consortium comprised of all satellite licensees (the “satellite consortium”) is the seller
and potential wireless providers would be the buyers.19/ Broadly, the proposed framework would
proceed as follows:
1. Phase 1 – Initial Price Setting for all 500 Megahertz. The first phase of the T-Mobile
plan would be an auction for licenses for all 500 megahertz of spectrum in each
geographic area. Consistent with the geographic area in the 600 MHz incentive auction
and in other upcoming auctions,20/ T-Mobile proposes that the Commission auction the
3.7-4.2 GHz band on a Partial Economic Area (“PEA”) basis (the amount of spectrum in
each block available at auction would be determined based on comments received in
response to the NPRM). The auction would also include – in addition to the standard
geographic area licenses – a limited number of license areas defined by the satellite
consortium and within which satellite operations could be protected from terrestrial
wireless operations. These satellite designated zones (“SDZs”) would be carved out from
and auctioned alongside the PEA license areas as described below. The means by which
SDZs are defined and the number permitted per PEA would be developed through the
NPRM responses. But, their location and number would be intended to accommodate
satellite use as described in the Phoenix Study and the Roberson Study and would be
structured to impose a limited impact on 5G wireless terrestrial use in the PEA.
2. Phase 2 – Satellite Consortium Opportunity to Sell all 500 Megahertz at Initial Price.
The second phase of the T-Mobile plan would permit the satellite consortium to sell the
500 megahertz of spectrum at the prices per area established in the initial phase. The
satellite consortium would be treated as a single reverse auction seller that would identify
the geographic areas in which its members would vacate all 500 megahertz for the initial
auction phase price. These areas would be deemed “cleared” for terrestrial wireless use.
19/ One of the issues the Commission would be required to address is the potential of satellite
providers not participating in the consortium.
20/ See Expanding the Economic and Innovation Opportunities of Spectrum Through Incentive
Auctions, Report and Order, 29 FCC Rcd 6567, ¶ 44 (2014); Auctions of Upper Microwave Flexible Use
Licenses for Next-Generation Wireless Services; Comment Sought on Competitive Bidding Procedures
for Auctions 101 (28 GHz) and 102 (24 GHz); Bidding in Auction 101 Scheduled to Begin November 14,
2018, Public Notice, FCC 18-43, ¶ 3 (rel. Apr. 17, 2018) (“Auction 102 will offer 2,912 licenses in the 24
GHz band, and the licenses will be based on PEAs.”).

6
All geographic areas for which 500 megahertz is not cleared would be included in the
next phase of the auction.
3. Phases 3, 4 and Beyond —Price Setting for Decreasing Amounts of Spectrum in
Uncleared Areas Followed by Reverse Auctions for Those Areas. During the third phase,
another forward auction would be held for the remaining, uncleared geographic areas, but
now with some pre-designated amount of spectrum held out of the auction and reserved
for satellite use. As before, a reverse auction would follow in which the satellite
consortium would choose the areas in which its members would vacate the amount of
broadband spectrum to be cleared for the forward auction price. This process would
repeat, each time reducing the amount of spectrum available for wireless use in each
license area where the satellite consortium had not accepted the forward auction price,
until a Commission-determined minimum amount of spectrum per geographic area is
reached.21/
4. Minimum Spectrum Phase. The final phase would be a forward auction only. Satellite
companies would be required to vacate a Commission-designated minimum amount of
spectrum in all remaining areas, regardless of the price received.
5. Assignment Round. After the phases above, there would be an assignment round similar
to that in the 600 MHz incentive auction. Any spectrum that is not won at auction would
remain authorized for satellite use.
Auction revenues would be split between the federal government and the satellite consortium.22/
In exchange for those revenues, the satellite consortium would be responsible for the costs, if
any, of relocating end users. To incentivize the satellite consortium to clear the greatest amount
of spectrum, T-Mobile proposes dividing the revenues on a sliding scale: the more spectrum
cleared in a geographic area, the higher the percentage of revenues the satellite consortium
receives in that area. For instance, if all 500 megahertz is cleared the satellite incumbents might
receive 100% of the auction revenue; if 400 megahertz is cleared they might receive 80%, etc.
Apportioning the revenues on a sliding scale would counterbalance the monopoly incentives of
the satellite consortium and provide it with an economic incentive to sell spectrum while
granting the satellite consortium the opportunity to retain the spectrum its members deem
necessary for continued service.
While the above describes a core framework for a 3.7-4.2 GHz band auction, as noted, further
development is necessary. The Commission should therefore seek comment on this auction
proposal and on ways to refine it in the upcoming NPRM. T-Mobile has identified several of the
open issues above, including:
21/ The Commission may wish to consider whether the amount of spectrum that can be retained by
the satellite consortium may be different in SDZs than in PEAs. Notably, satellite industry
representatives have stated that they would be able to make a minimum of 100 megahertz available
wireless use. See, e.g., SES Americom and Intelsat, Notice of Ex Parte, GN Docket Nos. 17-183, 18-122,
at 2 (filed May 23, 2018).
22/ In the NPRM, the Commission would be required to explore the contours of its authority to
distribute proceeds of the auction to the satellite consortium.

7
the amount of spectrum in each block that will be available at auction;
how SDZs are defined and the number of SDZs per PEA permitted;
the minimum amount of spectrum satellite companies will be required to vacate in each
license area;
how to address the potential of satellite providers declining to participate in the satellite
consortium; and
the contours of the Commission’s authority to distribute proceeds of the auction to the
satellite consortium.
Conclusion
Clearing the 3.7-4.2 GHz band by relocating satellite incumbents and auctioning the 500
megahertz of spectrum for 5G wireless terrestrial use will help ensure that the U.S. remains in
step with other countries in the global race to 5G. T-Mobile therefore urges the Commission to
seek comment on the proposals presented in this letter and on the attached analyses regarding
relocation of satellite incumbents from the 3.7-4.2 GHz band in its upcoming NPRM.
* * *
Pursuant to Section 1.1206(b)(2) of the Commission’s rules, an electronic copy of this letter is
being filed in the above-referenced dockets. Please direct any questions regarding this filing to
me.
Respectfully submitted,
/s/ Steve B. Sharkey
Steve B. Sharkey
Vice President, Government Affairs
Technology and Engineering Policy
Attachments

Phoenix Earth Station Relocation Study
May 30, 2018

Phoenix Case Study• There are studies in the record that demonstrate the separation distance required
between IMT base stations and C band earth stations to prevent interference to earth stations– Ericsson filed a study on October 2, 2017 that concluded a minimum separation distance of 30
kilometers would be required, and as high as 50 – 70 kilometers for more stringent I/N assumption and lower earth station elevation angles
– SES filed a study on March 2, 2018 which confirmed Ericsson’s results by showing that the distance required to protect five earth stations from a single base station in the Virginia Beach area was 30-40 kilometers
• Both studies considered earth stations in urban and suburban areas• Neither study considered additional commonly-applied mitigation techniques such
as shielding that could reduce the separation distance required• Neither study contemplated moving urban and suburban base stations to rural
areas• To understand the feasibility of relocating C band earth stations and the
requirements for doing so, the following study contemplates relocating all earth stations within 60 kilometers of the Phoenix CMA border to more remote locations outside the CMA– This would free up the entire 500 MHz of the C band for wireless broadband use in the entire
CMA– This is an overly conservative approach that may be modified for other markets

Phoenix C Band Earth Stations
Relocation of 33 licensed earth stations within 60 kilometers of the Phoenix CMA (orange triangles) frees up 500 MHz of spectrum in the CMA
60 km

Call_Sign Licensee Case File_Num Location State AMSL Lat Lon
E6100 Associated Press 1 SES-RWL-20030826-01180 MESA AZ 376.4 33.4133 -111.8342
E6101 Associated Press 1 SES-RWL-20030826-01167 PHOENIX AZ 332.1 33.4517 -112.0711
E6180 Associated Press 1 SES-RWL-20030916-01289 CASA GRANDE AZ 425.2 32.8772 -111.7525
E6181 Associated Press 1 SES-RWL-20030916-01290 SUN CITY AZ 349.6 33.6003 -112.2756
E880093 Associated Press 1 SES-RWL-20071127-01619 PHOENIX AZ 331 33.4539 -112.0697
E980439 Associated Press 1 SES-RWL-20080903-01144 Tempe AZ 355.1 33.4197 -111.9335
E990464 Associated Press 1 SES-RWL-20091029-01373 PHOENIX AZ 339.2 33.4944 -112.1133
E990490 Associated Press 1 SES-RWL-20091029-01393 PHOENIX AZ 348.7 33.5178 -112.0825
E040294 Cable One, Inc. 1 SES-LIC-20040702-00951 CHANDLER AZ 352 33.3111 -111.9540
E3991 Cox 1 SES-RWL-20120112-00053 WICKENBURG AZ 677 33.9650 -112.7525
E8014 Cox 1 SES-RWL-20041215-01841 PHOENIX AZ 410 33.6456 -112.1156
E970204 Cox 1 SES-RWL-20070207-00200 CHANDLER AZ 359.7 33.3042 -111.9128
E000528 Fox 1 SES-RWL-20100717-00930 PHOENIX AZ 329.18 33.4486 -112.0804
E000529 Fox 1 SES-RWL-20100717-00931 PHOENIX AZ 347.47 33.5180 -112.0799
E010254 Antenna Technology Communications, Inc. 2 SES-MOD-20140304-00124 CHANDLER AZ 352 33.3111 -111.9533
E010255 Antenna Technology Communications, Inc. 2 SES-MOD-20140304-00123 CHANDLER AZ 352 33.3111 -111.9533
E140033 Antenna Technology Communications, Inc. 2 SES-LIC-20140304-00122 Chandler AZ 357.2 33.3111 -111.9532
E130055 CBS 2 SES-REG-20130318-00271 Phoenix AZ 331.01 33.4579 -112.0744
E020233 EchoStar 2 SES-RWL-20170919-01033 GILBERT AZ 381 33.3669 -111.8147
E060399 EchoStar 2 SES-LIC-20061031-01927 Gilbert AZ 371.86 33.3668 -111.8137
E170093 EchoStar 2 SES-LIC-20170414-00403 Gilbert AZ 381 33.3667 -111.8147
E970396 EchoStar 2 SES-RWL-20070921-01306 GILBERT AZ 371.3 33.3668 -111.8142
E030162 Iridium Constellation LLC 2 SES-LIC-20030722-01016 Chandler AZ 362.7 33.2663 -111.8815
E030112 KDMA CHANNEL 25, INC. 2 SES-REG-20030513-00643 PHOENIX AZ 440.1 33.6955 -112.0947
E950195 KPHO Broadcasting Corporation 2 SES-MOD-20160104-00002 PHOENIX AZ 348.9 33.5184 -112.0809
E060267 Maricopa County Community College District 2 SES-REG-20060717-01163 TEMPE AZ 348.1 33.4124 -111.9737
E980342 Qwest Broadband Services, Inc. 2 SES-RWL-20080625-00845 TEMPE AZ 364.2 33.3647 -111.9400
E040085 RCN 2 SES-LIC-20040213-00226 Phoenix AZ 346.86 33.4461 -112.0000
E050221 Scripps 2 SES-REG-20050715-00927 PHOENIX AZ 353.57 33.4545 -111.9846
E170123 Skyview Satellite Networks 2 SES-LIC-20170710-00745 Phoenix AZ 438.91 33.6851 -112.0974
E170124 Skyview Satellite Networks 2 SES-LIC-20170710-00746 Scottsdale AZ 441.96 33.6169 -111.9207
E130154 Trinity Broadcasting 2 SES-REG-20130813-00724 PHOENIX AZ 350.65 33.4647 -112.0047
E6020 WESTERN BROADBAND, LLC 1 or 2 SES-RWL-20070305-00297 SUN LAKE AZ 362.7 33.2181 -111.8769
Phoenix C Band Earth Stations

Proposal
1. Some licensees operating earth stations that need to be relocated also operate earth stations outside the 60 kilometer buffer and in suitably remote areas– In these cases, we propose to decommission the licensee’s
earth station(s) within the buffer and replace the service with a fiber feed from one of the licensee’s nearby, remote earth stations
2. Other licensees do not have this option– In these cases, we propose to build a C band antenna farm in a
remote location and connect the licensees to their antenna(s) by fiber
– The antenna farm could include mitigation techniques such as shielding to reduce the separation distance required

Case 1: Associated Press Earth Stations
The satellite feeds to eight AP earth stations in Phoenix could be replaced by fiber feeds from existing satellite reception Yuma, Lake Havasu City, and/or Prescott, Arizona
Clearing AP from Tucson is also possible
~80 miles
~150 miles
~160 miles
Yuma
Lake Havasu City
Prescott

Case 1: Cable One Earth Station
The satellite feeds to the Cable One earth station in Phoenix could be replaced by fiber feeds from existing Cable One earth stations in Winslow, Holbrook, Show Low, Morenci and/or Safford, Arizona
~130 miles
~150 miles
Winslow
Holbrook
Show Low
Morenci
Safford
~140 miles
~150 miles
~135 miles
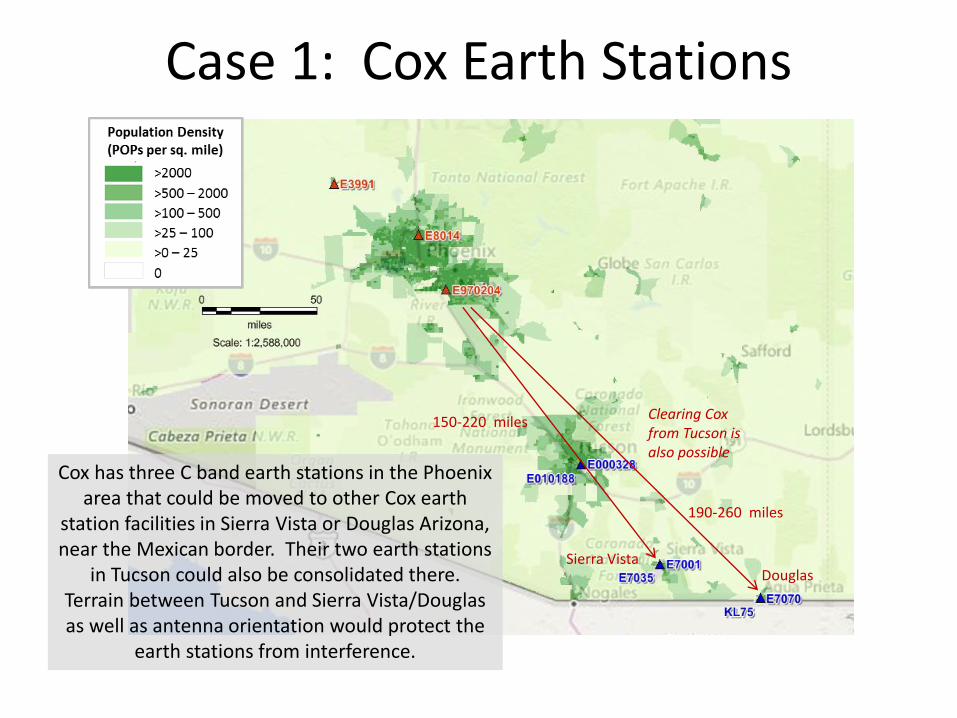
Case 1: Cox Earth Stations
150-220 miles
Sierra VistaDouglas
190-260 miles
Clearing Cox from Tucson is also possible
Cox has three C band earth stations in the Phoenix area that could be moved to other Cox earth
station facilities in Sierra Vista or Douglas Arizona, near the Mexican border. Their two earth stations
in Tucson could also be consolidated there. Terrain between Tucson and Sierra Vista/Douglas as well as antenna orientation would protect the
earth stations from interference.

Case 1: Fox Earth Stations
~160 miles
Fox Broadcasting has two C band earth stations in the Phoenix area that could be decommissioned with services provided by Fox earth station facilities in Yuma Arizona.
Yuma

Case 2: Rural Antenna Farm
Morenci
The remaining earth stations for which nearby facilities are not available would be relocated to a rural antenna farm. Although the exact location would depend on many factors, one
option shown above is Morenci AZ, where Cable One operates an earth station. The area
around the Cable One facility in Morenci is suitably isolated, has plenty of real estate for additional antennas, and has access to fiber.

Mid-Band Assessment:Cost Factors Affecting Fiber as
an Alternative to Satellite
14 June 2018
Nat Natarajan
Mike Needham
Ed Porrett
Bill Payne
Dennis Roberson
Ken Zdunek
Roberson and Associates LLC
Schaumburg, Illinois 60173

Summary of Analysis
6/14/2018 2
• Replacement options for C-Band Satellite reception, in urban / metropolitan areas of US, with optional fiber based access links are identified
• Cost factors involved in the relocation of users are identified and evaluated for a major urban / suburban area (Chicago) in the US
• Conservative assumptions were used in modeling costs. These include:
• Cost factors affecting fiber deployment
• Availability of existing fiber links
• Equipment replacement costs
• Number of pre-existing and registered C-Band receivers (i.e. those registered as receive only stations in the IBFS database on or before July 18, 2018 FCC deadline) was assumed much larger than the Mid Band NOI estimate of 4,700 licensed or registered earth stations in the 3.7-4.2 GHz band

6/14/2018 3
• Based on the modeling assumptions, a rough order of magnitude estimate for costs of relocating users in Chicago (urban/suburban areas) is developed
• Methodology can be applied to other metropolitan areas of the US
• Relocation methods do not impact the C-Band receivers operating in rural areas (MVPD operations serving smaller user communities) since they are not relocated and continue to receive satellite downlink transmissions
• Cost models could be refined with additional detailed input from stakeholders (satellite operators, cable operators and end users in specific markets)
Results

6/14/2018 4
Current Users of C-Band Downlink
Sources:
1. SIA Comments on Mid-Band NOI,
Docket No.17-183, October 2, 2017
2. Reply Comments of the SIA, Docket No.
17-183, November 15, 2017
3. Joint Comments of Intelsat License LLC
and Intel Corporation, GN Docket No.
17-183, October 2, 2017

C-Band Video Broadcast in US: By the Numbers
• Number of C-Band Satellites covering the US =24
• Total transponders = 308 (each using 36 MHz)
• Total feeds : 2012 (1781 video & 231 audio feeds)
• Video transmission at different resolutions: SD, HD & 4K
• MPEG encoding advances yield compression rates from 3:1 to 9:1 or higher
• Advanced modulation schemes deployed for spectral efficiency
• Each transponder can carry 20 SD channels or 8 HD channels or 4 UHD/4K channels (using HEVC compression superior to MPEG-4)
• Emergence of 4K and other high-bandwidth video technologies are driving demand for more C-Band capacity
• MVPD head ends (thousands) (including rural areas)
• > 1,000 broadcast affiliate stations, and over-the-top video distributors
6/14/2018 5
• Cable operators receive and deliver to 51.9 million cable video customers using the 3.7-4.2 GHz band, relying on thousands of receive-only antennas, many of which are unregistered today.
• Comcast: 100’s of C-Band receive ES, 80% of video programming using C-Band (148 transponders, 20 satellites, 86% transponders carry full-time feeds)
• Charter: Over 700 head-ends
Sources: 1. Comcast C-band Ex Parte McGrath, Dockets 17-183 18-122, May 10, 2018
2. Comcast-NBCU C-Band Ex Parte, Docket 18-122, June 8, 2018
3. Charter Mid-Band NOI Comments, Docket 17-183, October 3, 2017
4. Comments of the American Cable Association, Docket 17-183, October 2, 2017
5. https://www.lyngsat.com/america.html (information on satellite TV channels)

6/14/2018 6

6/14/2018 7
Example: Incumbent Users (Radio broadcasters)
Source: NPR ex-parte May 3, 2018 GN Docket Nos. 17-183, 18-122

An Estimate of C-Band Receivers in Use
• Broadcast TV and Radio’s infrastructure relies on satellite distribution to deliver content to and among its affiliate and owned and operated stations
• Content includes: News, talk, sports, entertainment and religious programming
• Satellite delivers programming to nearly every one of the more than 15,499 radio stations and 1,765 UHF and VHF television stations nationwide
• According to one estimate by LinkUp communications, there are over 27,000 C-band downlink locations nationally. Basis for estimate is use of C-Band downlinks in Panama City (Bay County), FL – population of 183,563 using 15 C-Band downlinks (i.e. 1 per 12,000 people). Extrapolation leads to nationwide estimate of 27000 receivers)
• Our models conservatively assumed the presence of 27,000 receivers (~575% the FCC NOI estimate of 4700 receivers)
Source: Ex-parte by LinkUp Communications Corporation, Society of Broadcast Engineers, Intelsat Corporation, SES AmericomInc., Docket Nos. 17-183, 18-122, May 24, 2018
6/14/2018 8

6/14/2018 9
Relocation of Satellite Users
•Different classes of satellite users need to be cleared and/or relocated from C-Band.
Urban Area with C-Band
Satellite Receivers
C-Band Satellite Receivers
cleared from Urban Area
FutureCurrent

Terrestrial
Fiber
Network
Replacement options for C-Band satellite receivers in urban areasOption 1 (for Cable operators)
1. Relocate the receivers (Di’s ) to new locations outside urban area or connect to existing terrestrial fiber network
2. Provide fiber connectivity between the old and new locations
3. Local distribution networks are not changed (HFC networks)
4. End users keep same CPE equipment(s)
6/14/2018 10
Urban Area
D1 ⌂ ⌂ D1
Option 2 (for enterprise/residential subscribers)
1. Replace the satellite receivers of existing, registered C-Band users by providing alternate high-speed fiber (Gbps+ ) links & fiber termination/ receiver
2. Abandon use of satellite dishes and associated receivers
3. Connectivity is provided to the nearest fiber access network in the urban area
4. Local distribution network inside the building is not changed
Building
B1 ⌂
B2 ⌂
D2 ⌂
X
X
⌂ D3
Receive video
Programs outside
urban areaLink 1
Link 2

6/14/2018 11
Relocation of Satellite Users
• Different classes of satellite users need to be cleared and/or relocated from C-Band.
Option 1: Relocation of Cable Broadcasters’ Headend Receivers
• Relocate satellite head-ends from urban area to a location in a non-urban area.• Provide fiber connectivity to/from new satellite receiver location (~ 20 miles new fiber (see note below))
• Extend the HFC network but no changes to the equipment of end users
• Number of cable head-ends (total nationwide ~ 4800)
• Expected number of cable head-ends in urban area – few hundreds or less
• Cable subscribers are not affected. No subscriber equipment changes are needed.
Note: A very conservative estimate of length of new fiber is used for connecting old and new satellite receiver locations. In urban / suburban markets, in addition to fiber network providers, there is a rich installed base of fiber backhaul / distribution networks used by wireless service providers and cable companies. These can be leveraged to lower the cost of new fiber installation.

6/14/2018 12
Relocation of Satellite Users
Option 2: Relocation of C-Band Receivers from an Urban Area with Fiber Access
• Provide alternate access link to satellite subscriber (eliminates satellite link) – optical fiber
• Provide fiber connectivity to the customer premises using FTTH (or equivalent access speed of 1 Gbps) ( high probability in urban area, > 90 % in urban Chicago)
or
• Seek new connectivity using “nearest” fiber access provider in the area
• Cost of providing fiber access will depend on:
• Specific location of existing satellite receiver
• Proximity to get connected to an existing fiber network”
• Variety of other factors (detailed next)

Factors Affecting Fiber Optic Installation Costs
6/14/2018 13
1. Proximity of customer premises to the nearest active fiber line is a major factor. Does the fiber network run through or near the customer premises?
2. Existence of conduit in the customer premises • Take advantage of an existing conduit to lower the cost of adding new capacity to the customer premises
• Use of existing conduit requires sufficient space to install fiber - substantially simpler & cheaper
• Physical placement and route of fiber cable will have a major impact on the costs of its installation (winding paths more challenging than straight cables)
3. Physical obstacles in the way to the customer premises• The nature of the physical terrain that the fiber needs to traverse to reach the customer premise – a
significant factor
• In urban / suburban areas, crossing a state highway or major road to bring the nearest fiber to the customer premises will significantly impact the overall costs
• Obstacles such as historic buildings/landmarks near the customer premises could potentially impact the costs of fiber installation, depending on the route fiber needs to take to the customer premises

4. Availability of space in the telco closets• When the fiber is brought to a customer premises, if a telecommunications room with the
necessary space for installation is already available, it can lower installation costs
5. Availability of sufficient power for fiber technology• Availability of sufficient power for fiber accessible from telecommunications room and/or an emergency
generator for backup purposes
• Save costs of introducing additional power capabilities
6. How many different paths to the customer premises can the fiber cable take?• Fiber can be brought into a customer premise through two separate entry points. A primary fiber
connection and a secondary fiber connection to mitigate potential outages if the primary fiber circuit is cut. While this is a rare occurrence, installing through two entrance points removes risk and improves reliability. This higher cost option may be needed for enterprises and/or business users, that may use C-Band receivers.
6/14/2018 14
Factors Affecting Fiber Optic Installation Costs (contd.)

Cost of connecting a customer premises to the nearest fiber transit point of a provider depends on following factors.
• Distance ( x miles ) • New construction or Existing fiber infrastructure (typical of urban / metro areas):
• Terrain that the fiber would have to traverse• Bury the fiber underground (per mile: $ 45,000-50,000 for construction labor
+ $ 9,250 material)• Overground (stringing across poles)
• Per mile: $ 9,000 for labor + $ 3,500 material plus• Pole attachment costs – “make-ready” costs + pole attachment rental costs
(recurring)• Cost of leasing fiber from transit provider (1Gbps – $ 3,000 / month)
• Additional cost if backup connectivity to transit provider is needed for reliability
Note: Cost factors are based on figures noted in the following:Comments of the American Cable Association, GN Docket 17-183, October 2, 2017.
6/14/2018 15
Cost of Establishing Fiber Connectivity

6/14/2018 16
Rank Metropolitan statistical area2017
Estimate
1 New York-Newark-Jersey City, NY-NJ-PA MSA 20,320,876
2 Los Angeles-Long Beach-Anaheim, CA MSA 13,353,907
3 Chicago-Naperville-Elgin, IL-IN-WI MSA (*) 9,533,040
4 Dallas-Fort Worth-Arlington, TX MSA 7,399,662
5 Houston-The Woodlands-Sugar Land, TX MSA 6,892,427
6 Washington-Arlington-Alexandria, DC-VA-MD-WV MSA 6,216,589
7 Miami-Fort Lauderdale-West Palm Beach, FL MSA 6,158,824
8 Philadelphia-Camden-Wilmington, PA-NJ-DE-MD MSA 6,096,120
9 Atlanta-Sandy Springs-Roswell, GA MSA 5,884,736
10 Boston-Cambridge-Newton, MA-NH MSA 4,836,531
11 Phoenix-Mesa-Scottsdale, AZ MSA 4,737,270
12 San Francisco-Oakland-Hayward, CA MSA 4,727,357
13 Riverside-San Bernardino-Ontario, CA MSA 4,580,670
14 Detroit-Warren-Dearborn, MI MSA 4,313,002
15 Seattle-Tacoma-Bellevue, WA MSA 3,867,046
Rank Metropolitan statistical area 2017 Estimate
16Minneapolis-St. Paul-Bloomington, MN-WI
MSA3,600,618
17 San Diego-Carlsbad, CA MSA 3,337,685
18 Tampa-St. Petersburg-Clearwater, FL MSA 3,091,399
19 Denver-Aurora-Lakewood, CO MSA 2,888,227
20 Baltimore-Columbia-Towson, MD MSA 2,808,175
21 St. Louis, MO-IL MSA 2,807,338
22 Charlotte-Concord-Gastonia, NC-SC MSA 2,525,305
23 Orlando-Kissimmee-Sanford, FL MSA 2,509,831
24 San Antonio-New Braunfels, TX MSA 2,473,974
25 Portland-Vancouver-Hillsboro, OR-WA MSA 2,453,168
26 Pittsburgh, PA MSA 2,333,367
27Sacramento–Roseville–Arden-Arcade, CA
MSA2,324,884
28 Las Vegas-Henderson-Paradise, NV MSA 2,204,079
29 Cincinnati, OH-KY-IN MSA 2,179,082
30 Kansas City, MO-KS MSA 2,128,912
Scope of Relocation Effort: Top 30 Metropolitan Areas(urban and suburban areas with at least 2 million population)
https://en.wikipedia.org/wiki/List_of_metropolitan_statistical_areasThis analysis is focused on Chicago and surrounding areas in Cook County (a subset of the 3rd ranked MSA in above table)

Cook County, IL
Total Population: 5,194,675
6/14/2018 17
(Cook, DuPage, Kane, Lake, McHenry, and Will)
Cook County
(Chicago and
suburbs)
Lake
Michigan

• Providers of speeds (up to 1 Gbps) are present in a large fraction of the urban Chicago area. Number of carriers providing termination at the customer premises varied from 1 to 3 in all the zip code areas that we sampled at random.
• An incumbent user with C-Band satellite receiver located in any of these zip code areas can avail of the Gbps service from one of the commercial providers serving the area.
• An incumbent user with a C-Band satellite receiver but no Gbps service available at his/her premise (using fiber and/or cable distribution) has the option to securing a fiber connectivity at a cost.
6/14/2018 18
Chicago Analysis

6/14/2018 19
Company Maps Lit/Dark Comments
Crown Castle Chicago Both
Level 3
CommunicationsChicago Both Google Maps interface, zoom in
Mirovia Networks Chicago Lit
Uniti Fiber Chicago Both
US SignalChicago Area,
RockfordBoth Flash map: click on Chicago for detailed map.
Windstream Chicago Area Both
WOW! Businesss Chicago Area Lit KMZ
Zayo Chicago Area Both
Atlantic Metro Lit
Cogent Lit On-net buildings tool
XO Both
Candidate Fiber Providers in Chicago
(Source: https://www.telecomramblings.com/metro-fiber-maps/chicago/)
6/14/2018 20
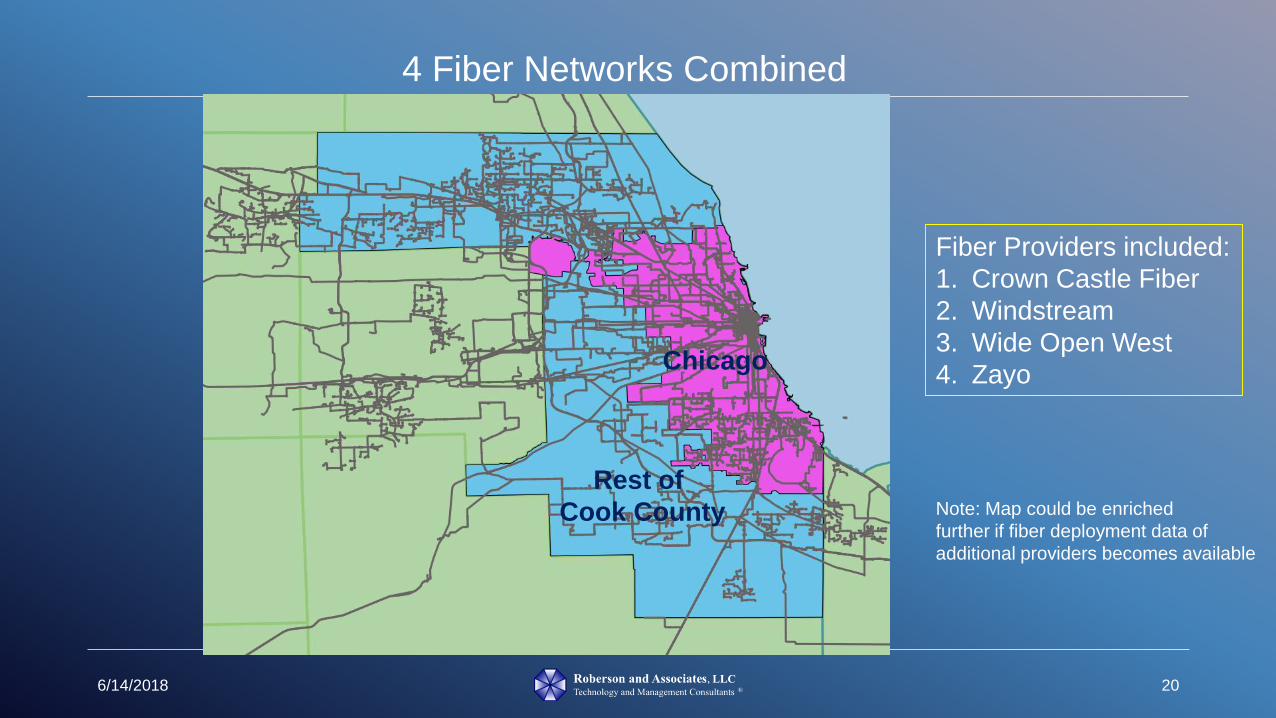
4 Fiber Networks Combined
Rest of
Cook County
Chicago
Fiber Providers included:
1. Crown Castle Fiber
2. Windstream
3. Wide Open West
4. Zayo
Note: Map could be enriched
further if fiber deployment data of
additional providers becomes available

6/14/2018 21
Distance
to
Nearest
Fiber
(meters)
Heat Map of Proximity to a Fiber Provider

6/14/2018 22
Distance
to
Nearest
Fiber
(meters)
Close up view of Proximity Heat Map

Summary of Internet Providers in Chicago https://broadbandnow.com/Illinois/Chicago
Provider Type Coverage Speed
1 AT&T Internet DSL and Fiber 99.8%+ 1,000 Mbps
2 XFINITY from Comcast Cable 96.2%+ 987 Mbps
3 RCN Cable 82.1%+ 1,000 Mbps
4 Comcast Business Cable 84.2%+ 987 Mbps
5 AT&T DSL and Fiber 100% 1,000 Mbps
6 Level 3 Communications Fiber 90.0%+ 1,000 Mbps
7 Crown Castle Fiber Fiber 83.3%+ 1,000 Mbps
8 RCN Business Cable and Fiber 49.1%+ 1,000 Mbps
9 Verizon Business Copper 44.1%+ 1,000 Mbps
10 Cogent Communications Fiber 31.7%+ 1,000 Mbps
11 Zayo Fiber 19.1%+ 400 Mbps
12 Towerstream Fixed Wireless 7.8%+ 1,000 Mbps
6/14/2018 23
1. The above information is one source of information on ISP’s serving Chicago / Cook County. However, we rely on our own analysis to
estimate availability of fiber connectivity and cost estimation.
2. On a nationwide basis, the NCTA has noted availability of Cable's DOCSIS 3.0 high-speed internet networks to more than 85% of U.S.
households. https://www.ncta.com/chart/availability-of-docsis-30-high-speed-internet-service. The cable industry is now deploying even
faster (10 Gbps service) based on DOCSIS 3.1. It is reasonable to expect about 90% of U.S. households can get at least 1 Gbps service.
ISP’s in Chicago Area: An estimate of coverage and speed

Approach to Estimating Cost for providing fiber to incumbent users of C-Band Receivers
For each urban area, perform the following steps
1. Determine number of fiber providers
2. Determine details of individual providers’ fiber infrastructure
3. Combine the various providers infrastructure maps
4. Generate fiber proximity heat maps indicating areas within specified distance ranges from available providers
5. Pick a specified number of locations (in an urban area) – random or specified
6. For each location X, determine the “distance” to a combined fiber network
7. Determine the cost of providing fiber access to location X
8. Compute the average cost of providing fiber access
6/14/2018 24

6/14/2018 25
Cost Model for Option 1(Conservative cost estimates for relocating cable head ends of cable operators)
Connectivity Costs
Link 1Average length of fiber connectivity (miles) from existing to new location of cable head ends 20
Cost of fiber connectivity ($ per foot) $ 20
Cost of connecting old & new headend locations with fiber $ 2,112,000
Link 2Average length of fiber connectivity (miles) to an existing terrestrial fiber network used for video distribution 2
Cost of connecting to existing terrestrial fiber network $ 211,200
Probability Link 1 is used (%) 50
Probability Link 2 is used (%) 50
Expected fiber costs for relocating cable head ends $ 1,161,600
Headend Equipment Replacement Costs
Probability of satellite headend being relocated 0.5
Estimated number of satellite head ends in Cook County 71
Average cost of satellite headend ($) $ 50,000
Expected replacement cost of satellite head ends ($) $ 1,775,000

Cost Model (urban Chicago) Cost Model (Cook County - Chicago and suburbs )
All costs are in U.S. Dollars All costs are in U.S. Dollars
US Population (million) 325 US Population (million) 325
Chicago population (million) 2.7 Cook County (including Chicago) population (million) 5.194
Total # C-Band Receivers (worst case estimate) 27000 Total # C-Band Receivers (worst case estimate) 27000
Percentage of population in urban Chicago 0.83
Percentage of population in Cook County (including
Chicago) 1.598
# of Satellite C-Band Receivers 224 # of Satellite C-Band Receivers 431
Average # of city blocks to fiber access 1 Average # of county blocks to fiber access 3
Length of Chicago city block = 660 x 330 feet 495 Length of a county block = 660 feet 660
Average length of fiber (feet) 495 Average length of fiber (feet) 1980
Cost per foot of fiber wire ($ per foot) (see Note 1 below) $ 110 Cost per foot of fiber wire ($ per foot) $ 20
Probability 1 Gbps available (%) 90 Probability 1 Gbps available (%) (see Note 2 below) 70
Expected Cost of wiring with fiber $ 5,445 Expected Cost of wiring with fiber $ 11,880
Expected Cost of replacing satellite w/ fiber for all
existing C-band dishes in Chicago $ 1,219,680
Expected Cost of replacing satellite w/ fiber for all
existing C-band dishes in Cook County $ 5,120,280
Note 1: Cost per foot of fiber is ~ $ 11 per foot (according to American Cable
Association filing (cited earlier). We make a conservative assumption the cost per
foot in urban Chicago is 10 times the ACA estimate.
Note 2: We make conservative assumption of 70% availability of 1 Gbps
service in Cook County (compared to estimate of > 85% nationwide availability
of cable DOCSIS 3.0 + offering 1 Gbps or greater service )
6/14/2018 26
Cost Model for Option 2 (Conservative cost estimates for replacing C-Band receivers)

Cost Model SummaryChicago and surroundings (Cook County)
Option 1: Relocating cable head ends of cable operators (from Cook County)
• Expected fiber costs for relocating cable head ends = $ 1,161,600
• Expected replacement cost of satellite head ends ($) = $ 1,775,000
• Total estimated cost to cable operators = $ 2,936,600
Option 2: Replacing C-Band receivers of individuals / enterprise customers
• Expected Cost of replacing satellite w/ fiber for all existing dishes in Chicago = $ 1,219,680
• Expected Cost of replacing satellite w/ fiber for all existing dishes in Cook County = $ 5,120,280
6/14/2018 27

Conclusions
• As a result of our analysis, replacement of satellite by fiber should be feasible based on the availability of fiber and equipment replacement costs
• Results show the economic viability of clearing C-Band spectrum from urban / suburban areas in Chicago and surroundings market
• Economic analysis for other urban or metropolitan areas will need a case-by-case review; It is reasonable to expect the viability of clearing C-Band spectrum will hold in other major markets as well.
• Rural markets are not significantly affected by the relocation methods. They may continue use of C-Band spectrum with minimal or no impact to the existing C-Band customers / users.
• Improvement of satellite resource utilization through optimized assignment of satellite transponder capacity as a function of time, space and frequency has potential to clear greater amount of spectrum for 5G terrestrial use.
6/14/2018 28

6/14/2018 29
© Copyright 2018 Roberson and Associates, LLC
All Rights Reserved
Thank You

BACKUP
4/5/2018 30

Provider 1: Crown Castle Fiber Network
6/14/2018 31

Provider 1: Crown Castle Fiber Network (contd.)
6/14/2018 32
Chicago
Rest of
Cook County

Provider 2: Windstream Fiber Network
6/14/2018 33

6/14/2018 34
Provider 2: Windstream Fiber Network (additional detail)
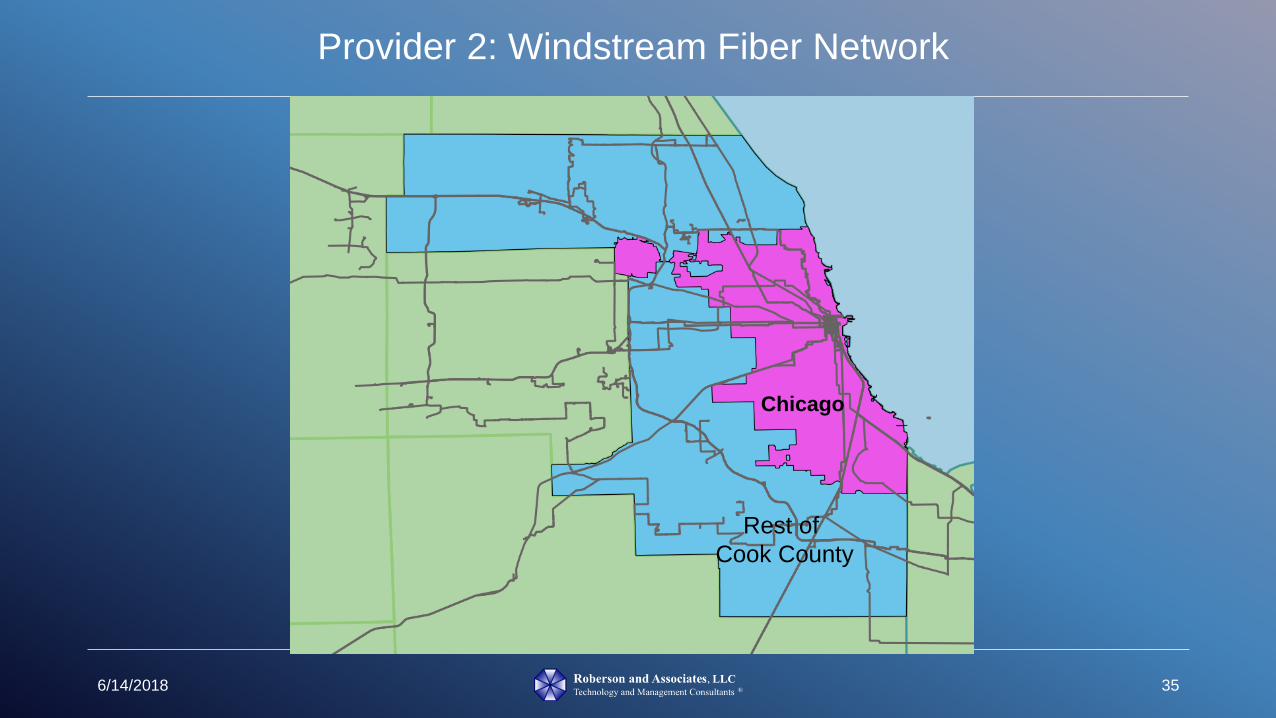
6/14/2018 35
Provider 2: Windstream Fiber Network
Chicago
Rest of
Cook County

Provider 3: Wide Open West (WOW) Fiber Network
6/14/2018 36
Rest of
Cook County
Chicago

Provider 4: Zayo Fiber Network
6/14/2018 37
Rest of
Cook County
Chicago

Chicagoland lines and nodes
6/14/2018 38

6/14/2018 39
Distance
to
Nearest
Fiber
(meters)
Distance
to
Nearest
Fiber
(meters)
Chicago (Urban Core) Proximity Heat Map

6/14/2018 40
Distance
to Nearest
Fiber
(meters)
Distance
to Nearest
Fiber
(meters)
Enlarged views of Proximity Heat Map (Core of Urban Chicago)