via electronic filing - iso new england for the 2013-2014 capability year, docket no. er10-1182-000...
TRANSCRIPT

November 7, 2017
VIA ELECTRONIC FILING
The Honorable Kimberly D. Bose, Secretary Federal Energy Regulatory Commission 888 First Street, NE Washington, DC 20426
Re: ISO New England Inc., Docket No. ER18-___-000, Filing of Installed Capacity Requirement, Hydro Quebec Interconnection Capability Credits and Related Values for the Twelfth FCA (Associated with the 2021-2022 Capacity Commitment Period)
Dear Secretary Bose:
Pursuant to Section 205 of the Federal Power Act (“FPA”),1 ISO New England Inc. (the “ISO”) hereby electronically submits to the Federal Energy Regulatory Commission (“FERC” or “Commission”) this transmittal letter and related materials which identify the following values for the 2021-2022 Capacity Commitment Period,2 which is associated with the twelfth Forward Capacity Auction (“FCA 12”): (i) Installed Capacity Requirement;3 (ii) Local Sourcing Requirement for the Southeast New England (“SENE”) Capacity Zone;4 (iii) Maximum Capacity Limit for the Northern New England (“NNE”) Capacity Zone;5 (iv) Hydro Quebec Interconnection Capability Credits (“HQICCs”); and (v) Marginal Reliability Impact (“MRI”) Demand Curves.6
1 16 U.S.C. § 824d (2014). 2 The 2021-2022 Capacity Commitment Period starts on June 1, 2021 and ends on May 31, 2022.
3 Capitalized terms used but not otherwise defined in this filing have the meanings ascribed thereto in the ISO’s Transmission, Markets and Services Tariff (the “Tariff”).
4 The SENE Capacity Zone includes the Southeastern Massachusetts (“SEMA”), Northeastern Massachusetts (“NEMA”)/Boston and Rhode Island Load Zones.
5 The NNE Capacity Zone includes the Maine, New Hampshire and Vermont Load Zones.
6 As explained in this filing letter, the MRI Demand Curves include the System-Wide Capacity Demand Curve, the Import-Constrained Capacity Zone Demand Curve for the SENE Capacity Zone, and the Export-Constrained Capacity Zone Demand Curve for the NNE Capacity Zone.


The Honorable Kimberly D. Bose, Secretary November 7, 2017 Page 4
The derivation of the ICR-Related Values is discussed in Sections III-VI of this filing letter, and in the attached testimony of Carissa Sedlacek, Director of Resource Adequacy at the ISO (the “Sedlacek Testimony”).
The photovoltaic (“PV”) forecast has been reflected in the calculations of the ICR-Related Values as a reduction to the load forecast starting with the tenth FCA (“FCA 10”). This was done to comply with FERC’s directive in the order accepting the Installed Capacity Requirement and related values for the ninth FCA (“FCA 9”). For FCA 12, the ISO has developed an improved methodology that better reflects the contributions of behind-the-meter (“BTM”) PV to load reduction. The methodology is described, at a high level, in Section III.B.1 of this filing letter and in more detail in the Sedlacek Testimony. Other than that modification, the ICR-Related Values were calculated using the same Commission-approved methodology that was used to calculate the values submitted and accepted for preceding FCAs.9 The proposed 9 ISO New England Inc. and New England Power Pool Participants Committee, Filing of Installed Capacity Requirement, Hydro Quebec Interconnection Capability Credits and Related Values for the 2020-2021 Capacity Commitment Period (“2020-2021 ICR Filing”) (filed Nov. 8, 2016). The 2020-2021 ICR Filing was accepted by Letter Order issued on December 6, 2016 (the “2020-2021 ICR Letter Order”); ISO New England Inc., Filing of Installed Capacity Requirement, Hydro Quebec Interconnection Capability Credits and Related Values for the 2019-2020 Capacity Commitment Period, Docket No. ER16-307-000, at 2 (“2019-2020 ICR Filing”) (filed Nov. 10, 2015). The 2019-2020 ICR Filing was accepted in ISO New England Inc., 154 FERC ¶ 61,008 (2016) (“2019-2020 ICR Order”); ISO New England Inc., Filing of Installed Capacity Requirement, Hydro Quebec Interconnection Capability Credits and Related Values for the 2018-2019 Capacity Commitment Period, Docket No. ER15-325-000, at 4-6 (“2018-2019 ICR Filing”) (filed Nov. 4, 2014). The 2018-2019 ICR Filing was accepted in ISO New England Inc., 150 FERC ¶ 61,003 (2015) (“2018-2019 ICR Order”); ISO New England Inc. and New England Power Pool Participants Committee, Filing of Installed Capacity Requirement, Hydro Quebec Interconnection Capability Credits and Related Values for the 2017-2018 Capability Year, Docket No. ER14-328-000, at 5-6 (“2017-2018 ICR Filing”) (filed Nov. 5, 2013). The 2017-2018 ICR Filing was accepted by Letter Order issued December 30, 2013 (the “2017-2018 ICR Letter Order”). ISO New England Inc. and New England Power Pool Participants Committee, Filing of Installed Capacity Requirement, Hydro Quebec Interconnection Capability Credits and Related Values for the 2016-2017 Capability Year, Docket No. ER13-334-000, at p. 5 (“2016-2017 ICR Filing”) (filed Nov. 6, 2012). The 2016-2017 ICR Filing was accepted by Letter Order issued December 31, 2012 (the “2016-2017 ICR Letter Order”). See also ISO New England Inc. and New England Power Pool, Filing of Installed Capacity Requirement, Hydro Quebec Interconnection Capability Credits and Related Values for the 2015-2016 Capability Year, Docket No. ER12-756-000, at p. 5 (“2015-2016 ICR Filing”) (filed Jan. 3, 2012); ISO New England Inc., Letter Order accepting filing of Installed Capacity Requirement, Hydro Quebec Interconnection Capability Credits and Related Values for the 2015-2016 Capability Year, Docket No. ER12-756-000 (Feb. 23, 2012) (“2015-2016 ICR Letter Order”); ISO New England Inc. and New England Power Pool, Filing of Installed Capacity Requirement, Hydro Quebec Interconnection Capability Credits and Related Values for the 2014-2015 Capability Year, Docket No. ER11-3048-000, at 5-6 (“2014-2015 ICR Filing”) (filed March 8, 2011); ISO New England Inc. and New England Power Pool, 135 FERC ¶ 61,135 at P 53 (2011) (“2014-2015 ICR Order”); ISO New England Inc., Letter Order accepting filing of Installed Capacity Requirement, Hydro Quebec Interconnection Capability Credits and Related Values for the 2013-2014 Capability Year, Docket No. ER10-1182-000 (June 25, 2010) (“2013-2014 ICR Letter Order”); ISO New England Inc., Letter Order accepting filing of Installed Capacity Requirement, Hydro Quebec Interconnection Capability Credits and Related Values for the 2012-2013 Capability Year, Docket No. ER09-1415-000 (Aug. 14, 2009) (“2012-2013 ICR Letter Order”); ISO New England Inc., Order Accepting, With Conditions,

The Honorable Kimberly D. Bose, Secretary November 7, 2017 Page 5
values are therefore the result of a well-developed process that improves, pursuant to the Commission’s direction, on the processes utilized and approved by the Commission for the development of the Installed Capacity Requirement and related values in the past. Accordingly, the Commission should accept the proposed values as just and reasonable without change to become effective on January 6, 2018.
I. DESCRIPTION OF FILING PARTY AND COMMUNICATIONS
The ISO is the private, non-profit entity that serves as the regional transmission organization (“RTO”) for New England. The ISO plans and operates the New England bulk power system and administers New England’s organized wholesale electricity market pursuant to the Tariff and the Transmission Operating Agreement with the New England Participating Transmission Owners. In its capacity as an RTO, the ISO has the responsibility to protect the short-term reliability of the New England Control Area and to operate the system according to reliability standards established by the Northeast Power Coordinating Council, Inc. (“NPCC”) and the North American Electric Reliability Corporation (“NERC”).
All correspondence and communications in this proceeding should be addressed to the undersigned for the ISO as follows:
Margoth R. Caley, Esq. Senior Regulatory Counsel ISO New England Inc. One Sullivan Road Holyoke, MA 01040-2841 Tel: (413) 535-4045 Fax: (413) 535-4379 E-mail: [email protected]
II. STANDARD OF REVIEW
The ISO submits the proposed ICR-Related Values for FCA 12, which is associated with the 2021-2022 Capacity Commitment Period, pursuant to Section 205 of the Federal Power Act, which “gives a utility the right to file rates and terms for services rendered with its assets.”10
Proposed Installed Capacity Requirement, Hydro Quebec Interconnection Capability Credits, and Related Values, 125 FERC ¶ 61,154 at PP 1, 26, 41 (2008) (accepting ISO-proposed Installed Capacity Requirements for the 2011-2012 Capability Year) (“2011-2012 ICR Order”); ISO New England Inc. and New England Power Pool, 121 FERC ¶ 61,250 at P 1 (2007); order on reh’g, 123 FERC ¶ 61,129 (2008) (“2010-2011 ICR Order”). 10 Atlantic City Elec. Co. v. FERC, 295 F.3d 1, 9 (D.C. Cir. 2002).
The Honorable Kimberly D. Bose, Secretary November 7, 2017 Page 6
Under Section 205, the Commission “plays ‘an essentially passive and reactive’ role”11 whereby it “can reject [a filing] only if it finds that the changes proposed by the public utility are not ‘just and reasonable.’”12 The Commission limits this inquiry “into whether the rates proposed by a utility are reasonable – and [this inquiry does not] extend to determining whether a proposed rate schedule is more or less reasonable than alternative rate designs.”13 The ICR-Related Values submitted herein “need not be the only reasonable methodology, or even the most accurate.”14 As a result, even if an intervenor or the Commission develops an alternative proposal, the Commission must accept this Section 205 filing if it is just and reasonable.15
III. INSTALLED CAPACITY REQUIREMENT
A. Description of the Installed Capacity Requirement
The Installed Capacity Requirement is a measure of the installed resources that are projected to be necessary to meet reliability standards in light of total forecasted load requirements for the New England Control Area and to maintain sufficient reserve capacity to meet reliability standards. More specifically, the Installed Capacity Requirement is the amount of resources needed to meet the reliability requirements defined for the New England Control Area of disconnecting non-interruptible customers (a loss of load expectation or “LOLE”) no more than once every ten years (a LOLE of 0.1 days per year). The methodology for calculating the Installed Capacity Requirement is set forth in Section III.12 of the Tariff.
The ISO is proposing an Installed Capacity Requirement of 34,683 MW for FCA 12, which is associated with the 2021-2022 Capacity Commitment Period. This value reflects tie benefits (emergency energy assistance) assumed obtainable from New Brunswick (Maritimes), New York and Quebec in the aggregate amount of 2,020 MW. However, the 34,683 MW Installed Capacity Requirement value does not reflect a reduction in capacity requirements relating to HQICCs. The HQICC value of 958 MW per month is applied to reduce the portion of the Installed Capacity Requirement that is allocated to the Interconnection Rights Holders
11 Id. at 10 (quoting City of Winnfield v. FERC, 744 F.2d 871, 876 (D.C. Cir. 1984)). 12 Id. at 9. 13 Cities of Bethany, et al. v. FERC, 727 F.2d 1131, 1136 (D.C. Cir. 1984), cert. denied, 469 U.S. 917 (1984). 14 OXY USA, Inc. v. FERC, 64 F.3d 679, 692 (D.C. Cir. 1995) (citing Cities of Bethany, 727 F.2d at 1136). 15 Cf. Southern California Edison Co., et al., 73 FERC ¶ 61,219 at 61,608 n.73 (1995) (“Having found the plan to be just and reasonable, there is no need to consider in any detail the alternative plans proposed by the Joint Protesters.” (citing Cities of Bethany, 727 F.2d at 1136)).

The Honorable Kimberly D. Bose, Secretary November 7, 2017 Page 7
(“IRH”). Thus, the net Installed Capacity Requirement, after deducting the HQICC value, is 33,725 MW.16
B. Development of the Installed Capacity Requirement
With the exception of the change in the methodology used to reflect the BTM PV forecast in the load forecast (described in Section III.B.1 of this filing letter), the calculation methodology used to develop the ICR-Related Values for FCA 12 is the same as that used to calculate the values for previous FCAs. As in previous years, the values submitted in the instant filing are based on assumptions relating to expected system conditions for the associated Capacity Commitment Period. These assumptions include the load forecast, resource capacity ratings, resource availability, and relief assumed obtainable by implementation of operator actions during a capacity deficiency, which includes the amount of possible emergency assistance (tie benefits) obtainable from New England’s interconnections with neighboring Control Areas and load reduction from implementation of 5% voltage reductions.17 The Tariff provisions that establish the assumptions used to calculate the ICR-Related Values are the same as those used to calculate the values for the eleventh FCA (“FCA 11”) and previous FCAs.18 The modeling assumptions have been updated to reflect changed system conditions since the development of the Installed Capacity Requirement and related values for FCA 11. These updated assumptions are described below.
1. Load Forecast
The forecasted peak loads of the entire New England Control Area for the 2021-2022 Capacity Commitment Period are one major input into the calculation of the ICR-Related Values. For the purpose of calculating the Installed Capacity Requirement for FCA 12, which is associated with the 2021-2022 Capacity Commitment Period, the ISO used the load forecast published in the 2017 – 2026 Forecast Report of Capacity, Energy, Loads, and Transmission dated May 1, 2017 (“2017 CELT Report”).19 The ISO developed the 2017 CELT Report’s load forecast by using the same methodology that the ISO has used in previous years to determine load forecasts and develop the peak load assumptions reflected in the Commission-approved
16 The net Installed Capacity Requirement is used in the development of the MRI Demand Curves, which will be used to procure capacity in FCA 12.
17 Sedlacek Testimony at 9-10.
18 See note 9, supra. 19 Sedlacek Testimony at 10-11.
The Honorable Kimberly D. Bose, Secretary November 7, 2017 Page 8
Installed Capacity Requirement.20 This methodology reflects economic and demographic assumptions as reviewed by the New England Power Pool (“NEPOOL”) Load Forecast Committee.21
The projected New England Control Area summer 50/50 peak load22 for the 2021-2022 Capacity Commitment Period is 29,436 MW. In determining the Installed Capacity Requirement, the load forecast is represented by a weekly probability distribution of daily peak loads. This probability distribution is meant to quantify the New England weekly system peak load’s relationship to weather. The 50/50 peak load is used solely for reference purposes. In the Installed Capacity Requirement calculations, the methodology determines the amount of capacity resources needed to meet every expected peak load of the weekly distribution given the probability of occurrence associated with that load level.23
New for FCA 12: Hourly Profile Methodology Used to Reflect the BTM PV Forecast
In 2014, the rapid growth and installation of PV resources led the ISO, working with the Distributed Generation Forecast Working Group (“DGFWG”), to develop a forecast that captures the effects of recently installed BTM PV resources and BTM PV resources expected to be installed within the forecast horizon in order to forecast the potential future peak loads as accurately as possible. The ISO completed the region’s first PV forecast in April of 2014 and incorporated it in long-term, ten-year transmission planning. However, in 2014, the ISO did not reflect the PV forecast in the calculations of the Installed Capacity Requirement and related values for the ninth FCA (“FCA 9”). For that reason, NEPOOL did not support the Installed Capacity Requirement and related values for FCA 9.24
In its order on the Installed Capacity Requirement and related values for FCA 9, while the Commission accepted the values, it directed the ISO to fully explore the incorporation of distributed generation into the Installed Capacity Requirement calculations in the stakeholder
20 See, e.g., 2020-2021 ICR Letter Order; 2019-2020 ICR Order; 2018-2019 ICR Order; 2017-2018 ICR Letter Order; 2016-2017 ICR Letter Order; 2015-2016 ICR Order; 2014-2015 ICR Order at PP 53, 69; 2013-2014 ICR Letter Order; 2012-2013 ICR Letter Order; 2011-2012 ICR Order at PP 5-6; 2010-2011 ICR Order at PP 5-6. 21 The methodology is reviewed periodically and updated when deemed necessary in consultation with the NEPOOL Load Forecasting Committee. 22 The New England Control Area is a summer-peaking system, meaning that the highest load occurs during the summer. The 50/50 peak refers to the peak load having a 50% chance of being exceeded, and is expected to occur at a weighted New England-wide temperature of 90.4 ºF. The value shown is the 2017 CELT Reference – With Reduction for BTM PV peak load forecast. 23 See Sedlacek Testimony at 10-12. 24 Id. at 13.

The Honorable Kimberly D. Bose, Secretary November 7, 2017 Page 9
process. The Commission stated that it expected the ISO to do this on a schedule that would allow these factors to be reflected, if determined appropriate, in the Installed Capacity Requirement calculations for FCA 10.25 Accordingly, to comply with FERC’s directive, starting with FCA 10, the ISO has reflected the forecasted amount of BTM PV in the ICR calculations as a reduction to the load forecast.26
For FCA 10 and FCA 11, the ISO used a “Reliability Hours” methodology to account for forecasted BTM PV in the ICR. Specifically, this methodology estimated BTM PV contributions to reduce load in the summer peak hours (i.e. the hours ending 14:00 – 18:00 in May through September). Contributions in all other hours and months were assumed to be zero. Some Market Participants pointed out that this methodology could underestimate BTM PV contributions, because it did not consider contributions outside the Reliability Hours. For that reason, the Reliability Hours methodology was considered a temporary approach until a methodology that more accurately reflects the real contribution of BTM PV to load reduction could be developed.27
For FCA 12, the ISO was able to develop an “hourly profile” methodology to account for BTM PV in all hours of the day in the ICR. To develop the hourly profile methodology, the ISO used the latest data from the National Renewable Energy Laboratory’s National Solar Radiation Database. This is comprehensive weather data that includes the main weather drivers of PV and corresponds to both the geographic area and period of interest. With these data and state-of-the-art PV modeling tools, the ISO conducted simulations of PV systems’ performance for many thousands of individual systems located throughout the region, with sizes ranging from “rooftop” (<10 kW) to “utility scale” (MW-scale). The results of the simulations were then benchmarked to available measured data for a summer period. Because simulated data was consistently higher than measured data, the ISO applied a downward adjustment to all simulation results to make them consistent with measured data. The ISO further validated simulation results by comparing final simulated regional PV profiles to two sources of measured data on a variety of historical summer peak load days from 2012-2014. This validation showed that final simulated PV profiles closely match measured data during summer peak conditions.28
The hourly profile methodology is better than the Reliability Hours methodology because it reflects BTM PV’s contributions in reducing load in all hours of the day and the historical
25 ISO New England Inc., 150 FERC ¶ 61,003 (2015) at P 20.
26 Sedlacek Testimony at 13.
27 Id. at 13-14.
28 Id. at 15-16.

The Honorable Kimberly D. Bose, Secretary November 7, 2017 Page 10
weather year used for the Installed Capacity Requirement, as opposed to reflecting BTM PV contributions only during the Reliability Hours. The use of the hourly profile methodology to reflect BTM PV results in an additional reduction in the ICR of 335 MW.29
2. Resource Capacity Ratings
The Installed Capacity Requirement for FCA 12, which is associated with the 2021-2022 Capacity Commitment Period, is based on the latest available resource ratings30 at the time of the Installed Capacity Requirement calculation of Existing Capacity Resources that have qualified for FCA 12. These resources are described in the qualification informational filing for FCA 12 that is being submitted concurrently to the Commission on November 7, 2017.31
Resource additions and attritions are not assumed in the calculation of the Installed Capacity Requirement for FCA 12, pursuant to the Tariff, because there is no certainty which new resource additions or existing resource attritions, if any, will clear the FCA. The use of the proxy unit for potential required resource additions when the system is short of capacity, and the additional load carrying capability (“ALCC”) adjustments to remove surplus capacity from the system, discussed in the Sedlacek Testimony, are designed to address these resource addition and attrition uncertainties.32
3. Resource Availability
The proposed Installed Capacity Requirement value for FCA 12, which is associated with the 2021-2022 Capacity Commitment Period, reflects generating resource availability assumptions based on historical scheduled maintenance and forced outages of these capacity resources.33 For 29 Sedlacek Testimony at 18.
30 The resource capacity ratings for FCA 12, which is associated with the 2021-2022 Capacity Commitment Period, were calculated in accordance with Section III.12.7.2 of the Tariff using the methods and procedures that were employed for calculating resource capacity ratings reflected in the Commission-approved Installed Capacity Requirements for the first eleven primary FCAs. See 2020-2021 ICR Letter Order; 2019-2020 ICR Order at 15; 2018-2019 ICR Order at 7; 2017-2018 ICR Filing at 11-12 and 2017-2018 ICR Letter Order; 2016-2017 ICR Filing at 11-12; 2015-2016 ICR Filing at 11-12 and 2015-2016 ICR Order; 2014-2015 ICR Filing at 12-13 and 2014-2015 ICR Order at P 53; 2013-2014 ICR Filing at 10-11 and the 2013-2014 ICR Letter Order; 2012-2013 ICR Filing at 11-13 and the 2012-2013 ICR Letter Order; 2011-2012 ICR Filing at 11-12 and the 2011-2012 ICR Order at PP 1, 7; 2010-2011 ICR Filing at 11-12 and the 2010-2011 ICR Order at PP 1, 7. 31 ISO New England Inc., Informational Filing for Qualification in the Forward Capacity Market, filed on November 7, 2017 at Attachment C. 32 Sedlacek Testimony at 18-21. 33 The assumed resource availability ratings for FCA 12, which is associated with the 2021-2022 Capacity Commitment Period, are discussed in the Sedlacek Testimony at 21-23. The ratings were calculated in accordance with Section III.12.7.3 of the Tariff using the methods and procedures that were employed for calculating resource

The Honorable Kimberly D. Bose, Secretary November 7, 2017 Page 11
generating resources, individual unit scheduled maintenance assumptions are based on each unit’s most recent five-year historical average of scheduled maintenance. The individual generating resource’s forced outage assumptions are based on the resource’s five-year historical NERC Generator Availability Database System (“GADS”) equivalent forced outage rate data submitted to the ISO. If the resource has been in commercial operation less than five years, the NERC class average maintenance and forced outage data for the same class of units is used to substitute for the missing annual data.
The Qualified Capacity of an Intermittent Power Resource is the resource’s median output during the Reliability Hours averaged over a period of five years. Based on the Intermittent Power Resources rating methodology, these resources are assumed to be 100% available because their availability impacts on reliability are already incorporated into the resource ratings.
In the Installed Capacity Requirement calculations availability assumptions for passive Demand Resources are modeled as 100% available. Active Demand Resources’ availability in the Real-Time Demand Response category are based on actual responses during all historical ISO New England Operating Procedure No. 4 (Action During a Capacity Deficiency) events and ISO performance audits that occurred in summer and winter 2012 through 2016.
4. Tie Benefits
New England’s Commission-approved method for establishing the Installed Capacity Requirement requires that assumptions be made regarding the tie benefits value to be used as an input in the calculation.34 The tie benefits reflect the amount of emergency assistance from neighboring Control Areas that New England could rely on, without jeopardizing reliability in New England or the neighboring Control Areas, in the event of a capacity shortage in New England. Assuming tie benefits as a resource to meet the 0.1days/year LOLE criterion reduces the Installed Capacity Requirement and lowers the amount of capacity to be procured in the FCA.
The Installed Capacity Requirement for FCA 12 proposed by the ISO reflects tie benefits calculated from the New Brunswick, New York and Quebec Control Areas.35 The ISO utilizes a capacity ratings reflected in the Commission-approved Installed Capacity Requirements for the first eleven primary FCAs. See note 9, supra. 34 See Section III.12.9 of the Tariff. The methodology for calculating tie benefits to be used in the Installed Capacity Requirement for FCA 12 is the same methodology used to calculate the tie benefits used in the Installed Capacity Requirement for Capacity Commitment Periods associated with prior FCAs. 35 See 2014-2015 ICR Filing, Testimony at 25-35, for an explanation of the methodology employed by the ISO in determining tie benefits for the 2014-2015 Capacity Commitment Period, which was also employed by the ISO in determining tie benefits for the 2015-2016 Capacity Commitment Period, the 2016-2017 Capacity Commitment

The Honorable Kimberly D. Bose, Secretary November 7, 2017 Page 12
probabilistic multi-area reliability model to calculate total tie benefits from these three Control Areas. The neighboring Control Areas are modeled using “at criteria” modeling assumptions. Tie benefits from each individual Control Area are determined based on the results of individual probabilistic calculations performed for each of the three neighboring Control Areas.
The tie benefits methodology is comprised of two broad steps. In step one, the ISO
develops necessary system load, transmission interface transfer capabilities and capacity assumptions. In step two, the ISO conducts simulations using the probabilistic General Electric Multi-Area Reliability Simulation (“GE MARS”) modeling program in order to determine tie benefits.
The Installed Capacity Requirement calculations for FCA 12 assume total tie benefits of
2,020 MW based on the results of the tie benefits study for the 2021-2022 Capacity Commitment Period. A breakdown of this total value by Control Area is as follows: 958 MW from Quebec over the Phase II interconnection, 143 MW from Quebec over the Highgate interconnection, 506 MW from New Brunswick (Maritimes) over the New Brunswick ties and 413 MW from New York over the AC ties.36 The tie benefits methodology is described in detail in Section III.12.9 of the Tariff. These procedures were also addressed in detail in the transmittal letter for the 2014-2015 ICR Filing.37
Under Section III.12.9.2.4(a), one factor in the calculation of tie benefits is the transfer capability of the interconnections for which tie benefits are calculated. In the first half of 2017, the transfer limits of these external interconnections were reviewed based on the latest available information regarding forecasted topology and load forecast information, and it was determined that no changes to the established external interface limits were warranted. The ISO established transfer capability values for the following interconnections: 700 MW for the New Brunswick interconnections; 1,400 MW for the Hydro-Quebec Phase I/II HVDC Transmission Facilities; and 200 MW for the Highgate interconnection. The ISO also determined that there was no available transfer capability over the Cross Sound Cable for tie benefits. Finally, the ISO calculated a transfer capability for the New York-New England AC interconnections as a group, because the transfer capability of these interconnections is interdependent on the transfer capability of the other interconnections in the group. For the New York-New England AC interconnections, the transfer capability was determined to be 1,400 MW. The other factor is the transfer capability of the internal transmission interfaces. In calculating tie benefits for the
Period, the 2017-2018 Capacity Commitment Period, 2018-2019 Capacity Commitment Period, the 2019-2020 Capacity Commitment Period, the 2020-2021 Capacity Commitment Period, and the 2021-2022 Capacity Commitment Period. 36 Sedlacek Testimony at 27-28. 37 2014-2015 ICR Filing at 13-19.

The Honorable Kimberly D. Bose, Secretary November 7, 2017 Page 13
Installed Capacity Requirement for FCA 12, for internal transmission interfaces, the ISO used the transfer capability values from its most recent transfer capability analyses.38
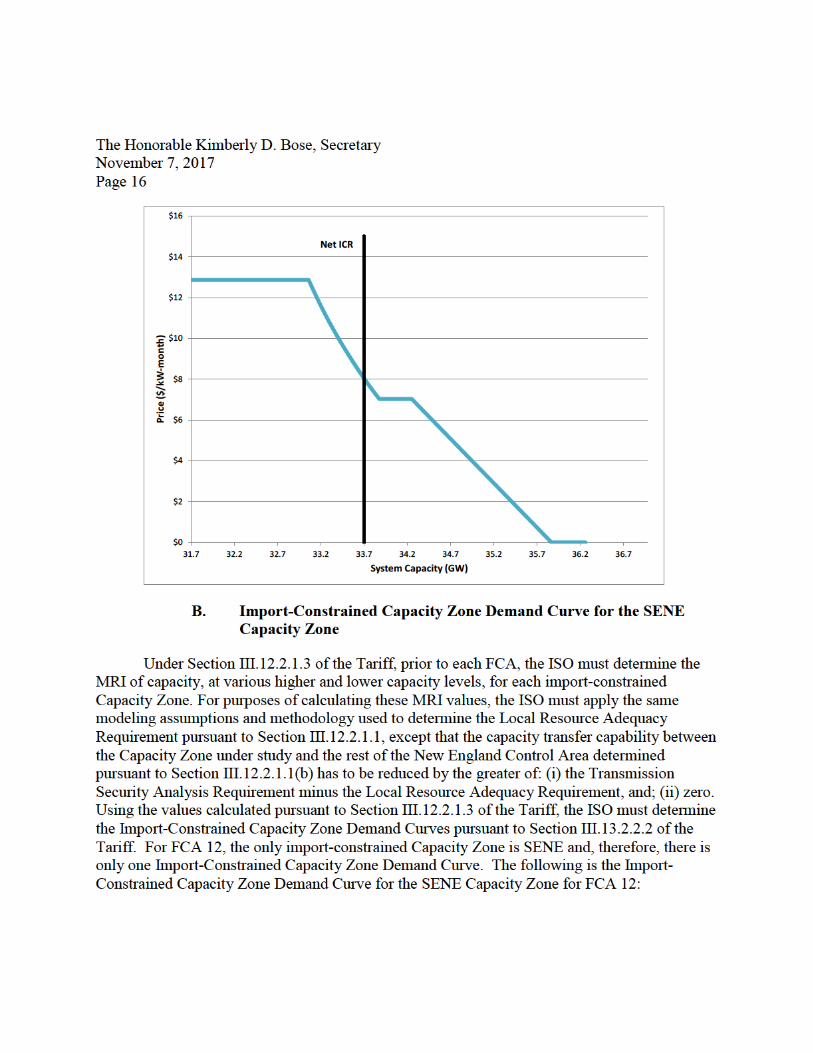
IV. LOCAL SOURCING REQUIREMENT AND MAXIMUM CAPACITY LIMIT
In the Forward Capacity Market (“FCM”), the ISO must also calculate Local Sourcing
Requirements and Maximum Capacity Limits. A Local Sourcing Requirement is the minimum amount of capacity that must be electrically located within an import-constrained Capacity Zone to meet the Installed Capacity Requirement.39 A Maximum Capacity Limit is the maximum amount of capacity that can be located in an export-constrained Capacity Zone to meet the Installed Capacity Requirement.40 The general purpose of Local Sourcing Requirements and Maximum Capacity Limits is to identify capacity resource needs such that, when considered in combination with the transfer capability of the transmission system, they are electrically distributed within the New England Control Area contributing toward purchasing the right amount of resources in the FCA to meet NPCC’s and the ISO’s bulk power system reliability planning criteria.
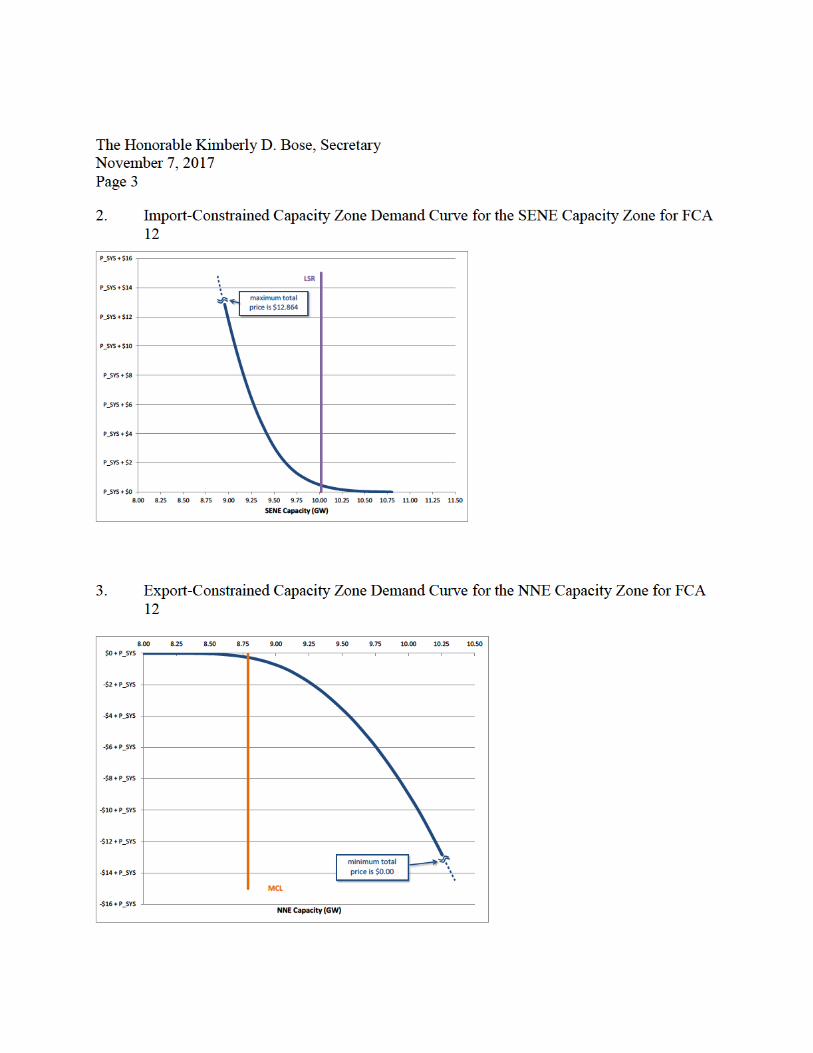
For FCA 12, which is associated with the 2021-2022 Capacity Commitment Period, the ISO calculated the Local Sourcing Requirement for the SENE Capacity Zone using the methodology that is reflected in Section III.12.2 of the Tariff. The Local Sourcing Requirement for the SENE Capacity Zone is 10,018 MW.
The calculation methodology for determining Local Sourcing Requirements utilizes both Local Resource Adequacy criteria as well as criteria used in the Transmission Security Analysis that the ISO uses to maintain system reliability when reviewing de-list bids for a FCA. Because the system ultimately must meet both resource adequacy and transmission security requirements, the Local Sourcing Requirement provisions state that both resource adequacy and transmission security-based requirements must be developed for each import-constrained zone. Specifically, the Local Sourcing Requirement is calculated for an import-constrained Capacity Zone as the amount of capacity needed to satisfy the higher of (i) the Local Resource Adequacy Requirement or (ii) the Transmission Security Analysis Requirement.41
The Local Resource Adequacy Requirement is addressed in Section III.12.2.1.1 of the Tariff. It is a local zonal capacity requirement calculated using a probabilistic modeling technique that ensures the zone has sufficient resources to meet the one-day-in-ten years 38 Sedlacek Testimony at 31-32. 39 See Section III.12.2 of the Tariff. 40 Id. 41 See Section III.12.2.1 of the Tariff.

The Honorable Kimberly D. Bose, Secretary November 7, 2017 Page 14
reliability standard. The Local Resource Adequacy Requirement analysis assumes the same set of resources used in the calculation of the Installed Capacity Requirement.
The calculation of the Transmission Security Analysis Requirement is addressed in Section III.12.2.1.2 of the Tariff, and the conditions used for completing the Transmission Security Analysis within the FCM are documented in Section 6 of ISO Planning Procedure No. 10, Planning Procedure to Support the Forward Capacity Market (“PP-10”).42 The Transmission Security Analysis uses static transmission interface transfer limits, developed based on a series of discrete transmission load flow study scenarios, to evaluate the transmission import-constrained area’s reliability. Using the analysis, the ISO identifies a resource requirement sufficient to allow the system to operate through stressed conditions.43 The Transmission Security Analysis utilizes the same set of data underlying the load forecast, resource capacity ratings and resource availability that are used in probabilistically determining the Installed Capacity Requirement, Maximum Capacity Limit and Local Resource Adequacy Requirement. However, due to the deterministic and transmission security oriented nature of the Transmission Security Analysis, some of the assumptions utilized in performing the Transmission Security Analysis differ from the assumptions used in calculating the Installed Capacity Requirement, Maximum Capacity Limit and other aspects of the Local Resource Adequacy Requirement. These differences relate to the manner in which load forecast data, forced outage rates for certain resource types, and ISO New England Operating Procedure No. 4 action events are utilized in the Transmission Security Analysis. These differences are described in more detail in the Sedlacek Testimony.44
The Local Resource Adequacy Requirement value and Transmission Security Analysis Requirement value for the SENE Capacity Zone calculated for FCA 12 are, respectively, 9,705 MW and 10,018 MW. Applying the “higher of” standard contained in Section III.12.2.1 of the Tariff, the resulting Local Sourcing Requirement value for the SENE Capacity Zone is 10,018 MW.
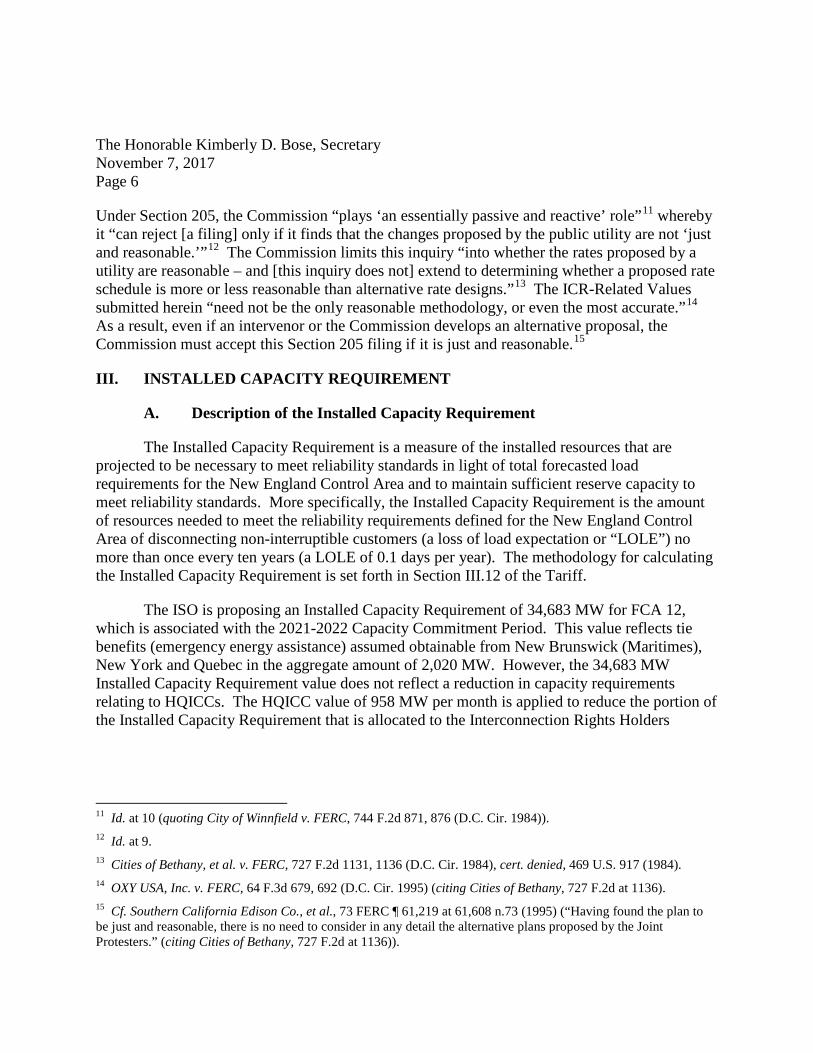
For FCA 12, the ISO also calculated the Maximum Capacity Limit for the NNE Capacity Zone. The Maximum Capacity Limit was calculated using the methodology that is reflected in Section III.12.2.2 of the Tariff. The Maximum Capacity Limit for the NNE Capacity Zone is 8,790 MW.
42 Copy available at https://www.iso-ne.com/static-assets/documents/rules_proceds/isone_plan/pp10/pp10.pdf. 43 See Section III.12.2.1.2(a) of the Tariff. The Transmission Security Analysis is similar, though not identical, to analysis that the ISO utilizes during the reliability review of de-list bids. See ISO New England Inc., 123 FERC ¶ 61,290 at PP 26-31 (2008). 44 Sedlacek Testimony at 37-38.

The Honorable Kimberly D. Bose, Secretary November 7, 2017 Page 15
V. HQICCs
HQICCs are capacity credits that are allocated to the IRH, which are entities that pay for and, consequently, hold certain rights over the Hydro Quebec Phase I/II HVDC Transmission Facilities (“HQ Interconnection”).45 Pursuant to Sections III.12.9.5 and III.12.9.7 of the Tariff, the tie benefit value for the HQ Interconnection was established using the results of a probabilistic calculation of tie benefits with Quebec. The ISO calculates HQICCs, which are allocated to the IRH in proportion to their individual rights over the HQ Interconnection, and must file the HQICC values established for each Capacity Commitment Period’s FCA. The HQICC value for FCA 12 is 958 MW per month.
VI. MRI DEMAND CURVES
Starting with FCA 11, using the MRI Demand Curve methodology, the ISO must develop system-wide and zonal demand curves to be used in the FCA to procure needed capacity. Accordingly, as described below, the ISO has developed system-wide and zonal MRI demand curves to be used in FCA 12.
A. System-Wide Capacity Demand Curve
Under Section III.12.1.1 of the Tariff, prior to each FCA, the ISO must determine the system-wide MRI of capacity at various higher and lower capacity levels for the New England Control Area. For purposes of calculating these MRI values, the ISO must apply the same modeling assumptions and methodology used in determining the Installed Capacity Requirement. Using the values calculated pursuant to Section III.12.1.1.1, the ISO must determine the System-Wide Capacity Demand Curve pursuant to Section III.13.2.2.1 of the Tariff. Note that, for this year, the ISO used the transition provisions in Section III.13.2.2.1 to determine the System-Wide Demand Curve. The transition curve is a hybrid of the previous linear demand curve design and the new MRI-based design. The following is the System-Wide Capacity Demand Curve for FCA 12:46
45 See Section I.2.2 of the Tariff (stating in the definition of “Hydro-Quebec Interconnection Capability Credit” that “[a]n appropriate share of the HQICC shall be assigned to an IRH if the Phase I/II HVDC-TF support costs are paid by that IRH and such costs are not included in the calculation of the Regional Network Service rate.”). See also Section III.12.9.7 of the Tariff (“[t]he tie benefits from the Quebec Control Area over the HQ Phase I/II HVDC-TF calculated in accordance with Section III.12.9.1 shall be allocated to the Interconnection Rights Holders or their designees in proportion to their respective percentage shares of the HQ Phase I and the HQ Phase II facilities, in accordance with Section I of the Transmission, Markets and Services Tariff.”).
46 Additional details regarding the calculation of the System-Wide Capacity Demand Curve are included in the Sedlacek Testimony at 42-45.


The Honorable Kimberly D. Bose, Secretary November 7, 2017 Page 19
In addition, in 2007 the New England States Committee on Electricity (“NESCOE”) was formed.49 Among other responsibilities, NESCOE is responsible for providing feedback on the proposed ICR-Related Values at the relevant NEPOOL PSPC, Reliability Committee and Participants Committee meetings, and was in attendance for the meetings at which the ICR-Related Values for FCA 12 were discussed.50
On September 19, 2017, the Reliability Committee voted to recommend, by a show of
hands (with nine oppositions and seven abstentions) that the Participants Committee support the HQICCs. Also on September 19, 2017, the Reliability Committee voted to recommend, by a show of hands (with nine oppositions and seven abstentions), that the Participants Committee support the Installed Capacity Requirement, Local Sourcing Requirement for the SENE Capacity Zone, Maximum Capacity Limit for the NNE Capacity Zone, and MRI Demand Curves. On October 13, 2017, the Participants Committee supported the HQICCs. Pursuant to Section 11.4 of the Participants Agreement, the Participants Committee also took an advisory vote on the proposed Installed Capacity Requirement, Local Sourcing Requirement for the SENE Capacity Zone, Maximum Capacity Limit for the NNE Capacity Zone, and MRI Demand Curves. The Participants Committee supported the proposed values with 60.63% in favor.51 VIII. REQUESTED EFFECTIVE DATE
The ISO requests that the Commission accept the proposed ICR-Related Values for FCA 12 to be effective on January 6, 2018 (which is 60 days from the filing date), so that the proposed values can be used as part of FCA 12, which will be conducted in February 2018.
IX. ADDITIONAL SUPPORTING INFORMATION
This filing identifies ICR-Related Values for FCA 12 and is made pursuant to Section 205 of the FPA. Section 35.13 of the Commission’s regulations generally requires public utilities to file certain cost and other information related to an examination of cost-of-service rates.52 However, the proposed ICR-Related Values are not traditional “rates.” Furthermore, the 49 ISO New England Inc., Docket No. ER07-1324-000, Formation of the New England States Committee on Electricity (filed August 31, 2007) (proposing to add a new rate schedule to the Tariff for the purpose of recovering funding for NESCOE’s operation) (the “NESCOE Funding Filing”); ISO New England Inc., 121 FERC ¶ 61,105 (2007) (order accepting the ISO’s proposed rate schedule for funding of NESCOE’s operations). 50 See the NESCOE Funding Filing at 14. 51 The correctly tabulated 60.63% vote at the Participants Committee meeting was originally declared to have failed based on an earlier report that it required 66.67% vote to pass rather than a 60% vote. That error was identified at the November Participants Committee meeting and is being corrected in the records of the Committee. The ISO understands that NEPOOL will be filing comments describing the stakeholder process in greater detail.
52 18 C.F.R. § 35.13.

The Honorable Kimberly D. Bose, Secretary November 7, 2017 Page 20
ISO is not a traditional investor-owned utility. Therefore, to the extent necessary, the ISO requests waiver of Section 35.13 of the Commission’s regulations. Notwithstanding its request for waiver, the ISO submits the following additional information in compliance with the identified filing regulations of the Commission applicable to Section 205 filings.
35.13(b)(1) - Materials included herewith are as follows:
♦ This transmittal letter; ♦ Attachment 1: Testimony of Carissa Sedlacek; ♦ Attachment 2: List of governors and utility regulatory agencies in
Connecticut, Maine, Massachusetts, New Hampshire, Rhode Island and Vermont to which a copy of this filing has been
emailed.
35.13(b)(2) – The ISO respectfully requests that the Commission accept this filing to become effective on January 6, 2018.
35.13(b)(3) – Pursuant to Section 17.11(e) of the Participants Agreement, Governance Participants are being served electronically rather than by paper copy. The names and addresses of the Governance Participants are posted on the ISO’s website at http://www.iso-ne.com/committees/nepool_part/index.html. An electronic copy of this transmittal letter and the accompanying materials has also been sent to the governors and electric utility regulatory agencies for the six New England states which comprise the New England Control Area, and to the New England Conference of Public Utility Commissioners, Inc. The names and addresses of these governors and regulatory agencies are shown in Attachment 2. In accordance with Commission rules and practice, there is no need for the entities identified on Attachment 2 to be included on the Commission’s official service list in the captioned proceedings unless such entities become intervenors in this proceeding.
35.13(b)(4) - A description of the materials submitted pursuant to this filing is contained in this transmittal letter.
35.13(b)(5) - The reasons for this filing are discussed in Sections III-VI of this transmittal letter.
35.13(b)(6) - As explained above, the ISO has sought the advisory input from Governance Participants pursuant to Section 11.4 of the Participants Agreement.
35.13(b)(7) - The ISO has no knowledge of any relevant expenses or costs of service that have been alleged or judged in any administrative or judicial proceeding to be illegal, duplicative, or unnecessary costs that are demonstrably the product of discriminatory
The Honorable Kimberly D. Bose, Secretary November 7, 2017 Page 21
employment practices.
35.13(c)(2) - The ISO does not provide services under other rate schedules that are similar to the sale for resale and transmission services it provides under the Tariff.
35.13(c)(3) - No specifically assignable facilities have been or will be installed or modified in order to supply service with respect to the proposed Installed Capacity Requirement and related values.
X. CONCLUSION
The ISO requests that the Commission accept the proposed ICR-Related Values reflected in this submission for filing without change to become effective January 6, 2018.
Respectfully submitted,
ISO NEW ENGLAND INC.
By: /s/ Margoth R. Caley Margoth R. Caley, Esq. Senior Regulatory Counsel ISO New England Inc. One Sullivan Road Holyoke, MA 01040-2841 Tel: (413) 535-4045 Fax: (413) 535-4379 E-mail: [email protected]
Attachments cc : Entities listed in Attachment 2

UNITED STATES OF AMERICA 1 BEFORE THE 2
FEDERAL ENERGY REGULATORY COMMISSION 345
ISO New England Inc. ) Docket No. ER18-___-000 678
PREPARED TESTIMONY OF 9 MS. CARISSA SEDLACEK 10
ON BEHALF OF ISO NEW ENGLAND INC. 11 12
I. INTRODUCTION 13
Q: PLEASE STATE YOUR NAME, TITLE AND BUSINESS ADDRESS. 14
A: My name is Carissa Sedlacek. I am the Director of Resource Adequacy in the System 15
Planning Department at ISO New England Inc. (the “ISO”). My business address is One 16
Sullivan Road, Holyoke, Massachusetts 01040-2841. 17
18
Q: PLEASE DESCRIBE YOUR WORK EXPERIENCE AND EDUCATIONAL 19
BACKGROUND. 20
A: In 2015, I was promoted to Director of Resource Adequacy in the System Planning 21
Department at the ISO. In this position, I have overall responsibility for developing the 22
parameters needed for the operation of the Forward Capacity Market (“FCM”), including 23
the development of the Installed Capacity Requirement and related values for all 24
auctions; the resource qualification processes for new and existing resources; the conduct 25
of the critical path schedule monitoring process for new resources; and the performance 26
of reliability reviews for resources seeking to opt out of the market. In addition, I have 27
the responsibility for conducting resource adequacy/reliability assessments to meet North 28
American Electric Reliability Corporation (“NERC”) and Northeast Power Coordinating 29

2
Council (“NPCC”) reporting requirements, long-term load forecast development, fuel 1
diversity analyses, and resource mix evaluations to ensure regional bulk power system 2
reliability into the future. 3
4
Before becoming Director of Resource Adequacy, I was Manager, Resource Integration 5
& Analysis in the System Planning Department at the ISO. In that role I was responsible 6
for implementing the FCM qualification process for Generating Capacity Resources, 7
Demand Resources, and Import Capacity Resources; for analyzing capacity de-list bids; 8
and for developing market resource alternatives as a substitute to building new 9
transmission facilities. Prior to that, between 1999 and 2006, I led various generation 10
planning and availability studies to ensure system reliability as well as transmission 11
planning assessments related to transmission facility construction, system protection, and 12
line ratings. I have published in the IEEE Power Engineering Review for analysis of 13
Generator Availabilities under a Market Environment. I have been with the ISO since 14
1999, working in the System Planning Department. 15
16
Prior to joining the ISO, I worked at the New York Power Authority’s Niagara Power 17
Project for eleven years providing engineering support to ensure the reliable operation of 18
the 2,500 MW hydroelectric facility and its associated transmission system. 19
20
I have a B.S. in Electrical Engineering from Syracuse University and an M.B.A. from 21
State University of New York at Buffalo. 22
23

3
Q: WHAT IS THE PURPOSE OF THIS TESTIMONY? 1
A: This testimony discusses the derivation of the Installed Capacity Requirement, the Local 2
Sourcing Requirement for the Southeast New England (“SENE”) Capacity Zone, the 3
Maximum Capacity Limit for the Northern New England (“NNE”) Capacity Zone,1 the 4
Hydro-Quebec Interconnection Capability Credits (“HQICCs”), and the Marginal 5
Reliability Impact (“MRI”) Demand Curves for the 2021-2022 Capacity Commitment 6
Period, which is the Capacity Commitment Period associated with the twelfth Forward 7
Capacity Auction to be conducted beginning on February 5, 2018 (“FCA 12”). The 8
2021-2022 Capacity Commitment Period starts on June 1, 2021 and ends on May 31, 9
2022. The Installed Capacity Requirement, Local Sourcing Requirement for the SENE 10
Capacity Zone, Maximum Capacity Limit for the NNE Capacity Zone, HQICCs and MRI 11
Demand Curves for FCA 12 are collectively referred to herein as the “ICR-Related 12
Values.” 13
14
1 As explained in the ISO’s Informational Filing for FCA 12, which is being submitted to the Federal Energy Regulatory Commission (“Commission”) concurrently with this filing, in accordance with Section III.12.4. of the ISO New England Transmission, Markets and Services Tariff (“Tariff”), the ISO determined that it will model three Capacity Zones in FCA 12: the SENE Capacity Zone, the NNE Capacity Zone, and the Rest-of-Pool Capacity Zone. The SENE Capacity Zone includes the Southeastern Massachusetts (“SEMA”), Rhode Island and Northeastern Massachusetts (“NEMA”)/Boston Load Zones. The SENE Capacity Zone will be modeled as an import-constrained Capacity Zone. The NNE Capacity Zone includes the Maine, New Hampshire, and Vermont Load Zones. NNE will be modeled as an export-constrained Capacity Zone. The Rest-of-Pool Capacity Zone includes the Connecticut and Western/Central Massachusetts Load Zones.

4
Q. ARE THERE ANY CHANGES TO THE PROCESS AND METHODOLOGY FOR 1
DEVELOPING THE INSTALLED CAPACITY REQUIREMENT AND 2
RELATED VALUES? 3
A. This year, there is a change in the methodology for modeling the load reduction values 4
associated with the behind-the-meter (BTM) photovoltaic (PV) forecast2 used in the 5
calculations of the ICR-Related Values.3 6
7
The other processes and methodology for developing the ICR-Related Values are the 8
same as those used in the calculation of the Installed Capacity Requirement and related 9
values for the eleventh FCA (“FCA 11”), which is associated with the 2020-2021 10
Capacity Commitment Period. 11
12
II. INSTALLED CAPACITY REQUIREMENT 13
14
A. DESCRIPTION OF THE INSTALLED CAPACITY REQUIREMENT 15
16
Q: WHAT IS THE “INSTALLED CAPACITY REQUIREMENT?” 17
A: The Installed Capacity Requirement is the minimum level of capacity required to meet 18
the reliability requirements defined for the New England Control Area. These 19
requirements are documented in Section III.12 of the Tariff, which states, in relevant part, 20
that “[t]he ISO shall determine the Installed Capacity Requirement such that the 21
2 As described below, in 2014, the ISO developed and implemented the use of an annual PV forecast for the region.

5
probability of disconnecting non-interruptible customers due to resource deficiency, on 1
average, will be no more than once in ten years. Compliance with this resource adequacy 2
planning criterion shall be evaluated probabilistically, such that the Loss of Load 3
Expectation (“LOLE”) of disconnecting non-interruptible customers due to resource 4
deficiencies shall be no more than 0.1 day each year. The forecast Installed Capacity 5
Requirement shall meet this resource adequacy planning criterion for each Capacity 6
Commitment Period.” Section III.12 of the Tariff also details the calculation 7
methodology and the guidelines for the development of assumptions used in the 8
calculation of the Installed Capacity Requirement. 9
10
The development of the Installed Capacity Requirement is consistent with the NPCC 11
Full Member Resource Adequacy Criterion (Resource Adequacy Requirement R4), under 12
which the ISO must probabilistically evaluate resource adequacy to demonstrate that the 13
loss of load expectation (“LOLE”) of disconnecting firm load due to resource 14
deficiencies is, on average, no more than 0.1 days per year, while making allowances for 15
demand uncertainty, scheduled outages and deratings, forced outages and deratings, 16
assistance over interconnections with neighboring Planning Coordinator Areas, 17
transmission transfer capabilities, and capacity and/or load relief from available operating 18
procedures. 19
20
Q: PLEASE EXPLAIN THE GENERAL PROCESS FOR ESTABLISHING THE 21
ICR-RELATED VALUES. 22
A: The ISO established the ICR-Related Values in accordance with the calculation 23

6
methodology prescribed in Section III.12 of the Tariff. The ICR-Related Values were 1
discussed with stakeholders. The stakeholder process consisted of discussions with the 2
New England Power Pool (“NEPOOL”) Load Forecast Committee, Power Supply 3
Planning Committee (“PSPC”) and Reliability Committee. These committees’ review 4
and comment on the ISO’s development of load and resource assumptions and the ISO’s 5
calculation of the ICR-Related Values was followed by advisory votes from the 6
NEPOOL Reliability Committee and Participants Committee. State regulators also had 7
the opportunity to review and comment on the ICR-Related Values as part of their 8
participation on the PSPC, Reliability Committee and Participants Committee. The 9
NEPOOL Participants Committee supported the HQICCs (which are described in Section 10
V of this testimony). However, the Participants Committee did not support the other 11
ICR-Related Values. The ISO is filing with the Commission the ICR-Related Values to 12
be used in FCA 12, which is associated with the 2021-2022 Capacity Commitment 13
Period. 14
15
Q: PLEASE EXPLAIN IN MORE DETAIL THE PSPC’S INVOLVEMENT IN THE 16
DETERMINATION AND REVIEW OF THE ICR-RELATED VALUES. 17
A: The PSPC is a non-voting technical subcommittee that reports to the Reliability 18
Committee. The PSPC is chaired by the ISO and its members are representatives of the 19
NEPOOL Participants. The ISO engages the PSPC to assist with the review of key inputs 20
used in the development of resource adequacy-based requirements such as Installed 21
Capacity Requirements, Local Sourcing Requirements, Maximum Capacity Limits and 22
MRI Demand Curves, including appropriate assumptions relating to load, resources, and 23

7
tie benefits for modeling the expected system conditions. Representatives of the six New 1
England States’ public utilities regulatory commissions are also invited to attend and 2
participate in the PSPC meetings and several were present for the meetings at which the 3
ICR-Related Values for FCA 12, which is associated with the 2021-2022 Capacity 4
Commitment Period, were discussed and considered. 5
6
Q: PLEASE IDENTIFY THE INSTALLED CAPACITY REQUIREMENT VALUE 7
CALCULATED BY THE ISO FOR FCA 12, WHICH IS ASSOCIATED WITH 8
THE 2021-2022 CAPACITY COMMITMENT PERIOD. 9
A: The Installed Capacity Requirement value for FCA 12, which is associated with the 10
2021-2022 Capacity Commitment Period, is 34,683 MW. 11
12
Q: IS THIS THE AMOUNT OF INSTALLED CAPACITY REQUIREMENT THAT 13
WAS USED FOR THE DEVELOPMENT OF THE SYSTEM-WIDE CAPACITY 14
DEMAND CURVE AND THE IMPORT-CONSTRAINED CAPACITY ZONE 15
DEMAND CURVE FOR THE SENE CAPACITY ZONE? 16
A: No. The System-Wide Capacity Demand Curve and the Import-Constrained Capacity 17
Zone Demand Curve for the SENE Capacity Zone were developed based on the net 18
Installed Capacity Requirement of 33,725 MW, which is the 34,683 MW of Installed 19
Capacity Requirement minus 958 MW of HQICCs (which are allocated to the 20
Interconnection Rights Holders in accordance with Section III.12.9.2 of the Tariff). The 21
System-Wide Capacity Demand Curve and the Import Constrained Capacity Zone 22
Demand Curve for the SENE Capacity Zone are contained in Section VI of this 23

8
testimony. The Installed Capacity Requirement is not used in the development of the 1
Export-Constrained Capacity Zone Demand Curve for the NNE Capacity Zone (which is 2
also shown in Section VI of this testimony). 3
4
B. DEVELOPMENT OF THE INSTALLED CAPACITY REQUIREMENT 5
6
Q: PLEASE EXPLAIN THE CALCULATION METHODOLOGY FOR 7
ESTABLISHING THE INSTALLED CAPACITY REQUIREMENT. 8
A: The Installed Capacity Requirement was established using the General Electric Multi-9
Area Reliability Simulation (“GE MARS”) model. GE MARS uses a sequential Monte 10
Carlo simulation to compute the resource adequacy of a power system. This Monte Carlo 11
process repeatedly simulates the year (multiple replications) to evaluate the impacts of a 12
wide range of possible combinations of resource capacity and load levels taking into 13
account random resource outages and load forecast uncertainty. For the Installed 14
Capacity Requirement, the system is considered to be a one bus model, in that the New 15
England transmission system is assumed to have no internal transmission constraints in 16
this simulation. For each hour, the program computes the isolated area capacity available 17
to meet demand based on the expected maintenance and forced outages of the resources 18
and the expected demand. Based on the available capacity, the program determines the 19
probability of loss of load for the system for each hour of the year. After simulating all 20
hours of the year, the program sums the probability of loss of load for each hour to arrive 21
at an annual probability of loss of load value. This value is tested for convergence, which 22

9
is set to be 5% of the standard deviation of the average of the hourly loss of load values. 1
If the simulation has not converged, it proceeds to another replication of the study year. 2
Once the program has computed an annual reliability index, if the system is less reliable 3
than the resource-adequacy criterion (i.e., the LOLE is greater than 0.1 days per year), 4
additional resources are needed to meet the criterion. Under the condition where New 5
England is forecasted to be less reliable than the resource adequacy criterion, proxy 6
resources are used within the model to meet this additional need. The methodology calls 7
for adding proxy units until the New England LOLE is less than 0.1 days per year. For 8
the ICR-Related Values for FCA 12, which is associated with the 2021-2022 Capacity 9
Commitment Period, the ISO did not need to use proxy units because there is adequate 10
qualified capacity to meet the 0.1 days/year LOLE criterion. 11
If the system is more reliable than the resource-adequacy criterion (i.e., the system LOLE 12
is less than or equal to 0.1 days per year), additional resources are not required, and the 13
Installed Capacity Requirement is determined by increasing loads (additional load 14
carrying capability or “ALCC”) so that New England’s LOLE is exactly at 0.1 days per 15
year. This is how the single value that is called the Installed Capacity Requirement is 16
established. The modeled New England system must meet the 0.1 days per year 17
reliability criterion. 18
19
Q: WHAT ARE THE MAIN ASSUMPTIONS UPON WHICH THE ICR-RELATED 20
VALUES FOR FCA 12 ARE BASED? 21
A: One of the first steps in the process of calculating the ICR-Related Values is for the ISO 22
to determine the assumptions relating to expected system conditions for the Capacity 23

10
Commitment Period. These assumptions are explained in detail below and include the 1
load forecast, resource capacity ratings, resource availability, and the amount of load 2
and/or capacity relief obtainable from certain actions specified in ISO New England 3
Operating Procedure No. 4, Action During a Capacity Deficiency (“Operating Procedure 4
No. 4”), which system operators invoke in real-time to balance demand with system 5
supply in the event of expected capacity shortage conditions. Relief available from 6
Operating Procedure No. 4 actions includes the amount of possible emergency assistance 7
(tie benefits) obtainable from New England’s interconnections with neighboring Control 8
Areas and load reduction from implementation of 5% voltage reductions. 9
10
1. LOAD FORECAST 11
12
Q: PLEASE EXPLAIN HOW THE ISO DERIVES THE LOAD FORECAST 13
ASSUMPTION USED IN DEVELOPING THE INSTALLED CAPACITY 14
REQUIREMENT AND RELATED VALUES. 15
A: For probabilistic-based calculations of ICR-Related Values, the ISO develops a 16
forecasted distribution of typical daily peak loads for each week of the year based on 40 17
years of historical weather data and an econometrically estimated monthly model of 18
typical daily peak loads. Each weekly distribution of typical daily peak loads includes 19
the full range of daily peaks that could occur over the full range of weather experienced 20
in that week and their associated probabilities. The 50/50 and the 90/10 peak loads are 21
points on this distribution and used as reference points. The probabilistic-based 22
calculations take into account all possible forecast load levels for the year. From these 23

11
weekly peak load forecast distributions, a set of seasonal load forecast uncertainty 1
multipliers can be developed and applied to a specific historical hourly load profile to 2
provide seasonal load information about the probability of loads being higher, and lower, 3
than the peak load found in the historical profile. These multipliers can be developed for 4
New England in its entirety or for each subarea using the historic 2002 load profile. 5
For deterministic analyses such as the Transmission Security Analysis, the ISO uses the 6
reference 90/10 load forecast, as published in the 2017 – 2026 Forecast Report of 7
Capacity, Energy, Loads, and Transmission (“2017 CELT Report”), which is net of 8
BTM PV resources. 9
10
Q: PLEASE DESCRIBE THE FORECASTED LOAD WITHIN CAPACITY ZONES 11
FOR FCA 12, WHICH IS ASSOCIATED WITH THE 2021-2022 CAPACITY 12
COMMITMENT PERIOD. 13
A: The forecasted load for the SENE Capacity Zone was developed using the combined load 14
forecast for the state of Rhode Island and a load share ratio of the SEMA and 15
NEMA/Boston load to the forecasted load for the entire Commonwealth of 16
Massachusetts. The load share ratio is based on detailed bus load data from the network 17
model for SEMA and NEMA/Boston, respectively, as compared to all of Massachusetts. 18
19
The forecasted load for the NNE Capacity Zone was developed using the combined load 20
forecasts for the states of Maine, New Hampshire, and Vermont. 21
22
12
Q: WHAT IS CURRENTLY PROJECTED TO BE THE NEW ENGLAND AND 1
CAPACITY ZONE 50/50 AND 90/10 PEAK LOAD FORECAST FOR THE 2021-2
2022 CAPACITY COMMITMENT PERIOD? 3
A: The following table shows the 50/50 and 90/10 peak load forecast for the 2021-2022 4
Capacity Commitment Period based on the 2017 load forecast as documented in the 5
2017 CELT Report. These values are reported as the “Reference – with Reduction for 6
BTM PV” load forecast. 7
8
Table 1 – 50/50 and 90/10 Peak Load Forecast (MW) 9
10
11
12
Q: PLEASE DESCRIBE THE DEVELOPMENT OF THE PV FORECAST AT A 13
HIGH LEVEL. 14
A: In 2014, the rapid growth of BTM PV resources led the ISO to develop a forecast that 15
captures the effects of recently installed BTM PV resources and BTM PV resources 16
expected to be installed within the forecast horizon in order to forecast the potential 17
future peak loads as accurately as possible. Hence, each year since 2014, the ISO, in 18
conjunction with the Distributed Generation Forecast Working Group (“DGFWG”) 19
(which includes state agencies responsible for administering the New England states’ 20
policies, incentive programs and tax credits that support BTM PV growth in New 21
50/50 90/10New England 29,436 31,964
SENE 12,327 13,413 NNE 5,711 6,118

13
England), develops forecasts of future nameplate ratings of BTM PV installations 1
anticipated over the 10-year planning horizon. These forecasts are created for each state 2
based on policy drivers, recent BTM PV growth trends, and discount adjustments 3
designed to represent a degree of uncertainty in future BTM PV commercialization. 4
5
Q: WHY IS THE PV FORECAST ACCOUNTED FOR IN THE CALCULATIONS 6
OF THE ICR-RELATED VALUES? 7
Growth of BTM PV reduces the amount of load that needs to be served during daylight 8
hours, which include summer peak load hours. As mentioned above, in 2014, the ISO 9
developed its first ever long-term PV forecast. However, that year, the ISO did not did 10
not reflect the PV forecast in the calculations of the Installed Capacity Requirement and 11
related values for the ninth FCA (“FCA 9”). For that reason, NEPOOL did not support 12
the Installed Capacity Requirement and related values for FCA 9. While FERC accepted 13
the ISO’s proposed Installed Capacity Requirement and related values, it directed the ISO 14
to fully explore the incorporation of distributed generation into the Installed Capacity 15
Requirement calculations for the tenth FCA (“FCA 10”).4 Accordingly, the BTM PV 16
forecast has been reflected in the calculations of the Installed Capacity Requirement and 17
related values starting with FCA 10. 18
19
Q: HOW DID THE ISO REFLECT THE CONTRIBUTIONS TO LOAD 20
REDUCTION OF BTM PV IN FCA 10 AND FCA 11? 21
4 ISO New England Inc., 150 FERC ¶ 61,003 at P 20.

14
A: In FCA 10 and FCA 11, the ISO used a “Reliability Hours” methodology to reflect BTM 1
PV as a reduction to load in the load forecast assumption used in the calculations of the 2
Installed Capacity Requirement and related values.5 The Reliability Hours methodology 3
estimated BTM PV contributions to reduce load in the summer peak hours (i.e. the hours 4
ending 14:00 – 18:00 in the months of May through September). The contributions in all 5
other hours/months were assumed to be zero. In order to determine the magnitude of 6
load reduction impact of the BTM PV facilities to model during the Reliability Hours, the 7
ISO used coincident hourly load and PV production data for the years 2012-2015 to 8
estimate the amount of daily peak load reductions that can be expected during elevated 9
summer load days. For this methodology, the estimated daily peak reduction value was 10
kept constant for all Reliability Hours during the summer months, but was adjusted to 11
reflect the incremental growth in the BTM PV forecast. 12
13
Q: DID THE ISO USE THE RELIABILITY HOURS METHODOLOGY TO 14
ACCOUNT FOR BTM PV AS A REDUCTION IN THE LOAD FORECAST FOR 15
FCA 12? 16
A: No. The Reliability Hours methodology was a temporary approach until a methodology 17
that more accurately reflects the real contribution of BTM PV to load reduction could be 18
developed. 19
20
5 The Reliability Hours methodology for modeling BTM PV was also used for in the calculations of the ICR and related values for all annual reconfiguration auctions conducted in 2015 and 2016.

15
Q: WHAT METHODOLOGY DID THE ISO USE TO REFLECT THE 1
CONTRIBUTIONS OF BTM PV TO REDUCE THE LOAD FORECAST FOR 2
FCA 12? 3
A: For FCA 12, the ISO developed an “hourly profile” methodology to determine the 4
amount of load reduction provided by BTM PV in all hours of the day and all months of 5
the year. The BTM PV hourly profile models the forecast of PV output as the full hourly 6
load reduction value of BTM PV in all 8760 hours of the year. This reflects the actual 7
impact of BTM PV installations in reducing system load. 8
9
Q: PLEASE EXPLAIN, AT A HIGH LEVEL, HOW THE ISO DEVELOPED THE 10
HOURLY PROFILE METHODOLOGY TO ACCOUNT FOR THE BTM PV 11
FORECAST IN THE CALCULATIONS OF THE ICR-RELATED VALUES. 12
A: Using the latest data from the National Renewable Energy Laboratory’s National Solar 13
Radiation Database and state-of-the-art PV modeling tools, the ISO conducted 14
simulations of PV systems’ performance for many thousands of individual systems 15
located throughout New England with sizes ranging from “rooftop” (<10 kW) to “utility 16
scale” (MW-scale). These simulations were designed to reflect a realistic fleet of BTM 17
PV systems – for example, they were tailored to reflect the distribution of system sizes 18
existing in each New England state at the end of 2016. The ISO benchmarked the 19
simulation results to available measured data for a summer period, and applied a 20
downward adjustment to all simulation profiles to make them consistent with the 21
measured data. As final validation, the ISO compared the finalized regional PV profiles 22
to two sources of measured data on a variety of historical summer peak load days from 23

16
2012 to 2014. The validation showed that final PV profiles closely match measured data 1
during summer peak load conditions.6 2
Notably, to develop the hourly profile methodology, the ISO used detailed weather 3
information for 2002, which is the historical year load profile that the ISO uses for the 4
calculations of the Installed Capacity Requirement and related values, and NPCC uses for 5
resource adequacy studies. Hence, because the weather strongly influences both BTM 6
PV output and load, an important feature of the new methodology is that, by using 7
weather data from the same historical year, the influence of the weather is captured both 8
in the load forecast assumption and the BTM PV load reduction in the calculations of the 9
ICR-Related Values for FCA 12. 10
11
Q: WHY IS THE HOURLY PROFILE METHODOLOGY FOR MODELING THE 12
BTM PV FORECAST IN THE ICR-RELATED VALUES CALCULATIONS AN 13
IMPROVEMENT OVER THE RELIABILITY HOURS METHODOLOGY? 14
As previously mentioned, the ISO considered the Reliability Hours methodology a 15
temporary approach until a method for realistically modeling the hourly BTM PV 16
performance was developed. During the discussions of the assumptions for calculating 17
the Installed Capacity Requirement and related values for FCA 11, some Market 18
Participants questioned the continued validity of using the Reliability Hours methodology 19
for modeling BTM PV and asked the ISO to develop the BTM PV hourly profiles needed 20
to model PV output in all hours of the year. 21
22 6 The ISO’s most detailed presentation to the PSPC on the development of the BTM PV hourly profile methodology is available at: https://www.iso-ne.com/static-assets/documents/2017/06/pspc 6 22 2017 2002 PV profile.pdf

17
The ISO believes that, beginning with the ICR-Related Values calculation for FCA 12, if 1
the Reliability Hours methodology to model BTM PV is used, the load reduction value of 2
increased penetrations of BTM PV would not be accurately reflected. The 2017 PV 3
forecast shows that the penetration of BTM PV has grown to the point at which, if the 4
Reliability Hours methodology continues to be used, the hour of new peak net of BTM 5
PV in the GE MARS model shifts from hour ending 15:00 (i.e. 3:00 p.m.) to hour ending 6
13:00 (i.e., 1:00 p.m.), because no BTM PV is modeled in hour ending 13:00,7 which is 7
the time of some of the highest BTM PV output. As a result, the true effect of BTM PV 8
in reducing system load would not be captured. 9
10
The Figure below shows this peak-shifting phenomenon graphically for the peak day with 11
PV output graphed on the first Y-axis and system load graphed on the second Y-axis. 12
Using the Reliability Hours Methodology, the net load peak (red dashed line) is shifted to 13
hour ending 13:00 which is outside the Reliability Hours window where BTM PV is not 14
modeled. This is not an accurate representation of system conditions. Also shown is the 15
hourly profile methodology with a net load peak (blue dashed line) occurring in hour 16
ending 17:00. This is expected because, with increased BTM PV penetration, the actual 17
system peak moves to hours later in the day. 18
19
7 Details of the 2017 PV forecast are available at: https://www.iso-ne.com/static-assets/documents/2017/05/2017 solar forecast details final.pdf


19
A: The ICR-Related Values for FCA 12 were developed based on the Existing Qualified 1
Capacity Resources for the 2021-2022 Capacity Commitment Period. This assumption is 2
based on the latest available data at the time of the ICR-Related Values calculation. 3
4
Q: WHAT ARE THE RESOURCE CAPACITY VALUES FOR THE 2021-20225
CAPACITY COMMITMENT PERIOD? 6
A: The following tables illustrate the make-up of the 34,567 MW of capacity resources 7
assumed in the calculation of the ICR-Related Values. 8
Table 2– Qualified Existing Non-Intermittent Generating Capacity Resources by 9 Load Zone (MW)8 10
11
12
13
8 A 30 MW derate is applied to resources located in the Vermont Load Zone to reflect the value of the firm Vermont Joint Owners contract.
Load Zone SummerMAINE 2,965.014 NEW HAMPSHIRE 4,113.377 VERMONT 217.308 CONNECTICUT 9,314.685 RHODE ISLAND 2,406.264 SOUTH EAST MASSACHUSETTS 4,456.155 WEST CENTRAL MASSACHUSETTS 3,745.817 NORTH EAST MASSACHUSETTS & BOSTON 3,171.441
Total New England 30,390.061

20
Table 3– Qualified Existing Intermittent Power Resources by Load Zone (MW)9 1
2
Table 4– Qualified Existing Import Capacity Resources (MW) 3
4
Table 5– Qualified Existing Demand Resources by Load Zone (Summer MW) 5
6
7
Although capacity resource data are tabulated under the eight settlement Load Zones, 8
only SENE (the combined SEMA, NEMA/Boston, and Rhode Island Load Zones) and 9 9 All resources have only their summer capacity rating modeled in the ICR-Related Values with the exception of Intermittent Power Resources which have both their summer and winter capacity ratings modeled.
Load Zone Summer WinterMAINE 222.854 342.987 NEW HAMPSHIRE 162.450 225.353 VERMONT 67.813 116.841 CONNECTICUT 152.357 166.061 RHODE ISLAND 8.094 17.039 SOUTH EAST MASSACHUSETTS 100.293 80.574 WEST CENTRAL MASSACHUSETTS 92.412 117.198 NORTH EAST MASSACHUSETTS & BOSTON 77.043 72.905
Total New England 883.316 1,138.958
Import Resource Summer External InterfaceNYPA - CMR 68.800 New York AC TiesNYPA - VT 13.000 New York AC TiesTotal MW 81.800
Load Zone On-PeakSeasonal
Peak
Real-time Demand
Response TotalMAINE 146.618 - 138.682 285.300NEW HAMPSHIRE 119.214 - 17.209 136.423VERMONT 89.117 - 34.079 123.196CONNECTICUT 88.536 508.842 91.842 689.220RHODE ISLAND 250.956 - 40.023 290.979SOUTH EAST MASSACHUSETTS 354.593 - 45.682 400.275WEST CENTRAL MASSACHUSETTS 371.582 39.597 71.029 482.208NORTH EAST MASSACHUSETTS & BOSTON 733.071 - 70.898 803.969
Total New England 2,153.687 548.439 509.444 3,211.570

21
NNE (the combined Maine, New Hampshire and Vermont Load Zones) are relevant for 1
FCA 12. 2
3
Q: WHAT ARE THE ASSUMPTIONS RELATING TO RESOURCE ADDITIONS 4
(THOSE WITHOUT CAPACITY SUPPLY OBLIGATIONS) AND ATTRITIONS? 5
A: Resource additions, beyond those classified as “Existing Capacity Resources,” and 6
attritions (associated with bids to de-list resources or retirements above the Forward 7
Capacity Auction Starting Price) are not assumed in the calculation of the ICR-Related 8
Values for FCA 12, which is associated with the 2021-2022 Capacity Commitment 9
Period, because there is no certainty that new resource additions or resource attritions 10
below the Forward Capacity Auction Starting Price will clear the auction. 11
12
3. RESOURCE AVAILABILITY 13
14
Q: PLEASE EXPLAIN THE RESOURCE AVAILABILITY ASSUMPTIONS 15
UNDERLYING THE CALCULATIONS OF THE ICR-RELATED VALUES FOR 16
FCA 12, WHICH IS ASSOCIATED WITH THE 2021-2022 CAPACITY 17
COMMITMENT PERIOD. 18
A: Resources are modeled at Qualified Capacity values and resource availability is also 19
considered in the calculation of the ICR-Related Values. For generating resources, 20
scheduled maintenance assumptions are based on each unit’s historical five-year average 21
of scheduled maintenance. If the individual resource has not been operational for a total 22
of five years, then NERC class average data is used to substitute for the missing annual 23

22
data. It is assumed that maintenance outages of generating resources will not be 1
scheduled during the peak load season of June through August. An individual generating 2
resource’s forced outage assumption is based on the resource’s five-year historical data 3
from the ISO’s database of NERC Generator Availability Database System (“GADS”). 4
If the individual resource has not been operational for a total of five years, then NERC 5
class average data is used to substitute for the missing annual data. The same resource 6
availability assumptions are used in all the calculations except for the Transmission 7
Security Analysis, which requires the modeling of the start-up availability of the fast-start 8
(i.e. peaking) resources to reflect their performance when dispatched.10 9
10
The Qualified Capacity of an Intermittent Power Resource is based on the resource’s 11
historical median output during the Reliability Hours averaged over a period of five 12
years. The Reliability Hours are specific, defined hours during the summer and the 13
winter, and hours during the year in which the ISO has declared a system-wide or a Load 14
Zone-specific shortage event. Because this method already takes into account the 15
resource’s availability, Intermittent Power Resources are assumed to be 100% available 16
in the models at their “Qualified Capacity” and not based on “nameplate” ratings. 17
Qualified Capacity is the amount of capacity that either a generating, demand, or import 18
resource may provide in the summer or winter in a Capacity Commitment Period, as 19
determined in the FCM qualification process. 20
21
10 See Section III.B of this testimony.

23
Performance of Demand Resources in the Real-Time Demand Response category is 1
measured by actual response during performance audits and Operating Procedure No. 4 2
events that occurred in the summer and winter of the most recent five-year period, 3
currently 2012 through 2016. To calculate historical availability, the verified commercial 4
capacity of each resource is compared to its monthly net Capacity Supply Obligation. 5
Demand Resources in the On-Peak Demand and Seasonal Peak Demand categories are 6
non-dispatchable resources that reduce load across pre-defined hours, typically by means 7
of energy efficiency. These types of Demand Resources are assumed to be 100% 8
available. 9
10
4. OTHER ASSUMPTIONS 11
12
Q: PLEASE DESCRIBE THE ASSUMPTIONS RELATING TO INTERNAL 13
TRANSMISSION TRANSFER CAPABILITIES FOR THE DEVELOPMENT OF 14
ICR-RELATED VALUES FOR FCA 12. 15
A: The assumed N-1 and N-1-1 transmission import transfer capability of the Southeast New 16
England Import interface used to calculate the SENE Capacity Zone Local Sourcing 17
Requirement and N-1 transmission export transfer capability of the North-South interface 18
used to calculate the NNE Capacity Zone Maximum Capacity Limit are shown in the 19
table below. 20
21
22
23

24
Table 6 – Internal Transmission Import Capabilities (MW) 1
2
Q: PLEASE DISCUSS THE ISO’S ASSUMPTIONS REGARDING THE ACTIONS 3
OF OPERATING PROCEDURE NO. 4 IN DEVELOPING THE ICR-RELATED 4
VALUES FOR FCA 12. 5
A: In the development of the Installed Capacity Requirement, Local Resource Adequacy 6
Requirement, Maximum Capacity Limit and MRI Demand Curves, assumed emergency 7
assistance (i.e. tie benefits, which are described below) available from neighboring 8
Control Areas, and load reduction from implementation of 5% voltage reductions are 9
used. These all constitute actions that system operators invoke under Operating 10
Procedure No. 4 in real-time to balance system demand with supply under expected or 11
actual capacity shortage conditions. The amount of load relief assumed obtainable from 12
invoking 5% voltage reductions is based on the performance standard established in ISO 13
New England Operating Procedure No. 13, Standards for Voltage Reduction and Load 14
Shedding Capability (“Operating Procedure No. 13”).11 Operating Procedure No. 13 15
requires that “…each Market Participant with control over transmission/distribution 16
facilities must have the capability to reduce system load demand, at the time a voltage 17
reduction is initiated, by at least one and one-half (1.5) percent through implementation 18
of a voltage reduction.” Using the 1.5% reduction in system load demand, the assumed 19
voltage reduction load relief values, which offset against the Installed Capacity 20
11 Copy available at: https://www.iso-ne.com/static-assets/documents/rules proceds/operating/isone/op13/op13 rto final.pdf.
Interface Contingency 2021-2022N-1 5,700
N-1-1 4,600 North-South (for NNE MCL) N-1 2,725
Southeast New England Import (for SENE LSR)

25
Requirement, are 431 MW for June through September 2021 and 317 MW for October 1
2021 through May 2022. 2
3
5. TIE BENEFITS 4
5
Q: WHAT ARE TIE BENEFITS? 6
A: Tie benefits represent the possible emergency energy assistance from the interconnected 7
neighboring Control Areas when a capacity shortage occurs. 8
9
Q: WHAT IS THE ROLE OF EXTERNAL TRANSMISSION IMPORT TRANSFER 10
CAPABILITIES IN DEVELOPING THE ICR-RELATED VALUES? 11
A: While external transmission import transfer capabilities are not an input to the calculation 12
of the ICR-Related Values, they do impact the tie benefit assumption. Specifically, the 13
external transmission import transfer capabilities would impact the amount of emergency 14
energy, if available, that could be imported into New England. 15
16
Q: ARE INTERNAL TRANSMISSION TRANSFER CAPABILITIES MODELED IN 17
TIE BENEFITS STUDIES? 18
A: Internal transmission transfer capability constraints that are not addressed by either a 19
Local Sourcing Requirement or Maximum Capacity Limit are modeled in the tie benefits 20
study. The results of the tie benefits study are used as an input in the Installed Capacity 21
Requirement, Local Resource Adequacy Requirement, Maximum Capacity Limit, and 22
MRI Demand Curves calculations. 23

26
Q: PLEASE EXPLAIN HOW TIE BENEFITS FROM NEIGHBORING CONTROL 1
AREAS ARE ACCOUNTED FOR IN DETERMINING THE INSTALLED 2
CAPACITY REQUIREMENT. 3
A: The New England resource planning reliability criterion requires that adequate capacity 4
resources be planned and installed such that disconnection of firm load would not occur 5
more often than once in ten years due to a capacity deficiency after taking into account 6
the load and capacity relief obtainable from implementing Operating Procedure No. 4. In 7
other words, load and capacity relief assumed obtainable from implementing Operating 8
Procedure No. 4 actions are direct substitutes for capacity resources for meeting the once 9
in 10 years disconnection of firm load criterion. Calling on neighboring Control Areas to 10
provide emergency energy assistance (“tie benefits”) is one of the actions of Operating 11
Procedure No. 4. Therefore, the amount of tie benefits assumed obtainable from the 12
interconnected neighboring Control Areas directly displaces that amount of installed 13
capacity resources needed to meet the resource planning reliability criterion. When 14
determining the amount of tie benefits to assume in Installed Capacity Requirement 15
calculations, it is necessary to recognize that, while reliance on tie benefits can reduce 16
capacity resource needs, over-reliance on tie benefits decreases system reliability. 17
System reliability would decrease because each time emergency assistance is requested 18
there is a possibility that the available assistance will not be sufficient to meet the 19
capacity deficiency. The more tie benefits are relied upon to meet the resource planning 20
reliability criterion, and the greater the amount of assistance requested, the greater the 21
possibility that they will not be available or sufficient to avoid implementing deeper 22
actions of Operating Procedure No. 4, and interrupting firm load in accordance with ISO 23

27
New England Operating Procedure No. 7 – Action in an Emergency. For example, some 1
of the resources that New York has available to provide tie benefits are demand response 2
resources which have limits on the number of times they can be activated. In addition, 3
none of the neighboring Control Areas are conducting their planning, maintenance 4
scheduling, unit commitment or real-time operations with a goal of maintaining their 5
emergency assistance at a level needed to maintain the reliability of the New England 6
system. 7
8
Q: PLEASE DESCRIBE THE TIE BENEFITS ASSUMPTIONS UNDERLYING THE 9
ICR-RELATED VALUES FOR FCA 12. 10
A: Under Section III.12.9 of the Tariff, the ISO is required to perform a tie reliability 11
benefits study for each Forward Capacity Auction, which provides the total overall tie 12
benefit value available from all interconnections with adjacent Control Areas, the 13
contribution of tie benefits from each of these adjacent Control Areas, as well as the 14
contribution from individual interconnections or qualifying groups of interconnections 15
within each adjacent Control Area. 16
17
Pursuant to Section III.12.9 of the Tariff, the Installed Capacity Requirement calculations 18
for FCA 12 assume total tie benefits of 2,020 MW based on the results of the tie benefits 19
study for the 2021-2022 Capacity Commitment Period. A breakdown of this total value 20
is as follows: 958 MW from Quebec over the Hydro-Quebec Phase I/II HVDC 21
Transmission Facilities, 143 MW from Quebec over the Highgate interconnection, 506 22
MW from New Brunswick (Maritimes) over the New Brunswick interconnections, and 23
28
413 MW from New York over the AC interconnections. Tie benefits are assumed not 1
available over the Cross Sound Cable because the import capability of the Cross Sound 2
Cable was determined to be zero. 3
4
Q: IS THE ISO’S METHODOLOGY FOR CALCULATING TIE BENEFITS FOR 5
FCA 12 THE SAME AS THE METHODOLOGY USED FOR FCA 11? 6
A: Yes. The methodology for calculating the tie benefits used in the Installed Capacity 7
Requirement for FCA 12 is the same methodology used to calculate the tie benefits used 8
in the Installed Capacity Requirement for FCA 11. This methodology is described in 9
detail in Section III.12.9 of the Tariff. 10
11
Q: DOES THIS CALCULATION METHODOLOGY CONFORM WITH INDUSTRY 12
PRACTICE AND TARIFF REQUIREMENTS? 13
A: Yes. This probabilistic calculation methodology is widely used by the electric industry. 14
NPCC has been using a similar methodology for many years. The ISO has been using 15
the GE MARS program and a similar probabilistic calculation methodology for tie 16
benefits calculations since 2002. The calculation methodology conforms to the Tariff 17
provisions filed with and approved by the Commission. 18
19
Q: PLEASE EXPLAIN THE ISO’S METHODOLOGY FOR DETERMINING THE 20
TIE BENEFITS FOR FCA 12. 21
A: The tie benefits study for FCA 12 was conducted using the probabilistic GE MARS 22
program to model the expected system conditions of New England and its directly 23

29
interconnected neighboring Control Areas of New Brunswick, New York, and Quebec. 1
All of these Control Areas were assumed to be “at criterion,” which means that the 2
capacity of all three neighboring Control Areas was adjusted so that they would each 3
have a LOLE of once in ten years when interconnected to each other. 4
5
The “at criterion” approach was applied to represent the expected amounts of capacity in 6
each Control Area since each of these areas has structured its planning processes and 7
markets (where applicable) to achieve the “at criterion” level of reliability. 8
9
The total tie benefits to New England from New Brunswick (Maritimes), New York and 10
Quebec were calculated first. To calculate total tie benefits, the interconnected system of 11
New England and its directly interconnected neighboring Control Areas were brought to 12
0.1 days per year LOLE and then compared to the LOLE of the isolated New England 13
system. Total tie benefits equal the amount of firm capacity equivalents that must be 14
added to the isolated New England Control Area to bring New England to 0.1 days per 15
year LOLE. 16
17
Following the calculation of total tie benefits, individual tie benefits from each of the 18
three directly interconnected neighboring Control Areas were calculated. Tie benefits 19
from each neighboring Control Area were calculated using a similar analysis, with tie 20
benefits from the Control Area equaling the simple average of the tie benefits calculated 21
from all possible interconnection states between New England and the target Control 22
Area, subject to adjustment, if any, for capacity imports as described below. 23

30
If the sum of the tie benefits from each Control Area does not equal the total tie benefits 1
to New England, then each Control Area’s tie benefits was pro-rationed so that the sum 2
of each Control Area’s tie benefits equals the total tie benefits for all Control Areas. 3
Following this calculation, tie benefits were calculated for each individual 4
interconnection or qualifying group of interconnections, and a similar pro-rationing was 5
performed if the sum of the tie benefits from individual interconnections or groups of 6
interconnections does not equal their associated Control Area’s tie benefits. 7
8
After the pro-rationing, the tie benefits for each individual interconnection or group of 9
interconnections was adjusted to account for capacity imports. After the import 10
capability and capacity import adjustments, the sum of the tie benefits of all individual 11
interconnections and groups of interconnections for a Control Area then represents the tie 12
benefits associated with that Control Area, and the sum of the tie benefits from all 13
Control Areas then represents the total tie benefits available to New England. 14
15
Q: HOW DOES THE ISO DETERMINE WHICH INTERCONNECTIONS MAY BE 16
ALLOCATED A SHARE OF TIE BENEFITS? 17
A: Tie benefits are calculated for all interconnections for which a “discrete and material 18
transfer capability” can be determined. This standard establishes that if an 19
interconnection has any discernible transfer capability, it will be evaluated. If this 20
nominal threshold is met, the ISO then evaluates the interconnection to determine 21
whether it should be evaluated independently or as part of a group of interconnections. 22

31
An interconnection will be evaluated with other interconnections as part of a “group of 1
interconnections” if that interconnection is one of two or more AC interconnections that 2
operate in parallel to form a transmission interface in which there are significant 3
overlapping contributions of each line toward establishing the transfer capability, such 4
that the individual lines in the group of interconnections cannot be assigned individual 5
contributions. This standard is contained in Section III.12.9.5 of the Tariff. 6
7
Finally, one component of the tie benefits calculation for individual interconnections is 8
the determination of the “transfer capability” of the interconnection. If the 9
interconnection has minimal or no available transfer capability during times when the 10
ISO will be relying on the interconnection for tie benefits, then the interconnection will 11
be assigned minimal or no tie benefits. 12
13
Q: ARE THERE ANY INTERCONNECTIONS BETWEEN NEW ENGLAND AND 14
ITS DIRECTLY INTERCONNECTED NEIGHBORING CONTROL AREAS FOR 15
WHICH THE ISO HAS NOT CALCULATED TIE BENEFITS? 16
A: No. The ISO is calculating tie benefits for all interconnections between New England 17
and its directly interconnected neighboring Control Areas, either individually or as part of 18
a group of interconnections. 19
20
Q: WHAT IS THE TRANSFER CAPABILITY OF EACH OF THE 21
INTERCONNECTIONS OR GROUPS OF INTERCONNECTIONS FOR WHICH 22
TIE BENEFITS HAVE BEEN CALCULATED? 23

32
A: The following table lists the external transmission interconnections and the transfer 1
capability of each used for calculating tie benefits for FCA 12: 2
Table 7 – Transmission Transfer Import Capability of the New England External 3 Transmission Interconnections (MW) 4
5
6
One factor in the calculation of tie benefits is the transfer capability into New England of 7
the interconnections for which tie benefits are calculated. In the first half of 2017, the 8
transfer limits of these external interconnections were reviewed based on the latest 9
available information regarding forecasted topology and load forecast information, and it 10
was determined that no changes to the established external interface transmission import 11
limits were warranted. The other factor is the transfer capability of the internal 12
transmission interfaces. For internal transmission interfaces, when calculating tie 13
benefits for the 2021-2022 Installed Capacity Requirement filed herewith, the ISO used 14
the transfer capability values from its most recent transfer capability analyses. 15
16
17
External Transmission Interconnections/Interfaces
Import Capability Into New England
New Brunswick Interconnections 700
Highgate Interconnection 200
Hydro-Quebec Phase I/II HVDC Transmission Facilities
1,400
Cross-Sound Cable 0
New York AC Interface 1,400

33
III. LOCAL SOURCING REQUIREMENT AND MAXIMUM CAPACITY LIMIT 1
2
A. DESCRIPTION OF LOCAL SOURCING REQUIREMENT 3
4
Q: WHAT IS THE LOCAL SOURCING REQUIREMENT? 5
A: The Local Sourcing Requirement is the minimum amount of capacity that must be 6
electrically located within an import-constrained Capacity Zone. The Local Sourcing 7
Requirement is the mechanism used to assist in valuing capacity appropriately in 8
constrained areas. It is the amount of capacity needed to satisfy “the higher of” (i) the 9
Local Resource Adequacy Requirement or (ii) the Transmission Security Analysis 10
Requirement. The Local Sourcing Requirement is applied to import-constrained 11
Capacity Zones within New England. 12
13
Q: WHAT ARE IMPORT-CONSTRAINED CAPACITY ZONES? 14
A: Import-constrained Capacity Zones are areas within New England that, due to 15
transmission constraints, are close to the threshold where they may not have enough local 16
resources and transmission import capability to reliably serve local demand. 17
18
Q: HOW IS AN IMPORT-CONSTRAINED CAPACITY ZONE DETERMINED? 19
A: A separate import-constrained Capacity Zone is identified in the most recent annual 20
assessment of transmission transfer capability pursuant to OATT, Section II, Attachment 21
K, as a zone for which the second contingency transmission capability results in a line-22
line Transmission Security Analysis Requirement, calculated pursuant to Section 23

34
III.12.2.1.2 and pursuant to ISO New England Planning Procedures, that is greater than 1
the Existing Qualified Capacity in the zone, with the largest generating station in the zone 2
modeled as out-of-service. Each assessment will model as out-of-service all retirement 3
requests (including any received for the current Forward Capacity Auction at the time of 4
this calculation) and Permanent De-List Bids as well as rejected for reliability Static and 5
Dynamic De-List Bids from the most recent previous Forward Capacity Auction. 6
7
Q: WHICH ZONES WILL BE MODELED AS IMPORT CONSTRAINED 8
CAPACITY ZONES FOR FCA 12? 9
A: After applying the import-constrained Capacity Zone objective criteria testing, it was 10
determined that, for FCA 12, the SENE Capacity Zone, which consists of the combined 11
Load Zones of SEMA, NEMA/Boston, and Rhode Island, will be modeled as a separate 12
import-constrained Capacity Zone. 13
14
B. DEVELOPMENT OF THE LOCAL SOURCING REQUIREMENT 15
16
Q: PLEASE DESCRIBE THE METHODOLOGY FOR CALCULATING THE 17
LOCAL SOURCING REQUIREMENT. 18
A: The methodology for calculating the Local Sourcing Requirement harmonizes the use of 19
the local resource adequacy criteria and the transmission security criteria that the ISO 20
uses to maintain system operational reliability when reviewing de-list bids for the 21
Forward Capacity Auction. Because the system must meet both resource adequacy and 22
transmission security requirements, both are developed for each import-constrained zone 23

35
under Section III.12.2 of the Tariff. Specifically, the Local Sourcing Requirement for an 1
import-constrained zone is the amount of capacity needed to satisfy “the higher of” (i) the 2
Local Resource Adequacy Requirement or (ii) the Transmission Security Analysis 3
Requirement. Under this approach, the ISO calculates a zonal requirement using 4
probabilistic resource adequacy criteria, referred to as the “Local Resource Adequacy 5
Requirement” and a deterministic transmission security analysis referred to as the 6
“Transmission Security Analysis Requirement.” The term Local Sourcing Requirement 7
refers to “the higher of” the Local Resource Adequacy Requirement or the requirement 8
calculated based on the Transmission Security Analysis. 9
10
Q: PLEASE DESCRIBE THE METHODOLOGY FOR CALCULATING THE 11
LOCAL RESOURCE ADEQUACY REQUIREMENT. 12
A: For each import-constrained capacity zone, the Local Resource Adequacy Requirement is 13
determined by modeling the zone under study vis-à-vis the rest of New England. This, in 14
effect, turns the modeling effort into a series of two-area reliability simulations. The 15
reliability target of this analysis is a system-wide LOLE of 0.105 days per year when the 16
transmission constraints between the two zones are included in the model. Because the 17
Local Resource Adequacy Requirement is the minimum amount of resources that must be 18
located in a zone to meet the system-reliability requirements for a capacity zone with 19
excess capacity, the process to calculate this value involves shifting capacity out of the 20
zone under study until the reliability threshold, or target LOLE of 0.105,12 is achieved. 21
12 An allowance for transmission-related LOLE of 0.005 days per year is applied when determining the Local Resource Adequacy Requirement of a capacity zone.

36
Q: PLEASE DESCRIBE THE METHODOLOGY FOR CALCULATING THE 1
TRANSMISSION SECURITY ANALYSIS REQUIREMENT. 2
A: The Transmission Security Analysis is a deterministic reliability screen of an import-3
constrained area and is a basic security review set out in Planning Procedure No. 10, 4
Planning Procedure to Support the Forward Capacity Market, and in Section 3.0 of 5
NPCC’s Regional Reliability Reference Directory #1, Design and Operation of the Bulk 6
Power System.13 This review determines the requirement of the sub-area to meet its load 7
through internal generation and import capacity and is performed via a series of discrete 8
transmission load flow study scenarios. In performing the analysis, static transmission 9
interface transfer limits are established as a reasonable representation of the transmission 10
system’s capability to serve sub-area load with available existing resources and results 11
are presented under the form of a deterministic operable capacity analysis. This analysis 12
also includes evaluations of both: (1) the loss of the most critical transmission element 13
and the most critical generator (“Line-Gen”), and; (2) the loss of the most critical 14
transmission element followed by loss of the next most critical transmission element 15
(“Line-Line”). Similar deterministic analyses are also used each day by the ISO’s 16
System Operations Department to assess the amount of capacity to be committed day-17
ahead. Further, such deterministic sub-area transmission security analyses have 18
consistently been used for reliability review studies performed to determine if the 19
removal of a resource that may be retired or de-listed would violate reliability criteria. 20
21 22 23
13 Available at https://www.npcc.org/Standards/Directories/Directory 1 TFCP rev 20151001 GJD.pdf.

37
Q: WHAT ARE THE DIFFERENCES BETWEEN THE ASSUMPTIONS USED FOR 1
THE DETERMINATION OF THE TRANSMISSION SECURITY ANALYSIS 2
REQUIREMENT AND THE ASSUMPTIONS USED FOR THE 3
DETERMINATION OF THE LOCAL RESOURCE ADEQUACY 4
REQUIREMENT? 5
A: There are three differences between the assumptions relied upon for the Transmission 6
Security Analysis Requirement and the assumptions relied upon for determining the 7
Local Resource Adequacy Requirement. The first difference relates to the load forecast 8
assumption. Resource adequacy analyses (i.e., the analysis performed in determining the 9
Installed Capacity Requirement, Local Resource Adequacy Requirement, Maximum 10
Capacity Limit, and MRI Demand Curves) are performed using the full probability 11
distribution of load variations due to weather uncertainty. For the purpose of performing 12
the deterministic Transmission Security Analysis, single discreet points on the probability 13
distribution are used; in accordance with ISO New England Planning Procedure No. 10, 14
the analysis is performed using the published Reference 90/10 peak load forecast, net of 15
the BTM PV forecasted value, which corresponds to a peak load that has a 10% 16
probability of being exceeded based on weather variation. 17
18
The second difference relates to the application of assumed forced outages to fast-start 19
(also referred to as “peaking”) generating resources. For fast-start generating resources, 20
an operational de-rating factor of 20% was applied in the Transmission Security Analysis 21
instead of a forced outage assumption. This 20% de-rating factor is used because the 22
traditional generating resource forced outage statistical measure used for the Installed 23
38
Capacity Requirement calculations does not explicitly capture the peaking generating 1
resources’ ability to start and remain on-line when requested to do so after the occurrence 2
of a contingency. Consequently, it has been the ISO’s experience and practice to model 3
the start-up performance of the peaking generation in Transmission Security Analyses 4
with a 20% de-rating assumption. 5
6
The third difference relates to the reliance on Operating Procedure No. 4 actions, which 7
are not traditionally relied upon in Transmission Security Analyses. While the Local 8
Resource Adequacy Requirement uses voltage reduction actions 6 and 8, no load or 9
capacity relief obtainable from implementing Operating Procedure No. 4 actions are 10
included in the calculation of Transmission Security Analysis Requirements. 11
12
Q: PLEASE DESCRIBE THE LOCAL RESOURCE ADEQUACY REQUIREMENT, 13
TRANSMISSION SECURITY ANALYSIS REQUIREMENT, AND LOCAL 14
SOURCING REQUIREMENT FOR THE SENE CAPACITY ZONE FOR FCA 12. 15
A: For FCA 12, the Local Resource Adequacy Requirement, Transmission Security Analysis 16
Requirement and the Local Sourcing Requirement for the SENE Capacity Zone are as 17
follows: 18
Table 8 – SENE Capacity Zone Requirements for the 2021-2022 Capacity Commitment 19 Period (MW) 20 21
Capacity Zone
Transmission Security Analysis
Requirement
Local Resource Adequacy
Requirement Local Sourcing Requirement
SENE 10,018 9,705 10,018 22

39
IV. MAXIMUM CAPACITY LIMIT 1
2
Q: WHAT IS THE MAXIMUM CAPACITY LIMIT? 3
A: The Maximum Capacity Limit is the maximum amount of capacity that is electrically 4
located in an export-constrained Capacity Zone used to meet the Installed Capacity 5
Requirement. 6
7
Q: WHAT ARE EXPORT-CONSTRAINED CAPACITY ZONES? 8
A: Export-constrained Capacity Zones are areas within New England where the available 9
resources, after serving local load, may exceed the areas’ transmission capability to 10
export excess resource capacity. 11
12
Q: HOW IS AN EXPORT-CONSTRAINED CAPACITY ZONE DETERMINED? 13
A: A separate export-constrained Capacity Zone is identified in the most recent annual 14
assessment of transmission transfer capability pursuant to ISO Open Access 15
Transmission Tariff (“OATT”) Section II, Attachment K, as a zone for which the 16
Maximum Capacity Limit is less than the sum of the existing qualified capacity and 17
proposed new capacity that could qualify to be procured in the export-constrained 18
Capacity Zone, including existing and proposed new Import Capacity Resources on the 19
export-constrained side of the interface. 20
21
Q: WHICH ZONES WILL BE MODELED AS EXPORT CONSTRAINED 22
CAPACITY ZONES FOR FCA 12? 23

40
A: After applying the export-constrained Capacity Zone objective criteria testing, it was 1
determined that, for FCA 12, the NNE Capacity Zone, which consists of the combined 2
Load Zones of Maine, New Hampshire and Vermont, will be modeled as a separate 3
export-constrained Capacity Zone. 4
5
Q: WHAT IS THE MAXIMUM CAPACITY LIMIT FOR THE NNE CAPACITY 6
ZONE FOR FCA 12 AND HOW WAS IT CALCULATED? 7
A: The Maximum Capacity Limit for the NNE Capacity Zone for FCA 12 is 8,790 MW. 8
This number also reflects the tie benefits assumed available over the New Brunswick and 9
Highgate interfaces. The Maximum Capacity Limit was calculated using the 10
methodology that is reflected in Section III.12.2.2 of the Tariff. 11
12
In order to determine the Maximum Capacity Limit, the New England Net Installed 13
Capacity Requirement and the Local Resource Adequacy Requirement of the “Rest of 14
New England” are needed. Rest of New England refers to all areas except the export-15
constrained Capacity Zone under study. Given that the Net Installed Capacity 16
Requirement is the total amount of resources that the region needs to meet the 0.1 17
days/year LOLE, and the Local Resource Adequacy Requirement for the Rest of New 18
England is the minimum amount of resources required for that area to satisfy its 19
reliability criterion, the difference between the two is the maximum amount of resources 20
that can be used within the export-constrained Capacity Zone to meet the 0.1 days/year 21
LOLE. 22
23

41
V. HQICCs 1
2
Q: WHAT ARE HQICCs? 3
A: HQICCs are capacity credits that are allocated to the Interconnection Rights Holders, 4
which are entities that pay for and, consequently, hold certain rights over the Hydro 5
Quebec Phase I/II HVDC Transmission Facilities (“HQ Interconnection”).14 Pursuant to 6
Sections III.12.9.5 and III.12.9.7 of the Tariff, the tie benefit value for the HQ 7
Interconnection was established using the results of a probabilistic calculation of tie 8
benefits with Quebec. The ISO calculates HQICCs, which are allocated to 9
Interconnection Rights Holders in proportion to their individual rights over the HQ 10
Interconnection, and must file the HQICC values established for each FCA. 11
12
Q: WHAT ARE THE HQICC VALUES FOR FCA 12, WHICH IS ASSOCIATED 13
WITH THE 2021-2022 CAPACITY COMMITMENT PERIOD? 14
A: The HQICC values are 958 MW for every month of the 2021-2022 Capacity 15
Commitment Period. 16
17
18
19
14 See Section I.2.2 of the Tariff (stating in the definition of “Hydro-Quebec Interconnection Capability Credit” that “[a]n appropriate share of the HQICC shall be assigned to an IRH if the Hydro Quebec (HQ) Phase I/II HVDC-TF support costs are paid by that IRH and such costs are not included in the calculation of the Regional Network Service rate.”). See also Section III.12.9.7 of the Tariff (“The tie benefits from the Quebec Control Area over the HQ Phase I/II HVDC-TF calculated in accordance with Section III.12.9.1 shall be allocated to the Interconnection Rights Holders or their designees in proportion to their respective percentage shares of the HQ Phase I and the HQ Phase II facilities, in accordance with Section I of the Transmission, Markets and Services Tariff.”).

42
VI. MRI DEMAND CURVES 1
2
Q: PLEASE DESCRIBE THE METHODOLOGY USED FOR CALCULATING THE 3
MRI DEMAND CURVES FOR FCA 12. 4
A: To calculate the System-Wide Capacity Demand Curve, the Import-Constrained Capacity 5
Zone Demand Curve for SENE, and the Export-Constrained Capacity Zone Demand 6
Curve for NNE for FCA 12, the ISO used the MRI methodology, which measures the 7
marginal reliability impact (i.e. the MRI), associated with various capacity levels for the 8
system and the Capacity Zones. 9
10
To measure the MRI, the ISO uses a performance metric known as “expected energy not 11
served” (or “EENS,” which can be described as unserved load). EENS is measured in 12
MWh per year and can be calculated for any set of system and zonal installed capacity 13
levels. The EENS values for system capacity levels are produced by the GE MARS 14
model,15 in 10 MW increments and applying the same assumptions used in determining 15
the Installed Capacity Requirement. These system EENS values are translated into MRI 16
values by estimating how an incremental change in capacity impacts system reliability at 17
various capacity levels, as measured by EENS. An MRI curve is developed from these 18
values with capacity represented on the X-axis and the corresponding MRI values on the 19
Y-axis. 20
15 The GE MARS model is the same simulation system that is already used to develop the Installed Capacity Requirement and other values that specify how much capacity is required for resource adequacy purposes from a system planning perspective. For the development of the MRI Demand Curves, the GE MARS model is used to calculate reliability values using 10 MW additions above and 10 MW deductions below the calculated requirements until a sufficient set of values that covers the full range necessary to produce the MRI Demand Curves is determined.

43
MRI values at various capacity levels are also calculated for the SENE import-1
constrained Capacity Zone and the NNE export-constrained Capacity Zone using the 2
same modeling assumptions and methodology as those used to determine the Local 3
Resource Adequacy Requirement and the Maximum Capacity Limit for those Capacity 4
Zones, with the exception of the modification of the transmission transfer capability for 5
the SENE import-constrained Capacity Zone as described in more detail below. These 6
MRI values are calculated to reflect the change in system reliability associated with 7
transferring incremental capacity from the Rest-of-Pool Capacity Zone into the 8
constrained capacity zone. 9
10
Q: PLEASE EXPLAIN THE USE OF A CAPACITY DEMAND CURVE SCALING 11
FACTOR IN THE MRI DEMAND CURVE METHODOLOGY. 12
A: In order to satisfy both the reliability needs of the system, which requires that the FCM 13
procure sufficient capacity to meet the 0.1 days per year reliability criterion and produce 14
a sustainable market such that the average market clearing price is sufficient to attract 15
new entry of capacity when needed over the long term, the system and zonal demand 16
curves for FCA 12 are set equal to the product of their MRI curves and a fixed demand 17
curve scaling factor . The scaling factor is set equal to the lowest value at which the set 18
of demand curves will simultaneously satisfy the planning reliability criterion and pay the 19
estimated cost of new entry (“Net CONE”).16 In other words, the scaling factor is equal 20
to the value which produces a system demand curve that specifies a price of Net CONE at 21
the net Installed Capacity Requirement (Installed Capacity Requirement minus HQICCs). 22
16 For FCA 12, Net CONE has been determined as $8.04/kW-month.
44
To satisfy this requirement, the demand curve scaling factor for FCA 12 was developed 1
for the System-Wide Capacity Demand Curve, the Import-Constrained Capacity Zone 2
Demand Curve for the SENE Capacity Zone, and the Export-Constrained Capacity Zone 3
Demand Curve for the NNE Capacity Zone in accordance with Section III.13.2.2.4 of the 4
Tariff. The demand curve scaling factor is set at the value such that, at the quantity 5
specified by the System-Wide Capacity Demand Curve at a price of Net CONE, the 6
LOLE is 0.1 days per year. 7
8
For purposes of calculating the MRI values for the System-Wide Capacity Demand 9
Curve, the ISO must apply the same modeling assumptions and methodology used in 10
determining the Installed Capacity Requirement. 11
12
Q: PLEASE EXPLAIN THE TRANSITION METHODOLOGY USED TO DEVELOP 13
THE SYSTEM-WIDE CAPACITY DEMAND CURVE FOR FCA 12. 14
15 A: For FCA 12, the ISO used the transition provisions in Section III.13.2.2.1 to determine 16
the System-Wide Demand Curve. The transition curve is a hybrid of the previous linear 17
demand curve design and the new MRI-based design. 18
19
The MRI transition period aims to provide a transition from the linear system-wide 20
capacity demand curve methodology used in FCA 9 and FCA 10 to the MRI-based 21
system-wide capacity demand curve methodology. This transition period will help to 22
provide a stable and consistent market signal while balancing stakeholder interests. The 23
transition period begins with the FCA 11 and may last no longer than three FCAs. If 24

45
certain conditions relating to net Installed Capacity Requirement growth are met, the 1
transition period will end earlier pursuant to Section III.13.2.2.1 of the Tariff. During the 2
MRI transition period, the System-Wide Capacity Demand Curve is represented as a 3
hybrid of the previous linear demand curve design and the new MRI-based demand curve 4
design. 5
6
During the MRI transition period, the System-Wide Capacity Demand Curve for FCA 12 7
shall consist of the following three segments: 8
(1) at prices above $7.03/kW-month and below the Forward Capacity Auction Starting 9
Price, the System-Wide Capacity Demand Curve shall specify a price for system 10
capacity quantities based on the MRI-based demand curve design; 11
(2) for prices below $7.03/kw-month, the System-Wide Capacity Demand Curve is 12
represented by a linear segment that runs from a price of $7.03 and a capacity 13
quantity of 34,276 MW to a price of $0 and a capacity quantity of 35,892 MW; and 14
(3) a horizontal line at a price of $7.03/kw-month which connects segments (1) and (2) 15
specified above. 16
17
Q: PLEASE PROVIDE ADDITIONAL DETAILS REGARDING THE 18
DEVELOPMENT OF THE IMPORT-CONSTRAINED CAPACITY ZONE 19
DEMAND CURVE FOR THE SENE CAPACITY ZONE. 20
A: For import-constrained Capacity Zones, the Local Resource Adequacy Requirement and 21
Transmission Security Analysis Requirement values both play a role in defining the MRI-22
based demand curves as they do in setting the Local Sourcing Requirement. Under 23
46
III.12.2.1.3 of the Tariff, prior to each FCA, the ISO must determine the MRI value of 1
various capacity levels, for each import-constrained Capacity Zone. For purposes of these 2
calculations, the ISO applies the same modeling assumptions and methodology used to 3
determine the Local Resource Adequacy Requirement except that the capacity transfer 4
capability between the Capacity Zone under study and the rest of the New England 5
Control Area is reduced by the greater of: (i) the Transmission Security Analysis 6
Requirement minus the Local Resource Adequacy Requirement, and; (ii) zero. By using 7
a transfer capability that accounts for both the Transmission Security Analysis and the 8
Local Resource Adequacy Requirements, the ISO applies the same “higher of” logic used 9
in the Local Sourcing Requirement to the derivation of sloped zonal demand curves. For 10
FCA 12, the only import-constrained Capacity Zone is SENE and, therefore, there is only 11
one Import-Constrained Capacity Zone Demand Curve. 12
13
Q: PLEASE PROVIDE ADDITIONAL DETAILS REGARDING THE 14
DEVELOPMENT OF THE EXPORT-CONSTRAINED CAPACITY ZONE 15
DEMAND CURVE FOR THE NNE CAPACITY ZONE. 16
A: Under Section III.12.2.2.1 of the Tariff, prior to each FCA, the Export-Constrained 17
Capacity Zone Demand Curve is calculated using the same modeling assumptions and 18
methodology used to determine the export-constrained Capacity Zone’s Maximum 19
Capacity Limit. Using the values calculated pursuant to Section III.12.2.2.1 of the Tariff, 20
the ISO must determine the Export-Constrained Capacity Zone Demand Curves pursuant 21
to Section III.13.2.2.3 of the Tariff. For FCA 12, the only export-constrained Capacity 22


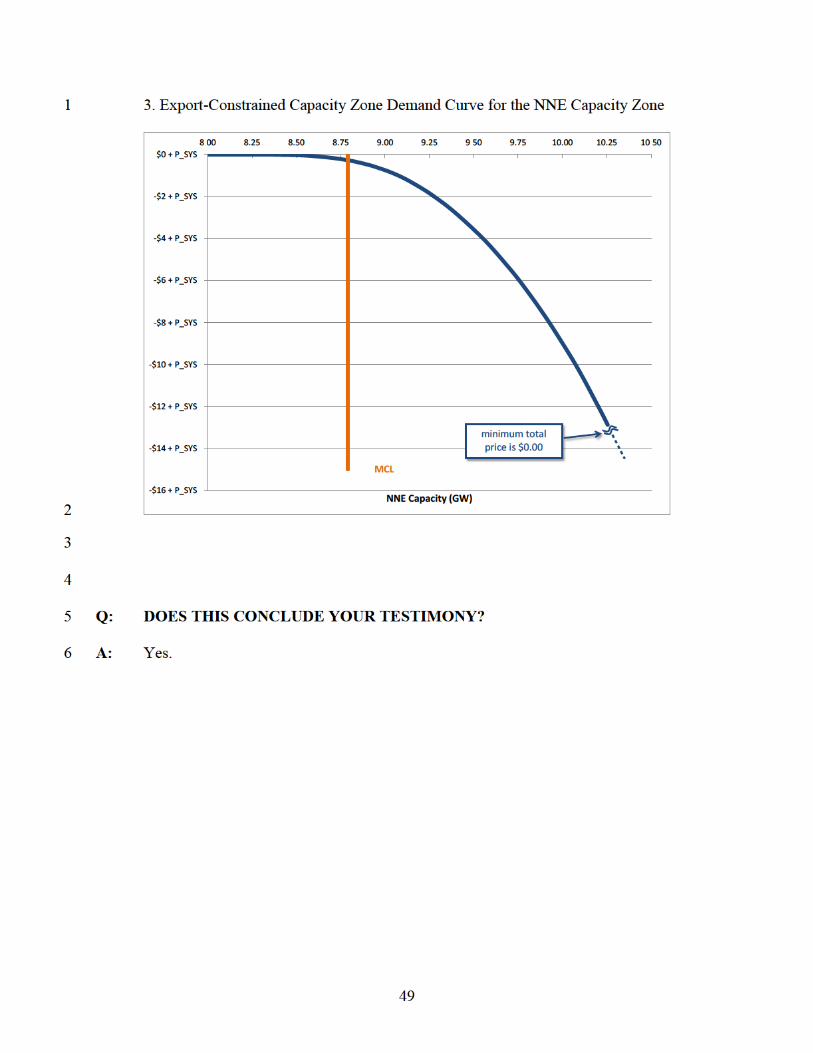

1 I declare that the foregoing is true and correct.
2
3
4
5
Executed on� 11 fALU� Carissa Sedlacek

New England Governors, State Utility Regulators and Related Agencies*
Connecticut
The Honorable Dannel P. Malloy Office of the Governor State Capitol 210 Capitol Ave. Hartford, CT 06106 [email protected]
Connecticut Public Utilities Regulatory Authority 10 Franklin Square New Britain, CT 06051-2605 [email protected] [email protected] [email protected] [email protected]
Maine
The Honorable Paul LePage One State House Station Office of the Governor Augusta, ME 04333-0001 [email protected]
Maine Public Utilities Commission 18 State House Station Augusta, ME 04333-0018 [email protected]
Massachusetts
Massachusetts Attorney General Office One Ashburton Place Boston, MA 02108 [email protected]
Massachusetts Department of Public Utilities One South Station Boston, MA 02110 [email protected] [email protected]
New Hampshire
The Honorable Chris Sununu Office of the Governor 26 Capital Street Concord NH 03301 [email protected] [email protected]
New Hampshire Public Utilities Commission 21 South Fruit Street, Ste. 10 Concord, NH 03301-2429 [email protected] [email protected] [email protected]@puc.nh.gov [email protected] [email protected] [email protected]
Rhode Island
The Honorable Gina Raimondo Office of the Governor 82 Smith Street Providence, RI 02903 [email protected] [email protected] [email protected] [email protected] [email protected]
Rhode Island Public Utilities Commission 89 Jefferson Blvd. Warwick, RI 02888 [email protected] [email protected] [email protected]
Vermont
The Honorable Phil Scott Office of the Governor 109 State Street, Pavilion Montpelier, VT 05609 [email protected]

New England Governors, State Utility Regulators and Related Agencies*
Vermont Public Service Board 112 State Street Montpelier, VT 05620-2701 [email protected] [email protected]
Vermont Department of Public Service 112 State Street, Drawer 20 Montpelier, VT 05620-2601 [email protected] [email protected] [email protected]
New England Governors, Utility Regulatory and Related Agencies
Jay Lucey Coalition of Northeastern Governors 400 North Capitol Street, NW Washington, DC 20001 [email protected]
Heather Hunt, Executive Director New England States Committee on Electricity 655 Longmeadow Street Longmeadow, MA 01106 [email protected] [email protected]
Rachel Goldwasser, Executive Director New England Conference of Public Utilities Commissioners 72 N. Main Street Concord, NH 03301 [email protected]
Martin Honigberg, President New England Conference of Public Utilities Commissioners One South Station Boston, MA 02110 [email protected]