vibrating wire sensors for beam … · conceptual idea yerevan physics institute s.arutunian,...
TRANSCRIPT

VIBRATING WIRE SENSORS FOR BEAM INSTRUMENTATION
Suren Arutunian
Yerevan Physics Institute
Yerevan Physics Institute S.Arutunian, VIBRATING WIRE SENSORS FOR BEAM INSTRUMENTATIONBIW 2008, Lake Tahoe, USA

Conceptual idea
Yerevan Physics Institute S.Arutunian, VIBRATING WIRE SENSORS FOR BEAM INSTRUMENTATIONBIW 2008, Lake Tahoe, USA
Yerevan Physics Institute S.Arutunian, VIBRATING WIRE SENSORS FOR BEAM INSTRUMENTATIONBIW 2008, Lake Tahoe, USA
Vibrating wire scanner -dream of 1994
Vibrating wire scanner test in lab [Arutunian et. al., PAC (March 29 -April 2, 1999, New York City)]

Simple theory: why VWS sensitivity is extremely high?
ρσ•= lF 1
ρσl
llEFF ∆•=∆ σ2/
TEFF S∆•−=∆ ασ2/
GPaE 200=MPastrenghttensile 800500−=−<<σ
E
Yerevan Physics Institute S.Arutunian, VIBRATING WIRE SENSORS FOR BEAM INSTRUMENTATIONBIW 2008, Lake Tahoe, USA
material densitywire strainwire lengthmodulus of elasticity
500/ ≈σE

Single wire VWS (DESY, PETRA)
1- wire2- clips3, 4 – magnet poles5 – support6, 7 – fastening details

Oscillations excitation and frequency measurement unit
Yerevan Physics Institute S.Arutunian, VIBRATING WIRE SENSORS FOR BEAM INSTRUMENTATIONBIW 2008, Lake Tahoe, USA
Generator is assembled on the base of fast operational amplifier allows to maintain the generation just on the wire natural frequency resonance
Wire is included into positive feedback circuit
Electronic circuit test (I.Vasiniuk)

Frequency measurement algorithm
Time t1 – wire periods counting start
Time t2 – wire periods counting end
T_wire – wire oscillation periodT_q – quartz oscillation periodF_wire=F_q*N_wire/N_qt2-t1=gate in range 100 ms-30 s
0.163051500.1
Resolution, mHzgate, s
Measurement resolution at F_wire about 5000 Hz and F_q=1.0000 MHz

2 wires VWS long time run in laboratory environment
-0.15
-0.1
-0.05
0
0.05
0.1
0.15
0.2
0.25
0.3
0.35
06.10.2007 11:30 06.10.2007 17:30 06.10.2007 23:30 07.10.2007 5:30 07.10.2007 11:3029.86
29.88
29.9
29.92
29.94
29.96
29.98
30
30.02
30.04
30.06
dF_A(Hz)dF_B(Hz)T (°C)
Absolute deviations for24 hours:
dF_A0.03 Hz
dF_B0.02 Hz
T0.01 0C

10 wires VWS long time run in laboratory environment
0.008100.00690.00780.04770.00860.01350.01040.01030.03620.0171
10 wires VWM absolute deviations for 36 hours, Hz
-0.1
-0.08
-0.06
-0.04
-0.02
0
0.02
0.04
0.06
0.08
0.1
17.11.20070:00
17.11.20076:00
17.11.200712:00
17.11.200718:00
18.11.20070:00
18.11.20076:00
18.11.200712:00
Time
dF, H
z
dF_1dF_3dF_4dF_5dF_6dF_8dF_9dF_10
Thermostabilization at 30 0C with Platinum resistance thermometer

Frequencies resonant capture
3646
3648
3650
3652
3654
3656
3658
3660
3662
3664
3666
27.08.04 12:00 28.08.04 12:00 29.08.04 12:00 30.08.04 12:00 31.08.04 12:00Time
F, H
z
21
21.3
21.6
21.9
22.2
22.5
22.8
23.1
23.4
23.7
24
T_k
ty, 0
C
F1(Hz) F2(Hz) T(0C)
-0.005
-0.004
-0.003
-0.002
-0.001
0
0.001
0.002
0.003
0.004
0.005
27.08.2004 12:00 28.08.2004 12:00 29.08.2004 12:00 30.08.2004 12:00 31.08.2004 12:00
TimeF1
-F2,
Hz
-1
0
1
2
3
4
5
6
7
8
9
F1-F
2, H
z
1
2
Yerevan Physics Institute S.Arutunian, VIBRATING WIRE SENSORS FOR BEAM INSTRUMENTATIONBIW 2008, Lake Tahoe, USA
Each frequency was measured by separate electronic unit with proper quartz oscillator.Measurement gate 30 s ( resolution 1 mHz )

Multiwire sensor wires thermal coupling in air
0.2470.0900.051-0.019
0.0900.2650.101-0.029
0.0510.0990.283-0.050
-----
0.0190.0310.052-0.255
wire 5 wire 4 wire 3 wire 2 wire 1
0
0.2
0.4
0.6
0.8
1
1.2
0 0.5 1 1.5 2distance, mm
ratio
Yerevan Physics Institute S.Arutunian, VIBRATING WIRE SENSORS FOR BEAM INSTRUMENTATIONBIW 2008, Lake Tahoe, USA
VWS housing
VWS wires
Heat transfers
VWS wires were fed by aDC current (about 10 mA)
Wires overheatings when outermost wire was fed by DC current

Multiwire sensor wires thermal coupling in air
heat coupling equations
)52(25)42(24)32(23222)12(122 TTTTTTTTTQ −+−+−++−= ααααα
)53(35)43(34333)23(23)13(133 TTTTTTTTTQ −+−++−+−= ααααα
)54(45444)34(34)24(24)14(144 TTTTTTTTTQ −++−+−+−= ααααα
555)45(45)35(35)25(25)15(155 TTTTTTTTTQ ααααα +−+−+−+−=
)51(15)41(14)31(13)21(121111 TTTTTTTTTQ −+−+−+−+= ααααα
Yerevan Physics Institute S.Arutunian, VIBRATING WIRE SENSORS FOR BEAM INSTRUMENTATIONBIW 2008, Lake Tahoe, USA
iT wire with index i overheating
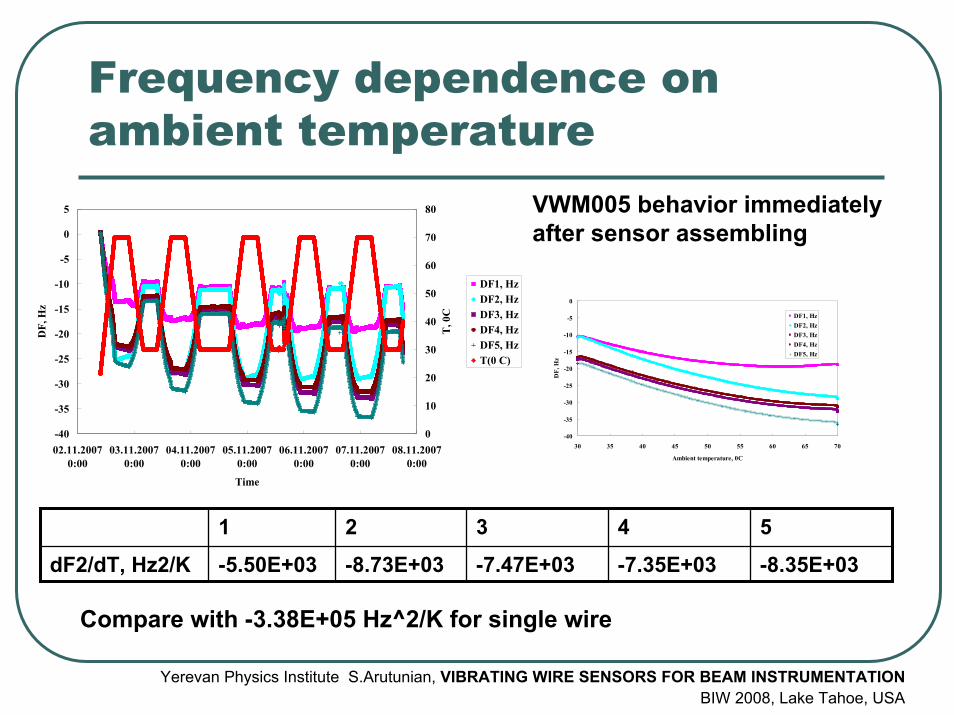
Frequency dependence on ambient temperature
-40
-35
-30
-25
-20
-15
-10
-5
0
5
02.11.20070:00
03.11.20070:00
04.11.20070:00
05.11.20070:00
06.11.20070:00
07.11.20070:00
08.11.20070:00
Time
DF,
Hz
0
10
20
30
40
50
60
70
80
T, 0
C
DF1, HzDF2, HzDF3, HzDF4, HzDF5, HzT(0 C)
-40
-35
-30
-25
-20
-15
-10
-5
0
30 35 40 45 50 55 60 65 70
Ambient temperature, 0C
DF,
Hz
DF1, HzDF2, HzDF3, HzDF4, HzDF5, Hz
-8.35E+03-7.35E+03 -7.47E+03 -8.73E+03 -5.50E+03 dF2/dT, Hz2/K
54321
Compare with -3.38E+05 Hz^2/K for single wire
Yerevan Physics Institute S.Arutunian, VIBRATING WIRE SENSORS FOR BEAM INSTRUMENTATIONBIW 2008, Lake Tahoe, USA
VWM005 behavior immediately after sensor assembling

Technical characteristics
0.151.80.2620.2response time, s-2.0-26.4-9.3-779.6DF/DQ, Hz/mW-8.8-8.8-40.2-40.2DF/DTmean, Hz/K at F0 = 4200 Hz0.233.00.2319.4DTmean/DQ, K/mW
TungstenAir
TungstenVacuum
A316Air
A316Vacuum
Material, conditions
Technical characteristics of 5 wire VWM in case of usage in air resolution of frequency measurement is 0.01 Hzmeasurement accuracy (1 hour) ± 0.01 Hz (± 0.00025 K)
(24 hour) ± 0.04 Hz (± 0.001 K )response time 0.26 sdeposited on the wire power ± 1 µW (1 hour) ± 4 µW (24 hour) Nonlinearity of the pickup in operational range 0-100 mW is 0.01 %
Yerevan Physics Institute S.Arutunian, VIBRATING WIRE SENSORS FOR BEAM INSTRUMENTATIONBIW 2008, Lake Tahoe, USA

Electron beam
Yerevan Physics Institute S.Arutunian, VIBRATING WIRE SENSORS FOR BEAM INSTRUMENTATIONBIW 2008, Lake Tahoe, USA
VWS installing in 50 MeVInjector of Yerevan Synchrotron(N.Dobrovolsky, M.Mailian)
VWM incut intovacuum chamber

Electron beam
-0,5
0,0
0,5
1,0
1,5
2,0
25 27 29 31 33 35 37
Wire horizontal position, mmB
eam
cur
rent
den
sity
in h
oriz
onta
l dire
ctio
n, n
A/m
m
Yerevan Physics Institute S.Arutunian, VIBRATING WIRE SENSORS FOR BEAM INSTRUMENTATIONBIW 2008, Lake Tahoe, USA
Scan of the electron beam at the Injector of Yerevan Synchrotron with an average current of about 10 nA (after collimation) and an electron energy of 50 MeV
VWS mounted on the vacuum below with 1 µm step motor feed

Proton beam
Yerevan Physics Institute S.Arutunian, VIBRATING WIRE SENSORS FOR BEAM INSTRUMENTATIONBIW 2008, Lake Tahoe, USA
VWS for PETRA experiment, one beryl bronze wire of diameter 90 µm
VWS installing into PETRA proton bypass(R.Boespflug, left and K.Wittenburg)
VWS mounted on tube with below and step motor

Proton beam
4870
4871
4872
4873
4874
4875
4876
4877
4878
4879
4880
21:59:00 22:01:00 22:03:00 22:05:00 22:07:00 22:09:00Time
Freq
uenc
y, H
z
0
10
20
30
40
50
VW
S po
sitio
n, m
m;
PM1
and
PM2
coun
tings
;B
eam
cur
rent
, mA
11
23
4
5
Yerevan Physics Institute S.Arutunian, VIBRATING WIRE SENSORS FOR BEAM INSTRUMENTATIONBIW 2008, Lake Tahoe, USA
PETRA proton beam parameters E=15 GeV, I=15 mA sigmax = 0.6 cm, sigmaz = 0.5 cm
1- VWS frequency, 2 – proton current, 3 – VWS position, 4,5 - scintillator-photomultiplierpickup signals (PM).Full scan – 20 mmPM1 began to increase beyond the position 9.3 mm,VWS – immediately

Ion beam
5125.50
5125.55
5125.60
5125.65
5125.70
5125.75
5125.80
5125.85
5125.90
5125.95
5126.00
5 7 9 11 13 15 17 19 21 23 25 27 29 31 33 35 37 39 41 43 45
Time, s
Freq
uenc
y, H
z
Yerevan Physics Institute S.Arutunian, VIBRATING WIRE SENSORS FOR BEAM INSTRUMENTATIONBIW 2008, Lake Tahoe, USA
Energo-mass-analyzer EMAL-2 a device with laser source of ions for mass-spectral analysis of solids. Fe ion beam with current about 1 nA and energy 20 keV passes through the gap with sizes 2 mm × 5.5 mm and fall on the wire
Approximately 16 pA of beam current interacted with the wire, frequency decrement about 0.15 Hz

Laser beam
Laser beam scan experiment layout. 1-Commbox measurement unit, 2 – measuring microscope, 3 – stepper motor feed system, 4 –stepper motor control board, 5 - laser, 6 - VWM
Yerevan Physics Institute S.Arutunian, VIBRATING WIRE SENSORS FOR BEAM INSTRUMENTATIONBIW 2008, Lake Tahoe, USA

Laser beam
4212.7
4212.8
4212.9
4213
4213.1
4213.2
4213.3
0 1 2 3 4 5 6 7 8Transverse coordinate, mm
Freq
uenc
y 1,
Hz
3975.4
3975.5
3975.6
3975.7
3975.8
3975.9
3976
Freq
uenc
y 2,
Hz
F2(Hz)F1(Hz)
Yerevan Physics Institute S.Arutunian, VIBRATING WIRE SENSORS FOR BEAM INSTRUMENTATIONBIW 2008, Lake Tahoe, USA
Sensitivity 20 Hz/K Frequency accuracy 0.01 HzTemperature resolution 5 ×1E-4 KLaser radiation power density resolution
in air 3×1E-6 W/mm^2
in vacuum 5×1E-8 W/mm^2

APS 2007
Beamline SBC-CAT-19-ID: Source Undulator AEnergy Range 6.5-19.5 keVFlux (photons/sec)1.4 x 10^13 @ 12 keV
VWS installing in vacuum test chamber of beamline(G.Rosenbaum)

APS 2007
Yerevan Physics Institute S.Arutunian, VIBRATING WIRE SENSORS FOR BEAM INSTRUMENTATIONBIW 2008, Lake Tahoe, USA
Alignment procedure to assure that both wires were symmetrically placed above and below the midplane with a clear line of sight to the source (G.Decker)
VWS mounted on the water-cooled plates
Beryllium filter

APS 2007
Yerevan Physics Institute S.Arutunian, VIBRATING WIRE SENSORS FOR BEAM INSTRUMENTATIONBIW 2008, Lake Tahoe, USA
Data collected at a 1-Hz sample rate during a scan of the particle beam’s vertical angle in range 100 microradians with 5 microradian steps
VWM data corrected for thermal drift and beam current decay
Plot of ∆TD shifted by 1.730 mm

APS 2007
Yerevan Physics Institute S.Arutunian, VIBRATING WIRE SENSORS FOR BEAM INSTRUMENTATIONBIW 2008, Lake Tahoe, USA
A very successful shift (G.Rosenbaum, M.Mailinan, S.Arutunian, G.Decker)
Total of 7 mm ofBeryllium was placed in the beam path, both to limit thepower striking the wires and to assure that only hard x-rayswere being detected
Incorporation of such a device into the design of water-cooled beamline apertures ( “smart aperture”, G.Decker ) is another interesting concept

APS 2008
Yerevan Physics Institute S.Arutunian, VIBRATING WIRE SENSORS FOR BEAM INSTRUMENTATIONBIW 2008, Lake Tahoe, USA
Five-wires VWM005 details:(1) sensor, (2) surface of the vertical plate, (3) rectangular window for synchrotron beam accept with VWM005 aperture, (4) number of the sensor, (5) numbers of the first and fifth wires, At one side of the sensor all wires are connected together (6), other wires are assembled in a harness (7). The wires are shifted along the line AA

APS 2008
Yerevan Physics Institute S.Arutunian, VIBRATING WIRE SENSORS FOR BEAM INSTRUMENTATIONBIW 2008, Lake Tahoe, USA
Main view of VWM005 mounting on the flange
VWM is mounted on the 6 inch flange

APS 2008
1.E-121.E-111.E-101.E-091.E-081.E-071.E-061.E-051.E-041.E-031.E-021.E-011.E+00
0.E+00 1.E+05 2.E+05 3.E+05 4.E+05 5.E+05 6.E+05
Photon Energy, eV
Nor
mal
ized
spec
tral
dis
trib
utio
n
Y Y_Cu Y_wire
Integral=1Integral=4.24E-3Integral=1.14E-5
P_initial=99.1 WNormalized spectral distribution of initial synchrotron radiation (Y), passed through the Cu flange (Y_Cu) and deposited into the wire (Y_wire). Spectral maximums for Y_Cu and Y_wire are about 100 keV

APS 2008
-0.6-0.4-0.20.00.20.40.60.81.01.21.41.6
24.01.2008 9:00 24.01.200815:00
24.01.200821:00
25.01.2008 3:00 25.01.2008 9:00
Time
DT
1, K
-0.2
0.0
0.2
0.4
0.6
13:30 14:00
VWM data dependence on the ambient T. Synchrotron radiation do not touch the wires of VWM. Data show the change of the flange temperature during APS operation

APS 2008
0
0.02
0.04
0.06
0.08
0.1
0.12
82 84 86 88 90 92 94 96
Time, min
Wir
es o
verh
eatin
g, K
d T_1d T_2d T_3d T_4d T_5
Yerevan Physics Institute S.Arutunian, VIBRATING WIRE SENSORS FOR BEAM INSTRUMENTATIONBIW 2008, Lake Tahoe, USA
Scan result presented by wire overheating temperatures.Electron beam was scanned vertically through a range of 300 microradians with 125 steps
VWM when the electron beam angle was scanned vertically through a range of 300 microradians with 125 stepsElectron beam scanned vertically from minus 350 to minus 650 microradian angle with 125 steps
Profiles asymmetries arise from mentioned above wires thermal coupling and some inequality placement of wires relative to sensor housing

APS 2008
-0.05
0
0.05
0.1
0.15
0.2
380 430 480 530 580
Steering angle, microrad
SR b
eam
pro
file,
arb
itrar
y un
its
Q1Q2Q3Q4Q5
0
0.02
0.04
0.06
0.08
0.1
0.12
0.14
0.16
0.18
-60 -50 -40 -30 -20 -10 0 10 20 30 40 50 60
Steering angle, microradSR
bea
m p
rofil
e, a
rbitr
ary
units
Yerevan Physics Institute S.Arutunian, VIBRATING WIRE SENSORS FOR BEAM INSTRUMENTATIONBIW 2008, Lake Tahoe, USA
United profile from all wires (curves are shifted according to value of maximum)
Using a statistical data treatment, the heat coupling coefficients were found and accordingly the profiles of the source were recovered

Discussion1. Vibrating wire sensors can be used for many types of beam
diagnostics because only a small amount of heat transfer from the measured object to wire is needed. VWS can be successfully applied to electron, proton, ion, photon and neutron beam monitoring
2. Special tasks: weak beam instrumentation, beam halo and tails monitoring
3. Property to measure very hard spectral component permits to separate the radiation from insertion devices and to cut unwanted contributions from other accelerator sources
4. Recent application of the VWS in air has allowed a dramatic reduction in response time, together with a reduction in system cost by a large factor
5. So called “smart aperture” concept (G.Decker)

Acknowlegments
Author is grateful to all his co-authors with whom he worked many years. Many thanks to the YerPhI, PETRA and APS ANL stuff for their friendly help during the experiments. Special thanks to R.Reetz and J.Bergoz for permanent interest and essential support