vibration analysis of 140,000m moss type … conferences/2007...vibration analysis of 140,000m3 moss...
TRANSCRIPT
Poster PO-14
PO-14.1
VIBRATION ANALYSIS OF 140,000M3 MOSS TYPE LNG CARRIER FOR THE SNØHVIT PROJECT
Taiji Maeda Section Chief, Structural Design Section
Jun Inuki Manager, Structural Design Section
Akihiko Fujii Deputy General Manager, Ship Hydrodynamic Section
Basic Design Department Mitsui Engineering and Shipbuilding Co., Ltd.
Tokyo, Japan (http://www.mes.co.jp)
Koyu Kimura Manager, Ship Performance Department
R&D Subdivision I, R&D Division Akishima Laboratories (Mitsui Zosen) Inc.
Akishima City, Tokyo, Japan (http://www.mes.co.jp/Akiken/index-j.html)
ABSTRACT
It is an important factor for the safe operation of LNG carriers, especially operated in harsh environment, to have a highly comfort accommodation space, so that the ship’s crew can take sufficient rest to concentrate in their work. For this purpose, minimizing vibration level is an essential factor. The subject LNG carrier is planned to be operated in harsh environment such as North Sea and North Atlantic Sea, and it is required by the Owner to obtain DNV notation COMF-V(1), which is the highest grade of comfort class with regard to noise and vibration.
In order to satisfy the severe vibration requirement, extensive study was carried out during the design stage in view of both hydrodynamics and structure.
In case of the steam turbine ship, the main source of vibration is propeller excitation forces. Therefore, it is important to select the most suitable number of blades of the propeller in view of vibration. At the first design stage, 3 types of propellers with 4, 5 and 6 blades, and the suitable superstructure corresponding to each blade were pre-designed and compared, in view of propeller excitation forces, vibration response and also the propulsive efficiency.
After the optimum combination of the number of propeller and the superstructure were decided, the more elaborate design of hull form and propeller were carried out, and it was confirmed by model test and calculation that propeller excitation forces were low enough.
Then, full ship finite element vibration analysis was carried out by correctly modeling the ship’s entire structure, cargo tank structure. As a result, it was confirmed that the vibration levels of accommodation area were within the allowable limit.
Finally, the results of the measurements of fluctuating pressure, vibration responses during sea trial are also presented, and show good agreement with predicted values.

Poster PO-14
PO-14.2
INTRODUCTION
It is an important factor for the safe operation of LNG carriers, especially operated in harsh environment, to have a highly comfort accommodation space, so that the ship’s crew can take sufficient rest to concentrate in their work. For this purpose, minimizing vibration level is an essential factor. The subject LNG carrier is planned to be operated in harsh environment such as North Sea and North Atlantic Sea, and it is required by the Owner to obtain DNV notation COMF-V(1), which is the highest grade of comfort class with regard to noise and vibration.
In order to satisfy the high level vibration criteria, extensive study was carried out in the design stage by the good collaboration of hydrodynamic design engineers and structural design engineers. This paper presents the procedure and the results of the study, together with the comparison of the analysis and the measurements during the sea trial.
OUTLINE OF THE VESSEL
The vessel is a Moss type LNG carrier with 4 spherical cargo tanks. Principal particulars of the vessel are as below.
• Length, overall Loa 289.50 m • Length P.P Lpp 277.00 m • Breadth(Mld.) Bmld. 48.40 m • Depth(Mld.) Dmld. 26.50 m • Design Draft (Mld.) d 11.30 m • Cargo Tank Capacity (98.5%full) 140,000 m3 • Maximum Continuous Rating (MCR) 27,000 kW x 81.0 rpm • Normal Service Rating (NSR) 24,300 kW x 78.2 rpm
VIBRATION CRITERIA
For 50% MCR to MCR, the lower value of ISO-6954:2000(E) shall be applied for overall frequency-weighted r.m.s values.
For normal service rating (NSR), the criteria of DNV COMF-V(1) as below shall be applied for the peak amplitude for single frequency component.
Table 1 Vibration Criteria of DNV COMF-V(1)
Poster PO-14
PO-14.3
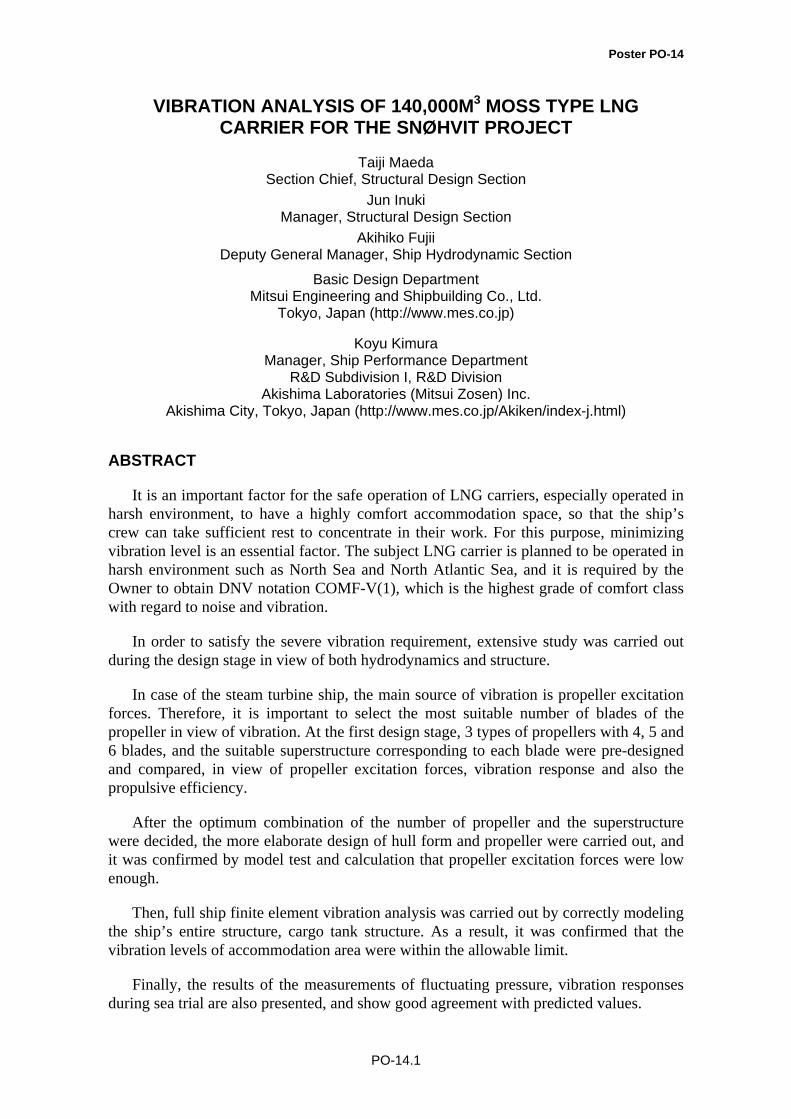
FLOW OF VIBRATION ANALYSIS
Flow chart of vibration analysis applied to the vessel is shown in Figure1.
Figure 1 Flow Chart of Vibration Analysis of the LNG Carrier
For this vessel, the above procedure was applied both in the early design stage when the number of propeller blade was selected, and the detail design stage when the final design of the propeller and the hull structure were designed.
SELECTION OF THE NUMBER OF BLADE
In case of the steam turbine ship, the main source of vibration is propeller excitation forces. Therefore, it is important to select the most suitable number of blades of the propeller in view of vibration.
At the very early design stage, 3 type of propellers with 4, 5 and 6 blades, and the suitable superstructure corresponding to each blade number were pre-designed and compared, in view of propeller excitation forces, vibration response and also the propulsive efficiency.
Wake Distribution
Initial Structural Drawings
3-D FEM model for Vibration Analysis
Free Vibration Analysis
Blade Frequency Natural Frequency
Design Alteration
Forced Vibration Analysis
Resonance?
Vibration Response OK?Criteria of Vibration level - ISO 6954:2000(E) - DNV COMF-V(1)
Final Drawings
-Surface Force -Bearing Force
No
Yes
Yes
No
Propeller Excitation Force Calculation
M/E revolutions Number of Blades
Hull Form
Tank Test Propeller Design
Cavitation Test
Pressure Fluctuation
Start

Poster PO-14
PO-14.4
Comparison of Propeller Excitation Forces
Table 2 and Figure 2 show the principal particulars and shapes of pre-designed 4, 5, 6 blade propellers. Propeller diameter was determined by considering the restriction of propeller-hull clearance. Other particulars were determined systematically in accordance with the same design concept.
Table 2 Principal Particulars of 3 Types of Propeller with 4, 5 and 6 blades
Number of Blades 4 5 6
Diameter(m) 9.40 9.10 9.10
Expanded area ratio 0.650 0.670 0.660
Pitch ratio 0.902 0.871 0.843
Skew angle(degree) 37.5 30 25
a) 4 blades b) 5 blades c) 6 blades
Figure 2 Comparison of 3 Types of Propellers with 4, 5 and 6 blades
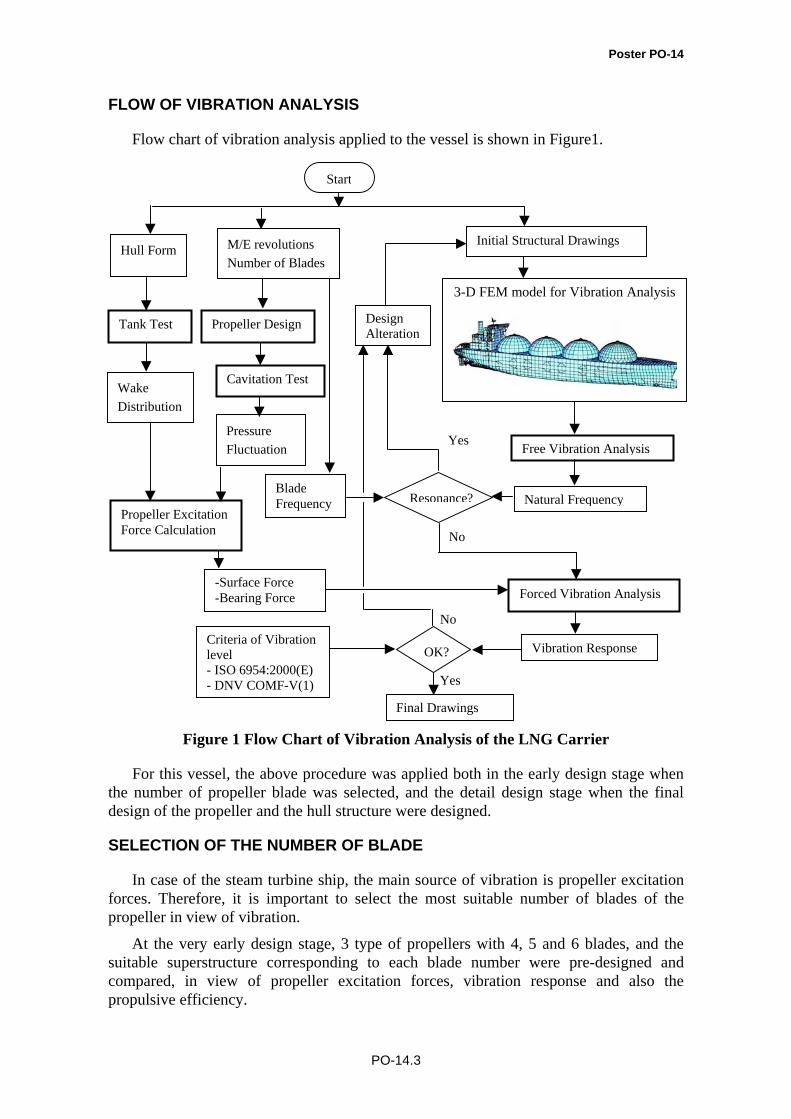
Figure 3 shows the comparison of the propeller excitation forces, and Figure 4 shows the coordinate system of exciting forces. The pressure fluctuation was estimated by the experimental formula obtained from our database. Bearing forces were estimated by our propeller performance program of Unsteady VLM (Vortex Lattice Method). It was observed that surface force became lower from 4 to 6 blades, and the bearing forces of 5 and 6 blade propellers were lower than 4 blade propeller.
F sx F sy F sz F x F y F z M y M z
4B L
5B L
6B L
Figure 3 Comparison of Propeller Excitation Forces of 4, 5, 6 Blade Propellers
(ton) or
(ton-m)
20
10
Poster PO-14
PO-14.5
FxFy
Fz
Mx My
Mz
θ
a) Surface Force b) Bearing Force
Figure 4 Coordinate System of Propeller Excitation Forces
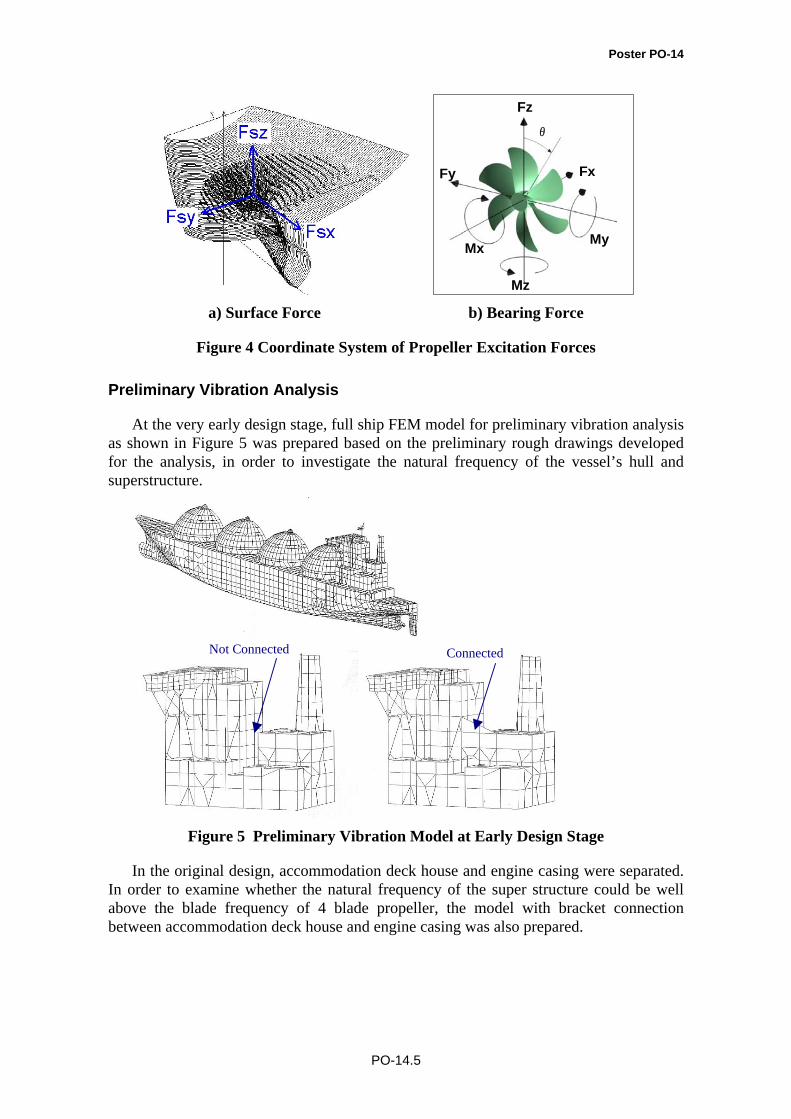
Preliminary Vibration Analysis
At the very early design stage, full ship FEM model for preliminary vibration analysis as shown in Figure 5 was prepared based on the preliminary rough drawings developed for the analysis, in order to investigate the natural frequency of the vessel’s hull and superstructure.
Figure 5 Preliminary Vibration Model at Early Design Stage
In the original design, accommodation deck house and engine casing were separated. In order to examine whether the natural frequency of the super structure could be well above the blade frequency of 4 blade propeller, the model with bracket connection between accommodation deck house and engine casing was also prepared.
ConnectedNot Connected

Poster PO-14
PO-14.6
Comparison of Possibility of Vibration Resonance
Figure 6 schematically shows the relation between blade frequency from 50% MCR to MCR and natural frequencies of longitudinal and horizontal vibration of the superstructure.
Figure 6 Comparison of the relations between blade frequency and the natural
frequency of the super structure for 4, 5, 6 blade propellers
In case of 4 blade propeller, it was found that the natural frequency of longitudinal vibration of superstructure was near the blade frequency in the normal operation range. If the accommodation deck house and the engine casing are connected by bracket, the natural frequency of longitudinal vibration becomes somewhat higher than the blade frequency at MCR. However, it was considered that the margin to avoid resonance was not sufficient taking account of the accuracy of the preliminary vibration analysis.
In case of 5 blade propeller, it was found that it was difficult to avoid resonance in the normal operation range.
In case of 6 blade propeller, it was found that the natural frequency of longitudinal vibration was well below the normal operation range, and that of horizontal vibration was sufficiently higher than normal operation range.
In view of speed performance, it was found that comparative performances could be obtained for 4, 5 and 6 blade propeller, when optimum design for each propeller was applied.
<6 blade>
4 5 6 7 8 9 10 11(Hz)
LongitudinalVibration
HorizontalVibration
50%M C R M C RNSR
<5 blade>
4 5 6 7 8 9 10 11(Hz)
LongitudinalVibration
HorizontalVibration
50%M C R M C RNSR
<4 blade>
4 5 6 7 8 9 10 11(Hz)
LongitudinalVibration
HorizontalVibration
50%M C R M C RNSR
LongitudinalVibration(Accom m odationand E/C asing areconnected)
Poster PO-14
PO-14.7
Therefore, it was determined that the 6 blade propeller was the most suitable in view of vibration, both for avoiding resonance, smaller excitation forces and sufficient speed performance.
DESIGN OF HULL FORM
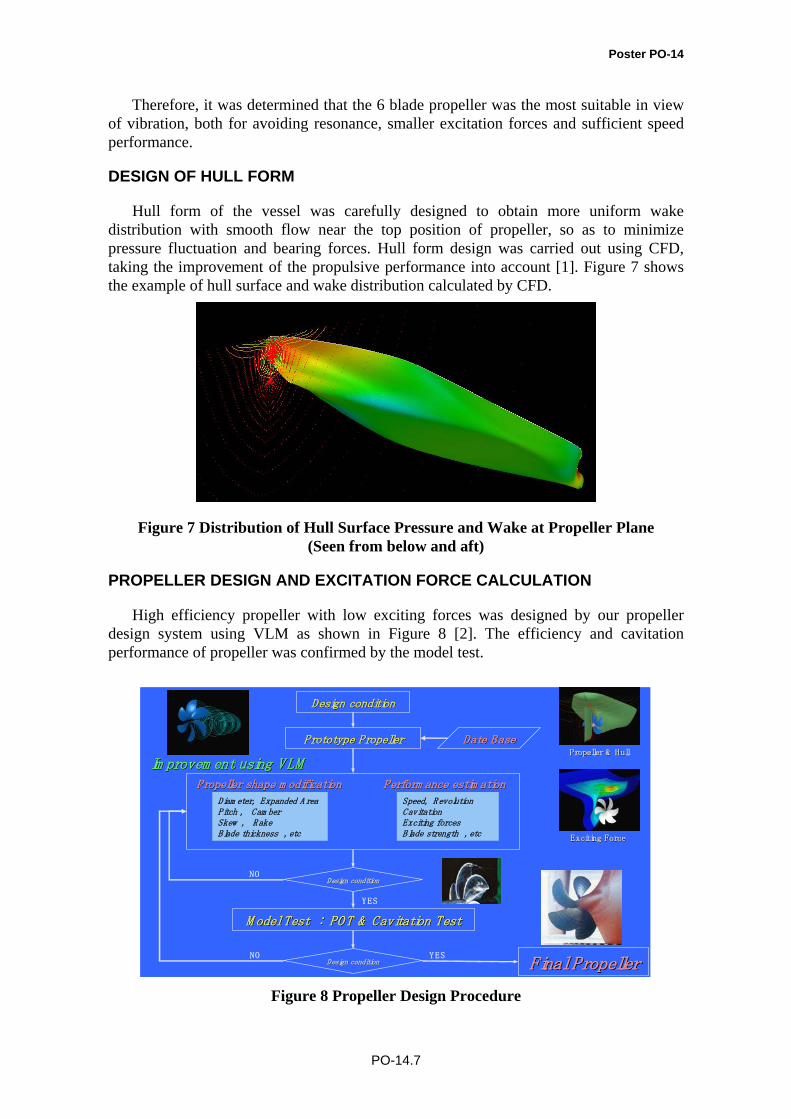
Hull form of the vessel was carefully designed to obtain more uniform wake distribution with smooth flow near the top position of propeller, so as to minimize pressure fluctuation and bearing forces. Hull form design was carried out using CFD, taking the improvement of the propulsive performance into account [1]. Figure 7 shows the example of hull surface and wake distribution calculated by CFD.
Figure 7 Distribution of Hull Surface Pressure and Wake at Propeller Plane (Seen from below and aft)
PROPELLER DESIGN AND EXCITATION FORCE CALCULATION
High efficiency propeller with low exciting forces was designed by our propeller design system using VLM as shown in Figure 8 [2]. The efficiency and cavitation performance of propeller was confirmed by the model test.
Design conditionDesign condition
Design conditionDesign condition
Design conditionDesign condition
Prototype PropellerPrototype Propeller
Propeller shape m odificationPropeller shape m odification Perform ance estim ationPerform ance estim ation
M odel Test : POT & Cavitation TestM odel Test : POT & Cavitation Test
Date BaseDate Base
Final PropellerFinal Propeller
Im provem ent using VLMIm provem ent using VLM
Exciting ForceExciting Force
Propeller & HullPropeller & Hull
YES
YESNO
NO
Diam eter, Expanded A reaPitch , Cam berSkew , RakeBlade thickness , etc
Speed, RevolutionCavitationExciting forcesBlade strength , etc
Figure 8 Propeller Design Procedure

Poster PO-14
PO-14.8
The cavitation test was carried out in the cavitation tunnel in our laboratory and only a small cavitation was observed, as shown in the Photo.1.
Photo. 1 Apparatus of Cavitaion Test and Observed Cavitation
Figure 9 shows the distribution of pressure fluctuation on hull surface estimated from results of cavitation test. The surface forces were predicted by integrating these pressure fluctuations.
Figure 9 Distribution of Pressure Fluctuation on Hull surface
Propulsion performance test (Photo.2) also was performed in our laboratory and confirmed that the final hull form and propeller satisfied the contract speed.
Photo. 2 View of Model Test in Akishima Laboratory

Poster PO-14
PO-14.9
VIBRATION ANALYSIS IN THE DETAIL DESIGN STAGE
In the detail design stage, more elaborate FEM model for the final vibration analysis as shown in Figure 10 was prepared based on the fully developed structural drawings, in order to confirm that the predicted vibration levels are below the allowable limit.
Figure 10 FEM Model for Final Vibration Analysis
Both sides of the hull structures including spherical cargo tanks were modeled. The used program is MSC/NASTRAN.
In order to make accurate estimation of the vibration response for propeller excitation forces, structures around stern tube, propeller shaft, thrust blocks were carefully modeled.
As representative load conditions, both normal ballast condition and full load condition were examined.
Free Vibration Analysis
At first, free vibration analysis was carried out to investigate the natural frequency of hull and the superstructure.
Typical modes of hull girder vibration in normal ballast condition are shown in Figure 11.

Poster PO-14
PO-14.10
Figure 11 Natural Mode of Hull Girder Vibration
Typical modes of the longitudinal and transverse vibration of the superstructure are shown in Figure 12.
Figure 12 Natural Mode of Superstructure
As a result, it was confirmed that estimated natural frequencies of the superstructure were outside the normal operation range as expected in the early design stage.
2-node vertical vibration mode 0.67Hz (Full Load)
0.74Hz (Normal Ballast)
1-node torsional vibration mode0.92Hz (Full Load)
0.99Hz (Normal Ballast)
2-node horizontal vibration mode 1.18Hz (Full Load)
1.35Hz (Normal Ballast)
3-node vertical vibration mode1.32Hz (Full Load)
1.45Hz (Normal Ballast)
4-node vertical vibration mode 1.90Hz (Full Load)
2.18Hz (Normal Ballast)
Longitudinal Vibration 5.03Hz (Full Load)
5.17Hz (Normal Ballast)
Torsional/Athwartship Vibration9.24Hz (Full Load)
9.49Hz (Normal Ballast)
Poster PO-14
PO-14.11
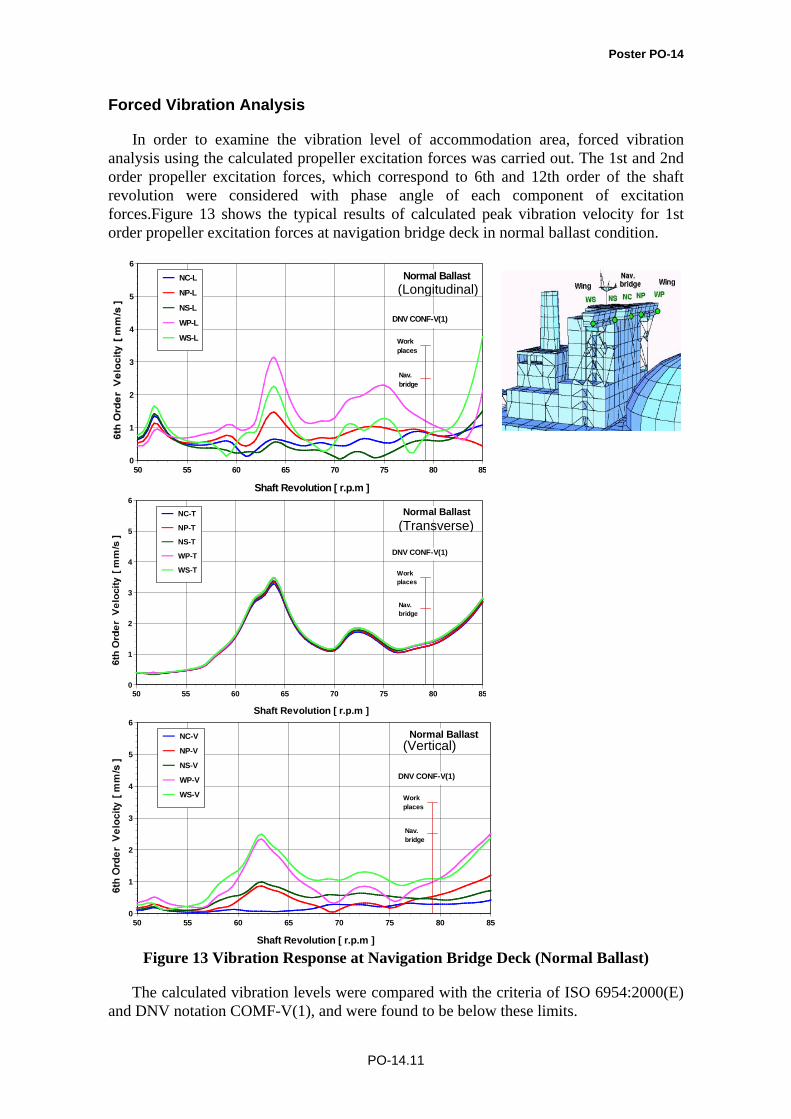
Forced Vibration Analysis
In order to examine the vibration level of accommodation area, forced vibration analysis using the calculated propeller excitation forces was carried out. The 1st and 2nd order propeller excitation forces, which correspond to 6th and 12th order of the shaft revolution were considered with phase angle of each component of excitation forces.Figure 13 shows the typical results of calculated peak vibration velocity for 1st order propeller excitation forces at navigation bridge deck in normal ballast condition.
Figure 13 Vibration Response at Navigation Bridge Deck (Normal Ballast)
The calculated vibration levels were compared with the criteria of ISO 6954:2000(E) and DNV notation COMF-V(1), and were found to be below these limits.
Shaft Revolution [ r.p.m ]
0
1
2
3
4
5
6
50 55 60 65 70 75 80 85
NC-L
NP-L
NS-L
WP-L
WS-L
DNV CONF-V(1)
Workplaces
Normal Ballast
Nav.bridge
(Longitudinal)
Shaft Revolution [ r.p.m ]
0
1
2
3
4
5
6
50 55 60 65 70 75 80 85
NC-T
NP-T
NS-T
WP-T
WS-T
DNV CONF-V(1)
Workplaces
Normal Ballast
Nav.bridge
(Transverse)
Shaft Revolution [ r.p.m ]
0
1
2
3
4
5
6
50 55 60 65 70 75 80 85
NC-V
NP-V
NS-V
WP-V
WS-V
DNV CONF-V(1)
Workplaces
Normal Ballast
Nav.bridge
(Vertical)
Poster PO-14
PO-14.12
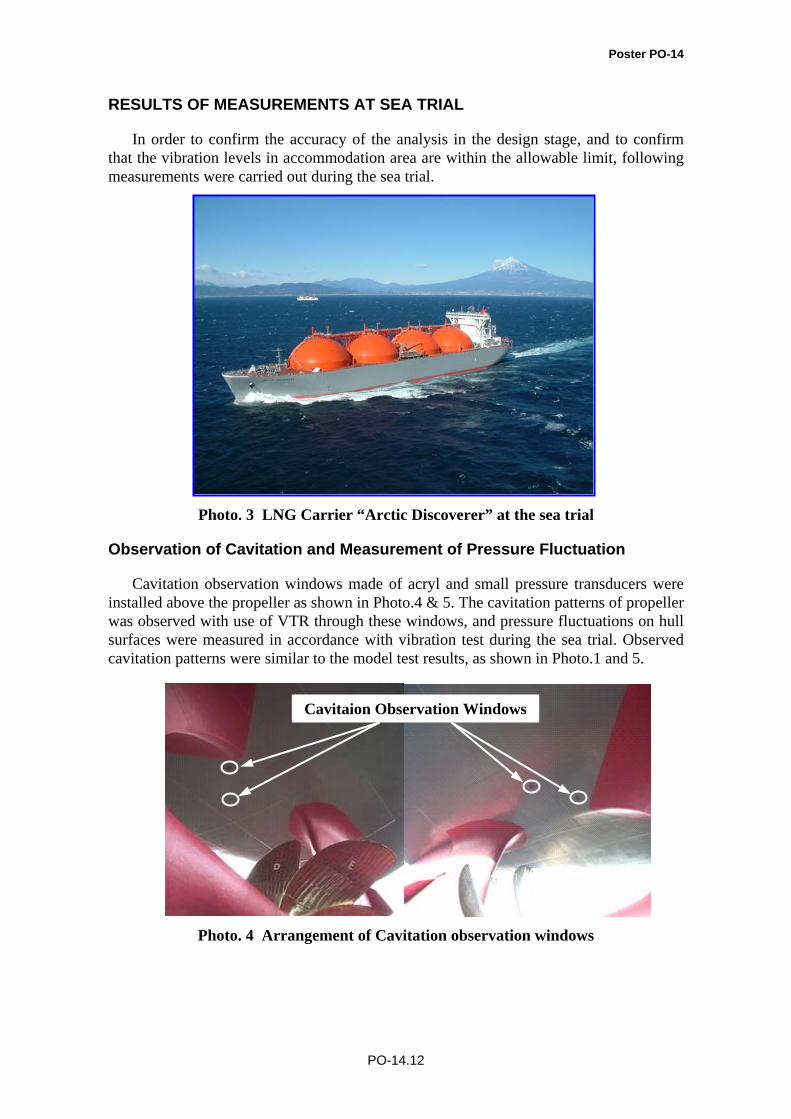
RESULTS OF MEASUREMENTS AT SEA TRIAL
In order to confirm the accuracy of the analysis in the design stage, and to confirm that the vibration levels in accommodation area are within the allowable limit, following measurements were carried out during the sea trial.
Photo. 3 LNG Carrier “Arctic Discoverer” at the sea trial
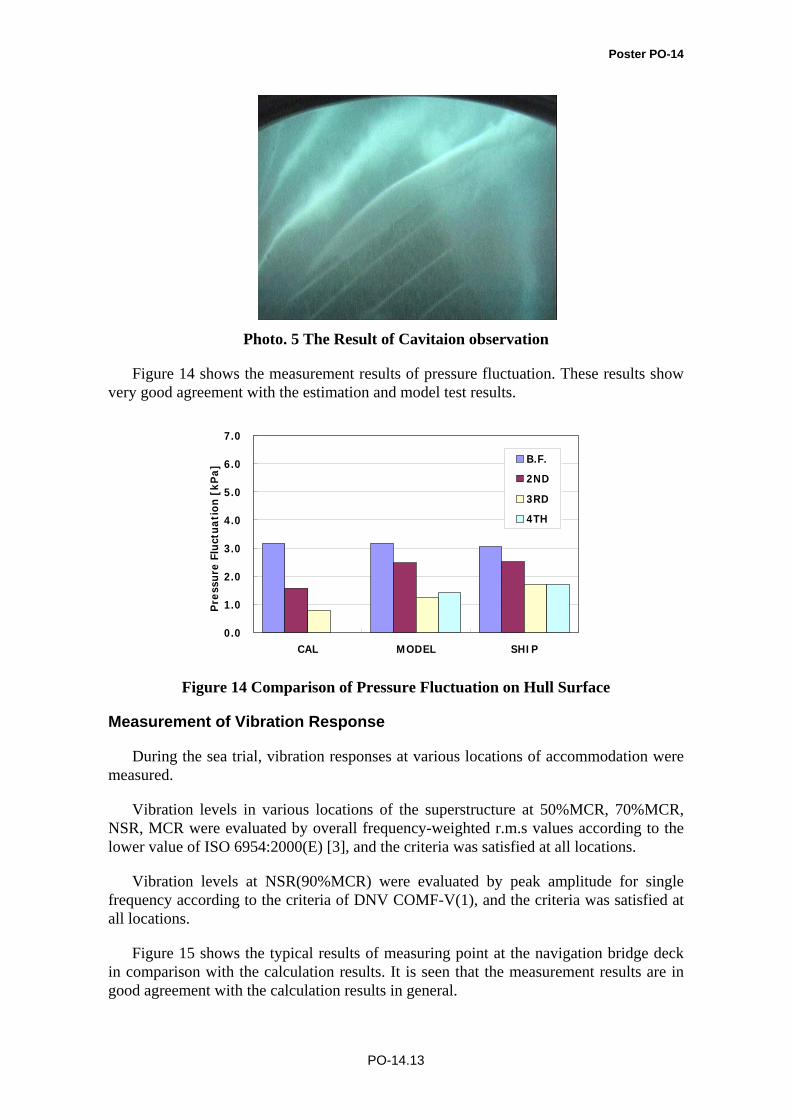
Observation of Cavitation and Measurement of Pressure Fluctuation
Cavitation observation windows made of acryl and small pressure transducers were installed above the propeller as shown in Photo.4 & 5. The cavitation patterns of propeller was observed with use of VTR through these windows, and pressure fluctuations on hull surfaces were measured in accordance with vibration test during the sea trial. Observed cavitation patterns were similar to the model test results, as shown in Photo.1 and 5.
Photo. 4 Arrangement of Cavitation observation windows
Cavitaion Observation Windows
Poster PO-14
PO-14.13
Photo. 5 The Result of Cavitaion observation
Figure 14 shows the measurement results of pressure fluctuation. These results show very good agreement with the estimation and model test results.
0.0
1.0
2.0
3.0
4.0
5.0
6.0
7.0
CAL MODEL SHIP
Pre
ssur
e Fl
uctu
atio
n [k
Pa]
B.F.
2ND
3RD
4TH
Figure 14 Comparison of Pressure Fluctuation on Hull Surface
Measurement of Vibration Response
During the sea trial, vibration responses at various locations of accommodation were measured.
Vibration levels in various locations of the superstructure at 50%MCR, 70%MCR, NSR, MCR were evaluated by overall frequency-weighted r.m.s values according to the lower value of ISO 6954:2000(E) [3], and the criteria was satisfied at all locations.
Vibration levels at NSR(90%MCR) were evaluated by peak amplitude for single frequency according to the criteria of DNV COMF-V(1), and the criteria was satisfied at all locations.
Figure 15 shows the typical results of measuring point at the navigation bridge deck in comparison with the calculation results. It is seen that the measurement results are in good agreement with the calculation results in general.

Poster PO-14
PO-14.14
Figure 15 The Results of Vibration Measurement
*) Shaft revolution during sea trial was somewhat higher than the design revolution because of the revolution margin.
CONCLUSION
In this report, the procedure and the results of the vibration analysis of the LNG carrier during the design stage were described. The key factors for the successful results are as follows.
• Thorough investigations from the early design stage to the detail design stage were made.
• Good collaboration of hydrodynamic design engineers and structural design engineers was established.
• Improved analysis methods based on the accumulated experiences for previous LNG carriers were applied.
As a result, it was confirmed by the measurements during the sea trial that the vibration levels were sufficiently lower than the specified criteria, and also in good agreement with the results of the analysis.
REFERENCES CITED
[1] Fujii A., et al. (2005) Application of hull form design system using CFD. Proceedings of the International Conference on Marine Research and Transportation, ICMRT05, Italy
[2] Kimura K., et al. (2006) Development of Low-Excitation and High-Efficiency Propeller Design System, Mitsui Zosen Technical Review, No.189, pp.25-30
[3] Toyama, Y., et. al, (2003) Analysis and Evaluation of Vibrations in Superstructure of Ships Based on New ISO6954, Proceedings of The Thirteenth(2003) International Offshore and Polar Engineering Conference, USA