vibration characteristics of walls and a plate glass ... · i tech library kafb, nm nasa technical...
TRANSCRIPT

NASA Technical Paper 1447
Vibration of Walls
Cha and
.racteristics a Plate GI ass
Window Representative of Those of a Wood-Frame House
Huey D. Carden
MAY 1979
NASA
NASA TP 1447 c. 1
https://ntrs.nasa.gov/search.jsp?R=19790016201 2018-09-16T16:30:13+00:00Z

I TECH LIBRARY KAFB, NM
NASA Technical Paper 1447
Vibration Characteristics of Walls and a Plate Glass Window Representative of Those of a Wood-Frame House
Huey D. Carden Langley Research Ceriter Humpton, Virginia
NASA National Aeronautics and Space Administration
Scientific and Technical Information Office
1979

SUMMARY
Exper h e n t s were conducted to determine v i b r a t i o n c h a r a c t e r istics o f s t r u c t u r a l components r e p r e s e n t a t i v e of wood-frame house c o n s t r u c t i o n us ing v a r i o u s face s h e e t materials. The components were a v e r t i c a l s e c t i o n and a h o r i z o n t a l s e c t i o n from a typical w a l l , a complete w a l l s e c t i o n , and a plate glass window. Mechanical e x c i t a t i o n w a s used, and measurements of a c c e l e r a t i o n response, n a t u r a l f r e q u e n c i e s , and noda l p a t t e r n s were performed.
R e s u l t s i n d i c a t e t h a t t h e w a l l s e c t i o n s and t h e complete w a l l d i d not act as a u n i t i n responding to s i n u s o i d a l v i b r a t i o n inpu t s . Ca lcu la t ed f r equenc ie s of t h e components t h a t account f o r t h i s independent behavior of t h e s t u d s and face s h e e t s agreed reasonably w e l l w i th exper imenta l f r equenc ie s . Experimental v i b r a t i o n s of t h e plate g l a s s window agreed wi th c a l c u l a t e d behavior , and responses of t h e window exposed to a i r p l a n e f lyove r no i se were r e a d i l y corre- lated wi th t h e test r e s u l t s .
INTRODUCTION
Langley Research Center has for s e v e r a l y e a r s been a c t i v e l y engaged i n r e s e a r c h on n o i s e problems associated wi th a i r c r a f t o p e r a t i o n s and sonic-boom phenomena. (See refs. 1 and 2.) I n view of concern about a i r c r a f t noise- induced v i b r a t i o n s and i n t e r n a l n o i s e o f r e s i d e n t i a l s t r u c t u r e s and t h e related comfort of r e s i d e n t i a l occupants , exper iments were undertaken to o b t a i n t h e v i b r a t i o n a l c h a r a c t e r i s t i c s of house s t r u c t u r e s . (See r e f . 3 . ) I n t h i s s tudy response properties of house components were determined and t h e i r responses t o a i r p l a n e no i se e x c i t a t i o n were eva lua ted . More r e c e n t concern over supe r son ic a i r p l a n e (Concorde) o p e r a t i o n s ( r e f . 4 ) i n t h i s coun t ry has l e d to s t u d i e s to measure b u i l d i n g v i b r a t i o n s induced by Concorde n o i s e f o r both h i s t o r i c a l and r e s i d e n t i a l s t r u c t u r e s . (See r e f s . 5 to 9.)
To provide a d d i t i o n a l d e t a i l e d data on t h e v i b r a t i o n c h a r a c t e r i s t i c s of house s t r u c t u r e s , exper iments were conducted on s e c t i o n s of typical s t r u c t u r a l w a l l p a n e l s , a complete w a l l s e c t i o n , and a plate glass window. The purpose of t h i s report is to document t h e r e s u l t s of t h e s e experiments . These d a t a are be l i eved to be o f g e n e r a l importance i n unders tanding and d e a l i n g wi th v ibra- t i o n s of house s t r u c t u r e s r e s u l t i n g from a i r p l a n e noise and sonic-boom exposure. Experimental d a t a p re sen ted inc lude a c c e l e r a t i o n response spectra, n a t u r a l f r e - quencies , and nodal p a t t e r n s f o r t h e s t r u c t u r a l s e c t i o n s or components r e s u l t i n g from s i n u s o i d a l force i n p u t s . Comparisons of exper imenta l f r e q u e n c i e s wi th com- puted f r e q u e n c i e s are also p resen ted .
use of t r a d e names or names of manufac turers i n t h i s report does n o t con- s t i t u t e an o f f i c i a l endorsement of such p roduc t s or manufac turers , e i t h e r expressed or implied, by the N a t i o n a l Aeronau t i c s and Space Adminis t ra t ion .

APPARATUS AND TEST PROCEDURE
W a l l S e c t i o n s
I n t h e e x p e r i m e n t a l s t u d i e s of t h e present report, two types of symmetric- face w a l l s e c t i o n s us ing r e p r e s e n t a t i v e r e s i d e n t i a l w a l l f a c i n g materials were used; one r e p r e s e n t e d a f u l l - s i z e ver t ica l s e c t i o n of a complete r e s i d e n t i a l w a l l , and t h e o t h e r r e p r e s e n t e d a f u l l - s i z e h o r i z o n t a l section of a w a l l . Four specimens of each section type were c o n s t r u c t e d , each having a d i f f e r e n t facing material. T y p i c a l r e s i d e n t i a l w a l l sections used i n t h e s e v i b r a t i o n s t u d i e s are i l l u s t r a t e d i n f igure 1 .
Detai ls of t h e v e r t i c a l w a l l s e c t i o n s are shown i n f i g u r e s 2(a) and 2 ( b ) . These sections were 243.84 c m (96 i n . ) h igh and 40.64 c m (1 6 i n . ) wide. One- h a l f of a s t a n d a r d two-by-four f i r s t u d w a s used on each s i d e and t w o f u l l sec- t i o n s of s t u d s were used as t h e top and bottom of t h e w a l l section frame. (See f ig . 2 ( a ) . ) The s e c t i o n w i t h face s h e e t s is shown i n f i g u r e 2 ( b ) .
The h o r i z o n t a l w a l l s e c t i o n d e t a i l s are i l l u s t r a t e d i n f i g u r e 2 ( c ) . Each s e c t i o n w a s "207.01 c m (81-1/2 i n . ) wide and 40.64 c m (16 i n . ) h igh w i t h seg- ments of v e r t i c a l two-by-four s t u d s l o c a t e d 40.64 c m (16 i n . ) on-center. Face s h e e t s were n a i l e d to t h e f i r s t u d s as done i n typic41 house c o n s t r u c t i o n .
Facing materials were e i t h e r 1.27-cm (1/2-in.) s h e e t r o c k , 1.27-cm (1 /2-in.) plywood, 1 .98-cm (25/32-in. ) Gyp-lap1 s h e a t h i n g , or 0.953-cm (3/8-in.) plaster on 0.953-cm (3/8-in.) gypsum l a t h e . Standard c o n s t r u c t i o n n a i l i n g was used i n t h e f a b r i c a t i o n of t h e w a l l s e c t i o n . Table I g i v e s t h e mass and surface d e n s i t y of each s e c t i o n . Sur face d e n s i t y w a s c a l c u l a t e d on t h e assumption t h a t a l l material is d i s t r i b u t e d uniformly over t h e cross s e c t i o n .
I n a d d i t i o n to t h e w a l l s e c t i o n models, f o u r subelement samples of t h e two-by-four s t u d s and t h r e e samples of each of t h e f a c i n g materials were t e s t e d to determine t h e material modulus of e l a s t i c i t y . F u l l d e t a i l s and r e s u l t s of t h i s phase of t h e s t u d y are p r e s e n t e d i n t h e appendix.
Complete W a l l and P l a t e Glass Window
A d d i t i o n a l s t u d i e s were also conducted to determine t h e response charac- teristics of a complete w a l l and a plate g l a s s window. The complete w a l l or t h e plate g l a s s window was mounted for t e s t i n g i n t h e open s i d e of a 3.96- by 2.44- by 2.44-m (13- by 8- by 8 - f t ) s t r u c t u r a l s teel c u b i c l e , which was b u i l t to i n s u r e h igh s t i f f n e s s of t h r e e walls, t h e top, and t h e bottom. The c u b i c l e is shown i n f i g u r e 3 w i t h t h e window i n place.
The 2.44- by 3.66-m (8- by 1 2 - f t ) test w a l l , c o n s t r u c t e d to f i t t h e open s i d e of t h e s t r u c t u r a l steel c u b i c l e , w a s b u i l t u s i n g two-by-four p i n e s t u d s , 40.62 c m (16 i n . ) on-center wi th 1.27-cm (1/2-in.) t h i c k shee t rock on t h e
lGyp-lap: Trade name of United S t a t e s G y p s u m Co.
2

inter ior s u r f a c e and 1.98-cm (0.781-in.) t h i c k p i n e board shea th ing on t h e exterior s u r f a c e . The p i n e s h e a t h i n g w a s placed d i a g o n a l l y on t h e s t u d s and n a i l e d a t each s t u d i n t e r f a c e and o v e r l a i d wi th 20.32-cm (8-in.) h o r i z o n t a l l y o r i e n t e d redwood s i d i n g . Ske tch (a) shows t h e d e t a i l s of t h e w a l l c o n s t r u c t i o n . T o t a l mass of t h e w a l l w a s 321 .14 kg (708 lbm) wi th a s u r f a c e d e n s i t y (assuming uniformly d i s t r i b u t e d material) of 36.00 kg/m2 (0.229 s l u g / f t 2 ) .
(1/3 in.)
Redwood siding
1.27 X 20.32 cm_/ (1/2 X 8 in.) Redwood siding \1.27 cm
(1/2 in.) Sheetrock
/ 1 Two-by-four Pine stud
L1.905 cm (3/4 in.) Pine sheathing
Sketch (a)
The plate g l a s s window, shown i n f i g u r e 3, w a s approximate ly 3.12 m (10-1/4 f t ) wide, 1.93 m (6-1/3 f t ) h igh , and 0 . 6 3 5 c m (1 /4 i n . ) t h i c k and was suppor ted as one w a l l o f t h e s t r u c t u r a l s tee l test c u b i c l e . The frame of t h e g l a s s window w a s aluminum channe l w i t h typical c l i p s u p p o r t s around t h e p e r i m - eter of t h e glass. The window w a s i n s t a l l e d i n a special frame which w a s mounted on t h e test c u b i c l e for tests.
I n s t r u m e n t a t i o n and T e s t Methods
For simplicity of t e s t i n g and to avoid p o s s i b l e boundary c o n d i t i o n prob- l e m s , t h e w a l l sections were suspended wi th free-free boundar ies on c a b l e s i n series wi th s p r i n g s to give a sof t suspension. (See f i g . 4 . ) Both t h e com- plete w a l l and t h e window were clamped a long t h e i r edges as shown i n f i g u r e 3. A permanent magnet shake r , c a p a b l e of a maximum vec to r force of 111 N (25 l b f ) , w a s used to e x c i t e a l l test specimens. The shaker was a t t a c h e d to t h e speci-
3
I

mens wi th a vacuum plate a t tachment i n series wi th a f o r c e gage. The shaker w a s c o n t r o l l e d by a sweep oscillator o p e r a t i n g through a power amplifier. The f o r c e o u t p u t of t h e shaker w a s measured wi th t h e f o r c e gage and used as a s e r v o s i g n a l to t h e sweep oscillator to ma in ta in a c o n s t a n t i n p u t f o r c e ampl i tude wi th frequency. A c r y s t a l accelerometer was placed a t s e l e c t e d l o c a t i o n s on t h e test specimens to de termine t h e v i b r a t o r y response. The o u t p u t of t h e accelerometer was recorded a g a i n s t f requency on a calibrated x-y plat ter . The a c c e l e r a t i o n o u t p u t , i n con junc t ion w i t h t h e i n p u t s i g n a l , w a s used to o b t a i n a L i s s a j o u s f i g u r e on an oscilloscope to de termine a d e s i r e d r e sonan t cond i t ion . A handheld v e l o c i t y probe w a s then used to su rvey t h e v i b r a t i n g h o r i z o n t a l w a l l s e c t i o n s , t h e complete w a l l , and t h e window to determine node l i n e s f o r d e f i n i n g mode shapes. As shown i n f i g u r e 4(a) , t h e v e r t i c a l w a l l s e c t i o n s were suspended to p e r m i t f i n e sand to be s p r i n k l e d over t h e f a c e s h e e t s . During v i b r a t i o n s a t a n a t u r a l f requency , t h e sand collected a t nodal l o c a t i o n s and de f ined t h e nodal p a t t e r n s .
ANALYSIS
N a t u r a l f r e q u e n c i e s of t h e w a l l s e c t i o n s were computed f o r c o r r e l a t i o n wi th t h e expe r imen ta l da t a . Determina t ions of t h e f l e x u r a l s t i f f n e s s of t h e s e c t i o n s f o r t h e s e c a l c u l a t i o n s were guided by particular exper imenta l behavior observed on t h e v e r t i c a l and h o r i z o n t a l w a l l s e c t i o n s , as described i n t h e sub- sequent s e c t i o n s .
Vertical W a l l S e c t i o n s
Based upon expe r imen ta l o b s e r v a t i o n s , t h e assumption w a s made t h a t t h e n a i l s through t h e f a c e m a t e r i a l i n t o t h e s tuds o f f e r e d l i t t l e or no r e s i s t a n c e i n p reven t ing t h e f a c e s h e e t s from s l i d i n g over t h e s t u d s . Th i s assumption l e a d s to t h e (exaggera ted) behavior i l l u s t r a t e d i n s k e t c h (b ) . Each p a r t o f
Face sheet r I
/-
Sketch (b)
t h e v e r t i c a l wa l l s e c t i o n is s h e a r i n g r e l a t i v e to o t h e r p a r t s and t h e r e f o r e is bending about i ts own n e u t r a l a x i s . Thus, t h e w a l l s e c t i o n f l e x u r a l s t i f f n e s s Dy f o r t h i s s i t u a t i o n is
r 1
4

or Dy = Dstud + 2Dface
where (from ske tch (c))
b width of f a c e s h e e t
bl t h i c k n e s s of s i d e s t u d s
h t h i c k n e s s of f a c e s h e e t
-.
hl h e i g h t of s i d e s t u d Sketch (c)
and
Ds tud f l e x u r a l s t i f f n e s s of s t u d
Df ace
Es tud
f l e x u r a l s t i f f n e s s of f a c e
modulus of e l a s t i c i t y of s i d e s t u d
Ef ace
To compute t h e beamlike v i b r a t i o n f r e q u e n c i e s of t h e v e r t i c a l wa l l s e c t i o n s , equa t ion (1) was used as t h e s e c t i o n s t i f f n e s s .
modulus of e l a s t i c i t y of face s h e e t
H o r i z o n t a l Wall S e c t i o n s
To determine t h e f l e x u r a l s t i f f n e s s Dx of t he h o r i z o n t a l s e c t i o n s , a c a n t i l e v e r beam approach w a s used. One bay of t h e wa l l s e c t i o n w a s assumed to be c a n t i l e v e r e d a s shown i n s k e t c h (a) . The f a c e s h e e t s were assumed to
I P r E f a c e face’ face
Sketch (d )
be pinned to t h e s t u d s , s ince du r ing v i b r a t i o n tests t h e n a i l s and f a c e s h e e t s seemed to be e f f e c t i v e l y a c t i n g i n t h i s manner. Thus t h e d e f l e c t i o n equa t ion f o r t h e e q u i v a l e n t c a n t i l e v e r beam model ( s k e t c h ( a ) ) of t h e h o r i z o n t a l bay
5
I

, r ea r r anged and d i v i d e d by t h e element width b, g i v e s (P/2) Q 3
3 ( Ef ac e1 f ac e) 6 =
E f a c e I f a c e p Q3
b 6 3b = - - 2
where I s t u d and Iface are t h e s e c t i o n moments of i n e r t i a and p d e n o t e s t h e force or load. However ,
Efacelface Eh3 = - - - Dx,face b 12
Thus ,
(3)
(4)
which i n d i c a t e s t h a t t h e e q u i v a l e n t f l e x u r a l s t i f f n e s s DXIeq of t h e h o r i z o n t a l w a l l s e c t i o n is simply twice t h e f l e x u r a l s t i f f n e s s of t h e face s h e e t s . To com- p u t e t h e f r e q u e n c i e s of t h e h o r i z o n t a l w a l l s e c t i o n s , e q u a t i o n ( 4 ) w a s used as t h e s e c t i o n s t i f f n e s s .
RESULTS AND DISCUSSION
R e s u l t s of v i b r a t i o n t es t s performed w i t h t h e v e r t i c a l and h o r i z o n t a l w a l l s e c t i o n s , t h e ccnnplete w a l l , and t h e p la te g lass window are p r e s e n t e d i n f i g - u r e s 5 to 13. R e s u l t s i n c l u d e ( 1 ) f o r c e d r e sponse f o r constant-ampli tude v i b r a t o r y i n p u t force, (2 ) measured nodal p a t t e r n s f o r s e v e r a l r e s o n a n t responses , and (3 ) comparisons of measured and computed f r e q u e n c i e s .
Vertical W a l l S e c t i o n s
Experimental and a n a l y t i c a l r e s u l t s f o r v e r t i c a l w a l l s e c t i o n s w i t h f o u r d i f f e r e n t f a c i n g materials are p r e s e n t e d i n f i g u r e s 5 to 7 .
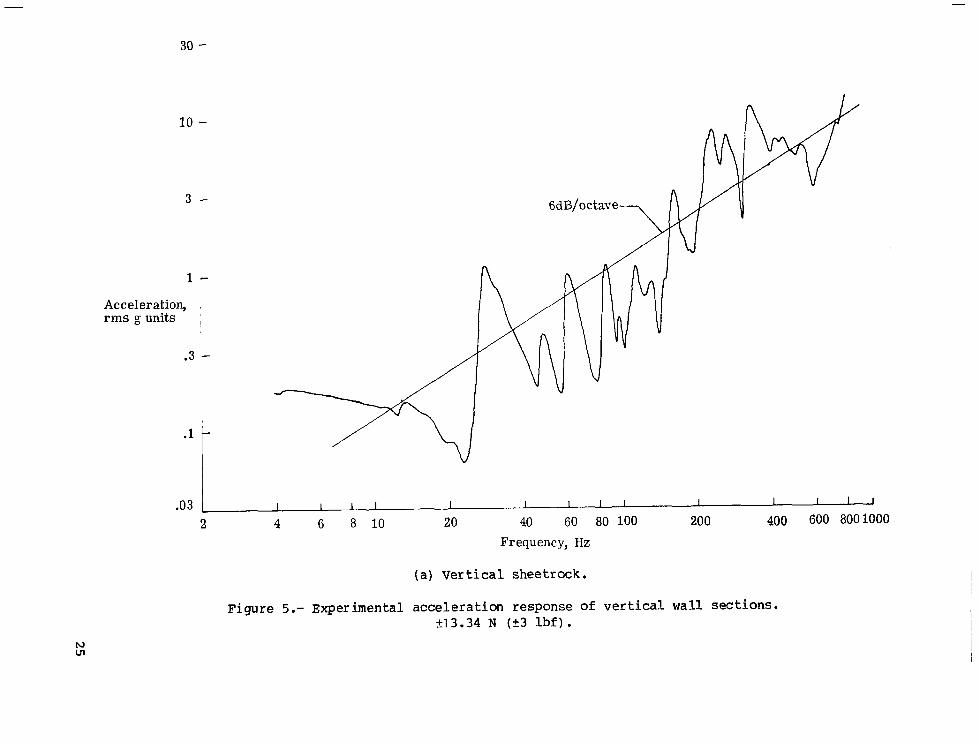
A c c e l e r a t i o n response .- Figure 5 p r e s e n t s a c c e l e r a t i o n r e sponse i n root mean s q u a r e (rms) g u n i t s of t h e v a r i o u s w a l l s e c t i o n s as a f u n c t i o n o f f r e - quency. The r e s p o n s e s i n f i g u r e 5 are f o r a constant-ampli tude v i b r a t o r y i n p u t f o r c e of k13.34 N ( f3 .0 l b f ) . The fundamental f requency of t h e a c c e l e r a t i o n response of t h e fou r v e r t i c a l w a l l s e c t i o n s occurs between 20 and 40 Hz, and t h e a c c e l e r a t i o n magnitudes of t h e shee t rock ( f i g . 5 ( a ) ) , t h e plywood ( f i g . 5 ( b ) ) , and t h e plaster ( f i g . 5 ( d ) ) are approximately t h e same throughout t h e frequency range p resen ted . The a c c e l e r a t i o n magnitudes of the Gyp-lap shea th ing s e c t i o n , however , are g e n e r a l l y h i g h e r f o r t h e i n i t i a l r e sponse peak and for t h e h ighe r f requency r e sponses above approximately 300 Hz. The g e n e r a l
6

t r end of a l l t h e responses f o r t h e cons tan t -ampl i tude s i n u s o i d a l i n p u t force is to i n c r e a s e w i t h f requency a t about 6 dB/octave as shown by t h e r e f e r e n c e l i n e i n t h e f i g u r e . This t r e n d is similar to data p resen ted i n r e f e r e n c e 3 f o r r e s i d e n t i a l walls and is c o n s i s t e n t w i th impedance c o n s i d e r a t i o n s f o r l i n e a r behavior .
N o d a l pa t t e rns . - Measured nodal p a t t e r n s f o r t w o s e l e c t e d modes of t h e Gyp-lap shea th ing w a l l s e c t i o n are shown i n f i g u r e 6. I n t h e photographs, t h e broad w h i t e l i n e s are node l i n e s where the sand h a s c o l l e c t e d du r ing v i b r a t i o n a t a r e s o n a n t f requency. I n f i g u r e 6 ( a ) t h e nodal p a t t e r n is a n m = 5; n = 2 m o d e a t 132 Hz, and i n f i g u r e 6 ( b ) t h e p a t t e r n is a n m = 8; n = 2 m o d e a t 188 Hz, where m and n are t h e number of node l i n e s i n t h e l e n g t h and wid th d i r e c t i o n s , r e s p e c t i v e l y . N o d a l p a t t e r n s i n f i g u r e 6 a re t y p i c a l of those mea- sured f o r a l l v e r t i c a l pane l s . The expe r imen ta l nodal p a t t e r n s d i d n o t always have nodal l i n e s on bo th edges of t h e face s h e e t s . T h i s resu l t is be l i eved t o be p r i m a r i l y due to t h e r e l a t i v e l y few n a i l s a long t h e face s h e e t edges.
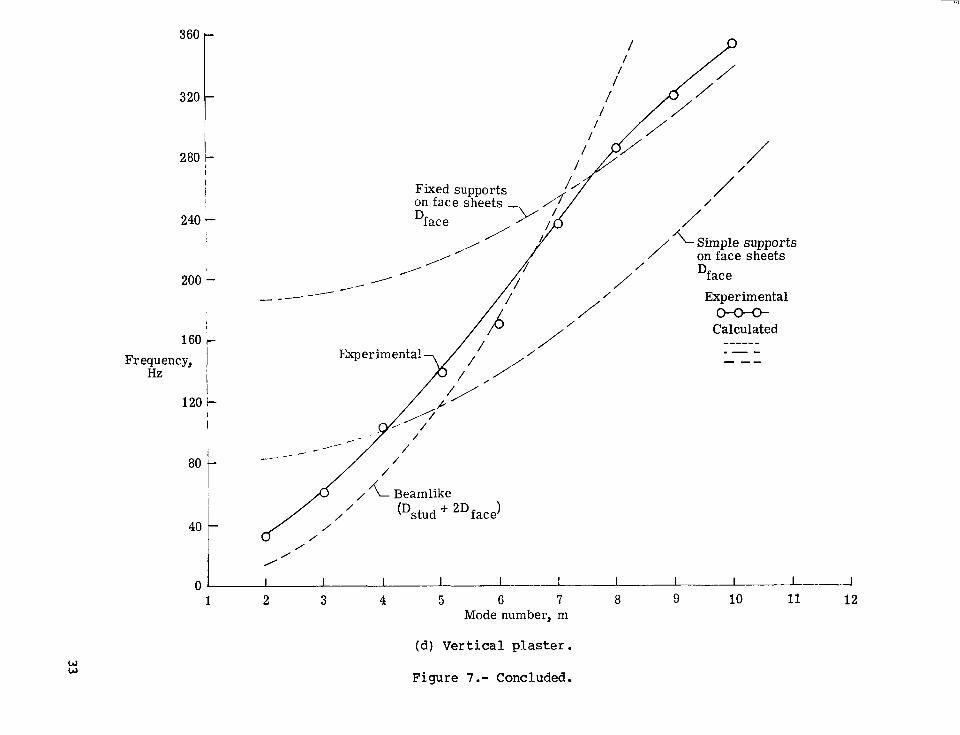
N a t u r a l f requencies . - Measured and c m p u t e d f r e q u e n c i e s as a f u n c t i o n of t h e mode number m for t h e four v e r t i c a l w a l l s e c t i o n s are shown i n f i g u r e 7. Three c m p u t e d f requency cu rves appear on each f i g u r e . The shor t -dash cu rve is t h e beamlike f r e q u e n c i e s computed by use of t h e f l e x u r a l s t i f f n e s s of t h e w a l l s e c t i o n a s developed i n t h e "Analysis" s e c t i o n . The - - curve r e p r e s e n t s t h e f r e q u e n c i e s of t h e f a c e s h e e t s w i t h s imply suppor ted edges, whereas t h e long-dash cu rve r e p r e s e n t s those for the f i x e d edges. The frequency e q u a t i o n of r e f e r e n c e 10 was used to compute t h e curves . The exper imenta l d a t a are rep- r e s e n t e d by symbols connected by a solid l i n e . The r e s u l t s i n f i g u r e 7 show t h a t t h e fundamental beamlike f r e q u e n c i e s of t h e shee t rock , plywood, and Gyp- l a p shea th ing v e r t i c a l w a l l s e c t i o n s a g r e e w e l l w i t h t hose computed by us ing t h e s t i f f n e s s as d e r i v e d from data i n t h e appendix and t h e e q u a t i o n f o r t h e f l e x u r a l s t i f f n e s s g iven i n t h e "Analysis" s e c t i o n . For t h e p l a s t e r w a l l sec- t i o n , t h e r e s u l t s i n d i c a t e a s l i g h t l y h ighe r s t i f f n e s s than t h e assumption; however, t h e t r e n d of t h e exper imenta l d a t a is i n e x c e l l e n t agreement wi th the c a l c u l a t i o n s . A l s o t h e expe r imen ta l f requency d a t a make a t r a n s i t i o n from t h e beaml ike f requency and approach t h e computed f r equenc ie s of the f a c e sheets w i t h f i x e d edges a t t h e h igher m numbers. The behavior of t h e modal fre- quencies of a l l t h e face s h e e t m a t e r i a l s on t h e v e r t i c a l w a l l s e c t i o n s fo l lowed t h i s t r end (see f i g . 7 ) ; however, those f o r t h e sheetrock and plywood s e c t i o n s were closer to t h e c m p u t e d f r e q u e n c i e s for t h e sheets w i t h s imply suppor ted edges.
R e s u l t s of t h e v e r t i c a l w a l l s e c t i o n data i n d i c a t e t h e r e f o r e t h a t t h e fundamental f requency of f u l l s t r u c t u r a l wal l s (composed of r e p e a t i n g v e r t i c a l s e c t i o n s ) is m o s t p robably de te rmined by t h e sum of t h e s t i f f n e s s e s of the s t u d s and face s h e e t s because of poor dynamic coupl ing r e s u l t i n g from s t a n d a r d n a i l i n g . Furthermore, t h e h igher m number m o d e s of cmplete w a l l s should m a k e t h e t r a n s i t i o n to modes of f a c e s h e e t s on ly .
H o r i z o n t a l W a l l S e c t i o n s
F i g u r e s 8 to 10 p r e s e n t expe r imen ta l and a n a l y t i c a l r e s u l t s f o r v i b r a t i o n tests of h o r i z o n t a l w a l l sections wi th four d i f f e r e n t f a c i n g materials.
7

Acceleration response.- Acceleration responses i n rms g units as a func- t i on of frequency are presented i n figure 9 for four facing materials of the horizontal wall sections. A constant-amplitude sinusoidal input force of 213.34 N (23.0 lb f ) was used except for the Gyplap section. The input force amplitude level was reduced to +8.90 N (22 lb f ) for the Gyp-lap because large deflections of the wall occurred i n t h i s case. The responses of the horizontal wall sections are similar to those for the vertical sections; however, the lower frequency responses for a l l four horizontal sections are much lower (less than 1 0 Hz, generally) than the corresponding vertical wall sections. T h i s result occurs because of the greater f lex ib i l i ty across the s tuds . A general increase i n response of 6 dB/octave w i t h frequency is observed for the horizontal wall sections similar to the increase observed for the verti- cal wall sections.
Nodal patterns.- Three nodal patterns of the horizontal sheetrock wall section are shown i n figure 9. The patterns are for the f i r s t , second, and f i f t h beamlike resonances of the horizontal wall section a t frequencies of 8.5, 17.5, and 74.5 Hz and are the n = 0; m = 2, 3, and 6 patterns, respectively. The straight-line nodal patterns i n figure 9 are typical for a l l the horizontal wall sections used i n the investigation.
Natural frequencies .- Figure 10 presents measured and computed frequencies as a function of mode number m for the four horizontal wall sections. Sym- bols are for experimental data; the curves are for results computed by u s i n g the st iffness data from the appendix for the various materials and the assump- tions discussed i n the "Analysis" section. Good agreement between the calcu- lated frequencies using the s t i f fness of the face materials only and experimen- t a l frequencies indicates that the modes of the horizontal wall sections are governed by the s t i f fness of the face material. The frequencies of the sheet- rock and Gyp-lap sections are about the same, since the Dx/Mass values of the two materials are essentially the same, although the difference i n modulus of e las t ic i ty of the materials is large. (See appendix.) The plaster face mate- r i a l had the highest frequencies for a mode number m compared w i t h the other three face materials because the facing.
Dx/Mass was the greatest for the plaster
Complete Wall
To cover the spectrum from the section level of typical walls to a full- size wall section, vibration data for a complete tes t wall are presented i n figure 11.
Acceleration response.- Figure l l ( a ) presents the response i n rms g u n i t s as a function of frequency for the complete wall supported i n the side of the special tes t cubicle. The response is for a constant-amplitude sinusoidal input force of k22.24 N (+5 l b f ) between 5 and 200 Hz. A comparison of the full-size wall section response w i t h responses of the wall sections (figs. 5 and 8) and those of reference 3 for house structures indicates that the full- size wall behavior is similar to that of the wall sections. The trend of the
8

response also shows t h e i n c r e a s e a t about 6 dB/octave as i n d i c a t e d by t h e r e f - e r e n c e l i n e i n f i g u r e 11 ( a ) .
N o d a l p a t t e r n s . - F i g u r e 1 1 (b) p r e s e n t s fou r nodal p a t t e r n s measured on t h e f u l l - s i z e w a l l s e c t i o n . The modes are for n = 2 (top and bottom edges are nodes) and m = 2, 4, 6, and 8 a t f r e q u e n c i e s of 23.5, 34.0, 58.0, and 91.0 Hz, r e s p e c t i v e l y . A c a n p a r i s o n of t h e s e nodal p a t t e r n s wi th t h e p a t t e r n s p r e s e n t e d i n r e f e r e n c e 3 for r e s i d e n t i a l walls i n d i c a t e s i d e n t i c a l type p a t t e r n s , as might be expected.
N a t u r a l f requencies . - F i g u r e 11 (c) p r e s e n t s f r e q u e n c i e s of t h e p a n e l modes ( i n c l u d i n g t h o s e of f i g . 1 1 ( b ) ) as a f u n c t i o n of m o d e number m f o r t h e f u l l - s i z e w a l l s e c t i o n . The broken c u r v e s are computed f r e q u e n c i e s and t h e s o l i d c u r v e wi th symbols is measured d a t a . The r e s u l t s shown i n f i g u r e 11 (c) i l l u s - t ra te t h e complex problems associated w i t h determining t h e v i b r a t i o n behavior of t y p i c a l w a l l s t r u c t u r e s . For example, t h e frequency of t h e f i r s t experimen- t a l w a l l v i b r a t i o n mode (m = 2; n = 2) occur red a t approximately 24.0 Hz; how- ever, t h e canputed f r equency ( u s i n g t h e sum of t h e i n d i v i d u a l s t i f f n e s s of t h e d i f f e r e n t materials and assuming simple edge s u p p o r t ) is about t w i c e t h e exper- imen ta l va lue . Also, t h e f requency canputed by using o n l y t h e s t i f f n e s s of t h e p i n e shea th ing w i t h e i t h e r f i x e d or simple edge suppor ts is about one-half t h e expe r imen ta l value. On t h e o t h e r hand, a t t h e higher m numbers t h e expe r i - mental f r e q u e n c i e s approach t h e t r e n d of t h e computed f r e q u e n c i e s for t h e f i x e d supports w i t h t h e s t i f f n e s s assumed t o be t h a t of t h e p i n e shea th ing .
I n ana lyz ing t h e v i b r a t i o n d a t a of t h e complete w a l l s e c t i o n , t h e observed behav io r s of t h e v e r t i c a l and h o r i z o n t a l w a l l s e c t i o n s were similar to t h e f u l l - s i z e w a l l behav io r , and knowledge of t h e e f f e c t of face-sheet-s tud i n t e r f a c e behavior on s t i f f n e s s ( d i s c u s s e d under "Analysis" s e c t i o n ) was ve ry h e l p f u l i n understanding t h e response of t h e f u l l - s i z e w a l l s e c t i o n . I n a d d i t i o n , t h e d a t a i l l u s t r a t e d t h e understanding of v i b r a t i o n c h a r a c t e r i s t i c s t h a t c a n be o b t a i n e d through s i n u s o i d a l v i b r a t i o n tes ts and, i n some cases, such v i b r a t i o n tests may be necessa ry f o r i n t e r p r e t i n g t h e r e sponses of s t r u c t u r e s exposed to a i r p l a n e f l y o v e r no i se . Furthermore, t h e s u b s t a n t i a l s h e a r motions o c c u r r i n g i n t h e w a l l s t r u c t u r e s lead to d i f f i c u l t y i n canpu t ing f r e q u e n c i e s of t h e w a l l , even when good modulus d a t a of t h e i n d i v i d u a l materials are a v a i l a b l e . T h i s r e s u l t sug- g e s t s t h a t a s y s t e m a t i c l a b o r a t o r y s t u d y of w a l l s t r u c t u r e s would probably pro- v i d e u s e f u l i n s i g h t and better understanding of t h e v i b r a t i o n behavior of f u l l - s i z e w a l l s t r u c t u r e s .
As a consequence of t h e v i b r a t i o n resu l t s w i t h t h e w a l l s e c t i o n and t h e f u l l - s i z e w a l l test s e c t i o n , a comment is o f f e r e d r e l a t i v e to t h e d i s c u s s i o n o f w a l l modes and f r e q u e n c i e s i n r e f e r e n c e 3. The s t a t e m e n t s i n r e f e r e n c e 3 were made by assuming t h e w a l l s t i f f n e s s t o be for t h e cross s e c t i o n bending abou t a n e u t r a l a x i s of t h e w a l l as a u n i t ; however, based upon t h e r e s u l t s of t h e p r e s e n t s t u d y , t h e w a l l s do n o t n e c e s s a r i l y behave as a u n i t b u t each material bends b a s i c a l l y about i ts own n e u t r a l axis. Thus, as d i s c u s s e d i n t h e p r e s e n t report, t h e r e sponses of t h e h ighe r m number modes are a s s o c i a t e d wi th t h e f a c e s h e e t s t i f f n e s s o n l y and are t h e r e f o r e much lower i n f requency.
9

Plate G l a s s Window
F i g u r e 12 p r e s e n t s r e s u l t s of forced s i n u s o i d a l tests conducted to g a i n i n s i g h t i n t o v i b r a t i o n behavior of plate glass windows which are o f t e n exposed to f l y o v e r noise such as i n v e s t i g a t e d i n r e f e r e n c e 2.
A c c e l e r a t i o n response.- F i g u r e 1 2 ( a ) p r e s e n t s a c c e l e r a t i o n response a t t h e c e n t e r of t h e window, i n g u n i t s , as a f u n c t i o n of frequency. Responses of t h e window are similar to t h e s t r u c t u r a l w a l l s e c t i o n responses of f i g u r e s 5 and 8. The lowest f requency window response w a s a t approximate ly 9 Hz and t h e addi- t i o n a l h igher f requency responses are noted to g e n e r a l l y occur a b o u t a s t r a i g h t l i n e which has a p o s i t i v e slope of 6 dB/octave w i t h frequency, as d i d t h e w a l l s e c t i o n responses .
Nodal p a t t e r n s .- Nodal p a t t e r n s of t h e plate glass window corresponding to s e v e r a l peaks (noted by numbers i n p a r e n t h e s e s ) i n f i g u r e 1 2 ( a ) are pre- s e n t e d i n f i g u r e 1 2 ( b ) . The 9-Hz response is t h e m = 2; n = 2 mode. A t 18 Hz t h e response is t h e m = 4; n = 2 mode, a t 48 Hz t h e response is t h e m = 4; n = 4 mode, and a t 70 Hz t h e response is t h e m = 6; n = 4 mode. These r e s u l t s i n d i c a t e t h a t t h e odd or unsymmetrical p a t t e r n s are t h e p r e v a l a n t ones which occurred d u r i n g forced v i b r a t i o n s a t t h e c e n t e r of t h e window.
N a t u r a l f r e q u e n c i e s .- Comparisons of exper imenta l and computed f r e q u e n c i e s of t h e plate glass window as a f u n c t i o n of mode number m for v a r i o u s v a l u e s of n are p r e s e n t e d i n f i g u r e 1 2 ( c ) . The c a l c u l a t e d f r e q u e n c i e s were o b t a i n e d by us ing t h e a n a l y s i s i n r e f e r e n c e 11 , which accounts for t h e s t i f f n e s s of t h e enclosed a i r volume, i n c o n j u n c t i o n w i t h t h e f requency e q u a t i o n for plates g iven i n r e f e r e n c e 10 , w i t h assumed simple edge s u p p o r t s . Curves are computed d a t a and symbols are measured data. e x c e l l e n t agreement between t h e computed and measured f r e q u e n c i e s for t h e plate glass window u s i n g handbook v a l u e s (ref. 12) for t h e modulus of e l a s t i c i t y of g l a s s .
The comparison i n t h e f i g u r e i n d i c a t e s
To i l l u s t r a t e f u r t h e r t h e u s e f u l n e s s of s i n u s o i d a l v i b r a t i o n test d a t a i n a s s e s s i n g t h e behavior of s t r u c t u r a l components when exposed to f l y o v e r n o i s e , a typical o s c i l l o g r a p h trace of t h e responses (no scale) of t h e plate glass window to one f l y o v e r of an a i r p l a n e is reproduced i n f i g u r e 13. The top trace i l l u s t r a t e s a typical t i m e slice of t h e random o u t s i d e n o i s e environment pro- duced by t h e a i r p l a n e . Immediately belaw t h a t (curve l a b e l e d ( 1 ) ) is t h e i n s i d e n o i s e a t s o m e t i m e which c o n s i s t s basically of a 9-Hz f requency w i t h a h i g h e r f requency superimposed. h i s t o r y (curve labeled ( 2 ) ) , t h e a c c e l e r a t i o n a t t h e c e n t e r of t h e window w a s a n 18-Hz response; a t s t i l l a la ter t i m e t h e i n s i d e n o i s e (curve labeled ( 3 ) ) w a s around a 48-Hz response: and a t s t i l l a d i f f e r e n t time t h e a c c e l e r a t i o n response (curve l a b e l e d ( 4 ) ) w a s e s s e n t i a l l y a t 70 Hz. S ince t h e s e frequen- cies correspond to f r e q u e n c i e s of peaks i n t h e s i n u s o i d a l a c c e l e r a t i o n data ( f i g . 1 2 ( a ) ) , t h e r e s u l t s i n d i c a t e t h a t as t h e frequency of t h e n o i s e energy cor responds to a window n a t u r a l f requency, t h e window v i b r a t e s i n one of t h e v a r i o u s nodal p a t t e r n s shown i n f i g u r e 1 2 ( b ) . Thus, e i t h e r a c c e l e r a t i o n or i n s i d e noise response of t h e window may be measured to assess t h e v i b r a t i o n
A t a d i f f e r e n t t i m e d u r i n g t h e flyover t i m e
10

behavior and such d a t a can be understood by c o r r e l a t i o n wi th response d a t a f r a n s i n u s o i d a l i npu t s .
CONCLUDING REMARKS
Experiments were conducted to de termine t h e v i b r a t i o n c h a r a c t e r i s t i c s of s t r u c t u r a l components r e p r e s e n t a t i v e of wood-frame house c o n s t r u c t i o n us ing v a r i o u s f a c e s h e e t materials. The camponents were v e r t i c a l s e c t i o n s and h o r i z o n t a l s e c t i o n s from a t y p i c a l w a l l , a complete w a l l s e c t i o n , and a p l a t e g l a s s window. Mechanical e x c i t a t i o n w a s used and measurements of a c c e l e r a t i o n response , n a t u r a l f r equenc ie s , and nodal p a t t e r n s were performed.
R e s u l t s i n d i c a t e t h a t t h e w a l l s e c t i o n s and t h e canplete w a l l d id n o t act as a u n i t i n responding to s i n u s o i d a l v i b r a t i o n inpu t s . Lower f requency response modes (mode number m < 4 , excep t f o r plaster s e c t i o n where m < 7) of t h e v e r t i c a l s e c t i o n s and t h e f u l l - s i z e w a l l were b a s i c a l l y determined by t h e sum of t h e s t i f f n e s s e s of t h e s t u d s and t h e f a c e sheets a c t i n g independent ly . Responses a t h igher m numbers f o r a l l t h e v e r t i c a l s e c t i o n s and t h e complete w a l l as w e l l a s a l l f r e q u e n c i e s of t h e h o r i z o n t a l w a l l s e c t i o n s tended t o be dominated by p l a t e l i k e v i b r a t i o n s of t h e w a l l f a c e sheets a c t i n g independent ly of t h e s t u d s . Trends of t h e c a l c u l a t e d f r e q u e n c i e s of t h e s t r u c t u r a l campo- n e n t s t h a t accounted for t h e poor dynamic coupl ing from s t a n d a r d c o n s t r u c t i o n n a i l i n g between t h e s t u d s and f a c e s h e e t s (nonuni t behavior of cross s e c t i o n ) agreed w e l l w i th expe r imen ta l f r equenc ie s . V i b r a t i o n s of t h e p l a t e g l a s s window agreed w i t h c a l c u l a t e d behavior , and responses of t h e window exposed t o a i r p l a n e f l y o v e r n o i s e were r e a d i l y correlated wi th s i n u s o i d a l v i b r a t i o n test r e s u l t s .
Langley Research Center N a t i o n a l Aeronaut ics and Space Admin i s t r a t ion Hampton, VA 23665 A p r i l 20, 1979
11

APPENDIX
DETERMINATION OF MATERIAL PROPERTIES
T h i s appendix p r e s e n t s t h e r e s u l t s of tests conducted to determine t h e modulus of e las t ic i ty of t h e various materials used i n t h e c o n s t r u c t i o n of t h e v e r t i c a l and h o r i z o n t a l w a l l s e c t i o n s d i scussed i n t h e main text .
Material Samples
Four samples of each o f t h e f i r s t u d s and t h r e e samples of each of t h e fou r f a c i n g materials were c u t from t h e e x c e s s l e n g t h of t h e va r ious materials used i n t h e w a l l s e c t i o n s , The f i r s t u d samples were 1.27 c m (1/2 in . ) t h i c k , 60.96 c m (24 in . ) long , and 4.06 c m (1.6 i n . ) wide. The t h r e e material samples of each of t h e fou r f a c i n g materials were, g e n e r a l l y , 6.35 c m (2.5 in . ) wide, 40.64 c m (16 in . ) l ong , and t h e t h i c k n e s s e s were 1.27 c m (1/2 i n . ) for t h e shee t rock and plywood; 1.98 c m (25/32 in . ) for t h e Gyp-lap shea th ing , and 1.91 c m (3/4 i n . ) for t h e plaster on gypsum l a t h e .
T e s t Methods and Ana lys i s
F igu re 1 4 is a photograph of t h e test setup used i n t h e de t e rmina t ion of t h e modulus of e l a s t i c i t y of t h e materials i n t h e v e r t i c a l and h o r i z o n t a l w a l l sections. Each material sample w a s clamped to a r i g i d base as a cantilever beam. Beam l e n g t h w a s 50.80 c m (20 in . ) f o r t h e f i r s t u d s and 35.56 c m (14 i n . ) f o r t h e various f a c i n g materials. The a i r shaker shown i n t h e photo-
graph w a s used to e x c i t e t h e f i r s t t h r e e or fou r c a n t i l e v e r b e a m modes a t t h e i r na tu ra l f requency. P r i o r to t h e v i b r a t i o n tests, each sample's dimensions and mass were measured. From t h e s e d a t a t h e mass per u n i t l e n g t h and area moment of i n e r t i a were determined.
To o b t a i n t h e material modulus of e l a s t i c i t y , t h e measured properties were used i n con junc t ion wi th t h e c a n t i l e v e r beam f requency equa t ion to compute t h i s q u a n t i t y . S p e c i f i c a l l y ,
( 2 1 ~ f ) 2pQ4 E =
An21
where
E modulus of e l a s t i c i t y ( d e s i r e d )
f f requency o f c a n t i l e v e r modes, Hz (measured)
P mass per u n i t l e n g t h of beam (measured)
Q l e n g t h of beam (measured)
12

APPENDIX
An c o e f f i c i e n t depending on mode number and boundary c o n d i t i o n of beam (known)
I area moment of i n e r t i a of beam cross s e c t i o n (calculated from measured va lues )
Table I1 p r e s e n t s t h e measured f r equenc ie s of t h e v a r i o u s material samples, t h e mass per un i t l e n g t h , and t h e average va lue of t h e modulus of e l a s t i c i t y ob ta ined from the i n d i v i d u a l expe r imen ta l f requency va lues . The average val- ues of t h e modulus were used i n t he "Analysis" s e c t i o n of t h e main t e x t of t h i s report .
1 3

REFERENCES
1. Sonic Boom Experiments a t Edwards A i r Force Base. NSBEO-1-67 (Con t rac t AF 49(638)-1758), CFSTI, U . S . D e p . C m . , J u l y 28, 1967.
2. Progres s o f NASA Research R e l a t i n g to N o i s e A l l e v i a t i o n of Large Subsonic Jet Aircraft. NASA SP-189, 1968.
3. Carden, Huey D.; and Mayes, W i l l i a m H.: Measured V i b r a t i o n Response Char- acteristics of Four R e s i d e n t i a l S t r u c t u r e s Exc i t ed by Mechanical and A c o u s t i c a l Loadings. NASA TN D-5776, 1970.
4. Concorde Supersonic Transpor t A i r c r a f t . F i n a l Environmental Impact S ta tement - Volume I. FAA, Sept . 1 975.
5. S t a f f , Langley Research Center : Concorde Noise-Induced Bu i ld ing V i b r a t i o n s for S u l l y P l a n t a t i o n , C h a n t i l l y , V i r g i n i a . NASA TM X-73919, 1976.
6. S t a f f , Langley Research Center : Concorde Noise-Induced Bu i ld ing Vibra- t i o n s , S u l l y P l a n t a t i o n - Report No . 2, C h a n t i l l y , V i r g i n i a . NASA TM X-73926 I 1976.
7. S t a f f , Langley Research Center : Concorde Noise-Induced Bu i ld ing Vibra- t i o n s , Montgomery County, Maryland - R e p o r t No. 3. NASA TM X-73947, 1976.
8. Staff-Langley Research Center : Concorde Noise-Induced Bu i ld ing V i b r a t i o n s - I n t e r n a t i o n a l Airport D u l l e s - F i n a l Report. NASA TM-74083, 1 977.
9. Staf f -Langley Research Center: Concorde Noise-Induced Bu i ld ing V i b r a t i o n s - John F. Kennedy I n t e r n a t i o n a l A i r p o r t - R e p o r t Number 1. NASA TM-78660, 1978.
10. Leissa, Arthur W.: V ib ra t ion of P l a t e s . NASA SP-160, 1969, pp. 42-44.
11. Freynik , Henry S., Jr. : The Nonl inear Response of Windows t o Random Noise. NASA TN D-2025, 1963.
12. S t r e n g t h o f P l a t e and Laminated Glass. Techn ica l Glass B u l l e t i n , P i t t s b u r g h P l a t e G l a s s Co., J u l y 30, 1941.
14

I 1111
47.45 (3.248)
19.19 (1 .314)
17.45 (1.195)
60.69 (4.155)
S e c t i o n material
Shee t rock
Plywood
Gyp-lap
P l a s t e r -~
47.88 (0.3045)
19.37 (0.1232)
17.61 (0.1120)
61 .24 (0.3895)
TABLE I.- WALL SECTION MASS AND SURFACE DENSITY
Hor izon ta l s e c t i o n
19.16 (1.312)
17.98 (1 .231 )
13.97 (0.957)
54.31 (3.718)
Surface d e n s i t y , kg/m2 ( s l u g s / f t 2 )
22.78 (0.1449)
21 .37 (0.1259)
16.61 (0.1057)
64.56 (0.41 06)
15

TABLE 11.- WALL SECTION MATERIALS DATA
0.2357 203 (4.919 10-3) 524 30.5 I
(a) Sheetrock w a l l s e c t i o n
~ ~~~~~
0.2604 1 0.2304 0.2455 (4.807 x 10⁻³) (5.124 10-3) (5.434 10-3)
Mode
sheetrock 1
1 Stud 1 I Stud 2 I Stud 3 I Stud 4 I Stud 1 I Stud 2 I S t u d y S i u y 4
Sheetrock 2 Sheetrock 3 Sheetrock 4 Sheetrock 1 Sheetrock 2 Sheetrock 3 Sheetrock 4 Average modulus
Frequency, HZ
Frequency, HZ
Mass/unit l e n g t h , kg/m
( s l u g s / f t )
of e l a s t i c i t y , a / m 2 Mass/un i t l e n g t h ,
( s l u g s / f t ) kg/m ( l b f / i n 2 )
1 34.85 35.4 2 I 223 1 2::" 1 225 3 580 565 646
0.5581 (1 .165 x
0.5581 0.5581 (1 .165 x (1 .165 x 10-2)
Average modulus of e l a s t i c i t y ,
a / m 2 ( l b f / i n 2 )
8.370 (1.214 x l o 6 )
~ ~~
1.591 (2.308 x l o 5 )
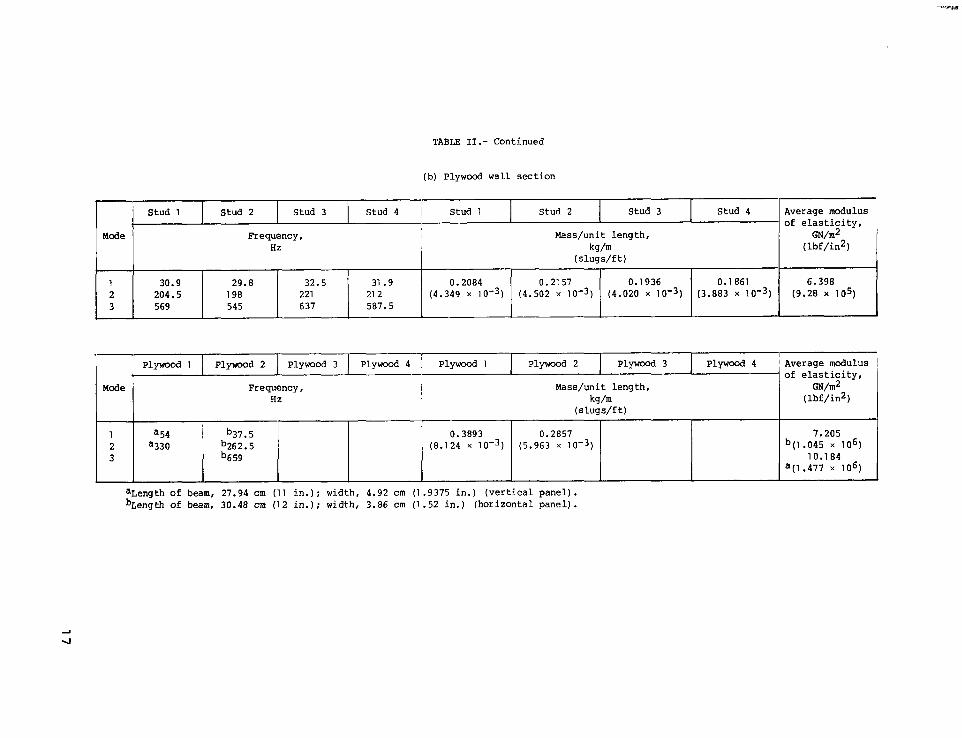
TABLE 11.- Continued
- I
Stud 4 I Stud 1 Stud 2 Stud 3 Stud 4 S tud 1 Stud 2 Stud 3 1
Mode ' Frequency, Mass/unit l e n g t h , Hz kg/m
( s l u g s / f t )
1 30.9 29.8 32.5 31 .9 0.2084 0.2157 0.1936 0.1 861
3 569 545 637 587.5 2 204.5 198 221 21 2 (4.349 10-3) (4.502 10-3) (4.020 x 10⁻³) (3.883 x 10⁻³)
Average modulus of e l a s t i c i t y ,
a / m 2 ( l b f / i n 2 )
6.398 (9.28 x 10⁵)
- Plywood 1 Plywood 2 Plywood 3 Plywood 4 ' Plywood 1
I Plywood 2 Plywood 3 Plywood 4 Average modulus
Mass/unit l e n g t h ,
( s l u g s / f t )
~
Frequency, Hz kg/m Mode I
1 a54 b37. 5 0.3893 0.2857 2 a330 b262.5 (8.124 x (5.963 x
3 b659
of e l a s t i c i t y , a / m 2
( l b f / i n 2 )
7.205 b( l .045 x l o 6 )
10.184 a(1.477 x 10⁶)
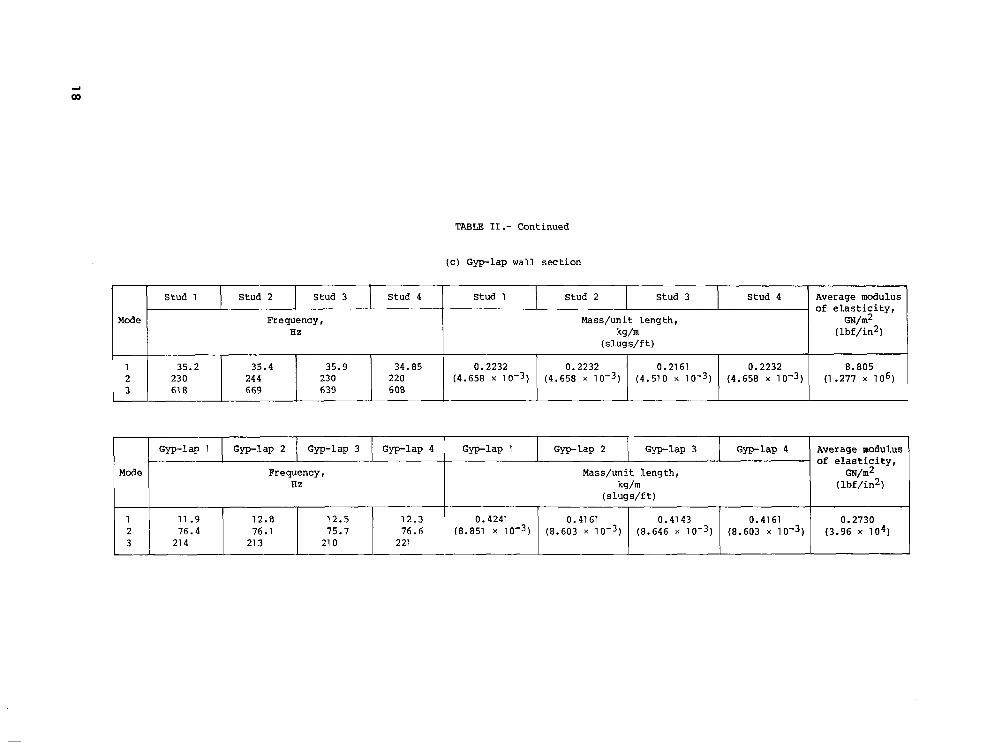
TABLE 11.- Continued
S tud 1 Stud 2 Stud 3 Stud 4 Stud 1 Stud 2 Stud 3 S tud 4 Average modulus of e l a s t i c i t y ,
Mode Frequency, Mass/uni t l e n g t h , a / m 2 HZ kg/m ( l b f / i n 2 )
-- ~
1 35.2 35.4 35.9 34.85 0.2232 0.2232 0.2161 0.2232 8.805 2 230 244 230 220 (4.658 x 10⁻³) (4.658 x (4.510 x 10-3) (4.658 x (1.277 x l o 6 ) 3 61 8 669 639 608
(c) G y p l a p w a l l s e c t i o n
Gyp-lap 1 Gyp-lap 2 Gyp-lap 3 Gyp-lap 4 Gyp-lap 1 Gyplap 2 G y p l a p 3 Gyp-lap 4 Average modulus
12.8 76.1
21 3
Mode I 12.5 12 .3 0.4241 0.4161 0.4143 0.4161 0.2730 75.7 76.6 (8.851 x
21 0 221
Frequency, Hz
Mass/uni t l e n g t h , kg/m
( s l u g s / f t ) ( l b f / i n 2 ) I - . I

TABLE 11.- Concluded
I Stud 1
(d) Plaster wall section
Stud 2 Stud 3 Stud 4 Stud 1 Stud 2 Stud 3 Stud 4 Average modulus
Hz
1 39.3 39.5 40.6 39.3 2 244 242 249 242 3 6 55 674 681 669
L
kg/m ( lbf/in2) (slug s/f t )
0.1786 0.1711 0.1711 0.1786 8.039 (3.727 x (3.570 x (3.570 x (3.727 x (1.166 x 106)
, Plaster 1 Plaster 2 Plaster 3 Plaster 4 Plaster 1 Plaster 2 Plaster 3 Plaster 4 Average modulus
Mode Frequency, Mass/unit length, I Hz kg/m
(slugs/f t) . - - - ~
1 46.4 49.4 b66.2 1 .0929 1.2840 2 29 4 b400 (2.281 x (2.680 x 3
m/m2 ( lbf/in2)
3.385 (4.91 x 10⁵)

Figure 1 .- Study approach us ing t y p i c a l w a l l s e c t i o n s .
20

One-half of a tw o-by -four fir stud
%n - hv - f ni 1 r & A - G ,
(a) Framing of v e r t i c a l w a l l s e c t i o n .
(b) Completed v e r t i c a l w a l l s e c t i o n .
F igu re 2 .- Cons t ruc t ion d e t a i l s of w a l l s e c t i o n s .
21

(16 in.) Face sheets
(c) H o r i z o n t a l w a l l s e c t i o n s .
F i g u r e 2.- Concluded.
22

h) W
Figure 3 . - S t r u c t u r a l s teel test c u b i c l e with plate g l a s s window i n s t a l l e d .

L-79-142 (a) Ver t i ca l w a l l s e c t i o n .
P e r m anent magnet shake r
Horizontal wall sec t ion
Vacuum at tachment J
(b) H o r i z o n t a l w a l l s e c t i o n .
F igu re 4 .- Experimental se tup f o r v i b r a t i o n s tudy of w a l l s e c t i o n s .
24
30 -
10 -
3 -
1 -
Acceleration, ,
r m s g units ~
.3 -
.03 1 I I I I I I I I I I I I I 1 2 4 6 8 10 20 40 60 80 100 200 400 600 8001000
Frequency, Hz
(a) Vertical sheetrock.
Figure 5 .- Experimental acceleration response of vertical wall Sections. 213 .34 N ( + 3 l b f ) . ,

10
3
1
Acceleration, rms g units
.3
.1
.03 I I I I I 1 I I 1 I I I I 1
2 4 6 8 10 20 40 60 80 100 200 400 600 800 1000 Frequency, Hz
(b) Vertical plywood.
F igu re 5.- Continued.

100 '-
30 I-
10 -
hl 4
6 d B/o c t ave - 3
Acceleration, r m s g units
1
.3
.03 2 4 6 8 10 20 40 60 80 100 200 400 600 800 1000
Frequency, Hz
(c) Vertical Gyp-lap.
Figure 5.- Continued.

. 3 - Acceleration,
r m s g units
.1 -
I
.03 -
.01 I/ I I I I I I I I I I I I I 1
400 600 800 1000 200 2 4 6 8 10 20 40 60 80 100 Frequency, Hz
(d ) Vertical p l a s t e r .
F igure 5.- Concluded.

( a ) f = 1 3 2 Hz; m = 5; n = 2.
(b) f = 188 Hz; m = 8; n = 2.
Figure 6.- Experimental nodal p a t t e r n s of v e r t i c a l Gyp-lap wa l l s e c t i o n . (These nodal p a t t e r n s are typical f o r a l l v e r t i c a l s e c t i o n s . )
L-79-143
29

W 0
3 20
2 80
240
200
160
120
80
40
0
Beamlike (Dstud+ 2Dface ) / / 7/
/ /
/ /
I
Fixed supports / on face sheets
/ /
/
<s;mpl e supports
Experimental Experimental
--- on face sheets Dface
m Calculated
___--- _-- ---
I I I I I I I I I 1 I 2 3 4 5 6 7 8 9 10 11 12 1
Mode number, m
(a) Vertical sheetrock.
Figure 7.- Computed and experimental modal frequencies of vertical wall sections.

320 - I
280 !-
I 240 1
i
200 -
160 - Frequency,
Hz
120 r
80
40 -
I
/---
H ,
Experimental o-0-0-
Calculated
-/---
___--- - - - - - -
/
(b) Vertical plywood.
Figure 7 . - Continued.

w hl
320 r I 280
240
200 7
I 160
Frequency, ! Hz
120 I- !
I
80 ‘r I
Beamlike I
(Dstud -k 2Dface 1 ’ 3 I
I I
I I Fixed edges
/ I
I I
I
-- Experimental
CH3-c- Calculated
------ - - - _ - -
O / - L - - I I I I I I I I I J 1 2 3 4 5 6 7 8 9 10 11 12
Mode number, m
(c) Vertical Gyp-lap.
Figure 7.- Continued.
3 20
W W
! 280 1-
200 -
160 i- Frequency, 1
HZ I 120 I-
I
I
i/ /, , , Beamlike
(Dstud + 2Dface)
/ /
/
O J I I I I I I I I I -I_---
1 2 3 4 5 6 7 8 9 10 11 12 Mode number, m
(d) Vertical plaster.
Figure 7 .- Concluded.

w Ip
10 'i I
3 -
1 -
Acceleration, r m s g units
.3 -
.1 -
.03 I I I I I I I I I I I I I I
2 4 6 8 10 20 40 60 80 100 200 400 600 800 1000 Frequency, Hz
(a) Horizontal sheetrock. +13.34 N (23 Ibf).
Figure 8 .- Experimental acceleration response of horizontal wall sections.

10 3-
3 -
1 - Acceleration, r m s g units
.1 I
.03 I 1 I 1 I I I I I I I I I 1
2 4 6 8 10 20 40 60 80 100 200 400 600 8001000
Frequency, Hz
(b) Hor izonta l plywood.
Figure 8.- Continued.
W UI

W m
Acceleration, l l 1"s g units
.3 -
.03 I I I I I I I I I I I I I 1
2 4 6 8 10 20 40 60 80 100 200 400 600 800 1000 Frequency, Hz
(c) Horizontal Gyp-lap. k8.90 N (+2 lbf) . Figure 8.- Continued.

30 r
10 -
3 -
1 - Acceleration,
r m s g units
.3
.1
.03 I I I I I I I I I 1 1
2 4 6 8 10 20 40 60 80 100 200 400 600 800 1000 Frequency, Hz
(d) Horizontal plaster.
Figure 8.- Concluded.

w 03
lines
(a) f = 8.5 Hz; m = 2; n = 0. (b) f = 17.5 Hz; m = 3; n = 0.
!
(c) f = 74.5; m = 6; n = 0.
Figme 9.- Nodal patterns of horizontal sheetrock wall section. typical for a l l horizontal wall sections.)
(These patterns are

320 -
0
280 -
0 /’ I a--
I I I I I I I I i
240 -
200 -
160 - Frequency,
Hz
120 -
80 - I
/ Experiment a1 / -b/
/ /
O /’ A
9’
/ / - Computed with
/ 9/ Dface (n = 0)
/ /
/ /o
/ /
/
/ /
1 2 3 4 5 6 7 8 9 10 11 12 Mode number, m
( a ) Horizontal sheetrock.
Figure 10.- Computed and experimental modal frequencies of horizontal wall sections. w W

Ip 0
320 r
240 2801 -
200 -
160 - Frequency,
Hz
120 -
80 -
40 -
/ / 0
/ /
/’
/ Y’ /
/
Computed with Dface
(n = 0) /
Experimental / o
P /
/ O / /
/ /
/ / /’
/O /
0 P’ 9’
0 , I I I I 1 1 I I I
1 2 3 4 5 6 7 8 9 10 11 12 Mode number, m
(b) Hor i zon ta l plywood.
F igu re 1 0 .- Continued.

320 -
Hz 160
120
80
40
0
280 -
C / d
/ /
/ A
- /
Experimental p*c Computed with - -73 /’ ’face (n 0)
/ /
/
- P’ 0” I
/ a- L-.
1 I I I I I I I 1
240 -
(c) Hor izonta l Gyp-lap.
F igure 10.- Continued.

240 -
200 l-
160 - Frequency,
Hz
/ /
/’ /
/ o / /
/’ 120 - Experimental
80 -
40 -
/
0 /< Computed with / Dface (n = 0)
/ o/ /
0-’ 0 ‘I I I I I I I I I I 1
3 4 5 6 7 8 9 10 11 12 1 2 Mode number, m
(d) Horizontal plaster.
Figure 10 .- Concluded.

Acceleration, rms g units
.03
Ip W
-
.003 1 1 I 1 1 1 1 2 5 10 20 50 100 200 400
Frequency, Hz
(a ) Accelerat ion response.
Figure 11 .- Vibrat ion response of f u l l - s i z e wall s e c t i o n to s inuso ida l inputs .

IP IP
f = 23.5 Hz; m = 2; n = 2 f = 34.0 Hz; m = 4; n = 2
f = 58.0 Hz; m = 6; n = 2 f = 91.0 Hz; m = 8; n = 2
(b) Nodal p a t t e r n s .
F igure 11 .- Continued.

160 -
140 ,-
120 -
100 -
I I I I I 1 I I
80 8-
Frequency, Hz
60 -
40 I-
2o I /
/
/ /
/ /
I I
I I I
I I
I I
/ /
I I
I I I I I
/
/ Fixed supports on all edges; D of pine sheathing (n = 2)
/ / Experimental 0-o-o /y Calculated
*!‘- Beamlike stiffness @ D’ s); simple edge supports (n = 2) ____-- / /
Simple supports on all edges; D of pine sheathing
Experimental (n = 2)
(c) Modal f requencies .
F igure 11 .- Concluded.

Acceleration, rms g units
3
1
.3
.l ,-
I
6 d B/o c t ave
I I I I I I I I I I I 2 5 20 50 200 500 2000 5000
Frequency, Hz ( a ) Acce lera t ion response.
F igure 1 2 .- Vibra t ion behavior of l a r g e p l a t e g l a s s window f o r s i n u s o i d a l v i b r a t i o n inpu t s . Numbers i n parentheses r e f e r to p a t t e r n s i n (b) p a r t .

f = 9 H z ; m = 2 ; n = 2 f = 1 8 H z ; m = 4 ; n = 2
f = 4 8 H z ; m = 4 ; n = 4 f = 7 0 H z ; m = 6 ; n = 4
( 5 ) Nodal patterns.
Figure 12.- Continued.

2oo. 160
120
I
- Frequency,
Hz
80 ~8-
40 - >n = 4
Experimental
0 0 Computed
01 I I I I I I I I 1 2 3 4 5 6 7 8 9
Mode number, m
(c) Modal f requencies . Figure 1 2 .- Concluded.

9 Hz
18 Hz 48 Hz
;Inside noise (1)
u Acceleration (2)
I Inside noise (3) 70 Hz Acceleration (4)
F i g u r e 1 3 . - Response of p l a t e g l a s s window to a i r p l a n e f lyove r no i se .
49

UI 0
L-78-7035.1 Figure 14.- Test setup for determination of modulus of e las t ic i ty of materials
used i n construction of wall sections.

. - - _ _ _ _ _ - ..
1. Report No. 2. Government Accession No.
NASA TP-1447 .- 1 4. Title and Subtitle
VIBRATION CHARACTERISTICS OF WALLS AND A PLATE GLASS WINDOW REPRESENTATIVE OF TROSE OF A WOOD-FRAME HOUSE
._ . . ~ . .- -. . -. - .
7. Author(s)
Huey D. Carden .. - . - . . . - . . . __ - - - . -
9. Performing Organization Name and Address
NASA Langley Research Center Hampton, Vi 23665
.. - _ 12. Sponsoring Agency Name and Address
National Aeronautics and Space Administration Washington, M3 20546
. __ ~ .-.
15. Supplementary Notes
~ .. ~
3. Recipient’s Catalog No.
5. Report Date
May 1979 6. Performing Organization Code
8. Performing Organization Report No.
L-12729
51 7-53-1 3-04 10. Work Unit No.
11. Contract or Grant No.
13. Type of Report and Period Covered
Technical Paper
14. Sponsoring Agency Code
-_
_ _ - - _ _ . - - - - _ _ _ - __ __ - 16 Abstract
Experimental s tudies of the vibrat ion cha rac t e r i s t i c s of s t ruc tu ra l components representative of wood-frame house construction were conducted with the use of various face sheet materials. Mechanical exc i ta t ion w a s used, and measurements of acceleration response, natural frequencies, and nodal pa t te rns were performed. Results indicate tha t the wall sections and the complete wall did not a c t a s a uni t i n responding to sinusoidal vibrat ion inputs. Calculated frequencies of the components t ha t account for t h i s independent behavior of the s tuds and face sheets agreed reasonably w e l l with experimental frequencies. Experimental vibra- t ions of the plate g lass window agreed with the calculated behavior, and responses of the window exposed to airplane flyover noise were readi ly correlated with the test resu l t s .
~ . .
17. Key Words (Suggested by Authoris))
Bu i l d ing v i b r a t ions Material response
.. . - . . - ~ - . .- .- I 18. Distribution Statement
Unclassified - Unlimited
.. . -
Subject Category .. 39 - - . -
- - .
NASA-Langl ey, 1979
... I.. 19. Security Classif. (of this report) 20. Security Classif. (of this page)
- . .. - Unclassified . . . I . 50
* For sale by the National Technical Information Service, Springfield. Virginia 22161

National Aeronautics and Space Administration
Washington, D.C. 20546 Official Business
Penalty for Private Use, $300
msn
~
I Postage and Fees Paid National Aeronautics and Space Administration NASA451
THIRD-CLASS BULK RATE Q USMAIL
I
4
18 1 lU,D, 030979 S00903DS DEPT OF THE n n FORCE AF WEAPONS LABORATORY ATTN: TECHNICAL L I B R A R Y (SUL) KTRTLAYD AFB NM 87117
STMASTER: If Undeliverable (Section 158 := Postal Manual) Do Not Return:
/