vice vs. virtue investing - dgf2008.de · 1 vice vs. virtue investing 1 introduction in the past...
TRANSCRIPT

0
Vice vs. Virtue Investing
Abstract
Whether virtue investing yields abnormal positive stock returns, has been under
scrutiny for years. Academic findings on socially responsible investing (SRI) reveal
heterogeneous results for the performance of SRI indices. However, recent research
indicates an outperformance of sin stocks. Can investors then better their
performance by incorporating virtue or vice screens into their investment process?
Answering this question is the key contribution of our paper. Extending prior studies
on sin investment, we find that publicly traded companies involved in the alcohol,
gambling, tobacco, sex, arms and nuclear power industry are able to generate
abnormal returns. Employing a self-constructed worldwide index of more than 700
unethical firms, we provide evidence that the risk-return characteristics of sin stocks
are superior in comparison to regular stocks as well as socially responsible stocks.
JEL classification: G12, G19, J71.
Keywords: Socially responsible investing, Sin stocks, financial markets, indices.

1
Vice vs. Virtue Investing
1 Introduction
In the past decade, ethical or socially responsible investment (SRI) broke away from
its niche existence and became a broad-based investment approach. Socially
responsible mutual funds in particular have experienced considerable growth over
the last decade. The number of funds rose to 200 alone in the United States, where in
2005 around ten percent of the total assets under management were involved in
socially related investing1. The scope of this investment approach varies from an
investment in ethically classified companies, e.g. environment friendly, charitable
giving or profit sharing firms, to the method of avoiding investments in unethical or
“sinful” business by imposing constraints based on ethical principles.
On the other hand, there is the U.S. based Vice Fund, raising the flag for an unethical
investment approach by investing only in sinful industries such as gambling, tobacco,
alcohol and defense. Launched in August 2002 the Vice Fund has managed to
handily outperform the market2 and its one and three-year return rank in the top one
percent among more than 600 funds in the multi-cap core category of the Lipper
mutual fund research and rating service.
The performance of social investing has been examined in various forms. Recent
research studies whether SRI stock indices exhibit a different performance compared
to conventional benchmark indices mainly conclude that SRI investments do not
exhibit a different risk-adjusted return or significant outperformance3.
Studies on social irresponsible investing on the other hand are still very
straightforward. A basis for this investment approach is provided by Hong and
Kacperczyk, who find evidence that publicly traded American companies dedicated
in the industries known as the “Triumvirate of Sin” - alcohol, tobacco and gaming -
are able to generate abnormal returns and provide significant superior risk-adjusted
1 See Social Investment Forum (2006), p. 4. 2 See Vice-Fund Annual Report (2007), p. 3. 3 See Hamilton, Jo, and Statman (1993), p. 64 - 66.

2
performance. The authors conclude that, despite higher returns, financial investors
are willing to forego higher returns in order to comply with societal norms.
Assuming the role of advocatus diaboli the objective of this study is to answer the
question of the superior financial investment strategy: To invest socially responsible
or not? The paper contributes to prior research on social investing by comparing SRI
indices not only to conventional benchmarks but also to its antagonists: unethical
indices. This is achieved by comparing the main risk-return characteristics of the
most important SRI indices to a set of comparable Sin-indices consisting of publicly-
traded socially “irresponsible” stocks.
Since there is no commonly accepted definition of sin stocks, we use the screening
approaches of social investors to identify sinful firms, i.e. companies involved in the
alcohol, animal testing, weapons, gambling, nuclear power, sex and tobacco
business. The analysis is based on a set of 32 SRI stock indices and their comparable
Sin-indices during the period 1995 to 2007. Due to the set of social indices, which
cover different regions and screening approaches, and a globally constructed Sin
Index, which consists of more than 500 companies, we are able to draw general
conclusions about the performance of ethical and unethical investing. The
performance of the indices is estimated with single- as well as multi-equation
models. Furthermore, cross-sections of the indices are used to improve the quality of
the analysis.
The paper proceeds as follows: The characteristics of ethical and unethical
investment are examined in Section 2. In Section 3 we review prior research and in
Section 4 the research design and index-creation is illustrated. In Section 5 we take a
closer look at the financial characteristics of our self-constructed unethical index and
its sub-indices. Thereupon, the performance of 32 socially responsible indices is
compared to the performance of the comparable Sin-indices in Section 6. Section 7
concludes.

3
2 Ethical and Unethical Investment
2.1 Concept
This paper analyzes the financial outcome of ethical, respectively socially
responsible investments in contrast to unethical investments. Social investing
combines maximizing not only financial return but social good as well. According to
Haigh and Hazelton (2004), SRI refers to the practice of directing investment in
ways which combine financial objectives with the commitment to social concerns,
such as social justice, economic development, peace or a healthy environment4.
Usually, the process of social investing proceeds in four steps: screening, divesting,
shareholder activism and positive investing. The screening strategy evaluates
companies for social criteria like company policies, corporate governance, product
safety, human and indigenous peoples' rights or community relations, and it excludes
companies with insufficient social ratings. Divesting describes removing firms from
the portfolios of social investors due to socially irresponsible business activities.
Shareholder activism attempts to influence the company’s behaviour towards a
socially responsible course. The positive investing strategy invests in companies in
order to generate a positive social impact. Examples for this approach are the so
called micro-credits in developing countries to poor entrepreneurs, who are not
considered creditworthy5.
Judging what an unethical investment constitutes is not an easy task. First, ethical
behaviour or social concern are difficult to detect and to quantify. Second, since
everyone tends to have different attitudes towards ethical and moral questions,
“ethics” is a much disputed term. The Oxford English Dictionary, for example,
defines “ethical” as “relating to moral principles or the branch of knowledge
concerned with these”; however, the word “immoral” is defined as “not conforming
to accepted standards of morality”6. We conclude that defining “ethics” is a vague
effort at best.
4Haigh, and Hazelton (2004), p. 59. 5See Asongu (2007), p. 4-8. 6 See The Oxford English Dictionary (2004), Headwords: ethical and immoral.

4
2.2 Identification of Unethical Companies
Since there is no formal definition of sin stocks, we identify unethical firms by
adopting the excluding criteria used in the negative screening processes of the social
investors, illustrated in Table 1. As there are different kinds of criteria used by social
investors, the most common factors, namely alcohol, animal testing, gambling,
nuclear power, pornography, tobacco and weapons are considered in this research
because of their addictive, immorally or dangerous connotation.
In exceptional cases, other criteria such as child labour, production of unsafe
products or fraudulent business practices are also used. Disregarding the indices
without excluding criteria, the least applied criterion is animal testing which is used
by only 19 percent of the indices. Due to this low value and the problem of detecting
firms that test their products on animals, this criterion is not further employed in this
paper.
2.3 “Sin” Industries: a Bit of History
Alcohol has been central to social, religious and personal use throughout history7.
The ancient Egyptians brewed beer, as did pre-Columbian civilisations, where
alcoholic beverages were used for pleasure or nutrition as well as medical and ritual
purposes8. Although Egyptians did not define inebriety as a problem, they cautioned
against taverns and excessive drinking9. Until the 18th century, the attitude toward
drinking was characterized by recognition of its positive nature when consumed in a
moderate way. However, as a result of industrialization and the demand for a reliable
work force, social, personal, and moral problems were blamed on alcohol10. In the
19th century, temperance movements emerged, trying not only to prevent
drunkenness but to ban any alcohol consumption. This movement led to a total
7 See Hanson (1995), p. 3. 8 See Cherrington (1925), p. 405. 9 See Lutz (1922), p. 97. 10 See Abel (2001), p. 401.

5
prohibition in 1920, banning the sale and manufacture of alcohol in the U.S11. In the
20th century, the consideration of alcohol being a human vice was strengthened by
the detection that consumption of alcohol leads to a spectrum of harmful
consequences12.
The first records of tobacco were found in the 11th century, describing Mayans
smoking a roll of tobacco leaves tied with a string. The perception of smoking has
changed over time from a holy, sophisticated and healthy habit to a sinful, offensive
and life-threatening addiction13. Tobacco was introduced into Europe in the 16th
century for its supposed virtues as a panacea. When smoking spread across all
Europe in the 17th century, several attempts were made to restrict the use of tobacco.
An example for this is the ban on smoking in 1634 on pain of execution by the
Russian patriarch who considered smoking a deadly sin14. The deadly effects of
smoking were already shown in 1912, but it was not until 1964 that smoking was
concluded to be causally related to lung cancer by a report of the Surgeon General’s
Advisory Committee15. Thus, only in the latter half of the 20th century did tobacco,
the former darling of the social scene become antisocial not only by public health
systems.
Gambling has existed in various forms for thousands of years. The first references of
games of hazard date back to 2300 B.C. in China. The ancient Greeks and Romans
were known to bet in games of chance, although it was punished by the authorities.
During the industrialisation, the European nations developed different attitudes
towards gambling. While some nations forbid all games of hazard by law, others
allowed public gambling since it was regarded less destructive than hidden private
gaming16. The history of gambling in the U.S. is characterized by fluctuations from
prohibition to popularity. In colonial times, games of hazard were generally regarded
as illegal and considered as sinful with the exception of state and private lotteries. In
11 See Thornton (1991), p. 9. 12 See Worman (1995), p. 3. 13 See Sessa, Conte, Meroni, and Battini (2000), p. 1-10. 14 See Gilman, and Zhou (2004), p. 113. 15 See Adler (1912), p. 3-12. 16 See Giżycki, and Górny (1970), p. 50.

6
the 20th century however, the concept changed from gambling being a sin to its being
a vice. Gamblers were no longer considered fallen in the eyes of God, but as victims
of their own weaknesses17.
The rise of nuclear power as a major source of energy began in 1934, when nuclear
fission was first experimentally achieved by Enrico Fermi18. The use of nuclear
power to generate electricity began in the late 1950s and, by century’s end, more
than 16 percent of the electricity worldwide was already generated by nuclear power.
The understanding of nuclear technology being vicious is affected by the use of
nuclear weapons during World War II. Although it has always been a controversial
energy source, the movement against nuclear power first arose after the reactor
meltdown at Chernobyl in 1986. Based on the fear of a possible nuclear accident and
nuclear proliferation, the construction of new nuclear power plants has considerably
declined and several countries even started a nuclear power phase-out19.
The history of pornography is obscure because it was usually not thought worthy of
preservation. In the artwork of many societies, including ancient Greece and Rome,
erotic imagery was nothing extraordinary and frequently appeared in religious
contexts20. In the 19th century, pornography became considered as smut and so in
1857 the world's first law criminalizing pornography was enacted in the United
Kingdom to prevent the masses from divulging. Despite a change in attitude towards
pornography, legal, religious and women’s rights groups oppose pornography to
protect family values and morality in the 20th century21.
In the Neolithic period, tools were already being used as weapons. The consideration
of weapons as being sinful goes hand in hand with the pacifism movement covering
a broad range of ideas with the opposition to militarism as the common denominator.
The first genuinely pacifist movement was Buddhism, whose founder demanded
absolute abstention from any act of violence. In the 19th century, the idea inspired an
interest in general disarmament and pacifism genuinely became an expression of 17 See West's Encyclopedia of American Law (2005), Headword: Gaming. 18 See Mazuzan, and Walker (1985), p. 4. 19 See Breslow (2002), Headword: Nuclear Power. 20 See Encyclopaedia Britannica (2005), Headword: Pornography. 21 See Ross (1990), p. 244-246.

7
social ethics. Whereas pacifists are against violence in general, the rising
antimilitarism of the 20th century opposes war and argues with social and political
arguments against military tendencies22.
3 Literature Review
3.1 Socially Responsible Investment
Empirical analysis of socially responsible investment dates back to a study on a
portfolio of socially responsible companies by Moskowitz (1972)23. Since this paper,
much research has been done relating to ethical investing, however often resulting in
quite different findings.
In their paper, “The Financial Performance of Ethical Investment Funds” Mallin et
al. compare the financial performance of UK based SRI funds with that of
conventional funds and benchmark portfolios. They find that on a risk-adjusted basis
the SRI funds tend to historically underperform the market and the social funds
manage to outperform their conventional comparables. Using the Jensen, Treynor
and Sharpe ratios the authors report a modest superior performance of the social
funds24.
More advanced studies on socially responsible investing in the 21th century - as
evinced by Bauer et al. (2005) - reason that there is no significant performance
difference of socially responsible investment. In their research, Bauer et al. compare
portfolios of SRI funds with portfolios of conventional funds using Carhart’s four-
factor pricing model25. In line with further academic studies26, they conclude that
there is no significant performance gap of socially investment.
22 See Di Leonardo (1985), p. 599. 23 See Moskowitz (1972), p. 71-75. 24 See Mallin, Saadouni, and Briston (1995), p. 495. 25 See Bauer, Koedijk, and Otten (2005), p. 1767. 26 See e.g. Statman (2005) or Kreander, Gray, Power, and Sinclair (2005).

8
However in 2005, Derwall et al. yield a different overall result evaluating two equity
portfolios with unequal eco-efficiency scores. They provide evidence for an „Eco-
Efficiency Premium Puzzle” as they are able to detect an abnormal outperformance
of an eco-efficiency portfolio27. In contrast to this study, Geczky et al. (2005) explore
the costs to an investor who is uniquely invested in socially responsible funds. The
authors detect that these investors pay a price for their socially investment due to
additional costs of over 30 basis points per month as result of their asset allocation28.
However, despite increasing academic interest in the consequences of socially
responsible investing, no significant gap between social and conventional fund
performance has been detected. The hypothesis that SRI funds perform worse than
their regular comparables has therefore been rejected29.
In contrast to prior research, the research method of Schröder (2005) concentrates not
on socially responsible funds but on SRI indices. Such an approach has the
advantage that no filtering for factors such as transaction costs, management skills or
timing activities of the fund managers is needed to analyze the performance of
socially responsible equities. Applying single-factor models as well as multi-
equation models, he quantifies the performance of SRI indices. His findings confirm
prior results because the SRI indices do not provide significant outperformance and
have higher risk relative to their benchmarks. Furthermore, by conducting spanning
tests, he finds that spanning cannot be rejected for around 30 percent of the SRI
indices, indicating that about one third of the SRI indices have the same risk and
return characteristics as their market proxies30.
Statman (2005) explores in his study the characteristics of socially responsible
companies by comparing the stocks in the S&P 500 Index to several SRI indices. He
finds that the mean social scores of the SRI indices differ significantly in the
emphasis they place on social characteristics. However, the mean social scores are
reported higher for the SRI indices in comparison to the conventional benchmarks.
27 See Derwall, Guenster, Bauer, and Koedijk (2005), p. 63. 28 See Geczy, Stambaugh, and Levin (2005), p. 27-28. 29 See Schröder (2003), p. 23-25. 30 See Schröder (2005), p. 19-20.

9
Kempf and Osthoff analyze the effects of socially responsible investing on portfolio
performance using different trading strategies in 2007. They find that by following a
simple strategy of buying stocks with high social ratings and selling stocks with low
ratings, abnormal returns of up to 8.7 percent per year can be achieved31.
3.2 Sin Investment
The research on unethical investment amounts to only a few academic studies.
Merton (1987) examines the characteristics of neglected stocks. The author claims
that the higher litigation risk of these firms are the reason for the increase in the
expected returns of the stocks. Concerning tobacco companies, he illustrates why
neglected stocks are underpriced and perform better than similar companies32.
As they expected social norms against investing in “unsocial” sectors, Hong and
Kacperczyk (2005) study the effects of social norms on markets by examining an
equally-weighted portfolio of American sin stocks, i.e. companies involved in the
alcohol, tobacco and gambling industry33. They find evidence that investors pay a
price for avoiding these firms by proving significant outperformance of sinful
companies in relation to comparable stocks. Unethically stocks seem to behave like
value stocks as they provide higher expected returns consisting of a neglect effect.
In conformity with Merton, they attribute the lower valuation to the limited risk
sharing of the sinful industries. The authors find that unethical stocks outperform the
market because they exhibit less institutional ownership and less analyst coverage
compared to non-sinful stocks with similar characteristics. Pension funds, banks and
insurance companies particularly seem to avoid these companies due to social norm
pressures. Despite the ongoing increase of SRI funds, conventional mutual and hedge
funds do not share this behaviour as they are natural arbitrageurs in the market and
also buy unethical stocks if they are underpriced.
31 See Kempf, and Osthoff (2007), p. 13-14. 32 See Merton (1987), p. 499-502. 33 See Hong, and Kacperczyk (2005), p. 3.

10
The findings of Hong and Kacperczyk imply that sinful companies seem to be
disregarded because of social norms rather than the danger of litigation risk, which is
inconsistent with portfolio theory. They conclude that the aversion to these stocks is
based on a preference for following these norms rather than for economic reasons.
Olsson (2005), reports that investors who fund companies that promote human vice
get rewarded for their sinful behaviour34. The author points out that American sin
stocks behave like value stocks and were able to outperform the market in the period
1985 to 2004 by 6.84 percent per annum. Using the single-factor model he calculates
the reward for a sinful investment to 87 basis points per month. Applying the Carhart
model, this number decreases to 55 basis points. Further, the author finds evidence
that time variations in social norms have an impact on stock returns, using the
tobacco industry, for example, which has been considered sinful since the 1960’s.
The analysis reveals that this sector did not outperform the market until smoking
became a human vice. After this change in opinion, tobacco stocks started to behave
like value stocks and performed better than the market.
Kim and Venkatachalam (2006) offer further evidence on potential disadvantages of
avoiding unethically companies and explore other explanations to the disregard of sin
stocks. Consistent to prior findings, the authors exhibit that unethical stocks tend to
be larger, have lower book-to-market ratios and higher annual earnings per share.
They further find that sin stocks exhibit more persistent earnings and have accruals
that are better predictors for future cash flows. The authors conclude that, despite
superior returns and financial reporting quality, investors are willing to accept lower
returns in order to comply with societal norms35.
Salaber (2005) investigates the time-series variation on average stock returns on a
sample of European tobacco, alcohol and gaming firms. She finds that due to social
norms over the period 1975-2006, sin stocks outperform conventional stocks in
Protestant countries. Furthermore the author reports that in countries with high excise
taxation or higher litigation risk sinful investment is able to achieve abnormal
returns. Unlike previous studies tracing back the higher adjusted-returns of sin stocks
34 See Olsson (2005), p. 30. 35 See Kim, and Venkatachalam (2006), p. 7.

11
to social norms, the author provides evidence that the returns also substantially
depend on legal and cultural characteristics, namely religious preference, level of
taxation and litigation risk36.
4 Research Design
4.1 Description of the Data
The paper focuses on a set of 32 international SRI equity indices and their Sin
comparables over the period July 1995 to July 2007. The indices have been
constructed and published by 15 supplier companies, including index families such
as KLD, Kempen, ECPI, Ethibel, FTSE4Good, SNS or Dow Jones Sustainability
Indexes. The remaining SRI indices considered in this study are the ASPI, Calvert
Social Index, Jantzi Social Index, Naturaktienindex, HVB Nachhaltigkeitsindex and
JSE SRI Index. The indices cover different investment regions: seven indices cover
the global market, eight indices use the United States as investment area and 18 are
addressed to the European market, of which seven are restricted to the Euro zone
alone. The remaining indices invest in Australia, Canada, Japan, South Africa and
the United Kingdom. The maturity of the indices varies from 28 months to 145
month with average available data of 94 months. The data for the SRI indices is
mainly derived from Thomson DataStream, which provides monthly data of total
return and price indices from January 1995 to July 2007. The remaining data is
directly obtained from the supplier companies. For the performance analysis, the
official benchmark indices, chosen by the supplier companies of the SRI indices, are
applied. To test the financial characteristics of the indices, the variables of the time-
series regression SMB, HML and MOM are derived from the website of Kenneth
French37. For the risk-free rate the three month T-Bill is used.
36 See Salaber (2005), p. 3. 37 See http://mba.tuck.dartmouth.edu/pages/faculty/ken.french/index.html , as of August 8th, 2007.

12
4.2 Creation of an Unethical Index
To ensure the explanatory power and empirical correctness of the analysis, prior
approaches to investigate sinful investment have been enhanced by creating both
total return and price value-weighted indices, instead of using equally-weighted
portfolios. In an equally-weighted portfolio all firms are given the same weights,
which could result in an overestimation of the average returns since large firms have
in general lower returns than small firms38. To compare our results to the previous
research equally weighted indices have also been created.
4.2.1 Stock Selection
Based on the selection of unethically business segments we identify sin stocks from
the stock universe using the following approach. Contrary to earlier studies we do
not use the Fama and French Standard Industrial Classification Code (SIC) because
of its unfavourable selection method; for example, there is no classification of the
gambling sector. In this study, the industry classification system provided by FTSE
Group and Dow Jones Indices, the so called Industry Classification Benchmark
(ICB) is used due to more accurate search results.
The alcohol industry consists of the brewing industry, i.e. manufacturers and
shippers of cider or malt products, as well as the distiller and vintner industry, i.e.
producers, distillers, vintners, blenders and shippers of wine or spirits such as whisky
or rum. The gambling industry includes providers of gambling and casino facilities,
such as online casinos, racetracks or manufacturers of casino and lottery equipment.
Manufacturers and distributors of cigarettes, cigars and other tobacco products,
including tobacco plantations, represent the tobacco industry. The weapons industry
is represented by aerospace and defense stocks consisting of manufacturers,
assemblers and distributors of aircrafts and producers of components for the defense
industry, including military aircraft, radar equipment and weapons.
38 See Banz (1981), p. 3.

13
Since there are no sector codes for nuclear power and pornography, different
approaches are applied to identify companies involved in these sectors. To determine
firms in the pornography, respectively the sex or adult entertainment industries, the
extended business descriptions of Thomson One Banker are screened for adult and
sexual related content. To confirm the accuracy, the resulting list is completed and
cross-checked with lists from popular books on sinful investing and likewise online
sources such as the adult entertainment list provided by Hoover’s39. Stocks in the
nuclear power business are identified using different approaches. First, the
companies of the two nuclear power indices S-BOX Nuclear-Power Index and the
Deutsche Börse World Nuclear-Power Index are selected. Second, the ZKB
Kernenergie-Basket certificate provides further firms to the set of stocks, which is
then extended by a list of uranium stocks from Rohstoff-Welt.de40. Third, the
resulting list is reviewed and completed by checking for current and former nuclear
power and uranium stocks on Thomson One Banker.
To ensure the completeness, the set of selected stocks is compared and cross-checked
with the sin stocks described in popular books by Ahrens41 and Waxler42 and the
firms identified by Hong and Kacperczyk43.
4.2.2 Data for the Unethical Index
The list of publicly-traded sin firms at hand, the data for the set of stocks is mainly
derived from Thomson DataStream, which provides monthly data of stock prices,
shares outstanding, return and price indices, dividend yield, number of trades and
free-float number of shares in U.S. dollars from January 1995 to July 2007.
Since omitting dead funds can lead to overrating performance, this could also be true
for sin stocks44. To avoid this possible survivorship bias, delisted stocks are included 39 See http://www.hoovers.com/industry/adult-entertainment/companies, as of August 8th, 2007. 40 See http://www.rohstoff-welt.de, as of August 8th, 2007. 41 See Ahrens (2004). 42 See Waxler (2004). 43 A list of sin stocks can be obtained from the authors’ web-site. 44 See Brown, Goetzmann, Ibbotson, and Ross (1992), p. 555.

14
in the sample until they disappear. After cleaning the dataset, a total number of 755
stocks across 51 countries can be reported in July 2007. The set includes 188
companies in the alcohol business, 40 companies involved in the tobacco, 178 in the
defense, 139 in the gambling and 21 in the sex business. 189 companies are involved
in the nuclear power industry.
We notice a substantial increase during the last twelve years in the number of stocks.
The raise is especially noteworthy for the gambling industry, which undertook a
remarkable growth in the 1990’s due to the deregulation of the industry in the United
States. However, these numbers are to be considered with caution: Due to some
shortcomings in the data set available, especially of delisted small-cap stocks, the
completeness over the whole time-period cannot be guaranteed. The impact of these
shortcomings, though, could only affect the equally-weighted index, since the impact
of small cap firms for the value-weighted index is only of minor extent. Considering
these facts the index of sinful stocks consists of 755 firms around the world.45
4.2.3 Index Calculation Method
The Sin-indices are calculated as value-weighted indices, whose components are
weighted according to the total market value of their shares outstanding. The impact
of a stock's price change is assumed to be proportional to the firm’s overall market
value, which is the share price multiplied with the number of shares outstanding. The
weighting of each firm constantly alters with changes in the stock price and the
number of shares outstanding. Since the free-float data to calculate the shares
outstanding has only been available since May 2002, the adjustment of the free-float
had to be omitted and the float-adjusted market-value weighted indices are replaced
by full market-value weighted indices. The Sin-indices are calculated using the
Laspeyres formula:
(1)=
=
⋅ ⋅=
⋅ ⋅ ⋅
∑
∑1
0 0 01
nUSD
it it iti
t nUSD
t i i ii
base valuep q X
IndexC p q X
45 The total list of sin stocks is available from the authors.
·

15
where n = number of stocks in the index, pi0= closing price of stock i at the base
date, i.e. January 01, 1995, qi0= number of shares of stock i at the base date, pit=
price of stock i at time t, qit= number of shares of stock i at time t, Ct = adjustment
factor for the base date market capitalization, XitUSD= cross rate, i.e. domestic
currencies in U.S. dollar of stock i at time t, base value = 1000 on the base date.
Furthermore, the indices are calculated as price and total return indices to provide
more meaningful results when compared to the SRI indices. The Sin price indices
measure market price performance only, while the Sin total-return indices calculate
the performance, assuming that all dividends and distributions are reinvested.
4.2.4 Index Weightings
To show the influence of several countries on the Sin Index, the numbers of stocks
per country are illustrated in Figure 1.
The far greatest share of firms is located in the U.S. with 231 companies, followed
by 96 Australian and 76 Canadian stocks. The greatest influence is exerted by the
North American continent accounting for 41 percent of the index, followed by
Figure 1: Number of Sin Stocks per Country

Eur
stoc
Sin
exe
the
The
acc
com
The
dim
adu
ther
com
wea
rope with 2
cks, the sup
n-sector. In f
ert the great
Weapons,
e sector-we
counting for
mpanies but
e marginal
mension of t
ult film prod
refore be n
mpanies, th
apons and t
3 percent. W
periority in t
fact, only fo
test share. T
Sex and Ga
eightings pr
r 46 percen
t rather arise
influence
the sector it
ducer, the V
not include
he nuclear
obacco sect
While Cana
the weightin
or the alcoh
The U.S. co
ambling inde
resented in
nt of the Si
es from inde
Figure 2: Si
of the sex
tself, but mo
Vivid Enter
ed in the s
power sect
tors with tw
Sex0,26%
Nuclear Power46%
S
16
ada owes its
ngs of the U
hol and nucl
ompanies ac
ex-weightin
n Figure 2
in Index. T
ex heavywe
in-Index Sector
x industry,
ost of the co
rtainment G
sample. Acc
tor dominat
wo firms, wh
W
GaTobacco13%
Sector Weight
s share to it
U.S. stocks
ear sectors
ctually acco
ngs.
highlight t
This is not a
eights.
r Weightings
however,
ompanies, s
Group, are p
counting fo
tes the Sin
hich is displ
Weapons19%
Alcohol15%
ambling7%
tings
ts high amo
is not limit
the U.S. com
ount for mo
the Nuclear
a result of
is not due
such as the
private com
or six of t
n Index, fo
layed in Fig
ount of uran
ted to a spec
mpanies do
ore than hal
r Power In
the numbe
e to the sm
world’s lar
mpanies and
the ten big
ollowed by
gure 3.
nium
cific
o not
lf of
ndex
er of
mall
rgest
can
gest
the

Des
200
com
ind
the
abo
of b
The
of t
4.3
4.3
The
(19
risk
mea
the
exc
46 Th
spite the fac
07, the size
mpanies rep
dex-heavywe
index mar
out 10 perce
boiling wate
erefore - de
the Nuclear
3 Metho
3.1 CAPM
e classical C
964) and Lin
k, expected
asure the pe
benchmark
cess returns
he method use
ct that the in
e of severa
present 44 p
eight Gener
ket value. D
ent of its $1
er reactors w
spite its oth
Index.
odology
M
Capital Ass
ntner (1965
return and t
erformance
k index
of the index
ed to calculate
Figure 3: Si
ndex has a t
al firms is
percent of th
ral Electric
Despite the
60 billion in
which can b
her business
set Pricing
5) is used in
their relatio
of an index
‐ , i.e
x - :
e returns in th
Others
17
in-Index Stock
total market
underlined
he index we
are respon
e fact that G
n annual rev
be found in
s activities -
Model (CA
n this study
ons among e
x is the line
e. the return
:
his paper are si
BADiageo
Stock Weight
k Weightings
t value of 3.
by the fac
eightings. C
nsible, for e
GE's energy
venues, the
n 81 of the w
- it has been
APM) devel
y. It offers w
each other. T
ear regressio
n46 minus
imple returns.
GE
EDF
S
E
Rio TBoeingUnited
Tech.AT
tings
.400 billion
ct that the
Conglomera
xample, for
y business r
firm is the
world's 442
n included a
loped inter
widely used
The basic e
on of the ex
the risk-fre
.
BHP
Altria
Siemens
E.ON
Tintog
n U.S. dollar
eleven big
ates such as
r 12 percen
represents o
major prov
nuclear pla
as a compon
alia by Sha
d prediction
quation use
xcess return
ee rate, on
rs in
gest
s the
nt of
only
vider
ants.
nent
arpe
ns of
ed to
ns of
the
(2)

18
where R = the return on index i in month t, R = the return on a three month T-Bill
in month t, R = the return on the benchmark index m in month t, ε = an i.i.d. error
term with zero mean. The idea behind the model is that investors need to be
compensated for the time value of money and the risk the investors take. The time
value of money is represented by the risk-free rate. The second half of the formula
measures the amount of compensation the investor receives for accepting additional
risk. This risk is calculated by the use of the risk measure beta, comparing the returns
of the portfolio to the market premium Rmt- Rft over a period of time.
The intercept αi gives the Jensen’s alpha, which can be interpreted as a measure of
out- or underperformance relative to the market proxy. The alpha-coefficient
measures the abnormal return, i.e. the extra-return not explained by the exposure of
risk in reference to the benchmark47. The beta of the model βi used to analyze
relative risk, can be interpreted as a measure of the market risk exposure of an index.
According to the CAPM, a beta coefficient greater than one indicates a higher risk in
comparison to the benchmark. By definition, the market itself has an underlying beta
of one, suggesting that the index and its benchmark share the same level of risk if the
index takes a value of one. For a beta less than one, the index has a lower risk-
exposure compared to the benchmark.
To detect if socially responsible, respectively irresponsible investing leads to
different performance compared to their benchmarks, spanning tests are applied
using the approach of Huberman and Kandel48. By testing the joint hypothesis H0:
= 0 and βi= 1) the spanning test detects if an index can be directly replaced by its
benchmark. If the null hypothesis cannot be rejected, an investment in the benchmark
is equivalent to an investment in the index by risk and return.
4.3.2 Multi-Factor Model
Despite the widespread use of the single-factor model, this method’s accuracy could
be improved. Academic findings reveal an incorrectness of the model as soon as 47 See Jensen (1968), p. 391. 48 See Huberman, and Kandel (1997), p. 875-879.

19
realized returns are compared to the CAPM predictions. Therefore, the single-factor
model has been expanded to a multi-factor model, improving the explanatory power
by adding other factors that are able to affect the expected returns.
Starting with the observation that stocks with small market capitalization and stocks
with high book-value-to-price ratio have historically tended to outperform the
market, Fama and French find that by expanding the CAPM for two factors a more
descriptive and predictive model is provided. They argue that if assets are priced
rationally variables related to stock returns must proxy for the sensitivity to common
risk factors in returns. By adding a size and value factor to the CAPM, the authors
create the Fama and French three-factor model49.
Finding that small stocks have higher risk-adjusted returns than large stocks, Banz
(1981) first documented the size effect50. The premium for investing in stocks with
relative small market capitalization is represented in the three-factor model by the
factor SMB (Small Minus Big), taking into account the difference in returns between
small and big firms. A positive SMB factor is an indicator for outperformance of
stocks with a small market capitalization and vice versa. The premium for “value”
stocks, i.e. stocks with a high book-to-market ratio, is represented by the factor HML
(High Minus Low). The factor captures the return difference between stocks with
high and low book-to-market ratios. A positive HML factor hereby indicates an
outperformance of value stocks and vice versa51.
After having detected abnormal returns in portfolios sorted according to momentum
that could not be explained by the Fama and French model, Carhart (1997)
supplemented the model by adding a momentum factor (MOM) which captures the
return difference between the past year’s out- and underperformers52. This
momentum anomaly was detected by Jegadeesh and Titman, who show that by
taking a long (short) position in well (poorly) performing stocks, depending on the
performance over the previous 12 months, abnormal returns can be achieved53. The 49 See Fama, and French (1993), p. 3–56. 50 See Banz, (1981), p. 3. 51 See Fama, and French (1995), p. 133. 52 See Carhart, (1997), p. 57. 53 See Jegadeesh, and Titman (1993), p. 67.

20
momentum coefficient illustrates the exposure of the asset to trends in returns. One
positive factor is an indicator of an outperformance of stocks with high prior returns
and vice versa. The factor itself is calculated by deducting the average return on two
high prior return portfolios from average returns on two low prior return portfolios.
The resulting Carhart 4-factor model leads to the following time-series regression,
explaining the excess returns on a portfolio i by the equation:
R R α β MKT β SMB β HHML β MMOM ε (3)
where MKT = the market return minus the risk-free rate at time t, SMB = the return
difference between a small cap portfolio and a large cap portfolio at time t,
HML = the return difference between a value and growth portfolio at time t,
MOM = the return difference between a portfolio of past years winners and a
portfolio of past years losers at time t.
The model can be interpreted as a performance attribution model in which the
coefficients indicate the proportion of average return attributed to the four
abnormalities. Similar to the CAPM the slopes in the multiple regressions are
represented by the β-coefficients of MKTt, SMBt, HMLt and MOMt, illustrating the
exposure to market, size and value risk as well as trends. Due to the new added
factors the betas - akin to the CAPM - will have different values compared to the
single-factor model. In the Carhart-model, the α-coefficient gives that part of the
index returns that cannot be explained by overall market performance, the effects of
size, value and momentum.
4.4 Procedure
4.4.1 Univariate Time Series Modelling
The parameters of estimations are tested by using the Ordinary Least Squares (OLS)
estimator. Before the estimation begins, unit root tests are performed for each series
of excess returns as non-stationary time series can cause substantial problems with
regression models. The term “stationary” implies that the series do not have a
constant mean, i.e. a mean that does not vary over time. Those series that are found

21
to be non-stationary are excluded from the set of observations. The tests are carried
out using the Augmented Dickey Fuller test, which tests for a unit root that includes
lagged chances of the variable as regressors.
Using the Newey-West approach, the residuals are corrected for autocorrelation and
heteroscedasticity by adjusting the standard errors. Applying the Durbin-Watson
approach, the fitted residuals are tested for autoregressive properties54. Finally, the
relation of the coefficients has been tested using the Wald-Coefficient-Test.
4.4.2 Multivariate Time Series Modelling
In equilibrium models such as the CAPM, it is desirable to model the joint behaviour
of multiple time series. Since single- and multi-factor models imply parameter
restrictions, possible efficiency gains - due to the joint estimation of a system of time
series models - can be achieved. Unlike multivariate models, univariate models
cannot capture complex interactions between the variables or the error structure
across models. Instead of estimating the model separately for each index and its Sin-
counterpart, the equations are grouped in a system and estimated jointly55.
Additionally, it is possible in a system of equations to restrict certain coefficients to
be the same across equations56.
At the outset, all model equations for the SRI and Sin-indices form a system of
equations whose parameters are not restricted. Then groups of indices form separate
systems whose procedure provides a more detailed look at how SRI and Sin-indices
perform when compared to their benchmarks. In each system, the constants are also
tested for equality in order to be able to answer the question of difference in
performance of SRI and Sin-indices. The parameters are tested using the Seemingly
Unrelated Regression (SUR) estimator because this estimator, contrary to the OLS
estimator, is also efficient in a system with an unequally number of observations.
54 See Newey, and West (1987), p. 703-708. 55 See Greene (2002), section 15.4. 56 For a more detailed discussion see Greene (2002).

22
Moreover, problems such as heteroscedasticity and cross-sectional correlation are
reduced57.
Even though the SUR estimator has been used, the residuals are worth looking at.
The residuals of each regression are tested for autocorrelation using the Breusch-
Godfrey test of residual autocorrelation. The number of lags included is twelve58, as
it seems reasonable that the returns of today may be dependent on last year’s returns,
but not much on returns dating further back in time. For the series to be found auto-
correlated, the corresponding equation is excluded from the system.
4.5 Performance Measurement
The performance of the indices is analyzed using three performance measures,
combining risk and return performance into a single value to evaluate the indices.
4.5.1 The Sharpe Measure
The Sharpe, or reward-to-variability ratio quantifies the return earned in excess of the
risk free rate to the portfolio's total risk measured by the standard deviation in its
returns over the measurement period59. The higher the Sharpe index, the better the
performance. The Sharpe ratio constitutes an appropriate measure of performance for
an overall portfolio particularly when compared to another index:
i fi
i
µ RSσ−
= (4)
where S = the Sharpe performance index, σ = the standard deviation of the returns,
µ = the portfolio annualised mean return and R = the risk-free interest rate.
57 See Zellner (1962), p. 501. 58 As proposed by Greene (2002). 59 See Sharpe (1966), p. 121.

23
4.5.2 The Treynor Measure
The Treynor ratio quantifies the excess return to non-diversifiable risk since it
describes the ratio of a portfolio's average excess return in comparison to beta of the
portfolio. The ratio measures the returns earned in excess of those that could have
been earned on a riskless investment per unit of market risk assumed60:
i fi
i
µ RTβ−
= (5)
where = the Treynor performance index and = the beta of the portfolio. The
higher the Treynor index, the better the performance under analysis. The Sharpe and
Treynor ratios seem similar but differ in so far as the Treynor ratio uses the beta
instead of the standard deviation. Like the Sharpe ratio, the Treynor ratio is a ranking
criterion only. In general, the Sharpe ratio is more appropriate for well diversified
portfolios and the Treynor ratio for individual assets.
4.5.3 The Jensen Measure
Jensen's alpha, an alternative method of performance measurement and ranking
indices, quantifies the added return as the excess return above the security market
line in the capital asset pricing model. The alpha reflects the difference between a
portfolio's actual return and those that could have been achieved on a benchmark
portfolio with similar risk. Caveats apply, since it will only produce convincing
results if it is used to compare two portfolios holding similar betas. Is the α-
coefficient positive, the portfolio earned excess returns and was able to outperform
the market in the analyzed past61. The alpha coefficient can be interpreted as the part
of the excess returns that can be attributed to its being an SRI or Sin-index. If the
index outperforms its benchmark, the alpha should be significantly greater than zero,
but respectively smaller when they underperform the benchmark.
60 See Treynor (1965), p. 65. 61 See Jensen (1968), p. 391.

5
5.1
Tak
wei
and
The
hig
The
loca
A l
for
exp
rep
mea
Fig
Wo
to b
una
200
hig
Sinful
1 Sin-In
king a look
ighted total
d a standard
e compariso
her volatilit
ese favoura
ated below
look at the
the adjust
plained by it
resents the
asure of how
gure 4 illus
orld. The low
be a steady
able to keep
01; in partic
her returns.
5
10
15
20
25
30
35
Investm
ndex
at the Sin
-return Sin
d deviation
on to the M
ty of the ret
able characte
one, sugges
output of th
ted R², sug
ts risk expo
proportion
w well the r
strates the
w volatility
y performer
p pace with
cular, at the
. The Sin In
0
50
00
50
00
50
00
50
1995 1996 1
ment A
Index analy
Index prov
of 12.4 per
MSCI World
turns.
eristics are
sting a lowe
he single re
ggesting th
osure, as me
of variabilit
regression l
Figure 4:
historical e
y of the Sin
r in both pr
h the MSCI
e climax of
ndex started
1997 1998 1999
MSCI
24
nalysis
ysis we obt
ides an ann
rcent, illust
d implies th
strengthene
er risk than
egression re
hat around
easured by b
ty accounte
ine approxi
: Chart of the
excess-retur
Index is no
rosperous an
I World un
f the bubble
d to catch up
9 2000 2001 20
I World
tain the foll
nual mean ex
trated in co
hat the highe
ed by a beta
the market
eveals a rela
65 percen
beta. The co
ed for by the
imates the re
Sin-Index
rns of the
oteworthy a
nd hard tim
ntil the end
e in 2000, t
p with the m
002 2003 2004
Sin‐Index
lowing resu
xcess return
olumn 2 and
er returns a
a of 0.74, w
proxy.
ative small
nt of the p
oefficient of
e model as i
eal data.
Sin Index
as it indicate
mes. The sin
of the dot-
the MSCI W
market inde
2005 2006 20
x
ults. The va
n of 6.7 perc
d 3 of Tabl
are not due
which is cle
value of 0.
performance
f determina
it is a statist
and the M
es the tende
nful index
-com bubbl
World provi
ex at the en
007
alue-
cent
le 2.
to a
early
.646
e is
ation
tical
MSCI
ency
was
e in
ided
d of

25
2001 and since 2004 the index constantly reveals higher returns with only few
exceptions.
Looking at the performance, we find that the Sin Index was able to outperform the
MSCI World in all three performance ratios. The positive monthly Jensen’s Alpha of
0.18 percent shows a slightly better performance albeit without statistical evidence.
Also the Sharpe and Treynor-ratios provide evidence that the Sin Index is able to
beat the market since the performance measures report greater values when
compared to the market proxy, illustrated in column 7 and 8 of Table 2.
The outcomes of the estimated parameters of the four-factor model are presented in
Table 3. A closer look reveals a slight increase for the adjusted R² to 0.664
confirming the incremental explanatory power of the multivariate framework. The
Sin Index earned an average factor-adjusted return of 0.05 percent per month,
although without statistical significance. The additional determinants of the Carhart
model SMB, HML, and MOM report significant loadings only for the HML factor.
The significant positive loadings on HML suggest that the index is somewhat tilted
toward value stocks during the period examined. This value premium is consistent
with the relatively low price-to-book ratio for the sinful firms. The SMB and MOM
factors do not lead to a conclusive statement due to relatively poor significances.
However the loadings on the MOM factor imply a modest impact of trends.
In summary, sin stocks tend to be recession proof, have a blend of small and large-
cap stocks, behave like value stocks and are less prone to the cyclical fluctuations of
the economy. For example, gambling, tobacco and alcohol are all habit-forming
activities, performed regardless of economic conditions. For instance, when the
MSCI World fell 20 percent between 2001 and 2002, tobacco stocks rose 8 percent
and even gambling stocks 20 percent over the same period. To examine these
findings, we take a closer look to the sector indices in the next section.

5.2
The
in t
The
exc
and
from
dev
ach
ind
hig
The
0.0
sec
of
pro
Tab
incr
hig
an
2 Sector
e six sub in
the same wa
e risk-return
cess returns
d Alcohol in
m 0.093 of
viation can b
hieved by th
dices with th
h independe
e adjusted R
7 for the T
tors with lo
over 0.8 fo
ovide betas u
ble 4 provi
remental ex
her adjusted
adjusted R
‐30%
r Sin-In
ndices provi
ay, summari
n character
are reache
ndices. The
f the Weapo
be detected
he Tobacco
he MSCI W
ence of the
Figure 5: R
R² takes rela
Tobacco Ind
ow betas of
or the Nucl
under one, i
ides an ove
xplanatory
d R², with t
R² of only
13
17,7%
20,1%
19,0%
15,8%
18,7%
12
‐25% ‐20%
dices
ide differen
ized in Tab
ristics are d
ed by the W
e annualized
ons Index t
by the alco
Index with
World are bel
sector indic
Risk/Return C
ative small
dex. The β
around 0.4
lear Power
illustrates th
erview of t
power of
the exceptio
15 percen
3,5%
%
11,6%
2,4%
‐15% ‐10%
Weapo
Tobacc
Se
Nuclear Pow
Gamblin
Alcoh
S
Standard Dev
26
nt results, sin
le 2.
displayed in
Weapons Ind
d mean exc
to 0.031 of
ohol sector w
20.1 percen
low 0.52 fo
ces in comp
Characteristics
values betw
β-coefficient
for the Alc
and Weap
heir low risk
the estimat
this multiv
on to the Se
nt, which h
‐5% 0%
MSCI
ns Index
co Index
ex Index
wer Index
ng Index
hol Index
Sin‐Index
viation
nce not all
n Figure 5,
dex, follow
ess-returns
f the Sex In
with 11.6 pe
nt. The corr
or every sing
parison to th
of the Sector S
ween 0.56 f
ts reveal a
cohol and T
ons indices
k exposure.
tions on th
variate fram
ex Index. T
has in prio
6,2%
9,3%
6,7%
3,1%
7,2%
6,2%
6,7%
6,7%
5% 10%
Excess Re
Sector Sin-
showing th
wed by the N
of the sect
ndex. The l
ercent; the h
relations of
gle index, w
he market pr
Sin-Indices
for the Nuc
discrepanc
Tobacco ind
s. That the
he four-fact
mework is
he Tobacco
or research
15% 20% 2
eturn
-indices beh
hat the hig
Nuclear Po
or indices v
owest stand
highest valu
f the sector
what indicat
roxy.
lear Power
cy between
ices and va
Sector ind
or model.
confirmed
o Index reac
h already b
25% 30%
have
hest
ower
vary
dard
ue is
Sin-
tes a
and
the
alues
dices
The
d by
ches
been

27
detected62. After adjusting for a multivariate framework, still no significant Carhart-
alpha coefficients appear. Besides the Nuclear Power Index, smaller average factor-
adjusted returns are reported for every index. The α-coefficients for the Alcohol and
the Sex indices even report negative values, indicating an underperformance relative
to the benchmark, albeit with low statistical significance. The factor loadings on the
additional determinants - SMB, HML, and MOM - vary over the indices. The
loading on the SMB factor is significant negative for the Nuclear Power Index,
implying a bias towards large-cap stocks. The Alcohol, Weapons and Gambling
indices report positive significant factor loadings, indicating a bias towards small-cap
stocks of these indices. The significant positive factor loadings on HML suggest that
the Alcohol, Tobacco and Weapons indices have been somewhat value-stock
oriented during the period examined. We also observe a significant negative loading
on the MOM factor for the Gambling Index, suggesting that gambling stocks are not
active in cyclical businesses. As for the factor loadings, the results confirm that there
are significant differences in styles or risk sensitivities between the different sectors.
Depending on the measure used, the performance comparison shows different
results. Summarized for the Alpha and Treynor measures, five of the six sector-
indices perform better than the MSCI World and only the Sex Index is
underperforming the benchmark. The Sharpe-ratio reveals an underperformance for
the Gambling, Nuclear Power, Tobacco and Sex indices. Historically, the alcohol
sector stands out as the best performing sector, followed by the weapons and tobacco
sectors. In contrast to this, the sex sector swayed around its starting value till 2006
and is the worst performing index from every point of view.
5.3 Regional Sin-Indices
In this section we take a look at regional Sin-indices with the U.S., the world except
the U.S., Europe and the Euro zone, the United Kingdom, Canada, Australia and
Japan as investment universe. To be able to draw meaningful results, we use the most
common and fitting conventional indices to analyze the regional Sin-indices.
62 See Hong, and Kacperczyk (2005), p. 9.

To
Wo
500
Sin
Eur
for
Aus
ben
Reg
per
vol
ach
foll
Sin
con
wit
Figure 6:
compare th
ord Index. H
0 as benchm
n Index with
roStoxx. Th
the Japane
stralian Sin
nchmarks is
garding the
rcent. The i
atility of t
hieving a ne
lowed by th
n Index, ind
nventional i
th the excep
21
28,6%
22,3
2
‐30% ‐25
: Risk/Return
he U.S. inde
However, th
mark. The E
h the Euro
he FTSE Al
ese, the S&P
n Index. A g
presented i
excess retu
ndex thoug
the returns.
egative retu
he Australian
dicating a l
indices, the
ption of the
16,8%
1,3%
19,2%
3%
20,1%
13,6%
15,2%
18,6%
20,8%
15,5%
17,1%
14,0%
13,5%
14,6%
14,1%
5% ‐20% ‐1
Characteristic
ex with the
he analysis
European Sin
zone as in
ll Share serv
P TSX 60 f
graphical ris
in Figure 6.
urns, the Can
gh pays a p
. The Japa
urn of 0.4.
n Sin Index
low volatili
e Sin-indice
Australian
%
%
%
%
15% ‐10%
S
Sindex A
Sindex
Sinde
Si
DJ Eu
Sind
Sin
Sinde
Si
Standard Devia
28
cs of the Regio
e global ind
of U.S. ind
n Index is c
nvestment r
ves as benc
for the Can
sk-return co
.
nadian Sin I
rice for its
anese index
The Canad
x; the lowest
ity of the r
es reveal hi
Sin Index.
‐ 0,
‐5% 0%
S&P ASX
Australia
S&P TSX
x Canada
Nikkei
ex Japan
FTSE
ndex UK
uroStoxx
dex Euro
DJ Stoxx
ndex EU
S&P 500
MSCI
ex ex US
index US
ation
nal Sin-Indices
dex except t
ex alone is
compared to
region is co
hmark for t
nadian and t
omparison o
Index stand
returns as
x reaches t
dian index
t standard d
returns. In
gher excess
These high
1
‐ 3,2%
,4%
7,9%
8,2%
7,9%
9,0%
6,8%
8,3%
7,6%
6,2%
6,6%
7,9%
5% 10%
Excess
s and their Ben
the U.S. we
performed
o the DowJo
ompared to
the British,
the S&P AS
of the Sin-in
ds out with a
it reports a
he lowest
has the hig
deviation pr
comparison
s returns fo
her returns
12,6%
11,0%
12,4%
13,2%
%
15% 20%
Return
nchmarks
e use the M
using the S
ones Stoxx,
the DowJo
the Nikkei
SX 200 for
ndices and t
a value of 1
also the hig
excess retu
ghest volat
ovides the U
n to the fit
or every ind
are mainly
25% 30%
MSCI
S&P
, the
ones
225
r the
their
3, 2
hest
urns
tility
U.S.
tting
dex,
due
%

29
to higher standard deviations, except the Japanese Sin Index, which reports a lower
volatility than the Nikkei 225 index.
The single-regression model reveals no significant Jensen’s alpha for the Sin-indices,
illustrated in Table 5. The adjusted coefficient of determination of the Sin-indices
alters between 0.38 for the Canadian and 0.74 for the Australian index, indicating
that 74 percent of the performance of the Australian index is explained by its risk
exposure. The beta-coefficients are below one for every index besides the Australian
Sin Index, indicating a higher risk for this index when compared to the Australian
S&P ASX. Due to insufficient data for the regional variables of the four-factor
regression, an analysis on the factor loadings had to be omitted.
The performance comparison between the sinful and conventional benchmarks
reveals different results. Using the Jensen’s alpha as performance criterion, every Sin
Index apart from the Australian is able to outperform its benchmark. The Treynor
measure confirms these findings as it reports only for the Australian index lower
ratios. The Sharpe ratio, however detects an underperformance also for the British
and Canadian indices.
The comparison between the global Sin Index except the U.S. and the U.S. Sin Index
reveals an unambiguous winner with the U.S. Sin Index, which outperforms its
counterpart in every performance measure. The lower standard deviation, higher
abnormal return and lower beta-coefficients of the American index are the reasons
for this. Table 6 displays the estimations of the Carhart-model, illustrating different
loadings for the two indices. While the U.S. index has significant negative loadings
on the SMB factor, implying a bias towards large capitalization stocks, the non-U.S.
index has significant positive loadings, indicating a bias towards small-cap firms.
The factor loadings on HML suggest a value orientation of the non-U.S index.
5.4 Equally-Weighted Sin-Indices
To examine whether our results are sensitive to the index weighting scheme and to
compare the results of this paper to prior findings on sinful investment, we also form

30
equally-weighted indices. The results achieved are similar to those obtained by
value-weighted indices, albeit the results tend to differ in the significance of the
coefficients. The excess returns and standard deviations are persistently higher and
the standard deviations provide lower outcomes for the global and U.S. Sin-indices,
illustrated in Table 7. Furthermore, all three performance measures reveal an over-
performance of the equally-weighted indices in comparison to the Value Line
Arithmetic Index, which serves as a suitable market proxy63.
The results nevertheless change somewhat if - adopting the approach of Hong and
Kacperczyk - only the sectors gambling, alcohol and tobacco are used. The
performance measures for the U.S. Triumvirate Sin Index, i.e. a Sin Index created
with alcohol, gambling and tobacco stocks, reveals outperformance for the Jensen
and Treynor-measures, but not for the Sharpe ratio. A closer look at the factor
loadings of the multifactor model puts prior results into perspective. Using the
equally-weighted index, the alpha value of the global Sin Index provides a significant
abnormal return of 0.5 percent, the equally-weighted U.S. Triumvirate Index, though
used in prior research, has a p-value of only 0.32, indicating that the α-coefficient is
not significant64. The greater amount of companies used to form the equally-
weighted index, the different selection method and the longer timescale of our index
are the influencing factors here.
A closer look at the equally-weighted sector Sin-indices reveals similar results
compared to the value-weighted index, illustrated in Table 8. Besides the Sex Index,
all sector indices outperform the Value Line Arithmetic Index. Confirming
expectations, the factor loadings on the SMB factor are highly significantly positive
for most of the indices, implying a bias towards small-cap stocks for all Sin-indices
with exception of the Tobacco Index. The significant negative loading on the MOM
factor for the Sex Index suggests that sex stocks do not follow cycles.
63 The CSRP index, used in prior research, was replaced by the Value Line Arithmetic Index,
representing an appropriate benchmark for the global equally-weighted indices. 64 This result is also true for the CSRP index.

31
6 SRI versus Sin Investing
6.1 Preliminaries
The aim of this section is to detect the superior investment strategy between socially
responsible and irresponsible investing. We investigate the differences between SRI
indices and their sinful comparables, including the measurement of risk as well as
performance comparisons. The performance tests are separately conducted for the
SRI and Sin-indices as well as for groups of indices.
The 32 SRI indices are sorted by their investment regions, compared with
benchmarks, which are determined by their provider companies, as well as to
comparable Sin-indices. Only for the JSE SRI Index the comparable sinful index
with the same investment region has not been used, due to unfavourable
characteristics of the South African Sin Index consisting of only six companies
within two Sin-sectors. Therefore, the global Sin Index provides an adequate
replacement for this index. Almost all SRI indices are performance indices and
thereby compared to performance Sin-indices, with exception to the DowJones and
HVB price indices, which are compared to the price Sin-indices.
To avoid a bias of double-counting similar SRI-indices such as the four DowJones
SRI-indices, which exist with and without the sectors gambling, tobacco, alcohol and
weapons, an adjusted set of 26 SRI-indices has been created in addition to the
complete list of 32 indices. Besides the DowJones, also the ESI Excellence Global
and KLD Large Cap indices are excluded to draw objective conclusions. Several
problems pointed out by the statistical tests justify these exclusions. Problems such
as multicollinearity, resulting from high correlation between the indices of the same
provider, for example, the DJSI World and the DJSI World ex TAGFA (Tobacco,
Gambling, Alcohol, Firearms and Armaments) with a correlation of 99.9 percent, can
be avoided with to this procedure.

32
6.2 Risk-Return Characteristics
The analysis of the excess returns reveals that 50 percent of the SRI indices have
higher returns than their benchmarks. In comparison to the conventional indices, the
Sin-indices provide higher returns in 84 percent of the cases, illustrated in Table 9.
Revealing higher excess returns for 75 percent of the indices, the vice investment
turns out to be the superior investment strategy in comparison to virtue investing.
This result remains unchanged when the adjusted list of indices is used; however, the
supremacy of the Sin-indices diminishes slightly to a percentage of 65 percent. The
mean excess return adds up to 0.094 for the conventional indices, 0.101 for the social
and 0.107 for the sinful indices.
Since a higher mean return might only be a result of higher risk-exposure, the
standard deviations have also been analyzed. The standard deviations of the SRI
indices are in 84 percent of the indices higher than values of the benchmark indices,
indicating a higher volatility of the socially responsible indices returns. The Sin-
indices achieve a balanced result with 16 higher and 16 lower coefficients compared
to the conventional indices. The sinful investment strategy, with its lower risk-
exposure, is here again the better financial strategy with a slim majority of 66 percent
of the indices. Regarding the adjusted list, the results do not vary by more than one
percent. The mean standard deviations report the lowest mean for the conventional
indices with volatilities of 14.9 percent, followed by the Sin-indices with 15.3
percent and the SRI-indices with 16.3 percent.
6.3 Results on Standard Regression
6.3.1 Single-Factor Regression
The results of the single regression are summarized in Table 10. As columns 2 and 3
report, there are seven significant Jensen’s alphas for the SRI indices comprised of
four positive and three negative coefficients and also five positive abnormal returns
for the Sin-indices. The detailed analysis of the α-coefficients follows in Section 6.5.

33
Regarding the β-coefficients, the 32 SRI indices reveal for 66 percent of the indices
coefficients which are greater than one, illustrating a higher exposure to market risk
of these indices. The maximum value of 1.235 is reached by the Calvert Social
Index, implying a movement of 1.235 for this index, while the Russell 1000 performs
a movement of one. The Sin-indices, on the other hand, provide only for the
Canadian and the Australian indices coefficients greater than one, indicating that the
Sin-indices carry only for 6 percent of the indices a higher risk compared to the
conventional benchmark. A comparison between the SRI and Sin-indices also reveals
only for these two indices greater betas for the Sin-indices than for the SRI-indices,
implying less risk of the Sin-indices for 94 percent of the indices. Using the adjusted
list of indices, the results remain largely unchanged; only the percentage of superior
Sin-indices decreases to 92. The analysis of the mean β-coefficients of 1.03 for the
SRI and 0.79 for the Sin-indices confirm the prior finding that Sin-indices carry less
risk than the SRI indices.
The adjusted coefficient of determination of the SRI indices amounts to a mean
coefficient of 0.87, indicating that 87 percent of the performance is explained by its
risk exposure. The sinful comparables indicate with a value of 0.59 percent a smaller
capture of the variation. The generally high values for the SRI indices indicate that
the majority of the indices can be basically approximated by the benchmark indices.
Due to lower coefficients, this is only partly true for the Sin-indices.
In the next step spanning tests have been performed to examine if the investment
strategy of the SRI and Sin-indices significantly differs from the strategy of the
benchmark. The test reveals that 17 of the 32 SRI indices and four of the Sin-
benchmarks can be replaced by their benchmark since investing in the benchmark is
equivalent to invest in these indices without differences in risk or return. The
adjusted list reveals that 50 percent of the SRI indices as well as twelve percent of
the Sin-comparables do not pass the spanning test. The reason for the rejection in
most cases is based on the difference of the relative risk compared to the benchmark.
These indices exhibit in almost every case the same adjusted return but higher betas.

34
6.3.2 Multi-Factor Regression
Table 11 shows the estimates resulting from the four-factor model and reports
several prominent differences towards the results of Table 10. First, the adjusted R²
from the models have increased with only few exceptions, confirming the
incremental explanatory power of the multivariate framework. We see that the
adjusted R² is substantially higher for the SRI indices than for the Sin-comparables,
indicating that there are more factors driving the performance of the SRI indices.
Seven out of 32 SRI indices reveal significant Carhart alpha-coefficients, indicating
positive average factor-adjusted returns. In comparison to the single regression
model, we detect only one significant negative coefficient for the FTSE4Good
Europe; also the percentage of positive coefficients increased to 86 percent. The
average factor-adjusted returns of the Sin-indices shrinks to only three significant
values of which two have positive factor loadings. In line with the outcomes within
the CAPM framework, the SRI indices do not significantly differ in exposure to
market risk, since the indices reveal for one half of the indices coefficients greater
than one. Note that the average percentage of β-coefficient below one increased from
38 percent to 54 percent, indicating a lower exposure to market risk. Using the four-
factor model, the distribution of the sinful betas remains unchanged.
Comparing additional factors, we find some interesting insights and report several
prominent differences between social responsible and irresponsible investing, as
illustrated in Table 12. First, the loadings on the SMB coefficients report significant
values for twelve SRI indices and nine Sin indices. The significant negative factor
loadings in 70 percent of the adjusted social list imply a modest bias towards large
capitalization stocks of the social indices. The sinful comparables, however, report
significant positive factor loadings, which indicates an outperformance of stocks with
a small market capitalization. The factor loadings on HML suggest that the social
indices were somewhat growth-stock oriented during the examined period since the
loadings are negative for all eleven significant factors. With 17 significant positive
factor loadings, however, the sinful counterparts report the diametric opposite,
indicating a significant positive impact of value stocks. The difference between the
investment approaches also exists for the momentum factor. On the virtue side, there

35
are six significant negative factor loadings for the responsible indices, implying that
the indices are not active in cyclical businesses. On the vice side, we detect seven
significant positive MOM factor loadings for the Sin indices, suggesting an
outperformance of stocks with high prior returns.
6.4 Results on Index Groups
In this section, groups of SRI indices are analyzed to increase the quality of the prior
parameter tests. The tests are conducted using the information in the cross-section of
the SRI and Sin-indices and by estimating a system of equations to overcome
restrictions that stem from the short history of available data series for many of the
SRI indices65.
6.4.1 Different Time Series
The first groups are constructed with regard to the length of the available time series
illustrated in Table 13. The five groups are defined according to three different time
intervals, including a full and long-term time period (twelve and ten years), a
medium-term (eight years) and two short time periods (six and four years). An index
is included into a group if the time series is at least as long as the period under
consideration66.
The groups of different time-series are relatively heterogeneous, since they include
indices that differ in the screening approach and their investment region. Therefore
the analysis should provide representative results for socially responsible investment,
in particular. Column 4 in Table 13 summarizes the results of the Chi-square-test
statistic for the joint tests of the Jensen’s alpha. The results of the single-factor model
extend the results of the single equations, revealing significant alpha-coefficients for
the SRI-indices for every time-interval. The sinful counterpart groups report similar
65 N.B.: These tests make a statement only about the existence of different performance, but not if this difference is of a positive or a negative nature.
66 To achieve sound results, the adjusted list of indices is used due to problems of multicorrelation.

36
findings regarding the abnormal returns, with exception of the three indices forming
the full-term group which does not differ significantly from zero. The results for the
joint test of the beta are reported in column 5, displaying similar results for both SRI
and Sin-indices. Confirming the findings of the prior tests, the beta-coefficients for
every group deviate significantly from one. The outcomes of the joint spanning tests
describe a homogeneous picture. For every group of social responsible and
irresponsible investment the spanning tests can be rejected, indicating that the groups
do not hold the same risk and return characteristics than their benchmarks. Using the
multi-factor model, we observe a slight change in the outcomes of the α–coefficients,
illustrated in column 7. Due to the implementation of the additional four factors to
the model, we are able to improve the robustness of the analysis.
The multi-factor model confirms the results achieved by the single-factor model,
with exception of the full-term group of twelve year old Sin-indices, which hereby
report also a significant alpha-coefficient. In summary, the joint significant tests on
different time series reveal only few differences in the degree of the coefficients
between the ethical and unethical approaches.
6.4.2 Different Index Families
In this section, we concentrate on the effects of the specific screening methods used
by suppliers of socially responsible investing. Table 14 presents six groups formed
by different index families, such as the DowJones Sustainable Index or the
FTSE4Good Index families. The estimations refer to the longest available common
time-period for which the data is available. Contrary to the previous time-series
groups, the groups of SRI index families are homogeneous. The indices within the
groups, therefore, vary mainly because of the investment universe and not of their
screening approach. For the ECPI and FTSE4Good families, the estimated alpha-
coefficients significantly differ from zero and - using the multi-factor model - also
the KLD family joins this list. The set of the Sin-comparable groups reports
significant values for three groups, but this list decreases to the FTSE4GOOD Sin-
comparable, which uses the multi-factor model. The spanning tests are not rejected
only for the ESI and SNS index families, suggesting that - besides these two families

37
- the groups cannot be replaced by their benchmarks. As for the sinful counterparts,
this statement is only true for the FTSE4Good sinful comparable group. The results
suggest that the investment methods of the social investors are not always
comparable among each other, as some social index providers are able to achieve
significant alpha-coefficients and some are not. In conclusion, the comparison
between the families reveals more significant abnormal returns for the SRI-index
providers with respect to the sinful counterparts and a difference in the spanning only
for the SNS index family.
6.4.3 Different Investment Regions
Here we focus on impacts of different investment regions on the results of ethical
and unethical investment. To investigate these effects, we have created five groups of
indices with a global, U.S., Euro zone, Europe or the United Kingdom based
investment universe. Table 15 summarizes the results for the five groups, illustrating
significant outperformance of the European and in the Euro zone invested SRI
indices for the single-factor model. This list is completed by the American SRI
indices, which reveal significant values using the multi-factor model. The single-
factor model of the Sin-indices, however, provides significant alphas for the U.S.
American, European and the British indices. This list, however, is reduced to the
American Sin Indices when the multi-factor approach is applied. The spanning tests
are rejected for every investment region for the ethical and unethical groups,
indicating that the indices cannot be directly replicated by benchmarks of the same
investment region. Historically, it seems that the U.S. and the Euro zone SRI indices
have a significantly different performance in contrast to their counterparts.
Summarizing our results for this section, the joint coefficients tests on different time-
series reveal that several socially responsible and irresponsible indices are indeed
able to exhibit significant out- or underperformance in comparison to conventional
benchmarks. This result is also true for some of the index providers and several
indices limited to a specific investment universe. Generally, the SRI indices are more
often able to generate significant alpha values than their sinful comparables. We note

38
that except with some index families, the indices cannot be replaced by their
benchmark.
6.5 Performance Measurement
The following section reports the results of the performance estimations on the SRI
indices and their sinful counterparts, illustrated in Table 16.
The first performance measure used is the Jensen’s alpha, representing the excess
return that cannot be explained by the risk exposure of the index with respect to its
benchmark. The monthly α-coefficient of the SRI indices compared to the
conventional benchmarks report in 56 percent of the indices values larger than zero.
The Sin-indices however provide an outperformance in 91 percent of the cases. The
comparison between the ethical and unethical investment approaches reveals higher
abnormal returns in 28 cases or at 88 percent of the Sin-indices, indicating a superior
performance of the socially irresponsible indices. These findings change only slightly
when the adjusted list of indices is employed. The outperformance of the Sin-indices
over the SRI indices reduces to 85 percent. The average monthly alpha amounts to
0.0003 for the SRI indices, indicating a minimal average outperformance of the SRI
indices. The mean monthly Jensen’s alpha for the sinful comparables is 0.0027 and
consequently takes a value greater than zero. The results though are for almost every
case not significantly different from zero, indicating that the performance of most of
the indices does not deviate systematically from their conventional benchmark
indices.
The results of the Treynor-measure confirm the prior findings on the performance
of the investment approaches. The Treynor ratios of the SRI-indices compared to
their official benchmarks demonstrate a slight outperformance for 53 percent of the
indices. The Sin-indices are once more able to outperform the conventional indices in
91 percent. The competition between the opposite social indices results in a clear
winner in the unethical indices, which outperform the ethical indices in 88 percent of
the cases. Similar to the Jensen measure, this value decreases to 85 percent if the
adjusted list is applied. The remaining results stay mainly unchanged; only the

39
outperformance of the Sin-indices decreases slightly from 91 to 88 percent. The
average value of the adjusted Treynor list is 0.0078 for the market indices and 0.0080
for the SRI-indices, indicating a comparable performance. The average ratio for the
sinful indices comes to a value of 0.0116 for the Sin-indices.
The evaluation of the Sharpe ratios reveals different outcomes than the prior
findings as the SRI indices do on average not outperform the conventional indices.
With 44 percent an outperformance of the SRI indices can only be detected for fewer
than the half of the indices. The ratios of the Sin-comparables on the other side still
report a high percentage of outperformance in 84 percent of the cases when
compared to the standard indices. The comparison between the SRI and Sin-indices
reveals again the vice investment as the superior investment strategy, outperforming
the virtue indices for three-quarter of the 32 indices. With a percentage of
outperforming indices of only 42 percent, the poor performance of the SRI indices
decreases even more when the adjusted list is applied. The value of unethical indices
which perform better than the ethical indices decreases to 69 percent if the adjusted
list is used. A look at the average ratios emphasises the superiority of the Sin-indices
with a mean reward-to-variability ratio of 0.22 in comparison to 0.19 of the
conventional and 0.18 of the SRI-indices.
7 Conclusions
The debate on the performance of virtue investing in the equity markets has been
going on for years and seems rather inconclusive. Academic findings on socially
responsible investing reveal different results for the performance of SRI indices;
however, there are indications from recent research suggesting an outperformance by
sin stocks. This raises the question whether investors can increase their performance
more by incorporating social or unsocial screens into their investment process.
Answering this question is the key contribution of our paper. Extending prior studies
on sin investment, we find that publicly traded companies involved in alcohol,
gambling, tobacco, sex and nuclear power industries are able to generate abnormal
returns. Using a worldwide index of 732 unethical firms, we provide evidence that

40
the risk-return characteristics of sin stocks are superior in comparison to regular
stocks as well as socially responsible stocks.
Our analysis of the Sin Index reveals the following main results:
(I) The Sin Index provides higher returns which are not due to higher volatility. We
report risk-adjusted return of 18 basis points for the single-factor regression and 5
basis points per month for the four-factor regression. Looking at the outcomes of the
other factors we detect that the index is tilted toward value stocks. Furthermore the
index manages to outperform the MSCI World for every performance measure.
(II) The findings on the sector indices show an underperformance only for the Sex
Index; other indices such as the Alcohol, Weapons and Tobacco indices reveal even
superior performance when compared to the Sin Index. The analysis of the regional
indices reveals an outperformance for every index except the Australian index.
(III) The equally-weighted Sin-indices put the findings of Hong and Kacperczyk into
perspective. Assuringly, we find a high risk-adjusted performance, but in most of the
cases these findings are not significant.
The comparison between the virtue and vice investment approaches reports several
remarkable results. The analysis of the factor loadings of the multi-factor model
shows opposite characteristics: While the SRI indices are tilted towards small stocks
the sinful counterparts indicate a bias towards small-cap firms. The loadings on the
HML factor imply that the ethical indices have a growth and the unethical indices a
value stock orientation. Furthermore, the socially responsible indices seem in
contrast to their Sin-comparables not to be active in cyclical businesses. The tests on
systems of different time-series reveal that the two investment approaches are able to
generate a performance that differs significantly from conventional benchmarks. This
result is also true for several index families and regions. In general, the SRI indices
provide more significant performance differences than their counterparts.
In the comparison of vice to virtue we find that the returns of the SRI indices were
lower than those of their Sin-counterparts during the overall 1995 - 2007 period but
not in every sub-period. In general, SRI indices did better than their counterparts
until the end of the dot-com bubble and in 2001 it appeared that virtue had gained the
upper hand but during the bust of the early 2000s the social indices fell more and

41
more back. The performance tests of the SRI indices confirm the results of prior
studies since the indices neither lead to a significant outperformance nor an
underperformance compared to their benchmarks. The Sin-indices on the other hand
achieve for all three performance ratios an outperformance of on average 79 percent
of the indices. Summarizing the findings of the performance comparison, we are able
to detect a clear financial winner in the competition between vice and virtue
investing in the socially irresponsible approach. The Sin-indices outperform the SRI
indices in 85 percent of the cases using the Jensen and Treynor measures and also the
Sharpe-ratio demonstrates greater values for the sinful comparables in 69 percent of
the indices.
In summary, the Sin Index outperforms both conventional and socially responsible
indices even after adjusting for common risk-factors. Despite the low significance of
the alpha values, all three performance measures demonstrate an unambiguous higher
performance by the Sin indices (Sin premium) compared to the SRI indices, which
leads to the conclusion that the superior financial investment strategy seems to be the
sinful one. To paraphrase Wall Street movie’s character Gordon Gekko “sin is
good”, or in this case, better than investing in conventional or “social responsible”
areas.
Overall, our results suggest that socially irresponsible investing provides higher risk-
adjusted returns. Where do these abnormal returns stem from? Is it a sin or disgust
premium? Does it result from mispricing in the market or additional risk factors?
Answering these questions is left for future research.

42
Appendix
Table 1: Excluding Criteria of the Socially Responsible Indices
SRI Indices Region Alcohol Animal Testing
Gambling Nuclear Power
Porno‐graphy
Tobacco Weapons No Criteria
DJSI World Global X DJSI World ex TAGFA Global X X X X ESI Pioneer Global Global X X X X X X X ESI Excellence Global Global X X X X X X X Ethical Global Global X X X X X X FTSE4GOOD Global Global X X X NAI Global X X X Calvert Social USA X X X X X DJSI US USA X DJSI US ex TAGFA USA X X X X Domini 400 Social USA X X X X X X FTSE4GOOD USA USA X X X KLD Broad Market USA X X X X X X KLD Large Cap Social USA X KLD Select Social USA X X X X X X ASPI Eurozone X DJSI EuroStoxx Eurozone X DJSI EuroStoxx ex TAGFA Eurozone X X X X Ethical Eurozone Eurozone X X X X X X DJSI Stoxx Europe DJSI Stoxx ex TAGFA Europe X X X X ESI Excellence Europe Europe X X X X X X X Ethical Euro Europe X X X X X X FTSE4GOOD Europe Europe X X X HVB Nachhaltigkeit Europe X X X X X X X Kempen SNS Smaller EU Europe X FTSE4GOOD UK UK X X X Kempen SNS Smaller UK UK X Jantzi Social Canada X X X JSE RSA X Australian SAM Australia X FTSE4GOOD Japan Japan X X X Notes: In this table the excluding criteria of 32 socially responsible indices are presented. The names of the indices are reported in Column 1. The full names of the SRI indices can be found in the List of Abbreviations. In Column 2 the investment region of the indices is presented. The use of a criterion is marked with an X.

43
Table 2: Summary Statistics for the Time Series Regression of the Sin-Index and its Sub-Indices
Index Excess Return STD Alpha Beta adj. R² Sharpe Treynor
MSCI World Index 0,0625 0,1353 0,0000 1,0000 1,000 0,1333 0,0625
Sin‐Index 0,0673 0,1244 0,0018 0,7401 0,646 0,1563 0,0910
Alcohol Index 0,0673 0,1156 0,0035 0,4048 0,219 0,1680 0,1661Gambling Index 0,0620 0,1866 0,0012 0,7562 0,296 0,0960 0,0820Nuclear Power Index 0,0723 0,1580 0,0015 0,8772 0,561 0,1321 0,0824Sex Index 0,0314 0,1898 ‐0,0014 0,7640 0,292 0,0477 0,0410Tobacco Index 0,0670 0,2013 0,0034 0,4284 0,076 0,0961 0,1565Weapons Index 0,0931 0,1773 0,0035 0,8266 0,393 0,1515 0,1126Notes: This table shows the results of the estimations on different sinful indices and the MSCI World Index. Column 2 gives the monthly return, net of the risk-free rate and Column 3 the standard deviation of the excess returns. Column 4, 7 and 8 display the results of Jensen’s alpha, the Sharpe-ratio and the Treynor-measure. Column 5 gives the outcomes of single regression for the beta-coefficient and Column 6 presents the results for the coefficient of determination of the regression.*** 1% significance; ** 5% significance; * 10% significance. Note the significance for the beta is not marked. All estimations have been done for the total time series available from the start date in July 1995 until July 2007. The estimations are based on the excess returns of the indices, denominated in U.S. dollars. Newey-West (1987)-corrected standard errors have been applied.
Table 3: Return Performance of the Sin-Index
Variable Alpha MKT SMB HML MOM adj. R²
Sin‐Index 0,0018 0,740058*** 0,646 0,0017 0,0484
Sin‐Index 0,0019 0,747404*** ‐0,058739 0,648 0,0018 0,0473 0,0484
Sin‐Index 0,0005 0,811972*** 0,016267 0,182377*** 0,667 0,0016 0,0617 0,0490 0,0642
Sin‐Index 0,0005 0,812916*** 0,015786 0,182731*** 0,002349 0,664 0,0017 0,0616 0,0503 0,0666 0,0410
Notes: This Table reports the results for the multi-factor time series regressions for the Sin Index using one, two, three and four-factor regressions. All results are presented in the form of a fitted regression equation with standard errors in the second line. The depended variable is the monthly value-weighted return of the Sin Index minus the risk-free rate. The independent variables are four zero-investment factor portfolios. MKT represents the return on the market proxy (MSCI World) in excess of the risk-free rate, SMB denotes the difference in return between a small-cap portfolio and a large-cap portfolio, HML denotes the difference in returns between a value portfolio and a growth portfolio and MOM is the return difference between a prior 12-month winner portfolio and a 12-month looser portfolio. *** 1% significance; ** 5% significance; * 10% significance. All estimations have been done for the total time series available from the start date in July 1995 until July 2007. The estimations are based on the excess returns of the indices, denominated in U.S. dollars. Newey-West (1987)-corrected standard errors have been applied.

44
Table 4: Return Performance of the Sector Sin-Indices
Index ALPHA MKT SMB HML MOM R² SIN Index 0,0018 0,740058*** 0,646
0,0017 0,0484 SIN Index 0,0005 0,812916*** 0,015786 0,182731*** 0,002349 0,664
0,0017 0,0616 0,0503 0,0666 0,0410
Alcohol 0,0035 0,404849*** 0,219 0,0024 0,0819
Alcohol ‐0,0004 0,600357*** 0,113264** 0,450530*** 0,085623 0,368 0,0020 0,0782 0,0543 0,0775 0,0595
Gambling 0,0012 0,756196*** 0,296 0,0048 0,1044
Gambling 0,0010 0,711841*** 0,457778*** 0,177318 ‐0,187111** 0,390 0,0050 0,1052 0,1037 0,1445 0,0775
Nuclear Power 0,0015 0,877206*** 0,561 0,0020 0,0681
Nuclear Power 0,0023 0,854811*** ‐0,157915** ‐0,131713 0,035713 0,568 0,0022 0,0726 0,0685 0,1008 0,0523
Sex ‐0,0014 0,763998*** 0,292 0,0034 0,1046
Sex ‐0,0030 0,831398*** 0,103179 0,175219 0,029361 0,286 0,0036 0,1101 0,1354 0,1268 0,0727
Tobacco 0,0034 0,428393*** 0,076 0,0049 0,1192
Tobacco 0,0000 0,621376*** 0,129508 0,564103*** ‐0,061983 0,149 0,0041 0,1070 0,1723 0,1866 0,1105
Weapons 0,0035 0,82660*** 0,393 0,0033 0,1012
Weapons 0,0007 0,982108*** 0,203747** 0,538976*** ‐0,119075 0,496 0,0029 0,1181 0,0927 0,1009 0,0812
Notes: This Table reports the results for the multi-factor time series regressions for the Sin Index and the six sector Sin-indices using one, two, three and four-factor regressions. All results are presented in the form of a fitted regression equation with standard errors in the second line. The depended variable is the monthly value-weighted return of the Sin Index minus the risk-free rate. The independent variables are four zero-investment factor portfolios. MKT represents the return on the market proxy (MSCI World) in excess of the risk-free rate, SMB denotes the difference in return between a small-cap portfolio and a large-cap portfolio, HML denotes the difference in returns between a value portfolio and a growth portfolio and MOM is the return difference between a prior 12-month winner portfolio and a 12-month looser portfolio. *** 1% significance; ** 5% significance; * 10% significance. All estimations have been done for the total time series available from the start date in July 1995 until July 2007. The estimations are based on the excess returns of the indices, denominated in U.S. dollars. Newey-West (1987)-corrected standard errors have been applied.

45
Table 5: Summary Statistics for the Regional Sin-Indices
Index Excess Return STD Alpha Beta adj. R² Sharpe Treynor
Sin Index US 0,0794 0,1412 0,0018 0,7622 0,571 0,1623 0,1042S&P 500 0,0755 0,1404 0,0000 1,0000 1,000 0,1553 0,0755
Sin Index US (PI) 0,0828 0,1706 0,0017 0,9124 0,688 0,1401 0,0907DJSTOXX 0,0685 0,1553 0,0000 1,0000 1,000 0,1272 0,0685
Sin Index Euro (PI) 0,0902 0,2077 0,0018 0,8721 0,604 0,1253 0,1034DJEUSTOXX 0,0791 0,1856 0,0000 1,0000 1,000 0,1230 0,0791
Sin Index UK 0,0823 0,1515 0,0016 0,7948 0,505 0,1568 0,1035FTSE 0,0789 0,1360 0,0000 1,0000 1,000 0,1675 0,0789
Sin Index Japan (PI) ‐0,0036 0,2015 0,0017 0,7533 0,693 ‐0,0051 ‐0,0047Nikkei ‐0,0317 0,2229 0,0000 1,0000 1,000 ‐0,0410 ‐0,0317
Sin Index Canada 0,1322 0,2859 0,0015 0,9173 0,376 0,1335 0,1441S&P TSX 60 0,1243 0,1921 0,0000 1,0000 1,000 0,1867 0,1243
Sin Index Australia 0,1102 0,2131 ‐0,0023 1,0978 0,743 0,1494 0,1004S&P ASX 200 0,1258 0,1675 0,0000 1,0000 1,000 0,2168 0,1258
Sin Index US 0,0794 0,1412 0,0030 0,6857 0,428 0,1623 0,1158Sin Index ex US 0,0661 0,1461 0,0013 0,8142 0,565 0,1306 0,0812MSCI World 0,0625 0,1353 0,0000 1,0000 1,000 0,1333 0,0625Notes: The table reports the results of the estimations on several regional Sin indices and their benchmarks. Below each regional Sin-Index the market proxy for the index is given. Since the DowJones Stoxx, Dow Jones Euro Stoxx and Nikkei 225 indices were available only as price indices they are compared to the price Sin-indices, indicated with (PI). The last three rows illustrate the outcomes for the U.S and non U.S. Sin-indices for which the MSCI World serves as benchmark. Column 2 gives the monthly return, net of the risk-free rate and Column 3 the standard deviation of the excess returns. Column 4, 7 and 8 display the results of the Jensen alpha, Sharpe-ratio and Treynor-measure. Column 5 gives the outcomes of single regression for the beta-coefficient and Column 6 presents the results for the coefficient of determination of the regression.*** 1% significance; ** 5% significance; * 10% significance. Note the significance for the beta is not marked. All estimations have been done for the total time series available from the start date in July 1995 until July 2007. The estimations are based on the excess returns of the indices, denominated in U.S. dollars. Newey-West (1987)-corrected standard errors have been applied.

46
Table 6: Return Performance of the U.S. and non-U.S. Sin-Indices
Variable ALPHA MKT SMB HML MOM R² Sin‐Index 0,0018 0,740058*** 0,646
0,0017 0,0484 0,0005 0,812916*** 0,015786 0,182731*** 0,002349 0,664
0,0017 0,0616 0,0503 0,0666 0,0410
Sin‐Index U.S. 0,0030 0,685701*** 0,428 0,0022 0,0741
0,0030 0,752854*** ‐0,232817*** 0,1103 ‐0,021250 0,505 0,0022 0,0870 0,0776 0,1033 0,0504
Sin‐Index ex U.S. 0,0013 0,814173*** 0,565 0,0024 0,0501
‐0,0014 0,899728*** 0,301844*** 0,27421*** 0,0384 0,630 0,0022 0,0588 0,0482 0,0577 0,0375
Notes: This Table reports the results for the one and four-factor time series regressions for the Sin Index, the U.S. Sin Index and the Sin Index except U.S. stocks. The market proxy used for the regression is the MSCI World index. Sin-Index denotes the global Sin Index, Sin-Index U.S. is the American Sin-Index and Sin-Index ex U.S. denotes the global Sin Index except American stocks. All results are presented in the form of a fitted regression equation with standard errors in the second line. The depended variable is the monthly value-weighted return of the Sin Index minus the risk-free rate. The independent variables are four zero-investment factor portfolios. MKT represents the return on the market proxy (MSCI World) in excess of the risk-free rate, SMB denotes the difference in return between a small-cap portfolio and a large-cap portfolio, HML denotes the difference in returns between a value portfolio and a growth portfolio and MOM is the return difference between a prior 12-month winner portfolio and a 12-month looser portfolio. *** 1% significance; ** 5% significance; * 10% significance. All estimations have been done for the total time series available from the start date in July 1995 until July 2007. The estimations are based on the excess returns of the indices, denominated in U.S. dollars. Newey-West (1987)-corrected standard errors have been applied.

47
Table 7: Summary Statistics for the Time Series Regression of the Equally-Weighted Sin-Index and its Sub-Indices
Index Excess Return STD Alpha Beta adj. R² Sharpe Treynor
E‐W Sin Index 0,1267 0,1372 0,0054* 0,5839 0,4917 0,9238 0,2171
E‐W Sin Index U.S. 0,1298 0,1714 0,0047 0,6890 0,4382 0,7577 0,1884E‐W Triumvirate 0,1040 0,1172 0,0046 0,4629 0,4223 0,8874 0,2247E‐W Triumvirate U.S. 0,1269 0,2082 0,0047 0,6646 0,2735 0,6095 0,1909E‐W Alcohol Index 0,0766 0,0988 0,0034 0,3400 0,3193 0,7759 0,2254E‐W Gambling Index 0,1449 0,2004 0,0062 0,6698 0,3005 0,7230 0,2163E‐W Nuclear Power Index 0,2121 0,2655 0,0110 0,7603 0,2188 0,7991 0,2790E‐W Sex Index ‐0,0125 0,2697 ‐0,0075 0,7266 0,1928 ‐0,0462 ‐0,0172E‐W Tobacco Index 0,1104 0,1420 0,0051 0,4607 0,2826 0,7773 0,2396E‐W Weapons Index 0,1193 0,1469 0,0039 0,6826 0,5876 0,8126 0,1748
Value Line Index 0,1060 0,1653 0,0000 1,0000 1,0000 0,6413 0,1060
E‐W Triumphirat U.S. (CSPR) 0,1269 0,2082 0,0065 0,6056 0,1845 0,6095 0,2095CSRP Index 0,0798 0,1499 0,0000 1,0000 1,0000 0,5324 0,0798Notes: The Table reports the results for the calculations on several equally-weighted Sin-indices. The Value Line Arithmetic Index serves market proxy for every index, with exception of the E-W Triumvirate U.S. (CSPR) index, which was compared to the CSRP index. The equally-weighted Triumvirate Index represents an equally-weighted index created with stock in the alcohol, gambling and tobacco business. Column 2 gives the monthly return, net of the risk-free rate and Column 3 the standard deviation of the excess returns. Column 4, 7 and 8 display the results of the Jensen alpha, Sharpe-ratio and Treynor-measure. Column 5 gives the outcomes of single regression for the beta-coefficient and Column 6 presents the results for the coefficient of determination of the regression.*** 1% significance; ** 5% significance; * 10% significance. Note the significance for the beta is not marked. All estimations have been done for the total time series available from the start date in July 1995 until July 2007. The estimations are based on the excess returns of the indices, denominated in U.S. dollars. Newey-West (1987)-corrected standard errors have been applied.
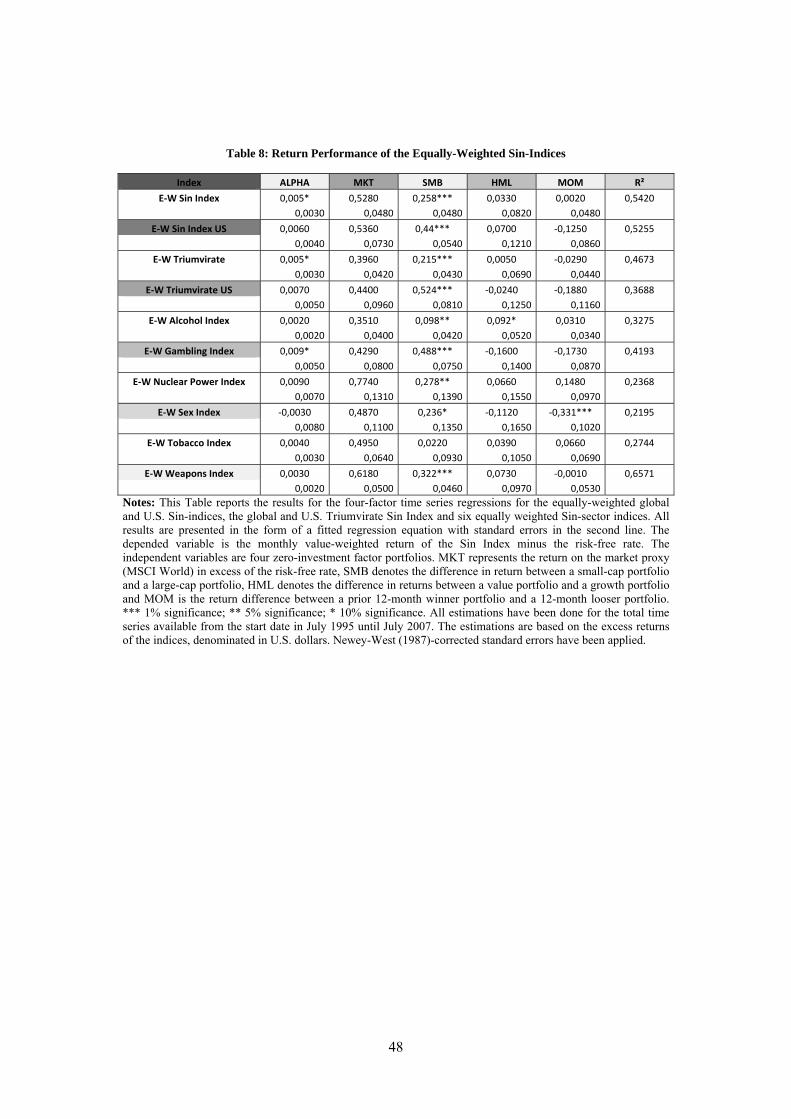
48
Table 8: Return Performance of the Equally-Weighted Sin-Indices
Index ALPHA MKT SMB HML MOM R²
E‐W Sin Index 0,005* 0,5280 0,258*** 0,0330 0,0020 0,5420 0,0030 0,0480 0,0480 0,0820 0,0480
E‐W Sin Index US 0,0060 0,5360 0,44*** 0,0700 ‐0,1250 0,5255 0,0040 0,0730 0,0540 0,1210 0,0860
E‐W Triumvirate 0,005* 0,3960 0,215*** 0,0050 ‐0,0290 0,4673 0,0030 0,0420 0,0430 0,0690 0,0440
E‐W Triumvirate US 0,0070 0,4400 0,524*** ‐0,0240 ‐0,1880 0,3688 0,0050 0,0960 0,0810 0,1250 0,1160
E‐W Alcohol Index 0,0020 0,3510 0,098** 0,092* 0,0310 0,3275 0,0020 0,0400 0,0420 0,0520 0,0340
E‐W Gambling Index 0,009* 0,4290 0,488*** ‐0,1600 ‐0,1730 0,4193 0,0050 0,0800 0,0750 0,1400 0,0870
E‐W Nuclear Power Index 0,0090 0,7740 0,278** 0,0660 0,1480 0,2368 0,0070 0,1310 0,1390 0,1550 0,0970
E‐W Sex Index ‐0,0030 0,4870 0,236* ‐0,1120 ‐0,331*** 0,2195 0,0080 0,1100 0,1350 0,1650 0,1020
E‐W Tobacco Index 0,0040 0,4950 0,0220 0,0390 0,0660 0,2744 0,0030 0,0640 0,0930 0,1050 0,0690
E‐W Weapons Index 0,0030 0,6180 0,322*** 0,0730 ‐0,0010 0,6571 0,0020 0,0500 0,0460 0,0970 0,0530
Notes: This Table reports the results for the four-factor time series regressions for the equally-weighted global and U.S. Sin-indices, the global and U.S. Triumvirate Sin Index and six equally weighted Sin-sector indices. All results are presented in the form of a fitted regression equation with standard errors in the second line. The depended variable is the monthly value-weighted return of the Sin Index minus the risk-free rate. The independent variables are four zero-investment factor portfolios. MKT represents the return on the market proxy (MSCI World) in excess of the risk-free rate, SMB denotes the difference in return between a small-cap portfolio and a large-cap portfolio, HML denotes the difference in returns between a value portfolio and a growth portfolio and MOM is the return difference between a prior 12-month winner portfolio and a 12-month looser portfolio. *** 1% significance; ** 5% significance; * 10% significance. All estimations have been done for the total time series available from the start date in July 1995 until July 2007. The estimations are based on the excess returns of the indices, denominated in U.S. dollars. Newey-West (1987)-corrected standard errors have been applied.

49
Table 9: Risk-Return Comparison of Virtue and Vice Investment
Region SRI Index Benchmark Sin‐Index ER SRI ER BM ER SIN STD SRI STD BM STD SIN
Global DJSI World DJGI Sin Index 0,058 0,048 0,068 0,152 0,140 0,127 Global DJSI World EX DJGI Sin Index 0,058 0,048 0,068 0,153 0,140 0,127 Global ESI Pioneer Global S&P Global Sin Index 0,056 0,057 0,066 0,158 0,138 0,132 Global ESI Excellence Global S&P Global Sin Index 0,165 0,166 0,189 0,097 0,085 0,087 Global Ethical Global MSCI World Sin Index 0,037 0,046 0,070 0,134 0,133 0,122 Global FTSE4GOOD Global FTSE All World Sin Index 0,076 0,062 0,062 0,156 0,143 0,129 Global NAI MSCI World Sin Index 0,281 0,119 0,173 0,152 0,078 0,084
USA Calvert Social Russell 1000 Sin‐Index U.S. ‐0,020 ‐0,013 0,033 0,159 0,137 0,128 USA DJSI US Dow Jones Sin‐Index U.S. 0,003 0,022 0,040 0,154 0,142 0,141 USA DJSI US EX Dow Jones Sin‐Index U.S. 0,004 0,022 0,040 0,159 0,142 0,141 USA Domini 400 Social S&P 500 Sin‐Index U.S. 0,078 0,076 0,079 0,154 0,140 0,141 USA FTSE4GOOD USA FTSE AW USA Sin‐Index U.S. 0,061 0,057 0,067 0,165 0,153 0,145 USA KLD Broad Market Russell 3000 Sin‐Index U.S. 0,020 0,012 0,028 0,153 0,136 0,128 USA KLD Large‐Cap Russell 1000 Sin‐Index U.S. 0,014 0,005 0,028 0,153 0,133 0,128 USA KLD Select Social Russell 1000 Sin‐Index U.S. 0,070 0,070 0,096 0,076 0,076 0,076
Canada Jantzi Social S&P/TSX 60 Sin‐Index Can 0,067 0,110 0,119 0,144 0,184 0,326
Eurozone ASPI Indices DJ Euro Stoxx Sin‐Index Euro 0,108 0,079 0,090 0,187 0,186 0,204 Eurozone DJSI EuroStoxx DJ Euro Stoxx Sin‐Index Euro 0,038 0,033 0,098 0,211 0,191 0,222 Eurozone DJSI EuroStoxx EX DJ Euro Stoxx Sin‐Index Euro 0,039 0,033 0,098 0,212 0,191 0,222 Eurozone Ethical Eurozone DJ Euro Stoxx Sin‐Index Euro 0,229 0,180 0,235 0,135 0,140 0,179
Europe DJSI Stoxx DJ Stoxx Sin‐Index EU 0,030 0,037 0,094 0,162 0,160 0,172 Europe DJSI Stoxx EX DJ Stoxx Sin‐Index EU 0,029 0,037 0,094 0,164 0,160 0,172 Europe ESI Excellence EU DJ Stoxx Sin‐Index EU 0,209 0,194 0,244 0,149 0,118 0,140 Europe Ethical Euro DJ Stoxx Sin‐Index EU 0,062 0,056 0,121 0,176 0,161 0,164 Europe FTSE4GOOD Europe FTSE Europe Sin‐Index EU 0,100 0,133 0,081 0,172 0,162 0,172 Europe HVB Nachhaltigkeit DJ Euro Stoxx Sin‐Index EU 0,100 0,066 0,114 0,200 0,197 0,222 Europe SNS Smaller EU HSBC Small EU Sin‐Index EU 0,142 0,132 0,094 0,212 0,176 0,167
UK FTSE4GOOD UK FTSE All Share Sin‐Index UK 0,074 0,079 0,081 0,137 0,142 0,156 UK SNS Smaller UK HSBC Small UK Sin‐Index UK 0,094 0,135 0,085 0,265 0,183 0,140
RSA JSE SRI FTSE/JSE Sin‐Index 0,319 0,322 0,163 0,213 0,215 0,080 Australia Australian SAM S&P ASX 200 Sin‐Index AUS 0,217 0,219 0,207 0,138 0,128 0,198 Japan FTSE4GOOD Japan FTSE Japan Sin‐Index JP 0,106 0,112 0,164 0,118 0,116 0,092
Notes: This Table reports summary statistics for the 32 SRI indices, their benchmarks and sinful comparable indices. In Column 1 the investment region of the SRI indices is shown. Column 2 reports the names of the socially responsible indices and Column 3 the official benchmarks of the SRI indices with exception of the FTSE4Good Japan. Column 4 presents the Sin-indices used to the comparison with the socially indices, with exception of the South African (RSA) index, the Sin-indices have the same investment region than the SRI index. Column 5 reports the monthly excess returns and the last Column the standard deviations of the excess returns of the socially responsible indices, their benchmarks and sinful comparables.

50
Table 10: Single-Regression Results and Spanning Tests of Virtue and Vice Investment
Name Alpha SRI Alpha SIN Beta SRI Beta SIN R² SRI R² SIN Spanning SRI Spanning SIN
DJSI World 0,00066 0,00258 1,055 0,773 0,937 0,721 ** *** DJSI World ex TAGFA 0,00063 0,00258 1,061 0,773 0,935 0,721 ** *** ESI Pioneer Global ‐0,00016 0,00195 1,015 0,754 0,791 0,622 not rejected ***
ESI Excellence Global ‐0,00012 0,00354* 1,005 0,884 0,774 0,747 not rejected * Ethical Global ‐0,00077 0,00291 0,995 0,764 0,985 0,698 not rejected ***
FTSE4GOOD Global 0,00078 0,00114 1,071 0,783 0,966 0,743 *** *** NAI 0,00761* 0,00563*** 1,588 0,888 0,660 0,685 *** **
Calvert Social ‐0,00044 0,00345 1,135 0,638 0,956 0,459 *** *** DJSI US ‐0,00149 0,00196 0,936 0,720 0,746 0,521 not rejected ***
DJSI US ex TAGFA ‐0,00143 0,00196 0,951 0,720 0,720 0,521 not rejected *** Domini 400 Social 0,00024 0,00182 1,001 0,762 0,836 0,571 not rejected *** FTSE4GOOD USA 0,00013 0,00231 1,057 0,695 0,963 0,531 ** *** KLD Broad Market 0,00057 0,00165 1,049 0,656 0,862 0,480 not rejected *** KLD Large Cap Social 0,00070 0,00200 1,058 0,676 0,851 0,492 not rejected *** KLD Select Social 0,00081 0,00408 0,856 0,666 0,738 0,439 * *
Jantzi Social ‐0,00011 0,00005 0,619 1,070 0,626 0,358 *** not rejected
ASPI Indices 0,00244*** 0,00189 0,996 0,853 0,979 0,597 *** *** DJSI EuroStoxx 0,00015 0,00556 1,091 0,938 0,977 0,651 *** not rejected
DJSI EuroStoxx ex TAGFA 0,00017 0,00556 1,096 0,938 0,977 0,651 *** not rejected Ethical Eurozone 0,00484*** 0,00697 0,951 0,841 0,963 0,420 *** **
DJSI Stoxx ‐0,00054* 0,00506 1,004 0,921 0,977 0,728 not rejected ** DJSI Stoxx ex TAGFA ‐0,000698* 0,00506 1,016 0,921 0,975 0,728 not rejected ** ESI Excellence Europe 0,00114 0,00520 1,008 0,934 0,624 0,608 not rejected not rejected
Ethical Euro 0,00014 0,00598* 1,066 0,867 0,953 0,725 not rejected *** FTSE4GOOD Europe ‐0,00334*** ‐0,00311 1,052 0,883 0,973 0,683 *** *** HVB Nachhaltigkeit 0,00309** 0,00446 0,949 0,913 0,880 0,654 ** *
Kempen SNS Smaller EU 0,00018 ‐0,00027 1,059 0,734 0,767 0,591 not rejected ***
FTSE4GOOD UK ‐0,00004 0,00153 0,945 0,784 0,954 0,504 not rejected *** Kempen SNS Smaller UK 0,00008 0,00606*** 0,986 0,280 0,987 0,553 not rejected ***
JSE SRI ‐0,00518 0,00159 1,158 0,494 0,639 0,410 ** *** Australian SAM ‐0,00133 ‐0,00731 1,064 1,341 0,966 0,737 not rejected **
FTSE4GOOD Japan ‐0,00042 0,00769** 0,988 0,641 0,945 0,638 not rejected *** Notes: This Table reports the results for the single-factor time series regressions for the 32 SRI indices and their Sin comparables. Column 2 and 3 contains the estimated values for the Jensen’s alpha, H0: (all αi= 0) a rejection of the null hypothesis is indicated by asterisk. Column 4 and 5 show the results for the β-coefficient and the test H0: (all βi= 1), as the Null hypothesis is rejected for every beta the significance is not indicated. In Column 8 and 9 the outcomes of the spanning tests H0: (all αi= 0 and all βi= 1) is documented, a rejection of the null hypothesis is indicated by asterisk. *** 1% significance; ** 5% significance; * 10% significance. All estimations have been done for the total time series available from the start date in July 1995 until July 2007. The estimations are based on the excess returns of the indices, denominated in U.S. dollars. Newey-West (1987)-corrected standard errors have been applied.

51
Table 11: Results of the Multi-Factor Regression (Part 1)
Name Alpha SRI Alpha SIN Beta SRI Beta SIN adj. R² SRI adj. R² SIN
DJSI World 0,0007 0,0008 1,0760 0,9173 0,942 0,787 DJSI World ex TAGFA 0,0008 0,0008 1,0761 0,9173 0,941 0,787 ESI Pioneer Global 0,0020 0,0005 0,9240 0,8338 0,829 0,637 ESI Excellence Global ‐0,0001 0,0018 1,0781 0,8666 0,771 0,766 Ethical Global ‐0,0007 0,0005 0,9915 0,8887 0,984 0,741 FTSE4GOOD Global 0,0015 ‐0,0013 1,0431 0,9074 0,969 0,791 NAI 0,0082 0,0033 1,3223 0,9036 0,693 0,699
Calvert Social 0,0016** 0,0009 1,0107 0,8119 0,977 0,535 DJSI US 0,0019 0,0015 0,8387 0,7586 0,881 0,539 DJSI US ex TAGFA 0,0024 0,0015 0,8454 0,7586 0,868 0,539 Domini 400 Social 0,0015 ‐0,0003 0,9357 0,8917 0,844 0,645 FTSE4GOOD USA 0,0003 ‐0,0008 1,0427 0,8772 0,964 0,624 KLD Broad Market 0,0010 ‐0,0001 0,9282 0,8095 0,873 0,526 KLD Large Cap Social 0,0013 ‐0,0001 0,9208 0,8158 0,868 0,534 KLD Select Social 0,0029** 0,0008 0,7796 0,7890 0,760 0,457
Jantzi Social 0,0037 ‐0,0089 0,5310 1,1264 0,692 0,410
ASPI Indices 0,0026*** 0,0008 0,9912 0,8230 0,978 0,628 DJSI EuroStoxx 0,0002 0,0037 1,0984 0,8799 0,976 0,688 DJSI EuroStoxx ex TAGFA 0,0001 0,0037 1,1020 0,8799 0,977 0,688 Ethical Eurozone 0,0048*** 0,0052 0,9191 0,7816 0,967 0,401
DJSI Stoxx 0,0001 0,0020 1,0291 0,9742 0,983 0,757 DJSI Stoxx ex TAGFA 0,0000 0,0020 1,0383 0,9742 0,981 0,757 ESI Excellence Europe ‐0,0002 0,0046 0,9997 0,9444 0,635 0,609 Ethical Euro 0,003*** 0,0037 1,0391 0,9626 0,971 0,762 FTSE4GOOD Europe ‐0,0033*** ‐0,0062** 1,0669 0,9342 0,978 0,723 HVB Nachhaltigkeit 0,0045** 0,0025 0,9506 0,8669 0,892 0,690 Kempen SNS Smaller EU 0,0007 ‐0,0014 1,0015 0,7547 0,787 0,595
FTSE4GOOD UK 0,0002 ‐0,0022 0,9352 0,8797 0,954 0,581 Kempen SNS Smaller UK ‐0,0005 0,0065* 0,9721 0,2531 0,988 0,518
JSE SRI ‐0,0024 ‐0,0007 1,0092 0,5928 0,698 0,454 Australian SAM ‐0,0016 ‐0,0040 1,0532 1,0271 0,963 0,812 FTSE4GOOD Japan ‐0,0009 0,0083*** 0,9671 0,6052 0,950 0,611 Notes: This Table reports first part of the results for the Carhart four-factor regressions for the 32 SRI indices and their Sin comparables. Column 2 and 3 contains the estimated values for the Jensen’s alpha, H0: (all αi= 0) a rejection of the null hypothesis is indicated by asterisk. Column 4 and 5 show the results for the β-coefficient and the test H0: (all βi= 1), as the Null hypothesis is rejected for every beta the significance is not indicated. *** 1% significance; ** 5% significance; * 10% significance. In Column 6 and 7 the outcomes of the adjusted R² are illustrated. All estimations have been done for the total time series available from the start date in July 1995 until July 2007. The estimations are based on the excess returns of the indices, denominated in U.S. dollars. Newey-West (1987)-corrected standard errors have been applied.

52
Table 12: Results of the Multi-Factor Regression (Part 2)
Name SMB SRI SMB SIN HML SRI HML SIN MOM SRI MOM SIN
DJSI World ‐0,0938*** ‐0,0720 ‐0,0189 0,2608*** 0,0255 0,0308 DJSI World ex TAGFA ‐0,1005*** ‐0,0720 ‐0,0336 0,2608*** 0,0233 0,0308 ESI Pioneer Global ‐0,1120** 0,0085 ‐0,296*** 0,1710*** 0,0152 0,0320 ESI Excellence Global ‐0,1315 0,0390 ‐0,0536 0,3098* 0,0845 ‐0,0245 Ethical Global 0,0045 0,0104 ‐0,0171 0,2379** 0,0038 0,0660 FTSE4GOOD Global ‐0,0505** 0,0238 ‐0,0925*** 0,2684*** 0,0112 0,0427 NAI 0,5016*** 0,0158 0,1662 0,3053 0,0637 ‐0,0185
Calvert Social 0,0168 ‐0,1083 ‐0,2033*** 0,3221** ‐0,0418*** 0,0043 DJSI US ‐0,0512 ‐0,0897 ‐0,4503*** 0,1089 ‐0,0181 0,0424 DJSI US ex TAGFA ‐0,0667 ‐0,0897 ‐0,4911*** 0,1089 ‐0,0164 0,0424 Domini 400 Social ‐0,0497 ‐0,0983 ‐0,1657*** 0,2765*** ‐0,0003 0,0468 FTSE4GOOD USA 0,0456 ‐0,0129 ‐0,0239 0,4040*** ‐0,0130 0,0231 KLD Broad Market 0,0513 ‐0,1265 ‐0,0570 0,3260* ‐0,1039* 0,0107 KLD Large Cap Social 0,0296 ‐0,0714 ‐0,0692 0,3410* ‐0,1233** 0,0042 KLD Select Social 0,1099 ‐0,0644 ‐0,1804** 0,3545 ‐0,1289 0,0158
Jantzi Social ‐0,0334 0,3439 ‐0,2168** 0,7393** ‐0,1451*** ‐0,2816
ASPI Indices 0,0100 0,2845*** ‐0,0027 0,0454 ‐0,0136 0,0469 DJSI EuroStoxx ‐0,0164 0,2814*** 0,0111 ‐0,0065 ‐0,0014 0,0595 DJSI EuroStoxx ex TAGFA ‐0,0097 0,2814*** 0,0155 ‐0,0065 ‐0,0022 0,0595 Ethical Eurozone 0,1430** 0,2747 ‐0,0281 0,2615 ‐0,0003 0,0360
DJSI Stoxx ‐0,0974*** 0,1466** ‐0,0149 0,2169*** 0,0033 0,0875** DJSI Stoxx ex TAGFA ‐0,1008*** 0,1466** ‐0,0204 0,2169*** ‐0,0029 0,0875** ESI Excellence Europe ‐0,0926 0,0394 0,2474 0,1043 ‐0,2096* 0,18764* Ethical Euro ‐0,1162*** 0,0797 ‐0,2144*** 0,1021 ‐0,0143 0,1679*** FTSE4GOOD Europe ‐0,0907*** 0,2137*** ‐0,0262* 0,2647*** 0,0214 0,0779** HVB Nachhaltigkeit ‐0,1389* 0,3160*** ‐0,0518 0,0386 ‐0,0559* 0,0358 Kempen SNS Smaller EU 0,1183 0,0313 ‐0,1388 0,0144 0,0479 0,0971
FTSE4GOOD UK 0,0163 0,2098** ‐0,0138 0,3835*** ‐0,0175 0,0823** Kempen SNS Smaller UK ‐0,0093 0,0865 0,0961 0,0130 0,0978 0,0458
JSE SRI 0,2046 ‐0,0942 ‐0,3744* 0,1402* 0,0007 0,1431*** Australian SAM 0,0198 0,8506*** 0,0927 0,3415 0,0083 0,3306 FTSE4GOOD Japan 0,1876*** 0,1209 0,1328 ‐0,0601 ‐0,0558 0,0588 Notes: This Table reports second part of the results for the Carhart four-factor regressions for the 32 SRI indices and their Sin comparables. Column 2 and 3 contains the estimated values for the factor SMB. Column 4 and 5 show the results for the HML factor and in Column 6 and 7 the outcomes of factor MOM are illustrated. All estimations have been done for the total time series available from the start date in July 1995 until July 2007. The estimations are based on the excess returns of the indices, denominated in U.S. dollars. Newey-West (1987)-corrected standard errors have been applied. SMB denotes the difference in return between a small-cap portfolio and a large-cap portfolio, HML denotes the difference in returns between a value portfolio and a growth portfolio and MOM is the return difference between a prior 12-month winner portfolio and a 12-month looser portfolio. *** 1% significance; ** 5% significance; * 10% significance. All estimations have been done for the total time series available from the start date in July 1995 until July 2007. The estimations are based on the excess returns of the indices, denominated in U.S. dollars. Newey-West (1987)-corrected standard errors have been applied.

53
Table 13: Joint Coefficients-Tests for Different Time Intervals
Different Time Intervals SRI Indices Single‐Factor Model Multi‐Factor Model
Time Interval Included Start H0: all αi=0 H0: all βi=1 Spanning Test H0: all αi=0 12 Years SRI 3 7/1995 14,38*** 7,26*** 21,75*** 15,35*** 10 Years SRI 7 7/1997 42,87*** 36,92*** 77,48*** 47,53*** 8 Years SRI 14 7/1999 88,05*** 100,23*** 189,62*** 93,52*** 6 Years SRI 19 7/2001 155,1*** 243,27*** 415,01*** 171,84*** 4 Years SRI 21 7/2003 157,6*** 280,36*** 512,14*** 170,56*** 12 Years SIN 3 7/1995 3,37 59,28*** 63,0208*** 54,10*** 10 Years SIN 7 7/1997 22,13*** 335,66*** 379,85*** 39,88*** 8 Years SIN 14 7/1999 44,09*** 1332,13*** 1539,70*** 39,84*** 6 Years SIN 19 7/2001 59,25*** 1646,76*** 2084,50*** 27,75*** 4 Years SIN 21 7/2003 82,41*** 1169,59*** 1731,94*** 153,46***
Notes: The H0 for Table 14, 15 and 16 are tested using Chi-squared-Tests. The Degrees of freedom are equal to the number of indices included for the single-regression tests and for the joint hypothesis the degrees of freedom are equal to the number of indices multiplied by two. The figures illustrate the values of the test statistics. The *, **, *** = H0 rejected at a significance level of 10, 5 or 1 percent, respectively. For the estimations Newey/West-corrected standard errors have been used. Column 1 shows the different groups, first the SRI groups are given followed by the comparable sinful Groups. Column 2 gives the number of indices included in the group. The results of the single-factor estimation are given in Column 4, 5 and 6. Column 4 displays the outcomes of the Chi-square-test for the joint tests of the Jensen’s alpha, H0: (all αi= 0). The results for the joint- test H0: (all βi= 1) are reported in Column 5. Column 6 refers to the joint spanning test, H0: (all αi= 0 and all βi= 1). Column 7 gives the results of the multi-factor estimation for H0: (all αi= 0). The 12 year old index group contains the three indices DJSI World ex TAGFA, Domini 400 Social and the ASPI index. The 10 year group includes additionally to the prior indices the global, U.S, European and the UK FTSE4Good indices. The 14 indices building the group of indices who are at least eight years old contain also the ESI Pioneer Global, HVB Nachhaltigkeit, DJSI US ex TAGFA, Kempen SNS Smaller EU, Kempen SNS Smaller UK, and DJSI EuroStoxx ex TAGFA and the DJSI Stoxx ex TAGFA index. Together with the Jantzi Social, Calvert Social Ethical Euro, Ethical Global and KLD Broad Market indices the short group of at least 6 year old indices is formed. The youngest group contains 21 indices that are at least four years old and include also the Ethical Eurozone and ESI Excellence Europe indices.

54
Table 14: Joint Coefficients-Tests for Index Families
Different Index Families SRI Indices Single‐Factor Model Multi‐Factor Model
Index Group Included Start H0: all αi=0 H0: all βi=1 Spanning Test H0: all αi=0 Dow Jones SRI 4 3/1999 2,94 44,54 47,92*** 1,98
ESI SRI 2 3/2003 0,12 0,01 0,14 0,00 ECPI SRI 3 3/2001 24,70*** 10,14 31,78*** 34,00***
FTSE4GOOD SRI 5 8/1996 30,79*** 30,17 57,86*** 36,83*** KLD SRI 4 2/2001 4,73 51,67 57,63*** 12,36**
SNS SRI 2 2/1999 0,01 1,71 1,86 0,24 Dow Jones Sin 4 3/1999 2,94 44,54 47,92*** 2,90
ESI Sin 2 3/2003 3,56 2,89 4,56 1,68 ECPI Sin 3 3/2001 6,43* 20,08 25,9*** 2,09
FTSE4GOOD Sin 5 8/1996 13,09** 92,53 104,42*** 16,19** KLD Sin 4 2/2001 4,62 321,94 363,89*** 2,61
SNS Sin 2 2/1999 5,43* 343,97 373,01*** 5,26* Notes: The H0 for Table 14, 15 and 16 are tested using Chi-squared-Tests. The Degrees of freedom are equal to the number of indices included for the single-regression tests and for the joint hypothesis the degrees of freedom are equal to the number of indices multiplied by two. The figures illustrate the values of the test statistics. The *, **, *** = H0 rejected at a significance level of 10, 5 or 1 percent, respectively. For the estimations Newey/West-corrected standard errors have been used. Column 1 shows the different groups, first the SRI groups are given followed by the comparable sinful Groups. Column 2 gives the number of indices included in the group. The results of the single-factor estimation are given in Column 4, 5 and 6. Column 4 displays the outcomes of the Chi-square-test for the joint tests of the Jensen’s alpha, H0: (all αi= 0). The results for the joint- test H0: (all βi= 1) are reported in Column 5. Column 6 refers to the joint spanning test, H0: (all αi= 0 and all βi= 1). Column 7 gives the results of the multi-factor estimation for H0: (all αi= 0). The DowJones group contains of the four Dow Jones indices DJSI EuroStoxx ex TAGFA, DJSI Stoxx ex TAGFA, DJSI US ex TAGFA and DJSI World ex TAGFA. The ESI group contains the indices ESI Excellence Europe and ESI Excellence Global. The Ethical Euro Ethical Eurozone and Ethical Global form the ECPI group. The KLD Select Social, KLD Broad Market, KLD Large Cap Social and Domini 400 Social represent the KLD index group. The SNS group consists of the two indices Kempen SNS Smaller EU and Kempen SNS Smaller UK.

55
Table 15: Joint Coefficients-Tests for Index Regions
Different Index Regions SRI Indices Single‐Factor Model Multi‐Factor Model
Index Group Included Start H0: all αi=0 H0: all βi=1 Spanning Test H0: all αi=0 Global SRI 5 2/2001 7,13 31,21*** 47,21*** 7,64 USA SRI 6 2/2001 9,73 79,47*** 90,59*** 17,58***
Eurozone SRI 3 12/2000 42,29*** 43,23*** 80,03*** 49,75*** Europe SRI 6 12/2000 59,76*** 18,41*** 75,87*** 59,73*** UK SRI 2 2/1999 0,10 9,40*** 9,91** 0,37
Global Sin 5 2/2001 8,39 318,37*** 332,41*** 5,08 USA Sin 6 2/2001 12,69** 420,80*** 465,89*** 4,43
Eurozone Sin 3 12/2000 4,44 129,50*** 132,27*** 2,91 Europe Sin 6 12/2000 63,55*** 313,68*** 536,86*** 58,23*** UK Sin 2 2/1999 8,08** 338,18*** 369,84*** 4,51
Notes: The H0 for Table 14, 15 and 16 are tested using Chi-squared-Tests. The Degrees of freedom are equal to the number of indices included for the single-regression tests and for the joint hypothesis the degrees of freedom are equal to the number of indices multiplied by two. The figures illustrate the values of the test statistics. The *, **, *** = H0 rejected at a significance level of 10, 5 or 1 percent, respectively. For the estimations Newey/West-corrected standard errors have been used. Column 1 shows the different groups, first the SRI groups are given followed by the comparable sinful Groups. Column 2 gives the number of indices included in the group. The results of the single-factor estimation are given in Column 4, 5 and 6. Column 4 displays the outcomes of the Chi-square-test for the joint tests of the Jensen’s alpha, H0: (all αi= 0). The results for the joint- test H0: (all βi= 1) are reported in Column 5. Column 6 refers to the joint spanning test, H0: (all αi= 0 and all βi= 1). Column 7 gives the results of the multi-factor estimation for H0: (all αi= 0). The DJSI World ex TAGFA, ESI Pioneer Global, Ethical Global, FTSE4GOOD Global and the NAI form the Global group of indices. The Calvert Social, DJSI US ex TAGFA, Domini 400 Social, FTSE4GOOD US, KLD Broad Market and the KLD Select Social are the six indices forming the U.S. group. The Euro zone is represented by the ASPI Index, the DJSI EuroStoxx ex TAGFA and the Ethical Eurozone index. DJSI Stoxx ex TAGFA, ESI Excellence Europe, Ethical Euro, FTSE4GOOD Europe, HVB Nachhaltigkeitsindex and the Kempen SNS Smaller EU are the six indices forming the European group. The FTSE4GOOD UK and Kempen SNS Smaller UK represent the United Kingdom.

56
Table 16: Virtue vs. Vice Investment Performance
SRI Index Alpha SRI Alpha Sin Treynor SRI
Treynor BM
Treynor Sin
Sharpe SRI
Sharpe BM
Sharpe Sin
DJSI World 0,0007 0,0026 0,0046 0,0040 0,0073 0,1101 0,0982 0,1539 DJSI World ex TAGFA 0,0006 0,0026 0,0046 0,0040 0,0073 0,1092 0,0982 0,1539 ESI Pioneer Global ‐0,0002 0,0020 0,0046 0,0048 0,0073 0,1027 0,1192 0,1457
ESI Excellence Global ‐0,0001 0,0035 0,0137 0,0138 0,0178 0,4900 0,5603 0,6270 Ethical Global ‐0,0008 0,0029 0,0031 0,0038 0,0076 0,0790 0,0997 0,1663
FTSE4GOOD Global 0,0008 0,0011 0,0059 0,0051 0,0066 0,1401 0,1249 0,1383 NAI 0,0076 0,0056 0,0147 0,0099 0,0163 0,5313 0,4387 0,5979
Calvert Social ‐0,0004 0,0035 ‐0,0014 ‐0,0011 0,0044 ‐0,0358 ‐0,0268 0,0753 DJSI US ‐0,0015 0,0020 0,0003 0,0019 0,0046 0,0058 0,0455 0,0812
DJSI US ex TAGFA ‐0,0014 0,0020 0,0004 0,0019 0,0046 0,0076 0,0455 0,0812 Domini 400 Social 0,0002 0,0018 0,0065 0,0063 0,0087 0,1476 0,1553 0,1623 FTSE4GOOD USA 0,0001 0,0023 0,0048 0,0047 0,0080 0,1073 0,1067 0,1331 KLD Broad Market 0,0006 0,0016 0,0016 0,0010 0,0035 0,0369 0,0257 0,0626 KLD Large Cap Social 0,0007 0,0020 0,0011 0,0005 0,0034 0,0267 0,0118 0,0626 KLD Select Social 0,0008 0,0041 0,0068 0,0058 0,0120 0,2650 0,2641 0,3650
Jantzi Social ‐0,0001 0,0000 0,0090 0,0092 0,0092 0,1347 0,1732 0,1051
ASPI Indices 0,0024 0,0019 0,0090 0,0066 0,0088 0,1670 0,1230 0,1273 DJSI EuroStoxx 0,0001 0,0056 0,0029 0,0028 0,0087 0,0521 0,0503 0,1275
DJSI EuroStoxx ex TAGFA 0,0002 0,0056 0,0029 0,0028 0,0087 0,0525 0,0503 0,1275 Ethical Eurozone 0,0048 0,0070 0,0201 0,0150 0,0233 0,4889 0,3718 0,3790
DJSI Stoxx ‐0,0005 0,0051 0,0025 0,0031 0,0085 0,0539 0,0662 0,1582 DJSI Stoxx ex TAGFA ‐0,0007 0,0051 0,0024 0,0031 0,0085 0,0506 0,0662 0,1582 ESI Excellence Europe 0,0011 0,0052 0,0173 0,0162 0,0218 0,4046 0,4761 0,5020
Ethical Euro 0,0001 0,0060 0,0048 0,0047 0,0116 0,1010 0,1006 0,2120 FTSE4GOOD Europe ‐0,0033 ‐0,0031 0,0079 0,0111 0,0076 0,1680 0,2384 0,1349 HVB Nachhaltigkeit 0,0031 0,0045 0,0088 0,0055 0,0104 0,1447 0,0971 0,1482
Kempen SNS Smaller EU 0,0002 ‐0,0003 0,0112 0,0110 0,0106 0,1932 0,2169 0,1617
FTSE4GOOD UK 0,0000 0,0015 0,0066 0,0066 0,0086 0,1567 0,1614 0,1490 Kempen SNS Smaller UK 0,0001 0,0061 0,0079 0,0112 0,0255 0,1022 0,2121 0,1759
JSE SRI ‐0,0052 0,0016 0,0229 0,0269 0,0275 0,4323 0,4337 0,5893 Australian SAM ‐0,0013 ‐0,0073 0,0170 0,0183 0,0128 0,4550 0,4965 0,3012
FTSE4GOOD Japan ‐0,0004 0,0077 0,0089 0,0094 0,0213 0,2600 0,2798 0,5150 Notes: This Table provides an overview of the performance comparison between ethically indices and their counterparts. Column 2 and 3 give the results of the Jensen alpha for the two investment approaches. Column 4, 5 and 6 display the results of the Treynor-measure for the SRI indices, their benchmarks and unethically comparables. Column 7, 8 and 9 report the outcomes of Sharpe-ratio for the SRI indices, their benchmarks and unethically comparables. Note the significance for the coefficients is not marked. All estimations have been done for the total time series available from the start date in July 1995 until July 2007. The estimations are based on the excess returns of the indices, denominated in U.S. dollars. Newey-West (1987)-corrected standard errors have been applied.

57
References Abel, E. L. “The Gin Epidemic: Much Ado About What?” Alcohol and Alcoholism,
36 (2001), 401-405.
Adler. I. “Primary Malignant Growth of the Lung and Bronchi.” Green and
Company, New York, Longmans (1912).
Ahrens, D. “Investing in Vice: The Recession-Proof Portfolio of Booze, Bets,
Bombs, and Butts.” St. Martin's Press, New York (2004).
Asongu, J. J. “Shareowner Action Strategy: From Conflict to Collaboration.” Journal
of Business and Public Policy, 3 (2007).
Banz, R. W. “The Relationship Between Return and Market Value of Common
Stocks” Journal of Financial Economics 9 (1981), 3-18.
Bauer, R.; K. Koedijk; and R. Otten. “International Evidence on Ethical Mutual Fund
Performance and Investment Style,” Journal of Banking and Finance 29 (2005),
1751–1767.
Bello, Z. Y. “Socially Responsible Investing and Portfolio Diversification.” Journal
of Financial Research, 28 (2005), 41-57.
Breslow, L. “Encyclopedia of Public Health.” The Gale Group Inc.,
New York (2002).
Brown, S.; and W. Goetzmann; R. G. Ibbotson; and S. A. Ross. “Survivorship Bias
in Performance Studies.” Review of Financial Studies, 5 (1992), 553-580.
Carhart, M. M. “On persistence in mutual fund performance.” Journal of Finance, 52
(1997), 57-82.
Cherrington, E. H. “Standard Encyclopedia of the Alcohol Problem 6”. 1925-1930,
American Issue Publishing Co, Westerville, OH. (1925).

58
Derwall, J.; N. Guenster; R. Bauer; and K. Koedijk. “The Eco-Efficiency Premium
Puzzle.” Financial Analysts Journal, 61 (2005), 51–63.
Di Leonardo, M. “Morals, Mothers, and Militarism: Antimilitarism and Feminist
Theory.” Feminist Studies, 11(3) (1985), 599-617.
Diltz, J. D. “Does Social Screening Affect Portfolio Performance?” Journal of
Investing, 4 (1995), 64-69.
Encyclopaedia Britannica. “The Encyclopaedia Britannica 2005 Rev Ed Edition.”
Encyclopaedia Britannica (UK) Ltd, United Kingdom (2005).
Fama, E., and K. French. “Common Risk Factors in the Returns on Stocks and
Bonds.” Journal of Financial Economics, 33 (1993), 3–56.
Fama, E., and K. French. “Size and Book-to-Market Factors in Earnings and
Returns.” Journal of Finance, 50 (1995), 131–55.
Geczy, C. C.; R. F. Stambaugh; and D. Levin. “Investing in Socially Responsible
Mutual Funds.” Working Paper (2005). URL: http://ssrn.com/paper=416380, As
of: 01-07-2007, Checked: 01-10-2007.
Gilman, S. L., and Z. Xun. “Smoke: A Global History of Smoking.” Reaktion Books,
Limited (2004).
Giżycki, J., and A. Górny. „Glück im Spiel zu allen Zeiten.“ Zürich (1970).
Greene, W. H. “Econometric Analysis.” Prentice Hall, New Jersey (2003).
Haigh, M., and J. Hazelton. “Financial Markets: A tool for social responsibility?”
Journal of Business Ethics, 52(1) (2004).
Hamilton, S.; H. Jo; and M. Statman. “Doing Well While Doing Good? The
Investment Performance of Socially Responsible Mutual Funds.” Financial
Analysts Journal, 49(6) (1993), 62-66.
Hanson, D. J. “Preventing Alcohol Abuse: Alcohol, Culture and Control.” Praeger,
Wesport, CT. (1995).

59
Hong, H. G., and M. T. Kacperczyk. “The Price of Sin: The Effects of Social Norms
on Markets.” Working Paper (2005). URL: http://ssrn.com/paper=766465, As
of: 01-07-2007, Checked: 01-10-2007.
Huberman, G., and S. Kandel. “Mean-Variance Spanning.” Journal of Finance,
42(4) (1987), 873-888.
Jegadeesh, N., and S. Titman. “Returns to Buying Winners and Selling Losers:
Implications for Stock Market Efficiency.” Journal of Finance, 158 (1993),
65-91.
Jensen, M. C. “The Performance of Mutual Funds in the Period 1945-1964.” Journal
of Finance, 23(2) (1968), 389-416.
Kempf, A., and P. Osthoff. “The Effect of Socially Responsible Investing on
Portfolio Performance.” European Financial Management, forthcoming (2007).
Kim, I., and M. Venkatachalam. “Are Sin Stocks paying the Price for their
Accounting Sins?” Duke University (2006). URL:
http://dhanna.cox.smu.edu/SMUWeb/workshop/kv.pdf, As of: 01-07-2007,
Checked: 01-10-2007.
Kreander, N.; R. H. Gray; D. M. Power; and C. D. Sinclair. “Evaluating the
Performance of Ethical and Non-Ethical Funds: A Matched Pair Analysis.”
Journal of Business Finance and Accounting, 32 (2005), 1465-1493.
Lintner, J. “The Valuation of Risk Assets and the Selection of Risky Investments in
Stock Portfolios and Capital Budgets.” Review of Economics and Statistics,
47 (1965), 13-37.
Lutz, H. F. “Viticulture and Brewing in the Ancient Orient.” J. C. Heinrichs,
New York (1922).
Mallin C. A.; B. Saadouni; and R.J. Briston. “The Financial Performance of Ethical
Investment Funds.” Journal of Business Finance and Accounting, 22(4) (1995),
483-496.

60
Mazuzan, G., and J. S. Walker. “Controlling the Atom: The Beginnings of Nuclear
Regulation 1946-1962.” University of California Press (1985).
Merton, R. C. “A simple model of capital market equilibrium with incomplete
information.” Journal of Finance, 42(3) (1987), 483-510.
Moskowitz, M. R. “Choosing Socially Responsible Stocks.” Business and Society,
1 (1972), 71-75.
Newey W. K., and K. D. West. “A Simple, Positive Semi-Definite,
Heteroscedasticity and Autocorrelation Consistent Covariance Matrix.”
Econometrica, 55(3) (1987), 703-708.
Olsson, M. “Do the Nice Guys Go Home Empty handed?” Master Thesis,
Lunds Universitet (2005).
Simpson, J., and E. Weiner. “The English Dictionary.” Oxford University Press
(2004).
Roll, R. “On Computing Mean Returns and the Small Firm Premium.” Journal of
Financial Economics, 12 (1983), 371-386.
Ross, M. E. “Censorship or Education? Feminist Views on Pornography”. Christian
Century, (1990), 244-246.
Salaber J. “The Determinants of Sin Stock Returns: Evidence on the European
Market.” DRM-CEREG, Université Paris-Dauphine (2005).
Sauer, D. A. “The Impact of Socially-Responsibility Screens on Investment
Performance: Evidence from the Domini 400 Social Index and Domini Equity
Mutual Fund.” Review of Financial Economics, 6 (1997), 137-149.
Schröder, M. “Socially Responsible Investments in Germany, Switzerland and the
United States – An analysis of Investment Funds and Indices.” Centre for
European Economic Research (ZEW), Mannheim (2003).
Schröder, M. “Is there a difference? The Performance Characteristicsof SRI Equity
Indexes.” Centre for European Economic Research (ZEW), Mannheim (2005).

61
Sessa, A.; F. Conte; M. Meroni; and G. Battini. “The Cultural History of Smoking.”
Contrib Nephrol, Basel (2000).
Sharpe, W. F. “Capital Asset Prices: A Theory of Market Equilibrium under
Conditions of Risk.” Journal of Finance, 19(3) (1964), 425-442.
Sharpe, W. F. “Mutual Fund Performance.” Journal of Business, 39 (1966), 119-138.
Social Investment Forum 2005 “Report on Socially Responsible Investing Trends in
the United States.” Social Investment Forum Industry Research Program (2006).
URL: http://www.socialinvest.org/, As of: 01-07-2007, Checked: 01-10-2007.
Statman, M. “Socially Responsible Mutual Funds.” Financial Analyst Journal,
56 (2000), 30-39.
Statman, M. “Socially Responsible Indexes: Composition and performance.” (2005).
URL: http://papers.ssrn.com/sol3/papers.cfm?abstract_id=705344,
As of: 01-07-2007, Checked: 01-10-2007.
The Oxford English Dictionary (2004). Oxford University Press, Oxford (2004).
Thornton, M. “Alcohol Prohibition Was a Failure.” Policy Analysis, 157 (1991).
Treynor, J. L. “How to Rate Management of Investment Funds.” Harvard Business
Review, 43(1) (1965), 63-75.
Vice Fund Annual Report: March 2007. www.vice-fund.com (2007).
URL: http://vicefund.com/docs/vice%20fund%20brochure(single%20pages)-
.pdf, As of: 01-07-2007, Checked: 01-10-2007.
Waxler, C. “Stocking up on Sin: How to Crush the Market with Vice- Based
Investing.” Wiley, Hoboken (2004).
West's Encyclopedia of American Law Thomson Gale, Farmington Hills,
Michigan. (2005).

62
Worman, H. J. “Signals and Structural Features Involved in Integral Membrane
Protein Targeting to the Inner Nuclear Membrane.” The Journal of Cell Biology,
130 (1995), 15-27.
Zellner, A. “An Efficient Method of Estimating Seemingly Unrelated . Regressions
and Tests of Aggregation Bias.” Journal of the American Statistical
Association, 57 (1962), 500-509.

63
List of Abbreviations AF Adjustment Factor
Alpha Jensen’s Alpha
AUS Australia
ASPI Advanced Sustainable Performance Indices
Australian SAM Australian SAM Index
Beta Beta Coefficient
C Adjustment Factor
CAN Canada
Calvert Social Calvert Social Index
CAP Capitalisation
CAPM Capital Asset Pricing Model
CSPR CRSP Index
DJ Dow Jones
DJGI Dow Jones Global Indexes
DJ EuroStoxx Dow Jones Euro Stoxx 50 Index
DJ Stoxx Dow Jones Stoxx 600 Index
DJSI Dow Jones Sustainability Indexes
DJSI EuroStoxx Dow Jones EURO STOXX 50 Index
DJSI Stoxx Dow Jones STOXX Sustainability Index
DJSI US Dow Jones Sustainability United States Index
DJSI World Dow Jones Sustainability World Index
Domini 400 Social Domini 400 Social Index
DY Dividend Yield
ECPI E. Capital Partners Index Family
ER Excess Returns
ESI Pioneer Global ESI Pioneer Global Index
ESI Excellence Global ESI Excellence Global Index
ESI Excellence Europe ESI Excellence Europe Index
Ethical Euro Ethical Index Euro Index
Ethical Eurozone Ethical Euro Zone Index

64
Ethical Global Ethical Index Global Index
Eur Euro Zone
Euro Euro Zone
EU Europe
E-W Equally-Weighted
FTSE Financial Times Stock Exchange All-Share Index
FTSE All World FTSE All World Developed Index
FTSE AW USA FTSE All World US Index
FTSE Europe FTSE Developed Europe Index
FTSE Japan FTSE Japan Index
FTSE4GOOD FTSE4Good Index Series
FTSE4GOOD Global FTSE4GOOD Global Index
FTSE4GOOD Europe FTSE4GOOD Europe Index
FTSE4GOOD Japan FTSE4GOOD Japan Index
FTSE4GOOD UK FTSE4GOOD UK Index
FTSE4GOOD USA FTSE4GOOD US Index
FTSE/JSE FTSE/JSE Africa Index
GE General Electric
HML High Minus Low
HSBC Small EU HSBC Small Europe Index
HSBC Small UK HSBC Small UK Index
HVB Nachhaltigkeit HVB Nachhaltigkeitsindex
ICB Industry Classification Benchmark
Jantzi Social Jantzi Social Index
JP Japan
JSE JSE Socially Responsible Index
SNS Smaller EU Kempen SNS Smaller EU Index
SNS Smaller UK Kempen SNS Smaller UK Index
KLD Broad Market KLD Broad Market Social Index
KLD Large Cap Social KLD Large Cap Social Index
KLD Select Social KLD Select Social Index
MSCI Morgan Stanley Capital International Index
MOM Momentum Factor

65
MV Market Value
NAI Natur-Aktien-Index
NOSH Number of Shares
NOSHFF Free-Float Number of Shares
OLS Ordinary Least Squares
P Closing Price
PI Price Index
RI Return Index
RSA Republic South Africa
Russell 1000 Russell 1000 Index
Russell 3000 Russell 3000 Index
S&P 500 Standard & Poor´s 500 Index
S&P Global S&P Global 1200 Index
S&P ASX S&P ASX 200 Index
S&P/TSX S&P/TSX 60 Index
SIC Standard Industrial Classification
SIN Sinful Investment
SMB Small Minus Big
SRI Socially Responsible Investment
SR Sharpe-Ratio
STD Standard Deviation
SUR Seemingly Unrelated Regression
T-Bill Treasury Bill
TAGFA Tobacco, Alcohol, Gambling, Firearms, Armaments
TM Treynor Measure
TR Total Return Index
UK United Kingdom
US United States
Value Line Value Line Arithmetic Index

66
List of Symbols
α Jensen’s Alpha
β Beta of the Portfolio
σ Standard Deviation
ε i.i.d. Error Term with Zero Mean
μ Expected Return
n Number of Stocks
qi0 Number of shares of stock i at the base date
qit Number of Shares of Stock i at Time t
pi0 Closing Price of Stock i at the Base Date
pit Price of Stock i at Time t
R² Coefficient of Determination
R Return on Index i in Month t
rf Risk-Free Rate
R Return on a three Month T-Bill in Month t
R Return on the Benchmark Index m in Month t
S Sharpe Performance Index
Treynor Performance Index
XitUSD Cross Rate of Stock i at time t