vicious or virtuous circles? - eprints.uwe.ac.ukeprints.uwe.ac.uk/29286/1/tapp et al 20mph...
TRANSCRIPT

Vicious or virtuous circles?
Exploring the vulnerability of drivers to break low urban speed limits
Alan Tapp
Adrian Davis
Clive Nancarrow
Simon Jones
AbstractLevels of support for 20mph limits in Great Britain are consistently high. However, these positive attitudes are not translating into similarly positive behaviour changes in terms of complying with these new speed limits. Recent research from the authors studied the complex relationship between support and compliance, with qualitative findings suggesting that copycat driving could create a ‘vicious circle effect’ that leads to increased levels of non-compliance. However it is also possible that an alternative ‘virtuous circle’ effect may emerge from the high levels of societal support for 20mph limits pressurising drivers to comply with speed limits. In this work the authors investigated these issues and we report on data and analysis of a large scale survey of drivers and residents undertaken in Great Britain. We explain the origins of vicious and virtuous circles in driver behaviour and study the data from the survey, offering an analysis of attitudes and claimed behaviours that has implications for policy-makers and professionals working with low urban speed limits. We discuss the issues for speed limit enforcement, making reference to the public relations ‘battle’ for public opinion. It is concluded that normative compliance, triggered by community and other campaigning, may be the most realistic mechanism for countering the difficulties of government funding in promoting compliance.
Background and contextMomentum towards 30kph (in the UK 20mph) speed limits in urban settings is increasing in many places in the world. For example across Europe there have been calls for EU wide implementation of 30kph limits in residential areas (Koch Report, 2011; European Citizen’s Initiative, 2015). By 2015 about 20% of urban streets within Great Britain were designated 20mph limits, and at the time of writing many other authorities planned to introduce low speed limits into their urban areas. The drivers of these policies may vary from city to city. They range from road danger reduction (Grundy et al., 2009; Pilkington, 2000), encouraging healthier and more sustainable transport modes such as walking and cycling (Cohen et al 2014), through to the encouragement of community benefits in health, wellbeing and social capital (Dorling, 2014; McCabe et al., 2013; Elvik, 2012; Pilkington, 2009).
Surveys indicate that there has been consistent majority support (typically at 65% or more) from the Great Britain population as a whole for lowered urban speed limits (see for example British Social Attitudes Survey for the Department for Transport, 2012). However, these limits have also attracted an opposition that is particularly vocal amongst pro-business and pro-car groups. As a result the debate in Britain has to some extent become polarised in terms of attracting comment and debate in the media, within local communities, and even to some extent as a political issue locally and

nationally. Both support and opposition have been codified through their representation by organised groups. Support groups include organisations such as Sustrans (an active travel charity), Living Streets (who support the use of residential roads as urban living spaces and want restrictions on car use), and campaigning group 20s Plenty. In contrast opposition groups include the Association of British Drivers and the Federation of Small Business, with arguments typically focused on the need to keep the economy moving, or on the ‘freedoms’ of motorists.
The complexity of factors influencing support for 20mph limits is matched by similar or even greater complexity with respect to compliance with speed limits. Previous work on 20mph speed limits (Tapp et al., 2015; Toy et al., 2014) illustrated the interesting paradox commonly found with speed limits: that whilst apparent support for 20mph limits was high, driver compliance with the limit was much more problematic. International evidence across various speed limits suggests that non-compliance is common, with speed limit reductions (typically of 10kph or more) leading to typical average speed reductions of only 1-5kph (Islam et al., 2013; Hyden et al., 2008; Wernsperger and Sammer, 1995; and in the UK see Atkins, 2010; Bristol City Council, 2011). This and other data led the UK Government’s Department for Transport (2013) to conclude that ‘research into signed-only 20 mph speed limits shows that they generally lead to only small reductions in traffic speeds’. Clearly there are significant challenges in converting support into compliance when a limit is initially changed.
The Tapp et al. (2015) work indicated how drivers occupy different positions on spectra of support – opposition and compliance - non-compliance. Many drivers (let’s call them the ‘mainstream middle’) are likely to occupy a ‘middle ground’ between the two extremes of strong support on the one hand and equally strong opposition on the other. This ‘mainstream middle’ is the focus of this paper, with the hypothesis that these drivers exhibit attitudes and driving behaviours with respect to 20mph limits that are much less strongly formed, probably less informed by knowledge of the issues, and hence more susceptible to change. Based on a survey of attitudes to their own and other people’s driving habits, the focus here is to examine how drivers’ contradictory attitudes, reinforced by on-road perceptions, may change their initial compliance intentions. In particular, we examine the effects of other drivers on driving (social contagion), ingrained driving habits (automaticity), perceived low levels of enforcement, and levels of personal confidence in breaking limits (self enhancement bias). These variables are of particular concern because they imply vicious circles over time – that is, they may create viral effects that multiply as more and more drivers don’t comply. On the other side of the debate we also examine the possibility of a ‘word of mouth’ influence of others that may help create a virtuous circle of increased compliance.
Social contagion and automaticity are both well understood effects on driver behaviour. Both are surreptitious, unconscious modes of driving, with effects ‘creeping up’ on the driver insidiously. Social contagion consists of the driver ‘copycatting’ the speeds of other drivers simply to ‘fit in’ (Corbett and Simon, 1992; Connelly and Aberg, 1993; Fleiter et al., 2010). Copycatting seems to result in slower drivers adopting higher speeds rather than the reverse (Stradling et al., 2003). This may be because drivers typically over-estimate the speeds of other drivers, creating ‘distorted’ norms that then create a vicious circle effect of faster traffic (Haglund and Aberg, 2000; Musselwhite et al., 2010). In the 20mph/British context, ‘copycat’ pressures may be exacerbated by the creation of 20mph limits on roads built decades previously, and originally designed without consideration of low urban speed limits (Toy et al., 2014). ‘Copycat’ driving may be a particular form of automaticity: a more general type of ‘inadvertent speeding’ (Simon and Corbett, 1991) that arises from a lack of active concentration whilst driving. Corbett and Simon’s (1992) study found 46% of drivers who
exceeded the limit claimed to speed ‘without realising it’, an effect also noted by Recarte and Nunes (2002), De-Pelsmacker and Janssen (2007) and Forward (2009). The issue of enforcement is also very important. Driver compliance is likely to be influenced by perceptions of whether the authorities are ‘serious’ about the new limits, to the extent that they will be adequately enforced, something far from certain with the UK’s Department for Transport (2013) warning that ‘successful 20 mph speed limits will need to be generally self-enforcing’. The contestation by the public of the risks of speeding by some drivers (Mannering 2009) can lead to them rejecting the legitimacy of speed limits per se (McKenna, 2010; Wells, 2012). These factors can combine to create the somewhat paradoxical resentment felt by drivers caught speeding of being labelled as ‘law breakers’, even while they continue to support speed limits in principle (Wells, 2012).
However it remains the case that support for speed limits remains high amongst the population as a whole, including support for 20mph limits. It is therefore also possible for an alternative outcome to arise, that of a ‘norm’ of general compliance, driven by a possible cultural shift against car-dominance from ‘residents’ as opposed to ‘drivers’. Whilst cultures that prioritise the needs of local residents are more common in some parts of the world, for example in many northern European countries, in the UK this would require a cultural ‘shift’, something campaigned for by the likes of Living Streets. Such a shift in attitudes may be bolstered by compliant buffer groups: drivers who feel a strong moral obligation to obey speed limits, in spite of some of these drivers attitudinally opposing the creation of the new limit (Fleiter et al., 2007; Tapp et al., 2015).
In summary, the compliance level of drivers, especially when a new speed limit is introduced, is unlikely to be a fixed entity. Rather, it seems to be susceptible to influence by a range of effects.
Diagram 1 provides a theoretical framework that encompasses the key constructs that we examined for this research. The intention here is not to predict intention to comply, but rather to illustrate the hypothesis, explored later, that a driver’s own personal beliefs may be over-ridden or eroded by the various change agents illustrated in diagram 1. Key constructs include levels of support, the influence of other drivers, claimed driving skills, and habits. Locating this work within the literature, we note that these constructs have been combined into a driver behaviour model (Elliott et al 2007), based on the integrated Theory of Planned Behaviour (Ajzen 1991) and combined with work on habits by Triandis (1980).

Diagram 1: Theoretical framework illustrating influences on compliance
(source: authors)
Change agents may act on beliefs and values, social norms, driving skills and habits. For instance one side or another of the debate may gain rhetorical advantage within the media portrayal of newly introduced speed limits. Social influences are likely to be important. Cialdini (2007, p129) found that social influences are at their strongest during periods of uncertainty, such as when a new situation arises. When a new speed limit is introduced into a town, drivers, faced with this new situation, may look around to see how others behave. Descriptive norms (a belief that others are (not) complying with speed limits) and injunctive norms (a belief that others should (not) comply) may be of particular importance here. In turn, these normative influences may feed into driving behaviours through subtle changes in habit, with drivers unconsciously increasing their average speeds to ‘fit in’ with other traffic (copycat driving).
Possible shifts towards increased non-compliance, or in contrast to higher compliance, are difficult to forecast. In this paper we examine these uncertainties, using a recent survey of Great Britain drivers to address two broad questions. Firstly, we examine the data for evidence of vulnerability to shift from either compliance to non-compliance (or non-compliance to compliance). Second, we examine and discuss the attitudes that appear to drive these vulnerabilities. We use these analyses to discuss the strategic options open to campaigners and policy makers wishing to influence behaviours.
Research objectivesThe results to follow address the following specific objectives:
Indications of vulnerability:1. To identify the extent that some attitudes contradict claimed support for 20mph limits,
and/or subsequent claimed compliance with 20mph limits.

2. To identify groups of drivers (is there a ‘mainstream middle’?) who are vulnerable to shifting from compliance (or not committed) to non-compliance.
Explanations of vulnerability and strategic options to address it:3. To identify the reasons for support and opposition that offer campaigners the greatest
potential to build upon their arguments.4. Determine the direction and strength of word of mouth effects 5. Determine the level of support for taking active roles in supporting 20mph limits
MethodologyFieldwork and sampleThe survey was administered in the summer of 2015 by YouGov, a reputable and well established polling and research company that is regularly used by government, charity and university sectors. The sample of 3036 respondents was randomly chosen from a large on-line panel, with the sample profiled to fit the Census derived demographics of the Great Britain population in terms of gender, age, socio-economic grade and regions. A probability (stratified random) technique of sampling was used to permit statistical inference. The net effective sample size (neff), i.e. the sample size that is permissible for statistical tests after weighting procedures, was 3001 and for motor vehicle drivers 2075. Fieldwork was undertaken between 18th May and 5th June.
On-line surveys have various advantages, not least favourable costs and rapid fieldwork time that enabled a large sample to be obtained yielding greater statistical reliability for the total sample and sub-samples. In addition, respondents could answer questions in their own time without being pressured. Importantly, there is also evidence that on-line surveys reduce socially desirable responding effects (a very real threat for this topic) and so enhance the validity of the data. Every mode of data collection has potential biases and we believe online access panels provide a sufficiently valid option. We append a note on our rationale for selecting an online access panel (Also see Nancarrow and Tapp (2014) and the references therein for an in-depth evaluation of on-line panels).
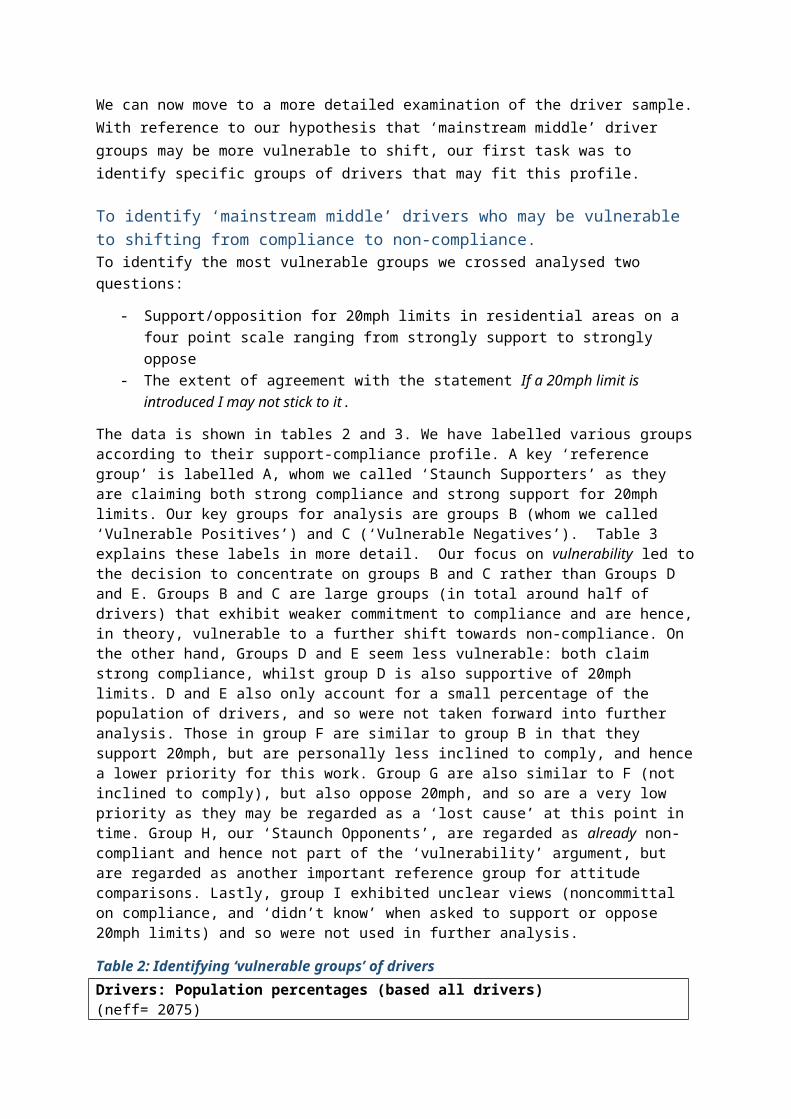
Questionnaire and analysisThe two key measures that formed the primary analysis were firstly an (attitudinal) examination of support or opposition with 20mph limits by asking how strongly do you support or oppose a 20mph speed limit in residential areas? This was asked on a four point scale of strongly support—support—oppose—strongly oppose. Secondly a (claimed behavioural) measure of intended compliance or non-compliance of driving within the new limits was obtained by asking for agreement with if a 20mph speed limit is introduced, I may not stick to it using a five point Likert scale of agreement. Various other measures of attitudes and claimed behaviours were also gathered to explore support and compliance. Five point Likert scales measured agreement with scale items such as if I think a road with a 20mph limit is clear I will be more likely to drive more quickly than 20 mph; on occasions, I knowingly drive faster than speed limits where I think I can do so safely and so on. The support-oppose question was placed early within the survey in order to avoid it being affected by the other scales that might introduce issues respondents had not thought of beforehand (in other words, allowing the survey to inadvertently act as an education vehicle to colour opinion). Where appropriate scale response options were randomised in terms of the order presented to respondents (for example reasons for supporting/opposing 20mph limits).

ResultsThe focus of this paper is primarily on motor vehicle drivers, though we do examine all adults in terms of possible word of mouth influence and readiness to be part of a pro 20mph campaign.
We began by seeking indications of possible vulnerability to shift from compliance with 20mph limits to non-compliance.
To identify ‘headline’ results that highlight how attitudes may contradict claimed compliance with 20mph limits We conducted an initial test for ‘vulnerability to shift’ by examining the responses of ‘compliant’ drivers to other statements (see Table 1) indicating behavioural non-compliance – in other words, views that seemed to contradict their stated intent to comply. Compliant drivers are defined as those who disagreed with the statement If a 20mph limit is introduced I may not stick to it. 46% of all drivers disagreed with this statement and were therefore defined as (claimed) ‘compliers’.
From Table 1, it is clear from these statements (which are not mutually exclusive) that there are a mix of factors that may reduce compliance. A ‘catch all’ phrase capturing the difficulty of staying at 20mph gained highest agreement (a), alongside issues relating to the influence of (or pressure from) surrounding divers (b), ‘instrumentally motivated speeding’ (c) and unconsciously breaking limits (d).
Table 1: Attitudes that contradict claimed complianceScale
Base = drivers who ‘may comply’
neff* = 938
% of compliers who agree
a) It is just too difficult to stay at 20mph 25b) I tend to drive at the speed of other people on the road 22c) If I think a road with a 20mph limit is clear I will be more likely to drive more quickly than 20 mph
14
d) I tend to unconsciously drive faster than speed limits quite often 11Notes: % compliers calculated as % of all drivers who agree they may comply with 20mph limits.*neff = effective sample size
We can now move to a more detailed examination of the driver sample. With reference to our hypothesis that ‘mainstream middle’ driver groups may be more vulnerable to shift, our first task was to identify specific groups of drivers that may fit this profile.
To identify ‘mainstream middle’ drivers who may be vulnerable to shifting from compliance to non-compliance.To identify the most vulnerable groups we crossed analysed two questions:
- Support/opposition for 20mph limits in residential areas on a four point scale ranging from strongly support to strongly oppose
- The extent of agreement with the statement If a 20mph limit is introduced I may not stick to it.
The data is shown in tables 2 and 3. We have labelled various groups according to their support-compliance profile. A key ‘reference group’ is labelled A, whom we called ‘Staunch Supporters’ as they are claiming both strong compliance and strong support for 20mph limits. Our key groups for analysis are groups B (whom we called ‘Vulnerable Positives’) and C (‘Vulnerable Negatives’). Table
3 explains these labels in more detail. Our focus on vulnerability led to the decision to concentrate on groups B and C rather than Groups D and E. Groups B and C are large groups (in total around half of drivers) that exhibit weaker commitment to compliance and are hence, in theory, vulnerable to a further shift towards non-compliance. On the other hand, Groups D and E seem less vulnerable: both claim strong compliance, whilst group D is also supportive of 20mph limits. D and E also only account for a small percentage of the population of drivers, and so were not taken forward into further analysis. Those in group F are similar to group B in that they support 20mph, but are personally less inclined to comply, and hence a lower priority for this work. Group G are also similar to F (not inclined to comply), but also oppose 20mph, and so are a very low priority as they may be regarded as a ‘lost cause’ at this point in time. Group H, our ‘Staunch Opponents’, are regarded as already non-compliant and hence not part of the ‘vulnerability’ argument, but are regarded as another important reference group for attitude comparisons. Lastly, group I exhibited unclear views (noncommittal on compliance, and ‘didn’t know’ when asked to support or oppose 20mph limits) and so were not used in further analysis.
Table 2: Identifying ‘vulnerable groups’ of drivers Drivers: Population percentages (based all drivers)(neff= 2075)
Support StronglySupport Support Oppose Strongly
OpposeDon’t Know
ComplianceStrongly non-compliant 0.5 0.5 (G) 0.8 3.2 (H) 0.2Moderately non-compliant 2.8 (F) 8.2 (F) 8.5 (G) 6.0 (G) 1.3Noncommittal (neither agree nor disagree 4.6 (B) 7.0 (B) 6.0 {C} 2.8 {C} 2.1 (I)
Moderately compliant 11.6 (B) 10.6(B) 5.0 {C) 2.0 {C} 0.8Strongly compliant 8.5 (A) 3.4 (D) 1.9 (E) 1.1 (E) 0.5
Table 3: Naming the key groups
A Strongly inclined both to support and to comply Staunch Supporters
B Only moderately positive to comply or non-committal, but supportive of 20mph, hence ‘positives’
Vulnerable Positives
C Oppose 20mph (hence ‘negatives’) but either moderately disposed to comply or non-committal
Vulnerable Negatives
H Strongly likely not to comply and strongly oppose 20mph Staunch Opponents
Thus far we have identified four important groups in terms of the strength of their responses to support and compliance.
A test was then carried out to check the hypothesis that the two Vulnerable groups are distinct and different from Staunch Supporters and Staunch Opponents. We examined responses to the questions here are some reasons people might support/oppose 20mph speed limits. Which of these do you agree with? If the volumes of responses obtained from the middle two vulnerable groups were different to the volumes from Staunch Supporters and Staunch Opponents, this would indicate differences in the level of consideration given to 20mph speed limits. As can be seen in Table 4 below the Vulnerable Positives tick fewer ‘reasons to support’ than Staunch Supporters, and similarly the Vulnerable Negatives tick fewer ‘reasons to oppose’ than Staunch Opponents. These tests therefore indicate a ‘middle ground’ of drivers with more moderate views.

We will return to the specific statements in the table later in the paper.
Table 4: Reasons for support and opposition to 20mph limitReasons to support Staunch
SupportersVulnerable Positives
Vulnerable Negatives
Staunch Opponents
Sample of four groups neff=1266
a
176
%
b
698
%
C
324
%
d
68
%
Fewer serious accidents 91Cd
88cd
54D 10
Mean children can play more safely 78Bcd
70cd
45D 13
Make our streets more pleasant to live in 73Bcd
56cd
21D 1
Encourage more walking and cycling 42Cd
35cd 17 8
Reduce noise 49Bcd
35cd
17D 3
Improve the quality of life 47Bcd
27cd
12D 1
Reduce pollution 39Bcd
22cd 11 5
Improve traffic flow 35Bcd
22cd
13D 1
Reduce congestion 29Bcd
15cd 7 1
Encourage a healthier way of life 24bcd
16cd 6 3
None of these 1 2 25Ab
72abc
Don’t know - 1 3 -
Volume of advantages mentioned 506 386 202 46
Reasons to OpposeBe ignored by many drivers so of limited benefit 42 57
a59A
76abc
Not be policed and enforced effectively 54 57c 50 54
Be pointless as many people will ignore them 33 46a
57Ab
79abc
Make journey times longer 23 33a
52Ab
81abc
Increase congestion 12 23a
53Ab
74abc
Increase pollution 7 13a
32Ab
58abc
Be too expensive 4 6 15Ab
36abc
Increase accidents 1 3 12Ab
38abc
Make the quality of life worse for residents 3 6 18Ab
52abc
None of these 28bcd
13cd 6 1
Don’t know 2 3 3 -
Volume of disadvantages 179 243 348 548Note: columns are marked as a,b,c,d. Differences between each column are significant at p>0.05 if marked accordingly
Causes of vulnerabilityThe data reported thus far indicates initial support for the idea of ‘vulnerability to shift’, in particular from compliance to non-compliance. We now move to a more in-depth analysis of the survey results
to examine possible causes of this vulnerability. We examined negative statements about 20mph limits that gained the highest levels of response for each of our four groups. By levels of response we determined:
a) The percentage that agree with each statementb) The percentage that agree plus those who neither agree nor disagree with each statement
(and who, it is implied, are potentially more open to persuasion).
Key results are shown in Table 5 (a fuller table with accompanying narrative is available in Appendix 2 (Table A1) that examines the statistically significant differences). Examining our two ‘Vulnerable’ groups it is clear in the first three statements there is the potential for widespread scepticism about 20mph limits being obeyed/effective partly because of lack of enforcement and partly a lack of belief in the ability/willingness of other drivers to comply:
Scepticism People will ignore 20mph limits because they don’t see themselves getting
caught by the police If 20mph limits were introduced most drivers would not stick to them 20mph limits are a good idea in theory but are unlikely to make a worthwhile
difference
Moving down the list, it becomes clear that this scepticism may be reinforced by a series of conscious and unconscious factors, including copycat and unconscious behaviours that are of particular danger in creating non-compliance norms – we raise this again in our discussion later.
Conscious and unconscious factors Most people who break 20mph speed limits don’t mean to, they simply didn’t
notice the limit was 20mph (Excusing the Behaviour) I tend to drive at the speed of other people on the road (Herd Behaviour) It is just too difficult to stay at 20mph (Excusing the Behaviour) If I think a road with a 20mph limit is clear I will be more likely to drive more
quickly than 20 mph (Consciously breaking the limit) I tend to unconsciously drive faster than speed limits quite often (Unconsciously
breaking the limit) I use my own judgement, not speed limits, to decide on my speed on the road
(Consciously breaking the limit) I am a better than average driver (Self enhancement bias)
As one might expect Vulnerable Negatives were more vulnerable than Vulnerable Positives. From the policy maker or campaigner’s viewpoint it is also important to note scepticism of the likely success of 20mph limits even amongst its Staunch Supporters. However, Staunch Supporters’ claimed law-breaking behaviour is relatively low against that of the other groups.
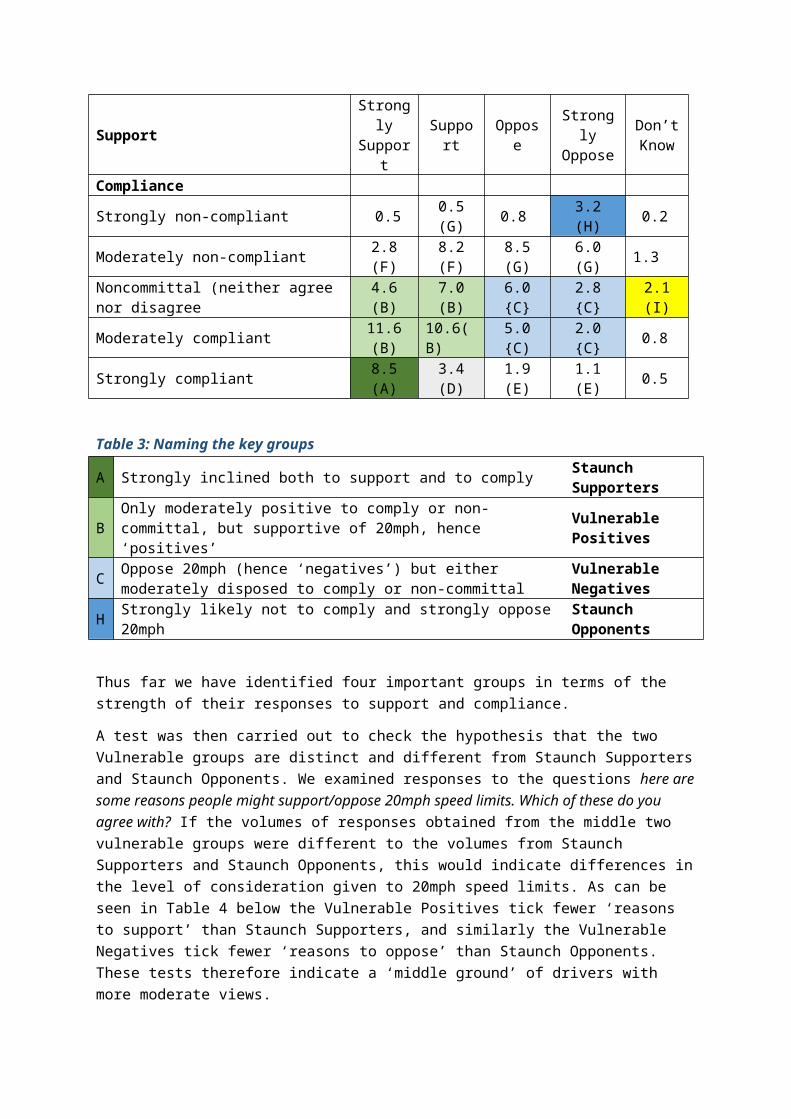
Table 5: Beliefs and behaviour that threaten 20mph complianceSum of % that agree and % who are non-committal
Also shown in brackets (% who agree)
(a)
Staunch Supporters
(b)
Vulnerable Positives
(c)
Vulnerable Negatives
(d)
Staunch Opponents
Drivers neff = 176 698 324 68StatementPeople will ignore 20mph limits because they don’t see themselves getting caught by the police
87 (74) 92 (74) 91 (63) 91 (75)
If 20mph limits were introduced most drivers would not stick to them 80 (61) 86 (67)
a90 (78)
a93 (93)
a20mph limits are a good idea in theory but are unlikely to make a worthwhile difference
38 (21) 69 (40)ad
84 (65)abd
55 (39)abc
Most people who break 20mph speed limits don’t mean to, they simply didn’t notice the limit was 20mph
51 (27) 69 (37)a
75 (48)ab
79 (53)ab
I tend to drive at the speed of other people on the road 35 (12) 63 (31)
a70 (34)
ab87 (66)
abc
It is just too difficult to stay at 20mph 16 (10) 57 (33)a
83 (61)ab
98 (94)abc
If I think a road with a 20mph limit is clear I will be more likely to drive more quickly than 20 mph
11 (6) 52 (23)a
64 (29)ab
99 (93)abc
I tend to unconsciously drive faster than speed limits quite often 13 (6) 43 (17)
a46 (16)
a62 (48)
abcI use my own judgement, not speed limits, to decide on my speed on the road
17 (9) 40 (17)a
53 (22)ab
89 (85)abc
I don’t much engage with speed limits, I just go with the flow 9 (4) 32 (6)
a38 (11)
a82 (54)
abc
I am a better than average driver 31 (94) 34 (91) 37 (95) 56 (94)abc
I hope the police will enforce 20mph limits (a positive statement)
99 (94)cd
95 (75)cd
65 (29)d 7 (6)
Notes: 1. Bolded data indicates majority agreement plus no opinion. 2. Columns are marked as a,b,c,d. Differences between each column for majority agreement plus no opinion are significant at p>0.05 if marked accordingly.
Determine the potential for word of mouth It is clear that the majority of our results thus far do not paint an optimistic picture for shifts in the direction of increased compliance. However, we were curious about possible word-of-mouth influences that may affect the levels of support versus opposition to 20mph limits. Hence, we gathered data relating to ‘word of mouth’ effects. Table 6 summarises the responses to questions asked about claimed knowledge of 20mph limits, the extent of discussions, and the extent to which respondents may be influenced by others. The data is split by the levels of support and opposition to 20mph limits.

Table 6: Possible Word of Mouth Effects Relating to 20mph limits Strongly
support Support Oppose Strongly
oppose Total n
All adults: column neffs 987 899 549 356 3001 % agree % agree % agree % agree I believe I am one of the first amongst the people I know to appreciate the wider impact of the 20 mph speed limit
23 11 8 15 14
I have discussed the 20mph speed limit with other people 29 16 20 41 23
Drivers: column neffs 582 616 461 314 2075I am influenced by more experienced or skilful drivers that I know personally 25 27 25 28 26
Note: Total includes Don’t Knows
These proportions suggest that strong supporters in general seem more likely to influence others with regard to issues concerning 20mph limits, and that therefore it is possible that ‘word of mouth’ is one mechanism that may encourage a small ‘net shift’ towards compliance as opposed to non-compliance. That said, those who strongly oppose 20mph limits were the group most likely to have discussed 20mph limits with others – a concern, albeit somewhat mitigated by their lower numbers (4.8% of the total sample) compared to those who strongly support (9.5% of the total sample). Little difference was found between groups in terms of being influenced by others. Of course, it is very difficult to estimate the effect of word of mouth activity on subsequent attitude change, and thence to behaviour change, however it is likely that some drivers are susceptible to influence from important people known personally.
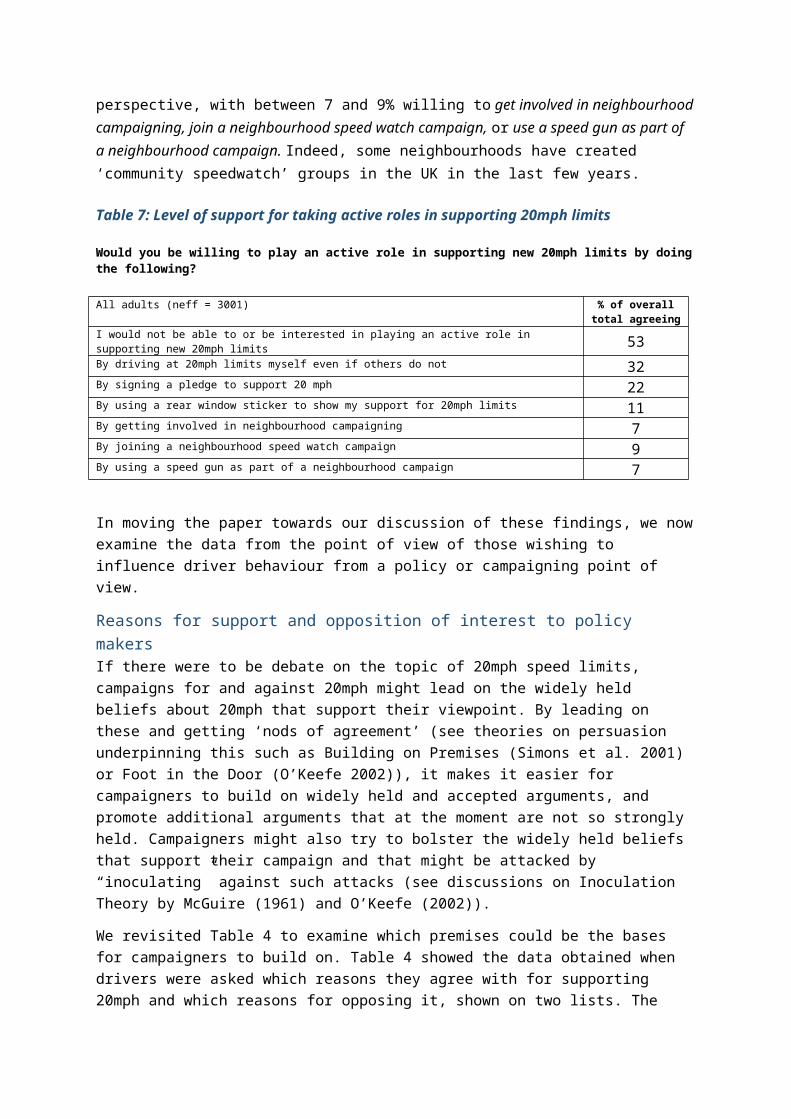
Determine the level of support for taking active roles in supporting 20mph limits We asked if respondents were willing to take an ‘active role’ of some sort (various options were presented based on the preparatory work of Toy et al 2014) in supporting new 20mph limits (Table 7). Whilst the most popular option amongst all respondents was (not surprisingly) that they would not want to take an active role, there is encouragement for supporters here in that surprisingly high proportions were willing to drive at 20mph even if others do not, sign pledges, and deploy rear window stickers. It was also surprising to see the levels of interest in very active campaigning from a resident perspective, with between 7 and 9% willing to get involved in neighbourhood campaigning, join a neighbourhood speed watch campaign, or use a speed gun as part of a neighbourhood campaign. Indeed, some neighbourhoods have created ‘community speedwatch’ groups in the UK in the last few years.
Table 7: Level of support for taking active roles in supporting 20mph limits
Would you be willing to play an active role in supporting new 20mph limits by doing the following?
All adults (neff = 3001) % of overall total agreeing
I would not be able to or be interested in playing an active role in supporting new 20mph limits 53By driving at 20mph limits myself even if others do not 32

By signing a pledge to support 20 mph 22By using a rear window sticker to show my support for 20mph limits 11By getting involved in neighbourhood campaigning 7By joining a neighbourhood speed watch campaign 9By using a speed gun as part of a neighbourhood campaign 7
In moving the paper towards our discussion of these findings, we now examine the data from the point of view of those wishing to influence driver behaviour from a policy or campaigning point of view.
Reasons for support and opposition of interest to policy makersIf there were to be debate on the topic of 20mph speed limits, campaigns for and against 20mph might lead on the widely held beliefs about 20mph that support their viewpoint. By leading on these and getting ‘nods of agreement’ (see theories on persuasion underpinning this such as Building on Premises (Simons et al. 2001) or Foot in the Door (O’Keefe 2002)), it makes it easier for campaigners to build on widely held and accepted arguments, and promote additional arguments that at the moment are not so strongly held. Campaigners might also try to bolster the widely held beliefs that support their campaign and that might be attacked by “inoculating” against such attacks (see discussions on Inoculation Theory by McGuire (1961) and O’Keefe (2002)).
We revisited Table 4 to examine which premises could be the bases for campaigners to build on. Table 4 showed the data obtained when drivers were asked which reasons they agree with for supporting 20mph and which reasons for opposing it, shown on two lists. The most widely held beliefs (they obtained greater than 50% agreement) amongst the vulnerable groups that could provide opportunities for follow up arguments are:
Campaigning for 20mph limits:
- Fewer serious accidents (Vulnerable Positives) - Mean children can play safely (Vulnerable Positives)- Make our streets more pleasant to live in (Vulnerable Positives)
(Guarding against) opposition to 20mph limits:
- Be ignored by many drivers (both vulnerable groups)- Not be policed and enforced effectively (Vulnerable Positives)Be pointless as many people
will ignore them (Vulnerable Negatives)- Make journey times longer (Vulnerable Negatives)- Increase congestion (Vulnerable Negatives)
We now move to a discussion of the implications of all these findings.
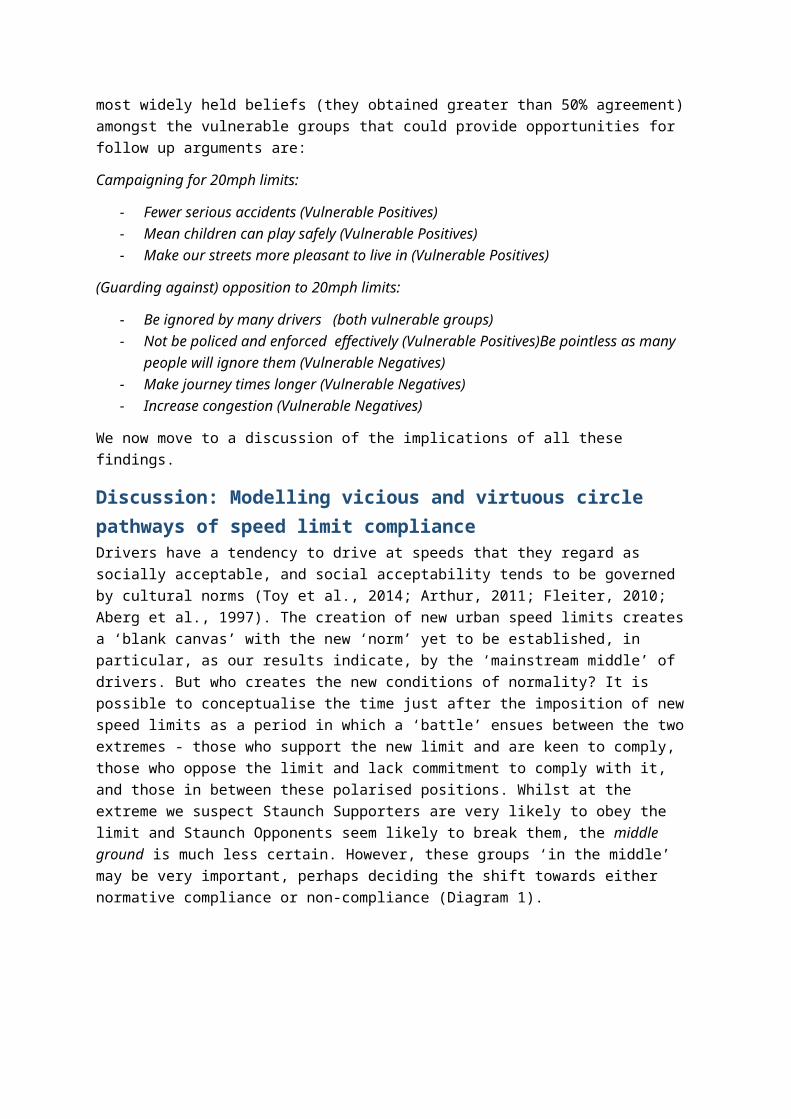
Discussion: Modelling vicious and virtuous circle pathways of speed limit complianceDrivers have a tendency to drive at speeds that they regard as socially acceptable, and social acceptability tends to be governed by cultural norms (Toy et al., 2014; Arthur, 2011; Fleiter, 2010; Aberg et al., 1997). The creation of new urban speed limits creates a ‘blank canvas’ with the new ‘norm’ yet to be established, in particular, as our results indicate, by the ‘mainstream middle’ of drivers. But who creates the new conditions of normality? It is possible to conceptualise the time just after the imposition of new speed limits as a period in which a ‘battle’ ensues between the two
extremes - those who support the new limit and are keen to comply, those who oppose the limit and lack commitment to comply with it, and those in between these polarised positions. Whilst at the extreme we suspect Staunch Supporters are very likely to obey the limit and Staunch Opponents seem likely to break them, the middle ground is much less certain. However, these groups ‘in the middle’ may be very important, perhaps deciding the shift towards either normative compliance or non-compliance (Diagram 1).
Diagram 1: Vicious or virtuous circles of compliance with speed limits?
The results earlier suggested that either ‘vicious’ or ‘virtuous’ circle effects may ensue, leading to reduced or increased compliance respectively. Both effects are now explained, with the aim of aiding scenario planning for stakeholders wishing to influence the processes. Of course, the cross-sectional nature of the data means that they should not be regarded as forecasts of future trends.
The first possibility is that of a ‘vicious circle’ of increased non-compliance.
Modelling a vicious circle of increased non-compliance It is possible to model factors that may influence drivers to switch from compliance to non-compliance (Diagram 2). (See Appendix 3 for correlations of compliance with these ‘vicious circle’ variables).
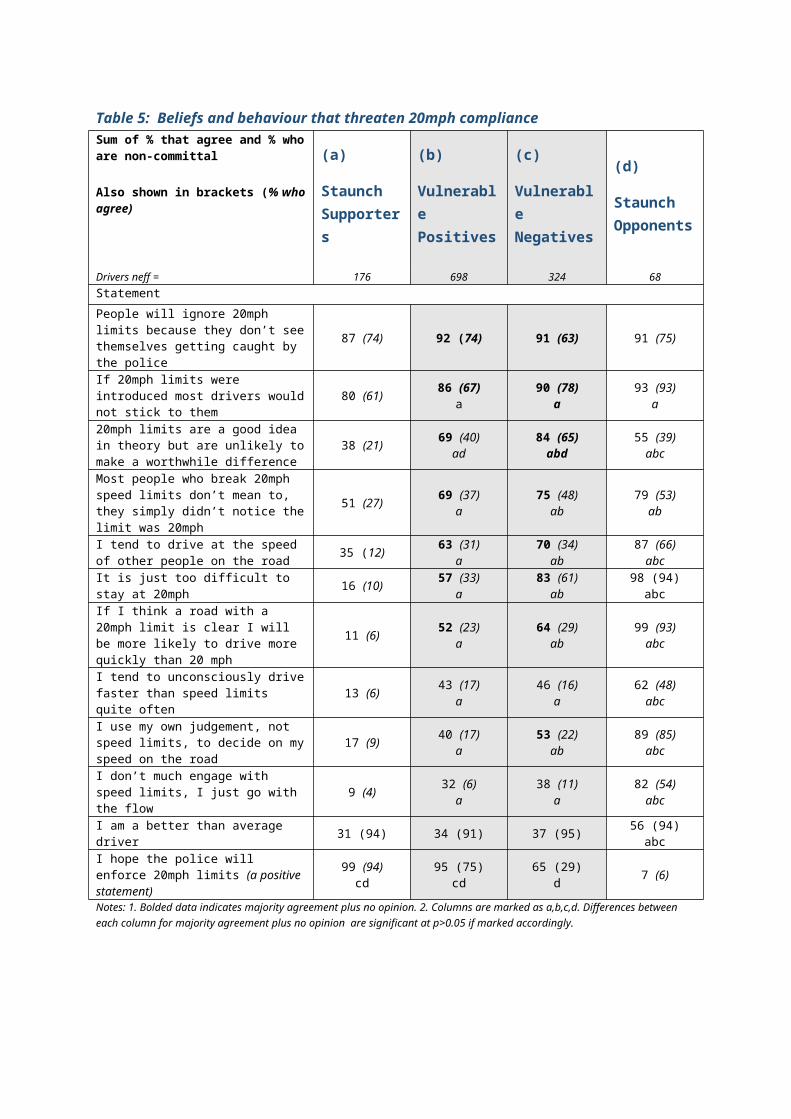
Diagram 2: A model of ‘vicious circle’ effects turning compliance into non-compliance
(The % data for diagram 1 was presented in Table 1)
What does the data suggest drivers are likely to do? It is possible a number of factors may combine together in creating a non-compliance norm: initially ‘unconscious’ (automatic) and ‘conscious’ (instrumental) speeding, and a lack of belief in enforcement (that is probably reinforced by the reality) may kick-start the shift towards non-compliance. This non-compliant norm may be accelerated beyond return by ‘copycat driving’ (Corbett and Simon, 1992; Connelly and Aberg, 1993; Fleiter et al., 2010) that tips initial compliers into non-compliance. Increased non-compliance in turn increases the difficulty for compliant drivers to remain so – the vicious circle takes effect. The final consequence of this chain of events may be the spread of ‘pluralistic ignorance’ (Miller and McFarland 1991) which is a misplaced belief that most others don’t support 20mph limits (this was confirmed by our data – when asked whether most people in the country support 20mph limits, only 12% agreed, while 38% disagreed (n=all adults, 3001)) and consequent ‘spiral of silence’ (increasing tendency to avoid voicing one’s own opinion due to a lack of others voicing theirs, and an incorrect conclusion that they will be socially punished (Noelle-Neumann 1993)).
An alternative model - a virtuous circle of increased compliance - is also possible. This is discussed next.

Modelling a virtuous circle of increased compliance Table 6 indicated ‘word of mouth’ influences spread across both supporters and opponents of 20mph limits. The higher incidence of these effects amongst supporters suggests that word of mouth may influence compliance more than non-compliance. If so, the ‘battle for the middle ground’ may be shifted in favour of compliance (Diagram 3).
Diagram 3: Possible Group-Group Word of Mouth Influences
In addition to word of mouth effects, advocates of 20mph limits will be pleased with the seemingly quite high levels of ‘active support’ for 20mph limits (Table 7). An illustrative process model fuses together the positive influences on compliance that may emerge from both citizen activism and word of mouth (Diagram 4). (See Appendix 3 for correlations of compliance with these ‘virtuous circle’ variables).
Diagram 4: A process model of virtuous circle effects

Notes on diagram 4* Sample of all adults (n=3001) were asked for their agreement with these statements** see Table 6 *** see Table 7
In contrast to the vicious circle model earlier, this scenario assumes that the high levels of attitudinal support within Great Britain for 20mph limits will prevail. In this scenario, positive word of mouth and neighbourhood activism are the drivers of increased compliance in residential streets, with a consequent norm of compliant driving established, and speeding becoming socially unacceptable. However, the model also includes hopes for enforcement, but it should be acknowledged that current policies of minimal police enforcement would seemingly make this scenario less likely to prevail.
Compliance: policy and practice issuesThe behavioural outcomes modelled above rest upon two key underlying processes that policymakers may want to address: first, the role of public opinion in shaping word of mouth towards support or opposition (an attitudinal model), and second, the role of social norms in setting ‘acceptable’ boundaries for driving (a behavioural model).
In Great Britain public opinion is shaped by a variety of vested interests both for and against 20mph limits. Groups that support low speed limits typically stem from public or third sector: road safety professionals, the health sector, senior police officers, local authorities, campaigning groups such as cycling campaigning charities, and low speed lobbying groups such as 20s Plenty. Their messages include encouraging positive attitudes towards stronger enforcement; challenging the default assumptions that urban roads are primarily for travel/cars and promoting the alternative narrative that roads are urban living spaces for sharing; challenging the dominant discourse that ‘we must keep the economy moving’ and therefore the needs of business transport should prevail, and promoting a more balanced view that promotes health and wellbeing agendas; and, perhaps most difficult, challenging the culture of speed that is promoted through auto-advertising, media, and TV (programmes such as Top Gear have worldwide reach with much of its content implicitly celebrating speeding). Policy makers and campaigners may also make use of persuasion techniques, mentioned earlier, such as Building on Premises (messages that begin with content that already has high agreement – such as ‘lower speed limits lead to less accidents’) and Inoculation (‘arming’ people against attacks on their beliefs), perhaps guided by the data reported on here.
Those against low speed limits tend to be (often quite small) campaigning groups such as the Alliance of British Drivers, Safespeed, and Motorists Against Detection. Less obvious but arguably more powerful forces include national media (e.g. Sunday Times, 2015; Telegraph, 2014), and large organisations or corporations that have the power to lobby and influence Government decision making: auto manufacturers and suppliers, the Federation of Small Businesses, the RAC Foundation (RAC 2014), and so on. The view of these opposition groups is that increased policing of limits would be too costly and in any event not welcome for ‘law abiding citizens’ (Wells, 2012). Local promotion of limits on safety grounds may be dismissed as misguided because the link between speed and crashes is contested. Indeed, the presumption may be that ‘most people’ should be left alone to ‘use
common sense’ whilst driving, with the implication that safety or health issues are exaggerated or not important. It is unlikely that the complexities of drivers influencing each other’s behaviour would be accepted: more likely, driving safety would be simply attributed to each individual’s ability and experience, with education seen as the way forward: ‘speed doesn’t hurt anyone – it is bad driving that causes problems’.
Where do these contradictory narratives leave public opinion? Whilst the headline figures (for instance the British Social Attitudes Survey for the Department for Transport (2012) reported 70% support for 20mph limits) indicate majority support for 20mph limits, as we have seen these figures do not reflect the non-compliance behaviours that are typically observed, creating the suspicion that self-enhancement bias (speed limits are a great idea but for others not for me) is present on an industrial scale (Musselwhite et al 2010). Similar contradictions were identified by Wells (2012) with regard to enforcement (support for enforcement, but resentment at being caught and labelled as criminals). The lack of a cross-population consensus of support and compliance came to a head in Britain in the mid-2000s with the increased use of speed cameras leading to an increasingly politicised debate (Wells 2012). In 2011, the new pro-business government proclaimed an ‘end to the war on the motorist’ (Department for Transport release in 2011) and soon after deactivated most cameras (subsequently partially reversed after the pro-camera campaigning of upset local residents).
The uneasy stand-off between ‘pro’ and ‘anti’ speed limit groups seems destined to continue for some time to come. However, campaigners can make use of the hierarchy of messages, both positive and negative, from Table 4. Campaigners for 20mph limits know that Vulnerable Positives will be most receptive to messages that 20mph limits mean (in order of impact) ‘fewer serious accidents’, that ‘ ‘children can play safely’ and that ‘our streets would be more pleasant to live in’. Pro-20 campaigners should also note that they need to ‘inoculate’ drivers, particularly Vulnerable Negatives, against the feelings that 20mph limits will ‘ Be ignored by many drivers’, ‘not be policed and enforced effectively’, ‘be pointless as many people will ignore them’, ‘make journey times longer’ and ‘increase congestion’.
These difficulties of dealing with the complexities of public opinion may tempt proponents of compliance to favour the alternative strategy of targeting driver behaviour rather than attitudes. In focusing on driver behaviours perhaps the most obvious step would be an increase in enforcement. Increasing enforcement, however, is fraught with difficulty. Self enhancement bias generates widescale social resistance to active policing by ‘law-abiding’ citizens (94% of drivers see themselves as law abiding (Musselwhite et al 2010)). Those drivers with high confidence in their own skills exhibit correspondingly greater personal autonomy and control in deciding their own driving decisions, which in turn leads them to conclude that speed limit laws should not apply to them (Corbett and Simon 1992). Earlier we saw (Table 5) that non-compliers who oppose 20mph limits (‘Staunch Opponents’) were much more likely than other groups to describe themselves as ‘better than average drivers’. These will be the most vociferous opponents of extra policing. Attitudes to being labelled as ‘law breakers’ were also examined in depth by Wells (2012, ch2, ch5) who found that fear of being caught, anger if caught, and the strict liability of the law ignoring ‘accidental’ transgressing, all meant that speeding laws are often regarded as unfair.
In any event these issues may be academic in the short term given the current constraints on police resources in Great Britain – itself mirroring the pressures on public resources across much of Europe and internationally. The data reported in Table 7 earlier offered the alternative of seeking to
‘enforce’ limits via the use of community self-policing. This may have the advantage of being seen as community led: local residents may feel an extra moral force in seeking better behaviour from drivers speeding down residential roads (‘slow down and respect residents: we have to live on this road’). However, community ‘policing’ clearly lacks the power of law enforcement, and hence may lack credibility and legitimacy.
Perhaps the most realistic outcome for supporters of speed limits would be to create ‘normative support’ and ‘normative compliance’, that is, states of cultural normality in which the expected behaviour is to comply, with non-compliance generating significant social disapproval. There seems considerable merit in this basic idea: our data and that of others with respect to copycat and automatic driving habits reinforce the view that social norms are important influences on driver behaviour. Internationally, the extent of this influence will vary between individualist (countries where individual interests are regarded as more important) and collectivist (places where group interests guide behaviours) cultures. Countries such as China score highly on collectivist measures: here, in-group norms (perhaps similar drivers on the road) exert strong influences on behaviours whilst out-groups (distant authority figures perhaps) are distrusted. Individualist countries such as the U.S. are more likely to exhibit variance around these norms.
In the context of new 20mph limits, the mechanism for change would be to support compliance with 20mph as the descriptive norm (as mentioned earlier, a belief that others are complying) as well as the injunctive norm (a belief that others should comply). Embedding descriptive norms in the shape of lower speeds would however present an extremely difficult challenge given that most drivers when asked tend to assume that average speeds of traffic are higher than they actually are (Musselwhite et al 2010). It is possible to embed a norm by making use of another norm, in this case, the principle of reciprocity – the expectation that one should return a favour of a good deed. For instance, in an attempt to ‘give something back’ to drivers, in 2010 the British government contemplated the parallel increase in motorway speed limits from 70 to 80mph in concert with new urban 20mph limits. Although this idea was eventually rejected, the principle remains.
Perceptions of norms may also be influenced by the use of so called ‘social norms campaigns’, social marketing techniques that would entail publicising the high levels of support for 20mph limits, hence countering the pluralistic ignorance and spiral of silence effects discussed in the vicious circle model earlier. If successful, such campaigns would help compliance becoming self-policed by the public, with little input required from the authorities. However, comparisons with attempts to change cultures in other spheres reveal typically long lead times before changes are accepted; for instance the British ban on smoking in public places would not have been possible without decades of patient health education on the perils of second hand smoking. In contrast to the settled consensus on the dangers of smoking, the perils of speeding are still contested by individual drivers whose self-enhancement bias leads them to the belief that their driving is ‘safe’, and speed limits are ‘for others’, and their everyday experience of breaking speed limits without penalty reinforcing non-compliance. It seems there is some way to go before a consensus on normative compliance will be reached.
Limitations and further work The gap between drivers’ attitudes and behaviours make appropriate modelling very difficult. In this paper the authors have presented alternative scenarios of differing levels of compliance with 20mph limits, but given the limitations of cross-sectional data these should not be regarded as forecasts.

Further longitudinal study is planned by the authors, but additional detailed cohort studies would also be extremely valuable, perhaps utilising in-car telematics measures of actual behaviour to elicit accurate attitude-behaviour correlations.
Also unclear, and another priority for further work, are the underlying values and beliefs that explain the ‘surface’ opinions on support or opposition. One possibility is that of intra-personal attitude shifts, that is, the same person holding apparently conflicting attitudes depending on the context they occupy at that point; in particular, that people may support 20mph limits as a ‘resident’ while opposing them as a ‘driver’ (see for example Musselwhite et al., 2010b). It would be interesting to test appropriate interventions that address these apparent contradictions.
ConclusionPerspectives on speed limits will differ considerably depending on the context of people’s lives: as residents on the receiving end of speeding traffic on their street, or as drivers wanting to reach their destination quickly. In countries such as Britain, the United States and Australia, neo-liberal policies have tended towards the prioritisation of motor traffic flow at the expense of residents’ agendas. In contrast, other countries in Europe and elsewhere, but perhaps most notably the Scandinavian countries, the Netherlands and Germany, have emerged with more of a consensus that low urban speed limits are of benefit to society and should be encouraged. However, the differing histories and geographies of these countries make transferring cultures from one country to another extremely difficult. Hence, whilst learning from other cultures, campaigners and policy makers wishing to challenge the hegemony of the car may have to find their own ways of doing this. There is little doubt that they face a difficult task. The study reported upon here reinforces the impression of drivers whose own opinions are at odds with their behaviour, and whose views on other drivers and wider society exhibit scepticism regarding adherence to 20mph limits. Much work therefore needs to be done before compliance can realistically be claimed as a norm. Perhaps policy makers can be persuaded to look once more at the merits of active policing of newly created limits to help establish the ‘new norm’, and then once this norm is established such policing may be relaxed in favour of local community campaigning. In the meantime, low urban speed campaigners will need to continue to battle to turn urban speed limit attitudinal support into behavioural compliance.
Acknowledgements: The authors are grateful to the University of West of England and to Bristol City Council for their funding of this work.
ReferencesAberg, L., Larsen, L., Glad, A. and Beilinsson, L. (1997) Observed Vehicle Speed and Drivers’ Perceived Speed of Others, Applied Psychology: An International Review. 46, 3, 287-302.
Ajzen, I. (1991) The Theory of planned Behavior. Organizational Behavior and Human Decision Processes, 50, 179-211
Arthur R. (2011) Examining Traffic Flow and Speed Data: Determining Imitative Behavior. Traffic Injury Prevention. 12, 3, 266-273.
Atkins (2010) Interim evaluation of the implementation of 20mph speed limits in Portsmouth. Atkins Global, London. Atkins Transport Planning and Management.
Cialdini, R. (2007) Influence: The psychology of persuasion. Collins: New York

Cohen, J., Boniface, S., and Watkins, S. (2014) Health implications of transport planning, development and operations. Journal of Transport and Health. 1, 63-72.
Connolly, T. and Aberg, L. (1993) Some contagion models of speeding. Accident Analysis and Prevention. 25, 1, 57-66.
Corbett, C. and Simon, F. (1992) Unlawful driving behaviour: a criminological perspective. Contractor report 310. Crowthorne: Transport Research Laboratory.
Department for Transport (2011) Press release. https://www.gov.uk/government/news/pickles-and-hammond-to-end-the-war-on-motorists. Accessed 15th May 2015
Department for Transport (2012) British Social Attitudes Survey 2011: Public attitudes towards transport. London: Department for Transport.
Department for Transport (2013) Setting Local Speed Limits. Circular. DfT 01/2013 London: Department for Transport.
De-Pelsmacker, P., Janssen, W. (2007) The effect of norms, attitudes and habits on speeding behaviour: Scale development and model building and estimation. Accident Analysis & Prevention. 39, 1, 6–15.
Dorling, D. (2014) 20mph Speed Limits for Cars in Residential Areas, by Shops and Schools. Chapter 3 of L. Newby and N. Denison (eds) If You Could Do One Thing: Nine Local Actions to Reduce Health Inequalities. London: British Academy.
Elliott, M., Armitage, C., and Baughan, C. (2007) Using the Theory of Planned Behavior to predict observed driving behavior. British Journal of Social Psychology 46, 69-90.
Elvik, R. (2012) Speed limits, enforcement, and health consequences. Annual Review of Public Health. 33, 225-38.
European Citizen’s Initiative: "30kmh – making streets liveable!". Accessed via http://en.30kmh.eu/ on 18th May 2015.
Fleiter, J., Lennon, A. and Watson, B. (2007) Choosing not to speed: a qualitative exploration of differences in perceptions about speed limit compliance and related issues. Australia: Centre for accident research and road safety.
Fleiter, J., Lennon, A. and Watson, B. (2010) How do other people influence your driving speed? Exploring the 'who' and the 'how' of social influences on speeding from a qualitative perspective. Transportation Research. Part F: Traffic Psychology and Behaviour. 13, 1, 49-62.
Forward, S. (2009) The theory of planned behaviour: The role of descriptive norms and past behaviour in the prediction of drivers’ intentions to violate. Transportation Research Part F: Traffic Psychology and Behaviour. 12, 3, 198-207.
Grundy C, Steinbach R, Edwards P, Green J. Armstrong, B. and Wilkinson P. (2009) Effect of 20mph traffic speed zones on road injuries in London, 1986–2006: controlled interrupted time series analysis. British Medical Journal. 339:b4469.
Haglund, M. and Aberg L. (2000) Speed choice in relation to speed limit and influences from other drivers. Transportation Research Part F. 3, 1, 39-51.
Hyden, C., Jonsson, T., Linderholm, L. and Towliat, M. (2008) New speed limits in urban areas. Bulletin 240, Lund Institute of Technology, Dept of Technology and Society, Lund.

Islam, M., El-Basyouny, K., and Ibrahim, S. (2014) The impact of lowered residential speed limits on vehicle speed behaviour. Safety Science. 62, 483-494.
Koch, D-L. (2011) Report on European road safety 2011-2020. Report number A7-0264/2011; accessed via: http://www.europarl.europa.eu/sides/getDoc.do?type=REPORT&mode=XML&reference=A7-2011-0264&language=EN
Mannering, F. (2009) An empirical analysis of driver perceptions of the relationship between speed limits and safety. Transportation Research Part F. 12, 2, 99-106.
McCabe, K., Schoneman, K., and Arcaya, M. (2013) Community Speed Reduction and Public Health: A technical report. Health resources in action. U.S.
McGuire, W.J. (1961) The effectiveness of supportive and refutational defences in immunising and restoring beliefs against persuasion. Sociometry, 24, 184-197
McKenna, F. (2010) Behavioural research in road safety. Road Safety Congress: Eighteenth Seminar; London: Department for Transport.
Miller, D. T, & McFarland, C. (1991) When social comparison goes awry: The case of pluralistic ignorance. In J. Suls & T. Wills (Eds.), Social comparison: Contemporary theory and research (pp. 287-313). Hillsdale, NJ: Erlbaum.
Musselwhite, C., Avineri, E., Susilo, Y., Fulcher, E., Bhattachary, D. and Hunter, A. (2010) Understanding public attitudes to road user safety: final report. Road safety research report no. 111. Project Report. Department for Transport.
Musselwhite, C., Avineri, E., Fulcher, E., Goodwin, P., and Susilo, Y. (2010b) Public attitudes to road user safety: a review of the literature 2000-2009. University Transport Study Group; Plymouth.
Nancarrow, C. and Tapp, A. (2014) Online access panels for surveys on public health and epidemiology. UWE on-line paper: http://eprints.uwe.ac.uk/23013/
Noelle-Neumann, Elisabeth (1993) The Spiral of Silence: Public Opinion – Our Social Skin (2nd ed.). Chicago: University of Chicago Press.
O’Keefe, D. (2002) Persuasion: Theory & Research. Sage Publications.
Pilkington, P. (2000) Reducing the speed limit to 20mph in urban areas. British Medical Journal. 320; 1160.
Pilkington, P. (2009) Lowering the default speed limit in residential areas: opportunities for policy influence and the role of public health professionals. Injury Prevention. 15; 5, 352-353.
RAC (2014) Drivers against widespread 20mph limits. http://www.rac.co.uk/advice/motoring-news/drivers-against-widespread-20mph-limits accessed 17/6/15
Recarte, M. and Nunes, L. (2002) Mental load and loss of control over speed in real driving: towards a theory of attentional speed control. Transportation Research Part F. 5, 2, 111-122.
Simon, F. and Corbett, C. (1991) A small roadside study of drivers caught breaking speed limits. Behavioural Research in Road Safety II (Seminar Proceedings. Transport Research Laboratory PA 2193/92). Crowthorne, Berkshire, UK.
Simons, H. with Morreale, J. and Gronbeck, B. (2001) Persuasion in Society. Sage Publications

Stradling, S., Campbell, M., Allan, I., Gorrell, R., Hill, J., Winter, M. & Hope, S. (2003) The Speeding Driver: Who, How and Why? Edinburgh: Scottish Executive Development Department Research Findings No. 170/2003.
Sunday Times (2015) Councils quietly put the brakes on Britain. Driving section. 5th April, 4-5.
Tapp, A., Nancarrow, C., Davis, A. (2015) Exploring support and compliance with 20mph limits in Great Britain. Transportation Research Part F. 31:36-53.
Telegraph (2014) Why 20mph zones need to be stopped. Accessed via http://www.telegraph.co.uk/motoring/road-safety/10858646/Why-20mph-zones-ned-to-be-stopped.html
Toy, S., Tapp, A, Musselwhite, C., Davis, A. (2014) Can Social Marketing make 20mph the new norm? Journal of Transport and Health. Volume 1, Issue 3, September 2014, 165-173.
Triandis, H. (1980): Values, attitudes, and interpersonal behaviour; in: H. Howe & M. Page, Nebraska Symposium on Motivation, Vol. 27, pp. 195-259
Wells, H. (2012) The fast and the furious: drivers, speed cameras and control in a risk society, Ashgate: Surrey.
Wernsperger, F. and Sammer, G. (1995) Results of the scientific investigation accompanying the pilot trial of 30kph limit in side streets and 50kph limit in priority streets. 23rd European Transport Forum, PTRC, 1995, Proceedings Seminar G, Traffic Management and Road Safety.
AppendicesAppendix 1A Note on Mode of Data Collection Used
Every mode of data collection has potential biases.
In Great Britain (GB) online coverage is on par with telephone now.
The key reasons for social, political and commercial researchers adopting online access panels in GB include:
1) Concerns about increasing non-response and associated biases with other modes of data collection, namely postal, telephone and face-to-face interviews;
2) The increase in coverage of the internet;
3) The lower cost and speed of turnaround for online;
4) But importantly an increasing belief that online access panels yield data whose level of validity is competitive compared when used with other collection methods (See Nancarrow and Tapp 2014).
It was estimated in Great Britain 87 per cent had access to the internet (Q4 2013 ONS Internet Access Quarterly Update). This is similar to the proportion of households having a landline telephone.
The online survey draws from a universe of over 400,000 respondents on an online access panel. The panel is managed to minimise fraudulent responding. The choice of mode of data collection takes into account the potential biases of each mode of data collection and a trade-off of errors was considered. The topics of obeying speed limits and being a good driver is one we thought prone to socially desirable responding if an interviewer is present either in person or on the telephone. This concern left two modes of data collection open to us. Postal questionnaire versus online access panels. Postal questionnaire surveys potentially suffer from major non-response and so potential bias and there is no control to prevent questions being skipped or answered incorrectly e.g. giving more than one answer when only one is sought, misunderstanding routeings and so sections missed. Online access panels have software that routes automatically and controls the number of answers that can be given and eliminates cheating by sophisticated internal analyses.
The evidence is increasingly that high penetration online in a country means online access panels hold their own when all the potential biases ae considered for each mode of data collection. The online access panel used had yielded comparable findings to other modes of data collection on topics not prone to socially desirable responding.
Appendix 2
Table A1 below indicates a general pattern for many statements in which vulnerable positives and vulnerable negatives differ from staunch supporters and move towards staunch opponents. The additional data in Table A1 compared to Table 5 raises the profile of ‘neither agree nor disagree’ responses, and shows that for many (though not all) statements, vulnerable positives and vulnerable negatives were more likely to tick ‘neither agree nor disagree’, perhaps suggesting their lack of certainty or lack of strength of feeling about 20mph limits, and hence vulnerability to change of mind.
Examining our two ‘vulnerable’ groups in more detail it is clear in the first three statements there is the potential for widespread scepticism about 20mph limits being obeyed/effective partly because of lack of enforcement and partly a lack of belief in the ability/willingness of other drivers to comply:
Scepticism People will ignore 20mph limits because they don’t see themselves getting
caught by the police (significant differences between staunch supporters and vulnerable negatives for agreement)
If 20mph limits were introduced most drivers would not stick to them (significantly higher agreement for vulnerable negatives)
20mph limits are a good idea in theory but are unlikely to make a worthwhile difference (significantly higher agreement for vulnerable negatives)
Moving down the list, it becomes clear that this scepticism may be reinforced by a series of conscious and unconscious factors, including copycat and unconscious behaviours that are of particular danger in creating non-compliance norms.
Conscious and unconscious factors Most people who break 20mph speed limits don’t mean to, they simply didn’t
notice the limit was 20mph (Excusing the Behaviour) (significantly increasing agreement as we move from staunch supporters to the two vulnerable groups)
I tend to drive at the speed of other people on the road (Herd Behaviour) (the two vulnerable groups significantly more likely to agree than staunch supporters)
It is just too difficult to stay at 20mph (Excusing the Behaviour) (significantly increasing agreement as we move from staunch supporters through the two vulnerable groups to staunch opponents)
If I think a road with a 20mph limit is clear I will be more likely to drive more quickly than 20 mph (Consciously breaking the limit) (significantly increasing agreement as we move from staunch supporters through the two vulnerable groups to staunch opponents)
I tend to unconsciously drive faster than speed limits quite often (Unconsciously breaking the limit) (the two vulnerable groups offering similar levels of agreement to each other, but significantly higher than staunch supporters)
I use my own judgement, not speed limits, to decide on my speed on the road (Consciously breaking the limit) (significantly increasing agreement as we move from staunch supporters through the two vulnerable groups to staunch opponents)
I hope the police will enforce 20mph speed limits (expectations of authority) (significantly increasing agreement as we move from staunch supporters through the two vulnerable groups to staunch opponents)
As one might expect Vulnerable Negatives were more vulnerable than Vulnerable Positives. From the policy maker or campaigner’s viewpoint it is also important to note scepticism of the likely success of 20mph limits even amongst its Staunch Supporters. However, Staunch Supporters’ claimed law-breaking behaviour is relatively low against that of the other groups. We also acknowledge that while vulnerability seems widely indicated by the above data it was not universal across all responses. Responses to ‘I am a better than average driver’ (Self enhancement bias) indicated less vulnerability indicated in this statement, with vulnerable responses similar to staunch supporters.
Table A1: Indicators of vulnerability in switching from compliance to non-compliance
Neff =
Statements
StaunchSupporters
176%
a
VulnerablePositives
698%
b
VulnerableNegatives
324%
c
Staunch Opponents
68%
d
People will ignore 20mph limits because they don’t see themselves getting caught by the police
Total AgreeTotal Disagree
Neither agree nor disagree
74c
1213
74c
818
639
28abd
758
16If 20mph limits were introduced most drivers would not stick to them
Total AgreeTotal Disagree
Neither agree nor disagree
6121bcd
19cd
6714
19cd
78ab
1112d
93abc
7-
20mph limits are a good idea in theory but are unlikely to make a worthwhile difference
Total AgreeTotal Disagree
Neither agree nor disagree
2162bcd
17
40a
31c
29acd
65abd
1619
39a
45bc
16Most people who break 20mph speed limits don’t mean to, they simply didn’t notice the limit was 20mph
Total AgreeTotal Disagree
2748bcd
24
37a
31c
32
48ab
2427
53ab
2126

Neither agree nor disagreeI tend to drive at the speed of other people on the road
Total AgreeTotal Disagree
Neither agree nor disagree
1266bcd
23
31a37cd
32a
34a30d
36ad
66abc1321
It is just too difficult to stay at 20mph
Total AgreeTotal Disagree
Neither agree nor disagree
1084bcd
6
33a
43cd
24ad
61ab
16d
22ad
94abc
24
If I think a road with a 20mph limit is clear I will be more likely to drive more quickly than 20 mph
Total AgreeTotal Disagree
Neither agree nor disagree
689bcd
5
23a
48cd
29ad
29ab
36d
35ad
93abc
26
I tend to unconsciously drive faster than speed limits quite often
Total AgreeTotal Disagree
Neither agree nor disagree
687bcd
7
17a
57d
26ad
16a
55d
30ad
48abc
3814
I use my own judgement, not speed limits, to decide on my speed on the road
Total AgreeTotal Disagree
Neither agree nor disagree
984bcd
8
17a
60cd
23ad
22ab
47d
31abd
85abc
114
I don’t much engage with speed limits, I just go with the flowTotal Agree
Total DisagreeNeither agree nor disagree
490bcd
5
668d26a
11ab
53d27a
54abc
1828a
I am a better than average driverTotal Agree
Total DisagreeNeither agree nor disagree
325
63d
349c
57d
375
57d
56abc
638
I hope the police will enforce 20mph speed limits
Total AgreeTotal Disagree
Neither agree nor disagree
94bcd
15
75cd
5a
20ad
29d
35ab
36abd
693abc
1
Columns are marked as a,b,c,d. Differences between each column are significant at p>0.05 if marked accordingly using Z tests of percentages.
Appendix 3Vicious circle effects: Correlating compliance with ‘vicious circle’ variablesThe data in the table above are the correlation coefficients (r) for each of the variables illustrated in diagram 2 with the key compliance question 'If a 20mph speed limit is introduced, I may not stick to it’. Correlations are measures of linear association. Correlations were calculated using Spearman’s procedure for non-parametric data, and including control variables to account for the confounding effects of other variables. Correlations were calculated using SPSS22. The Partial Correlations procedure was used. This computes partial correlation coefficients that describe the linear relationship between two variables while controlling for the effects of one or more additional variables.
In general correlations are of moderate strength, except for those for ‘people will ignore 20mph limits because they don’t see themselves getting caught by the police’ which are very weak. This may

be accounted for by the fact that this statement received very high agreement across the sample as a whole, and therefore has a weak effect in explaining non-compliance.
We would interpret this data as indicating a moderate amount of support for the possibility of a vicious circle effect. We would like to make clear that this analysis is preliminary at this stage and further research will be required to examine vicious circle effects over time. The use of longitudinal data will be required for more definitive analysis.
Sample: (drivers) n= 2098
(unweighted)
Control variables
I use my own judgement, not speed limits, to decide on my speed on the road
It is just too difficult to stay at 20mph
I think people should be free to drive at whatever speed they want to
20 mph limits are an example of the nanny state
Correlation variablesI tend to unconsciously drive faster than speed limits quite often
.315 .302 .376 .371
If I think a road with a 20mph limit is clear I will be more likely to drive more quickly than 20 mph
.554 .531 .627 .585
People will ignore 20mph limits because they don’t see themselves getting caught by the police
.011 -.030 .049 .011
I tend to drive at the speed of other people on the road
.263 .290 .335 .307
Virtuous Circle effects: correlating compliance with ‘virtuous circle’ variables
Similarly, the data in the table above refer to the partial correlations calculated for each of the variables in Diagram 4. In this analysis we examined the possibility of a ‘virtuous circle’ effect by examining disagreement with 'If a 20mph speed limit is introduced, I may not stick to it’. Moderate partial correlations were found for agreement with ‘Breaking speed limits is not acceptable in most circumstances’, ‘I hope the police will enforce 20mph limits’, and supporting 20mph limits by ‘driving

at 20mph limits myself even if others do not’. A weaker effect was found for ‘I have discussed the 20mph speed limit with other people’. This partial correlation analysis may allow a tentative suggestion that somewhat less evidence is available to support a virtuous circle effect than a vicious circle effect. However, as we indicate above, we strongly recommend the further gathering of longitudinal data to examine over-time effects such as these.
Sample: (drivers) n= 2098
(unweighted)
Control variables
I will be careful to observe new 20 mph limits wherever they are
I wish everyone would slow down a bit on the roads
Correlation variablesBreaking speed limits is not acceptable in most circumstances
-.244 -.375
I hope the police will enforce 20mph limits
-.283 -.399
I have discussed the 20mph speed limit with other people
.001 -.016
By driving at 20mph limits myself even if others do not
.214 .292