victor levesque u.s. geological survey florida water science center tampa, florida documenting...
Post on 19-Dec-2015
213 views
TRANSCRIPT

Victor LevesqueU.S. Geological Survey
Florida Water Science CenterTampa, Florida
Victor LevesqueU.S. Geological Survey
Florida Water Science CenterTampa, Florida
Documenting
Regression Analysisfor
Index Velocity Ratings
OverviewOverview Data required for the rating
(Stage-area and Index velocity) What to collect and what to keep Assembling and Documenting the data Examples
Rating documentation(Stage-area and Index velocity) Assembling and Documenting the data What information is needed Examples
Two RatingsTwo Ratings
Stage-to-areaIndex-to-mean velocity
Q = VA
Stage-to-Area RatingStage-to-Area Rating Collect cross-section survey and
water level data Assemble data Document data and results Create and document a stage-area
rating

Data CollectionData CollectionStandard cross-section
Clearly mark cross-section in the field and document in the rating
Include a site sketch Include distances Document survey method Identify water level data and datum
Index Sensor
Standard cross-section
Flow direction
Oak tree on left bank. Orange X on trunk.
20 feet upstream
150 feet
Large rock with orange X

Important items to remember Cross section must be referenced to stage Survey past the maximum expected stage You should routinely check for channel changes
Every year for first three years
If there is a departure in the index velocity rating
After a high flow event Use the same cross-section for resurvey
Data CollectionData Collection
Assemble the DataAssemble the Data
Data can be input to a spreadsheet Describe how and where data were
collected Label all columns Include times and time datum Include water level data measured during
the time of the survey Include a site sketch

\\FloridaFL-S\Projects
NWIS
Management Station Information
GW
25xx
252115080293701
DCP Programs
Levels Summary
Pictures
SIMS
30xx
SW
25xx 30xx 0220 0237
02370000
DCP Programs
Levels Summary
Pictures
SIMS
Historical WY
WY2008
WY2007
Current WY
WY2010 WY2009
GW
25xx
252115080293701
EDL
Inspections
Levels
Station Analysis
Station Description
Water Quality
30xx
SW
25xx 30xx 0220 0237
02370000
EDL
Inspections
Levels
Measurements
Ratings
Station Analysis
Station Description
SWReview
Velocity
Water Quality
Go2 Plots Swami Scripts

Stage-Area Rating - Poor Example
Stage-Area Rating - Poor Example
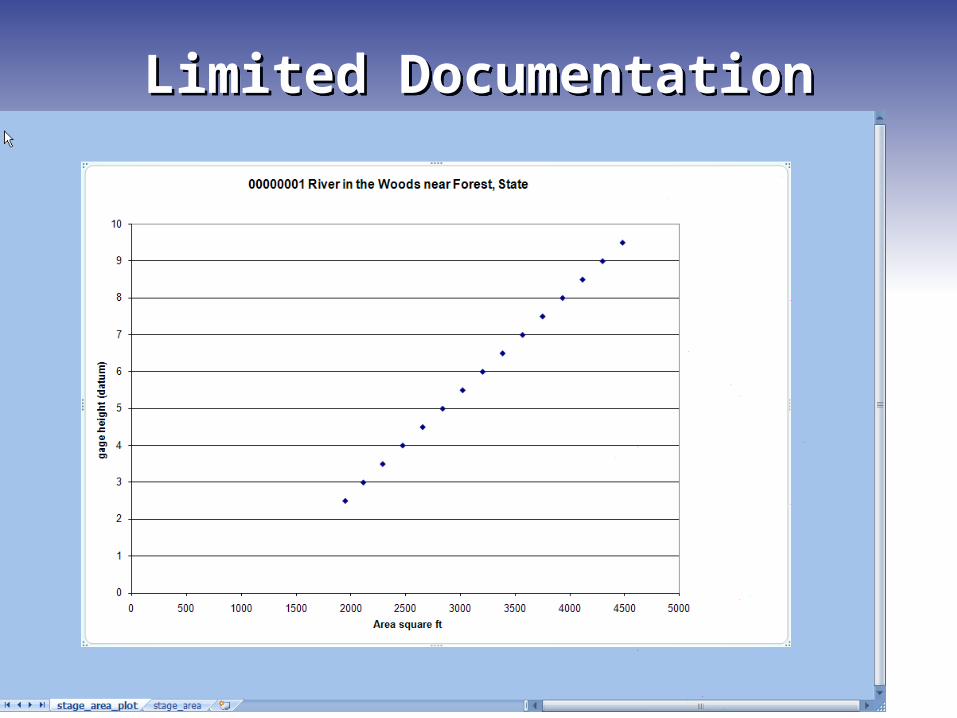
Limited DocumentationLimited Documentation

Stage-Area WorkbookStage-Area Workbook
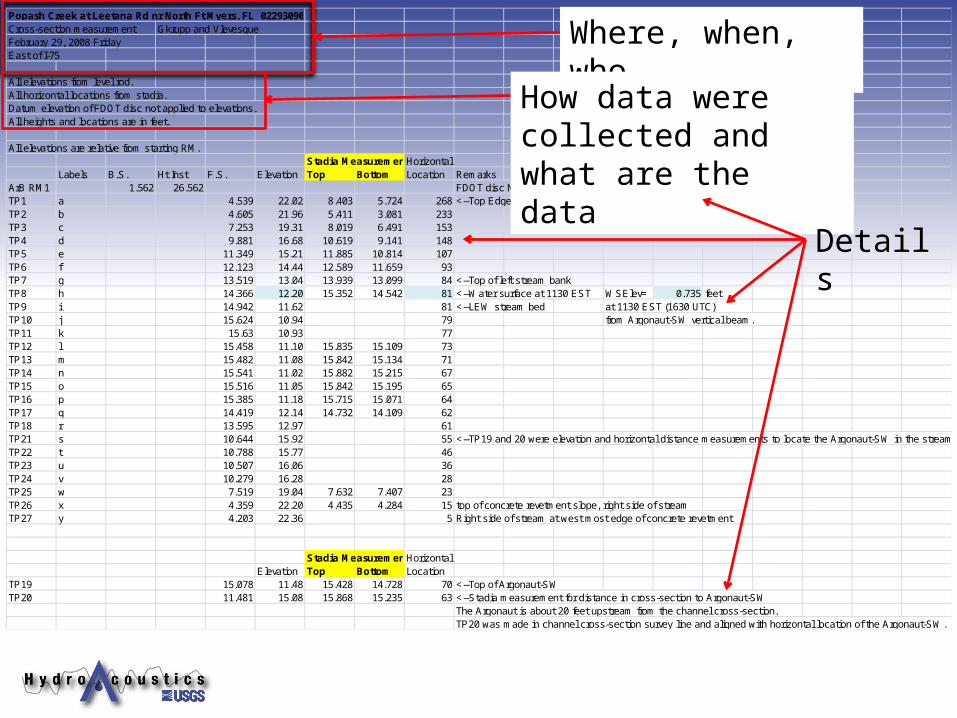
Popash Creek at Leetana Rd nr North Ft Myers, FL 02293090Cross-section measurement Gkrupp and VlevesqueFebruary 29, 2008 FridayEast of I-75
All elevations from level rod.All horizontal locations from stadia.Datum elevation of FDOT disc not applied to elevations.All heights and locations are in feet.
All elevations are relative from starting RM.Stadia MeasurementsHorizontal
Labels B.S. Ht Inst F.S. Elevation Top Bottom Location RemarksArB RM1 1.562 26.562 FDOT disc NE bridge wall, Frontage Road 120115TP1 a 4.539 22.02 8.403 5.724 268 <--Top Edge of concrete revetment, left side of streamTP2 b 4.605 21.96 5.411 3.081 233TP3 c 7.253 19.31 8.019 6.491 153TP4 d 9.881 16.68 10.619 9.141 148TP5 e 11.349 15.21 11.885 10.814 107TP6 f 12.123 14.44 12.589 11.659 93TP7 g 13.519 13.04 13.939 13.099 84 <--Top of left stream bankTP8 h 14.366 12.20 15.352 14.542 81 <--Water surface at 1130 EST WSElev= 0.735 feetTP9 i 14.942 11.62 81 <--LEW stream bed at 1130 EST (1630 UTC)TP10 j 15.624 10.94 79 from Argonaut-SW vertical beam.TP11 k 15.63 10.93 77TP12 l 15.458 11.10 15.835 15.109 73TP13 m 15.482 11.08 15.842 15.134 71TP14 n 15.541 11.02 15.882 15.215 67TP15 o 15.516 11.05 15.842 15.195 65TP16 p 15.385 11.18 15.715 15.071 64TP17 q 14.419 12.14 14.732 14.109 62TP18 r 13.595 12.97 61TP21 s 10.644 15.92 55 <--TP19 and 20 were elevation and horizontal distance measurements to locate the Argonaut-SW in the stream channel.TP22 t 10.788 15.77 46TP23 u 10.507 16.06 36TP24 v 10.279 16.28 28TP25 w 7.519 19.04 7.632 7.407 23TP26 x 4.359 22.20 4.435 4.284 15 top of concrete revetment slope, right side of streamTP27 y 4.203 22.36 5 Right side of stream at west most edge of concrete revetment
Stadia MeasurementsHorizontalElevation Top Bottom Location
TP19 15.078 11.48 15.428 14.728 70 <--Top of Argonaut-SWTP20 11.481 15.08 15.868 15.235 63 <--Stadia measurement for distance in cross-section to Argonaut-SW
The Argonaut is about 20 feet upstream from the channel cross-section.TP20 was made in channel cross-section survey line and aligned with horizontal location of the Argonaut-SW.
Where, when, who
How data were collected and what are the data
Details

Plot the Cross-SectionPlot the Cross-Section
0 50 100 150 200 250 30010
12
14
16
18
20
22
24
Popash Creek Cross-sectionFebruary 29, 2008
Horizontal distance from top of Left bank in feet
Ver
tica
l ele
vati
on
in f
eet

Cross-section corrected to WS elevation
Cross-section corrected to WS elevation

Input Data to AreaCompInput Data to AreaComp
AreaComp• USGS program for the purpose of attaining cross sectional area• Can use data tables or WinRiver ASCII files• Provides output for stage and area
http://hydroacoustics.usgs.gov/indexvelocity/software.shtml

Generate a Stage-Area Rating
Generate a Stage-Area Rating
Save all output from AreaComp Include data in Rating Workbook

Stage-Area Rating final worksheetStage-Area Rating final worksheet

Documenting the Stage-Area Rating
Documenting the Stage-Area Rating
How were data collected and transformed?
What data were used to create the rating?
Documentation to describe how the rating was developed
Leave no doubt as to how, what, and why the rating was developed

Index Velocity RatingIndex Velocity Rating Collect calibration data
Discharge Stage Index Velocity
(RangeAvg X,Y, Z, Multi-Cell X,Y,Z) Assemble data Document data Perform Regression Analysis Identify and Document Selected Rating

Collect Calibration DataCollect Calibration Data
Synchronize all data sensor times Configure index velocity and stage
sensor data collection interval Save and document all data

Assemble the Calibration Data
Assemble the Calibration Data
Discharge measurements Dates, start and end times, and total
discharge Stage
Dates, times and stage Index Velocity
Dates and times RangeAvg X,Y,Z, Multi-Cell X,Y,Z, depth Index Velocity Configuration

Rating Analysis DocumentationRating Analysis Documentation
Label all data columns Include information about the data Rearrange the data columns as
necessary Synchronize and Synthesize Data Create an organized data table Perform regression analysis Select appropriate rating
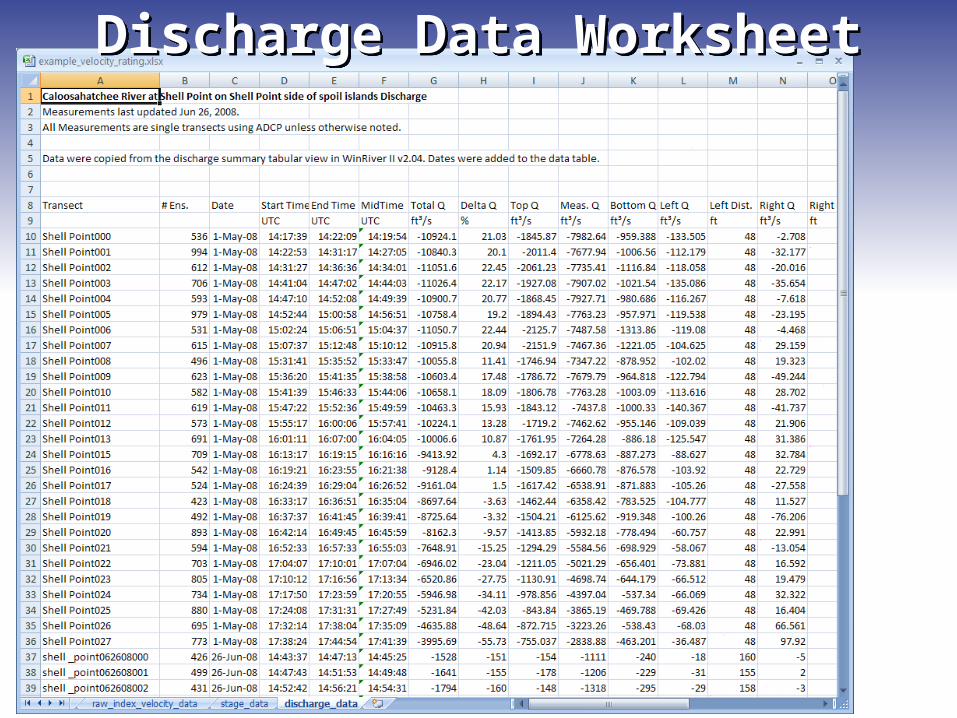
Discharge Data WorksheetDischarge Data Worksheet

Stage Data WorksheetStage Data Worksheet
Free Excel Interpolation Add-In available:http://www.xlxtrfun.com/XlXtrFun/XlXtrFun.htm

Index Velocity Data Worksheet
Index Velocity Data Worksheet
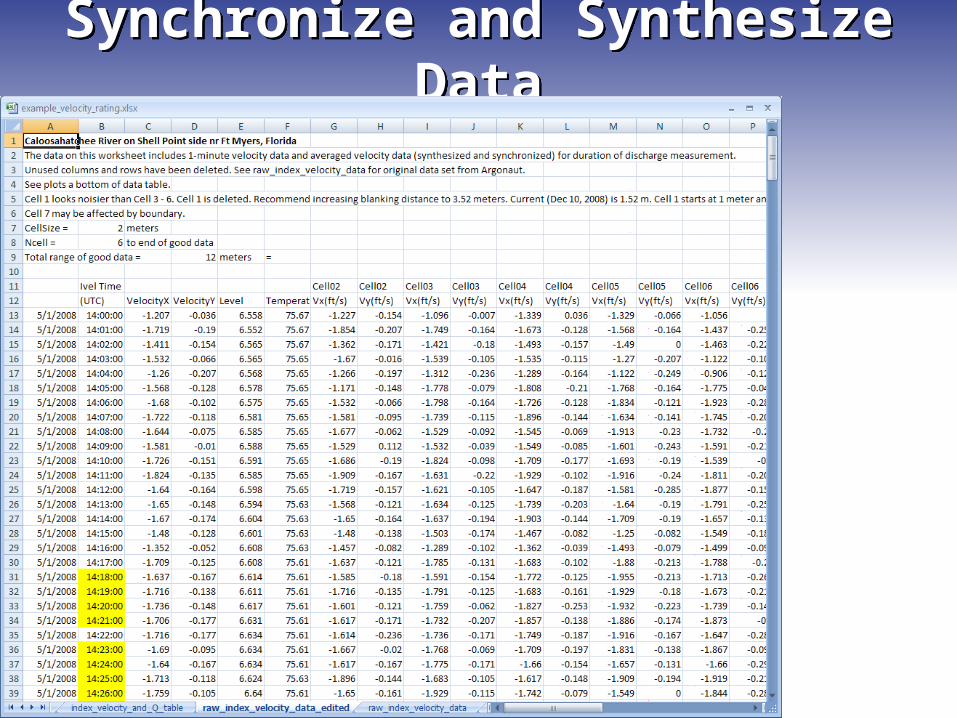
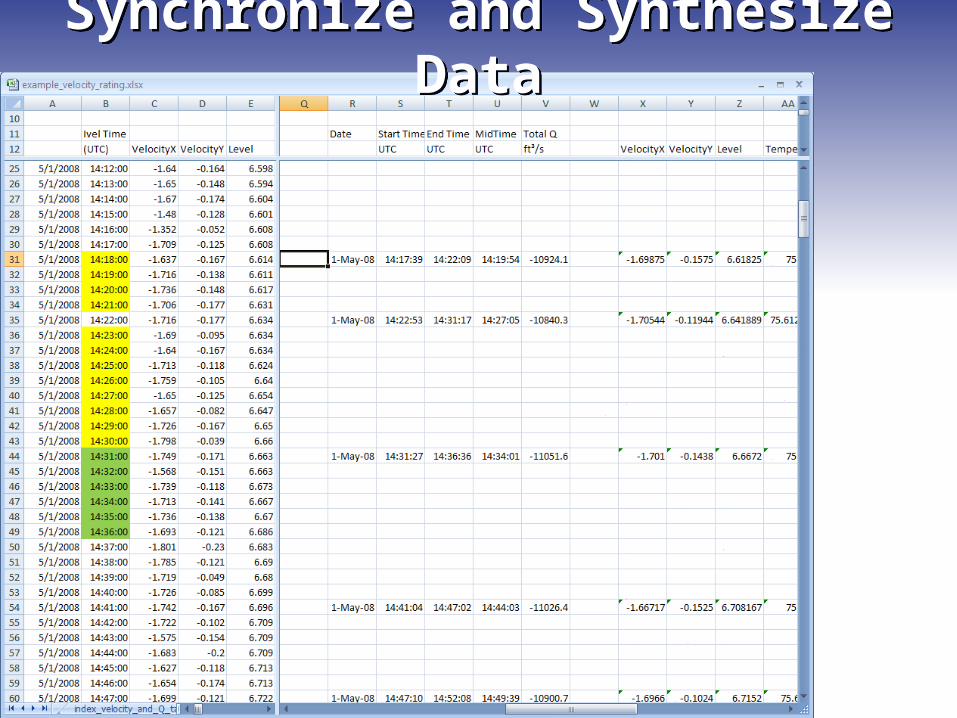
Synchronize and Synthesize Data
Synchronize and Synthesize Data
Synchronize and Synthesize Data
Synchronize and Synthesize Data

Synchronization and Synthesis
Synchronization and Synthesis

Create an Organized Data Table
Create an Organized Data Table
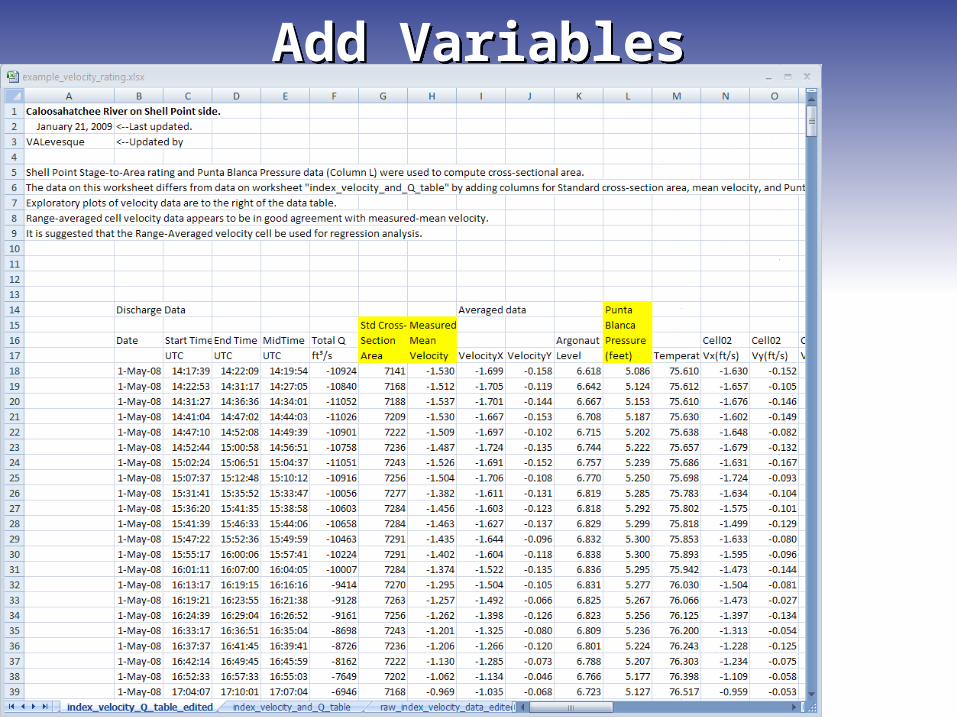
Add VariablesAdd Variables

Exploratory Data AnalysisExploratory Data Analysis
Plot with Measured-Mean Velocity (y-axis) Index velocity (X, Y, Z, multi-cell X,Y,Z) Stage

Index VelocityIndex Velocity
-2.00 -1.50 -1.00 -0.50 0.00 0.50 1.00 1.50 2.00-2.00
-1.50
-1.00
-0.50
0.00
0.50
1.00
1.50
2.00
Caloosahatchee River Shell Point
RA X-velocity in fps
Mea
sure
d M
ean
Vel
oci
ty i
n f
ps
-0.30 -0.25 -0.20 -0.15 -0.10 -0.05 0.00 0.05-2.00
-1.50
-1.00
-0.50
0.00
0.50
1.00
1.50
2.00
Caloosahatchee River at Shell Point
RA Y-velocity in fps
Mea
sure
d-M
ean
Vel
oci
ty i
n f
ps
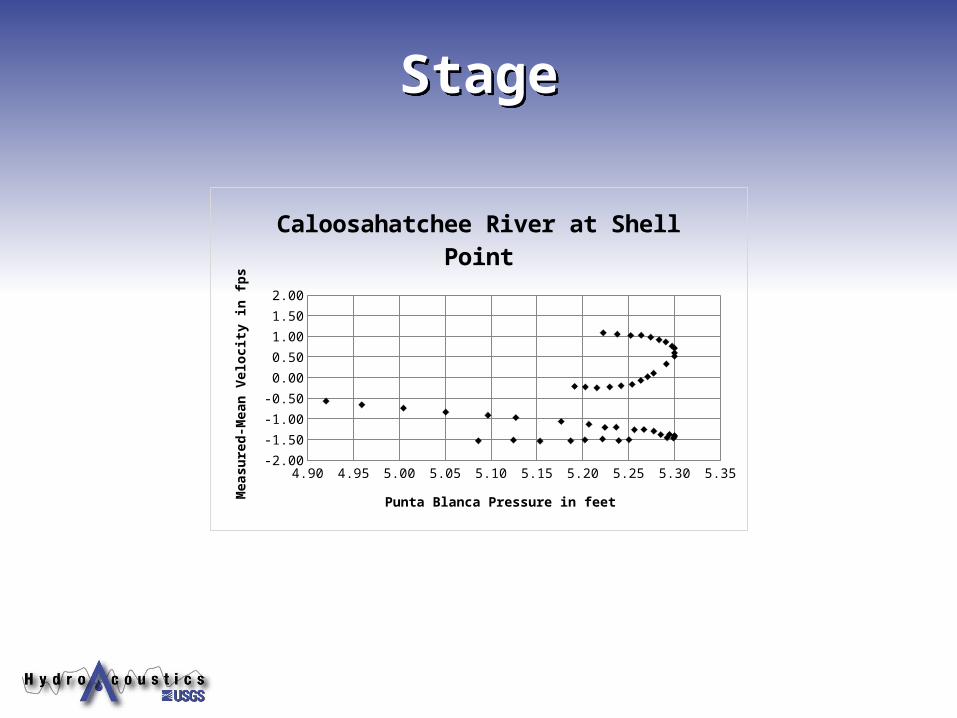
StageStage
4.90 4.95 5.00 5.05 5.10 5.15 5.20 5.25 5.30 5.35-2.00
-1.50
-1.00
-0.50
0.00
0.50
1.00
1.50
2.00
Caloosahatchee River at Shell Point
Punta Blanca Pressure in feet
Mea
sure
d-M
ean
Vel
oci
ty i
n f
ps

This is NOT Regression Analysis
This is NOT Regression Analysis
-2.00 -1.50 -1.00 -0.50 0.00 0.50 1.00 1.50 2.00-2.00
-1.50
-1.00
-0.50
0.00
0.50
1.00
1.50
2.00
f(x) = 0.924630849325406 x + 0.0199512995042576R² = 0.95917486885564
f(x) = 0.80761909893553 x − 0.13290854059824R² = 0.995916867604505
Caloosahatchee River at Shell Point
Negative Xvel
Linear (Negative Xvel)
Positive Xvel
Linear (Positive Xvel)
RA X velocity in fps
Mea
sure
Mea
n V
elo
city
in
fp
s
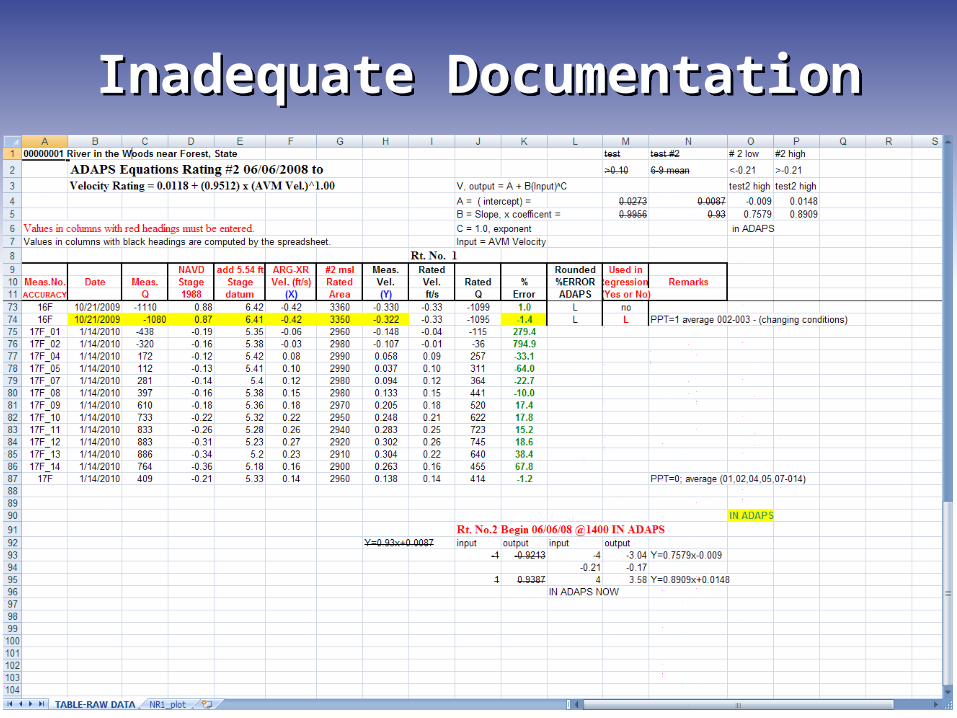
Inadequate DocumentationInadequate Documentation
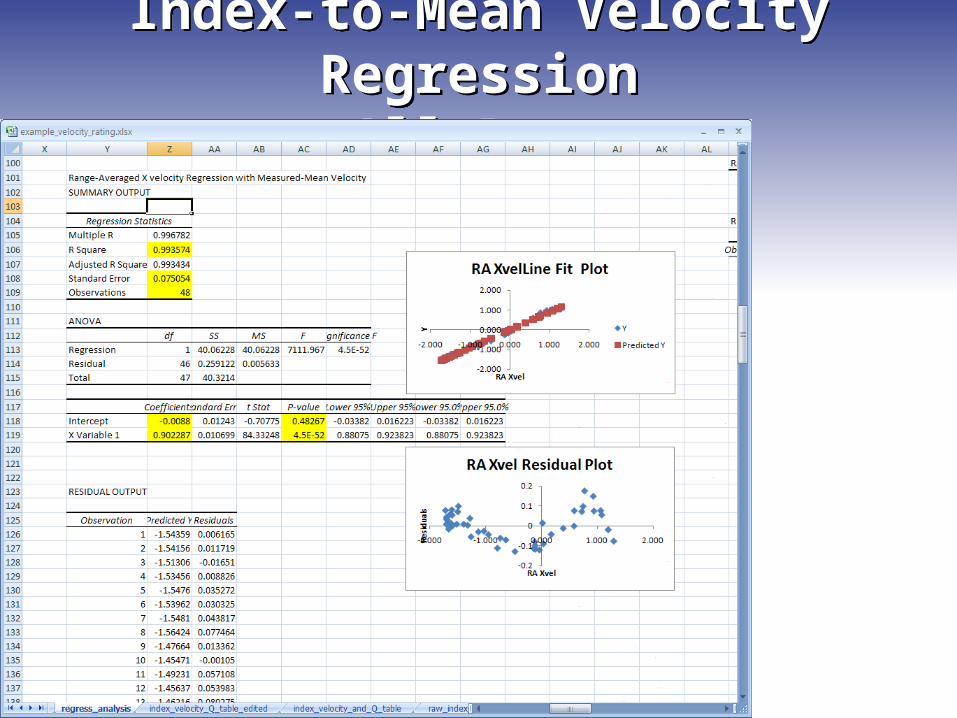
Index-to-Mean Velocity Regression
All Data
Index-to-Mean Velocity Regression
All Data

Regression Analysis continued
Regression Analysis continued

Select Appropriate RatingSelect Appropriate Rating

Check the RatingCheck the Rating

Regression AnalysisRegression Analysis
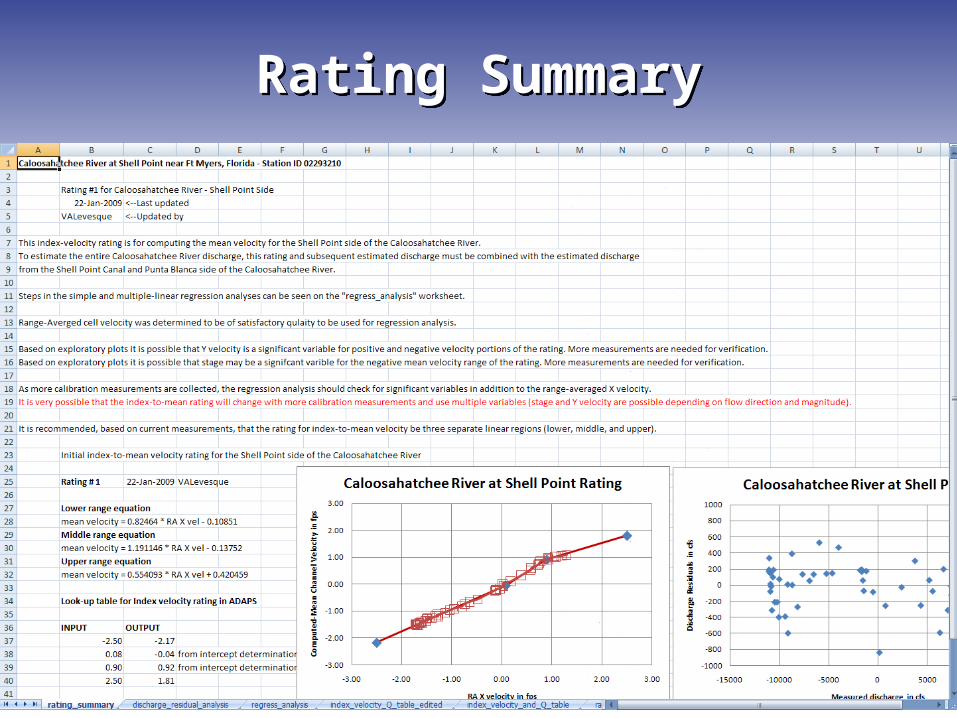
Rating SummaryRating Summary
SummarySummary Collect and document data Carefully assemble and identify data Maintain good notes Perform thorough analysis Clearly identify the final rating and
provide information for the selection Leave no doubt as to how, what, and
why the rating was developed
Questions?Questions?