victoria in future 2016delwp.vic.gov.au/.../0011/340886/victoria-in-future-2016-final-web.pdf ·...
TRANSCRIPT

Victoria in Future 2016 Population and household projections to 2051 Page 1
Victoria in Future 2016 Population and household projections to 2051

© The State of Victoria Department of Environment,
Land, Water and Planning 2016.
This work is licensed under a Creative Commons
Attribution 4.0 International licence. You are free to
re-use the work under that licence, on the condition
that you credit the State of Victoria as author. The
licence does not apply to any images, photographs
or branding, including the Victorian Coat of Arms,
the Victorian Government logo and the Department
of Environment, Land, Water and Planning (DELWP)
logo. To view a copy of this licence,
visit creativecommons.org/licenses/by/4.0/
Impact Digital – Brunswick
ISBN 978-1-76047-192-7 (Print) ISBN 978-1-76047-193-4 (PDF/online)
DisclaimerThis publication may be of assistance to you but the
State of Victoria and its employees do not guarantee
that the publication is without flaw of any kind or is
wholly appropriate for your particular purposes and
therefore disclaims all liability for any error, loss or
other consequence which may arise from you relying
on any information in this publication.
AccessibilityIf you would like to receive this publication in
an alternative format, please telephone the
DELWP Customer Service Centre on 136 186,
email [email protected],
or via the National Relay Service on 133 677
www.relayservice.com.au
This document is also available on the
internet at www.delwp.vic.gov.au

Victoria in Future 2016 (VIF2016) is the official
state government projection of population
and households. Projections are used by
decision makers across government and
in other areas. The results are driven by
assumptions concerning demographic and
land use trends.
Projections are based on the latest
(30 June 2015) population estimates from
the Australian Bureau of Statistics (ABS) and
incorporate the results of the 2011 Census. For
Victoria and major regions, the projections
cover the period from 2011 to 2051. For Local
Government Areas (LGA) and Victoria
in Future Small Areas (VIFSA), the
projections extend to 2031.
Victoria in Future 2016Population and household projections to 2051
Fastest growthMETROPOLITAN
REGIONAL
Top 5 Growth 2011 to 2031Local Government Areas
Largest GrowthMETROPOLITAN
REGIONAL
MELTON 4.4%
MELBOURNE 4.2%
WYNDHAM 3.9%
CARDINIA 3.9%
WHITTLESEA 3.4%
MITCHELL 4.3%
MOORABOOL 2.4%
BAW BAW 2.3%
GOLDEN PLAINS 2.1%
SURF COAST 2.0%
WYNDHAM 195,000
CASEY 176,000
MELTON 153,000
WHITTLESEA 153,000
MELBOURNE 130,000
GREATER GEELONG 81,000
MITCHELL 46,000
GREATER BENDIGO 43,000
BALLARAT 42,000
BAW BAW 24,000
10.1 Million
Projected Victorian population in 2051
2.1m Victoria’s
regions
8.0m Greater Melbourne
Victoria in Future 2016 Population and household projections to 2051 Page 1

Victoria in Future 2016 Population and household projections to 2051 Page 2
0-17 YEARS
18-64 YEARS
65+ YEARS
Age groups
10.1 M
2051
5.5 M
2011
1.2m 22.1%
2.0m 20.3%
3.5m 63.9%
5.9m 58.2%
0.8m 14.0%
2.2m 21.5%
2011
25%
6%
26%
43%
2031
27%
5%
27%
41%
2051
28%
5%
27%
40%
OTHER HOUSEHOLDS
ONE PERSON HOUSEHOLDS
COUPLE-ONLY HOUSEHOLDS
FAMILIES WITH CHILDREN
Household types, VictoriaAge Structure Victoria 2011 and 2051

Projection principlesPopulation projections are estimates of the future size,
distribution and characteristics of the population. They
are developed by applying mathematical models and
expert knowledge of likely population trends to the base
population (see flow chart in Figure 11 on page 16).
Projections provide information about population
change over space and time, but they are not predictions
of the future. They are not targets, nor do they reflect the
expected effects of current or future policies.
The projections show the likely future given continuation
of current trends, incorporating known constraints
and opportunities for growth. They may indicate a
need for responses to manage change, to achieve
preferred outcomes or to mitigate the impacts of
non-preferred outcomes.
Components of population changePopulations change over time through two basic
processes. Natural increase or decrease occurs due
to the balance of births and deaths. Net migration
is the net effect of people moving in or out. The
future population of Victoria and its major regions is
determined using a model which takes into account
these components of population change and applies
them to a base (starting) population.
Figure 1 shows the contribution each component is
projected to make to Victoria’s population over the
period of 2011 to 2051.
Population characteristicsIt is important to estimate the size of the future
population, but it is often just as important to know
how the make-up of the population will change. Many
decisions are made, and services provided, based on
the population’s age, sex or living arrangements. VIF2016
modelling estimates the impacts of demographic
changes on each section of the population.
Analysis of the living arrangements of the population
as revealed in the 2011 ABS Census allows VIF2016 to
determine the likely household formation of future
populations, given consistent behaviour. Once the number
of future households is projected, future demands for
housing, land and infrastructure can be estimated.
Population distributionAt the state and regional level, demographic factors
determine the likely distribution of the population. Areas
which attract or retain more residents grow strongly, as
do areas with younger populations and high numbers of
births. Areas with older populations grow more slowly.
Within regions, the distribution of population growth is
determined largely by the location of future dwelling
construction. Analysis of trends in demand and likely
future supply of land and dwellings determines each
area’s capacity for future growth. Application of
different local rates for births, deaths, migration and
household formation by age and sex completes the
picture of population change.
Figure 1. Components of population change, Victoria 2011 to 2051
3.8m Births
2.6m Net overseas migration
130,000 Net interstate migration
2.0m Deaths
5.5MPopulation
2011
1.8MNatural increase
2.8MNet migration
10.1MPopulation
2051
Note: Numbers may not add up due to rounding
Victoria in Future 2016 Population and household projections to 2051 Page 4
The different components of population change –
births, deaths and migration – affect the projected
future population to different degrees. VIF2016 makes
assumptions of the future changes in the components
based on trend analysis and expert advice. Figure 2
shows the historic and projected contribution to
population change in Victoria for each component.
Net overseas migrationNet overseas migration (NOM) is the difference between
the number of long-term arrivals and departures over
a given period. NOM has been the strongest driver of
population change in Victoria and Australia in recent
years, accounting for up to 70 per cent of growth.
In the short term, VIF2016 relies on Commonwealth
Government forecasts of arrivals and departures to
Australia and allocates a share to Victoria based on
recent trends. This results in NOM to Victoria increasing
from approximately 57,000 in 2015-16 to 60,000 by
2018-19. VIF2016 assumes NOM remains between
60,000 and 65,000 per annum over the period to 2030,
before increasing in line with the population to a level
of approximately 75,000 in 2050-51. NOM therefore
accounts for between 52 and 60 per cent of annual
population growth over the projection period.
Net interstate migrationNet interstate migration (NIM) makes a relatively small
contribution to Victoria’s population change over
the long term. In recent years, Victoria has had net
migration gains from all states and territories, with NIM
contributing as much as 13,000 to growth in one recent
calendar year. Over past decades NIM has resulted in
a small positive or small negative contribution. VIF2016
takes account of recent high levels but assumes only a
small positive NIM for the majority of the projection period.
Fertility (births)The number of births in the population is dependent
on the age structure of the female population and the
number of children each woman of a particular age
is likely to have (age-specific fertility rates, or ASFR).
Together these influence the Total Fertility Rate (TFR).
After decades of decline in TFR, recent analysis of
age-specific rates supports assumptions which result
in a steady future TFR for Victoria of approximately 1.8
children over the lifetime of the average woman. VIF2016
also takes into account regional and local differences in
rates to prepare projections.
Mortality (deaths) and life expectancyOver time as the population grows and ages, the
number of deaths is projected to increase. However, life
expectancy for both males and females has increased
consistently in the past, and this trend is expected to
continue. In VIF2016, life expectancy at birth for males
reaches 88 years by 2051, and for females 90 years.
Movement within VictoriaPopulation change at regional and local level is
influenced by migration within and between areas
of Victoria. Households and individuals relocate in
response to their changing lifecycle and needs, such
as forming new households, downsizing or changing
employment location. VIF2016 applies age-specific
rates of migration determined from 2011 Census and
more recent analysis to each population. This allows
migration levels to change in response to the population
size and age structure of individual areas.
Assumptions and drivers of growth

Victoria in Future 2016 Population and household projections to 2051 Page 5
120
80
40
Per
son
s ('
00
0s)
0
100
60
20
-20
19911981 2001 2011 2021 2031 2041 205119961986 2006 2016 2026 2036 2046
Figure 2. Annual population change by component, Victoria 1981 to 2051
Total population change
Net overseasmigration
Natural increase
Net Interstatemigration

Victoria in Future 2016 Population and household projections to 2051 Page 6
The base year for the calculation of VIF2016 projections
is 2015, the most recent year for which the ABS has
published the Estimated Resident Population (ERP)
for both Victoria and for LGAs. VIF2016 results include
published or modelled estimates of population and
components commencing with the year 2011.
Total population changeAs at 30 June 2011, the ERP of Victoria was 5.5 million. By
30 June 2015 this had grown by approximately 400,000
to 5.9 million, at an annual average growth rate of 1.8
per cent. From 2015 to 2031, the population of Victoria is
projected to grow by 1.8 million to 7.7 million, at a rate of
1.7 per cent per annum. As the contribution of NOM to
population growth increases, Victoria is projected to add
another 2.4 million people to reach a population of 10.1
million by 2051, growing over this period at a rate of 1.3
per cent per annum (see Figure 3). The total projected
growth in Victoria’s population of almost 4.6 million over
the 40 years to 2051 is more than double the growth
from the period 1971 to 2011 (1.9 million).
Due to stronger projections of NOM and fertility, the
VIF2016 projection for Victoria at 2051 is larger than
the 9.4 million projected by the ABS in its most recent
projections (published November 2013).
The population of Greater Melbourne is projected to
increase from 4.5 million in 2015 to 8.0 million in 2051.
Over this period the population of Victoria’s regions is
expected to grow from 1.4 million to 2.1 million – stronger
than the ABS projection due to VIF2016 assuming a
larger total net migration from Greater Melbourne to
Victoria’s regions.
Victoria
Greater Melbourne
Victoria’sRegions
1971 1991 2011 2031 2051
Per
son
s (m
illio
ns)
10.0
8.0
6.0
4.0
2.0
0
Figure 3. Estimated Resident Population, Victoria and major regions 1971 to 2051
Results of VIF2016 projections
Victoria in Future 2016 Population and household projections to 2051 Page 7
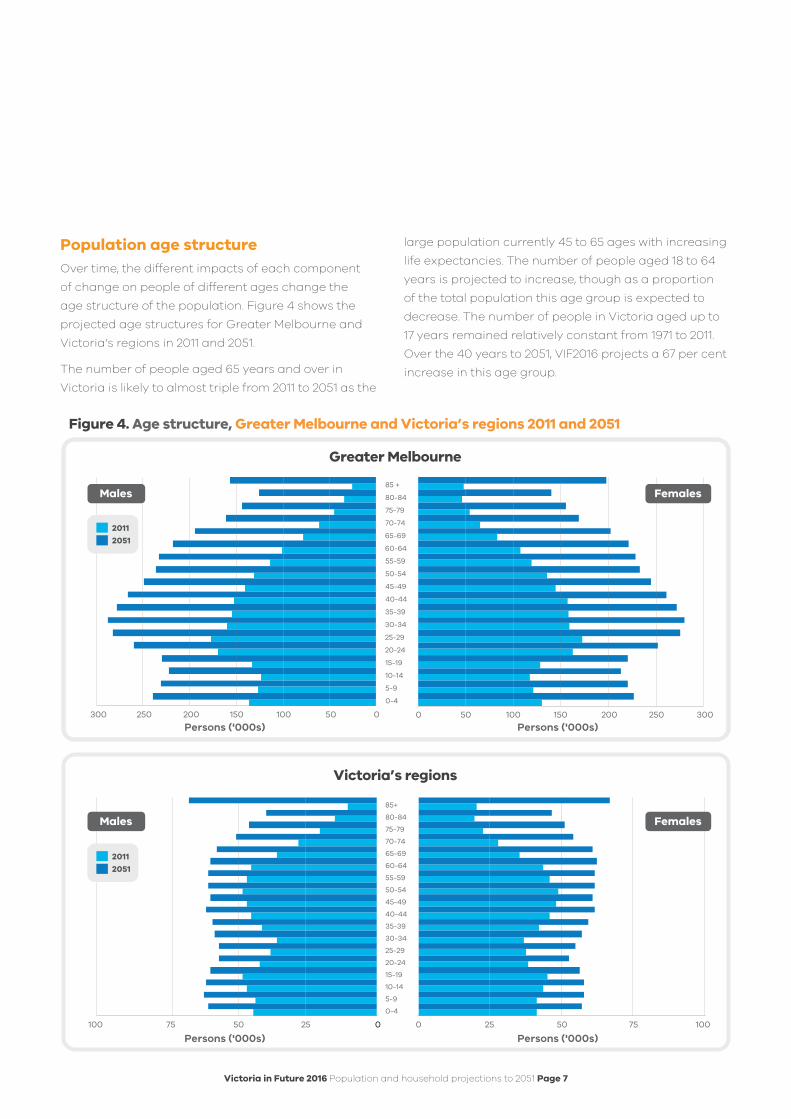
Population age structureOver time, the different impacts of each component
of change on people of different ages change the
age structure of the population. Figure 4 shows the
projected age structures for Greater Melbourne and
Victoria’s regions in 2011 and 2051.
The number of people aged 65 years and over in
Victoria is likely to almost triple from 2011 to 2051 as the
large population currently 45 to 65 ages with increasing
life expectancies. The number of people aged 18 to 64
years is projected to increase, though as a proportion
of the total population this age group is expected to
decrease. The number of people in Victoria aged up to
17 years remained relatively constant from 1971 to 2011.
Over the 40 years to 2051, VIF2016 projects a 67 per cent
increase in this age group.
0 50 100150 200 250 300
0-4
5-9
10-14
15-19
20-24
25-29
30-34
35-39
40-44
45-49
50-54
55-59
60-64
65-69
70-74
75-79
80-84
85 +
0 50 100 150 200 250 300
0 50 100 25 25 7575
0-4
5-9
10-14
15-19
20-24
25-29
30-34
35-39
40-44
45-49
50-54
55-59
60-64
65-69
70-74
75-79
80-84
85+
0 50 100
Figure 4. Age structure, Greater Melbourne and Victoria’s regions 2011 and 2051
Greater Melbourne
Victoria’s regions
Males
Persons ('000s) Persons ('000s)
Persons ('000s) Persons ('000s)
Females
Females
2011
2051
2011
2051
Males

Victoria in Future 2016 Population and household projections to 2051 Page 8
Living arrangements, households and dwellings
Household formation is related to the age structure of
the population, partnering and de-partnering trends,
the age at which children leave the parental home and
a range of socio-cultural factors.
By analysing the living arrangements of the population
in 2011 by age and sex and assuming behaviour
patterns continue in the future, VIF2016 projects there
will be 4.1 million households in Victoria in 2051. Numbers
of households of all types are projected to increase.
Figure 5 shows the changing distribution of different
household types from 2011 to 2051.
The older age structure projected in the future
contributes to an increased proportion of
one- and two-person households in Victoria. In VIF2016,
the overall average household size decreases from 2.53
in 2011 to 2.41 in 2051. The rate of growth of households is
therefore faster than that of the population.
Whether households are made up of one person or
many, they are assumed in VIF2016 to occupy one
dwelling each. Making some allowance for vacancy
rates, an additional 2.2 million dwellings is expected to
be required to house the population by 2051.
Over the 20 years to 2031, Greater Melbourne is
expected to add almost 850,000 additional dwellings,
with approximately 210,000 added in Victoria’s regions.
The location of these dwellings influences the spatial
distribution of the population.
Figure 5. Distribution of households by type, Victoria 2011 and 2051
One person householdsCouple-only householdsFamilies with childrenOther household types
40%
27%
28%
5%
4.1M2051
43%
26%
25%
6%
2.1M2011

Victoria in Future 2016 Population and household projections to 2051 Page 9
Population growth across VictoriaPopulation growth and change are not evenly
distributed across Victoria. Greater Melbourne attracts
the bulk of Victoria’s overseas migrants, and due to its
large share of the population (76 per cent in 2015) and
its younger population, also accounts for the majority of
the natural increase. These trends are likely to continue
and Greater Melbourne is projected to have almost 85
per cent of the state’s growth up to 2051.
Figure 6 shows the differences in the number and
age profile of net migration to Greater Melbourne and
Victoria’s regions. VIF2016 assumes these patterns will
continue. The larger numbers and younger age profile
of Greater Melbourne’s migrants contribute to the
stronger growth in the capital over time.
Within Greater Melbourne, the areas with the
greatest capacity for dwelling growth are the
outer growth areas and the inner city. This is
reflected in projected population growth. While
the middle suburbs are expected to regenerate and
increase steadily in population, the designated
growth areas (49 per cent) and the five inner LGAs
(16 per cent) are expected to account for around two
thirds of population growth to 2031.
In Victoria’s regions the largest numbers of projected
extra dwellings, and thus largest concentrations of
population growth, are in the major regional cities and
in areas close to Melbourne. Between 2011 and 2031,
the three largest LGAs by population (Greater Geelong,
Greater Bendigo and Ballarat) are projected to account
for approximately half of the population growth in
Victoria’s regions.
Figure 6. Net migration profile, Greater Melbourne and Victoria’s regions 2011 to 2016
0
20
40
60
80
Per
son
s ('
00
0s)
Age group at end of period
0-4
5-9
10-1
4
15-1
9
20-2
4
25-2
9
30-3
4
35-3
9
40
-44
45-
49
50-5
4
55-5
9
60
-64
65-
69
70-7
4
75-7
9
80-8
4
85-8
9
Greater Melbourne
Victoria’s regions

Victoria in Future 2016 Population and household projections to 2051 Page 10
Maps of population changeThe size and rate of population change vary across Victoria, as illustrated in Figures 7 and 8.

Victoria in Future 2016 Population and household projections to 2051 Page 11
Figures 9 and 10 illustrate the spatial variability of population age structures.

Victoria in Future 2016 Population and household projections to 2051 Page 12
Data tablesTables 1, 2 and 3 show summary projections for Victoria and major regions from 2011 to 2051 and for Local
Government Areas from 2011 to 2031. Rounded numbers may not sum to totals.
The base population and age structure as at 30 June 2011 is the Estimated Resident Population as finalised by the
ABS following the 2011 Census. Households in 2011 are VIF2016 estimates based on Census data.
Table 1: Projections for Victoria, 2011 to 2051
2011 2021 2031 2041 2051
Total population 5,537,800 6,605,700 7,733,300 8,876,000 10,086,500
Total households 2,154,400 2,609,900 3,082,700 3,579,600 4,094,200
Average household size 2.53 2.49 2.46 2.43 2.41
Change in population 2011-51 2011-21 2021-31 2031-41 2041-51
Net (persons) 4,548,700 1,067,800 1,127,600 1,142,700 1,210,500
Average annual rate 1.5% 1.8% 1.6% 1.4% 1.3%
Change in households 2011-51 2011-21 2021-31 2031-41 2041-51
Net (households) 1,939,700 455,500 472,800 497,000 514,500
Average annual rate 1.6% 1.9% 1.7% 1.5% 1.4%
Age Distribution
2011 2021 2031 2041 2051No. of
peopleShare of total (%)
No. of people
Share of total (%)
No. of people
Share of total (%)
No. of people
Share of total (%)
No. of people
Share of total (%)
0 to 4 352,000 6.4 423,500 6.4 465,800 6.0 513,700 5.8 584,100 5.8
5 to 9 332,700 6.0 403,900 6.1 470,400 6.1 504,300 5.7 570,300 5.7
10 to 14 330,100 6.0 389,100 5.9 459,100 5.9 503,800 5.7 554,900 5.5
15 to 19 354,600 6.4 386,000 5.8 459,300 5.9 528,900 6.0 567,400 5.6
20 to 24 412,400 7.4 425,900 6.4 493,300 6.4 569,800 6.4 621,400 6.2
25 to 29 424,800 7.7 483,700 7.3 510,400 6.6 591,200 6.7 669,600 6.6
30 to 34 391,800 7.1 505,200 7.6 525,700 6.8 598,800 6.7 682,900 6.8
35 to 39 395,300 7.1 492,300 7.5 550,200 7.1 582,900 6.6 668,500 6.6
40 to 44 400,400 7.2 433,500 6.6 547,700 7.1 573,300 6.5 650,100 6.4
45 to 49 379,300 6.8 421,500 6.4 518,000 6.7 578,300 6.5 614,800 6.1
50 to 54 363,800 6.6 413,400 6.3 446,600 5.8 561,000 6.3 590,100 5.9
55 to 59 325,600 5.9 384,500 5.8 426,000 5.5 521,900 5.9 584,300 5.8
60 to 64 297,600 5.4 361,400 5.5 411,600 5.3 446,100 5.0 560,800 5.6
65 to 69 232,900 4.2 315,700 4.8 375,500 4.9 418,700 4.7 515,400 5.1
70 to 74 181,800 3.3 277,500 4.2 343,000 4.4 395,500 4.5 433,500 4.3
75 to 79 143,100 2.6 205,500 3.1 287,600 3.7 349,600 3.9 396,900 3.9
80 to 84 115,300 2.1 142,500 2.2 230,500 3.0 296,600 3.3 352,700 3.5
85 and over 104,400 1.9 140,600 2.1 212,900 2.8 341,500 3.8 468,800 4.6
Total 5,537,800 100.0 6,605,700 100.0 7,733,300 100.0 8,876,000 100.0 10,086,500 100.0
Household types
2011 2021 2031 2041 2051No. of
householdsShare of total (%)
No. of households
Share of total (%)
No. of households
Share of total (%)
No. of households
Share of total (%)
No. of households
Share of total (%)
One person 539,200 25.0 671,000 25.7 820,200 26.6 978,400 27.3 1,139,200 27.8
Couple-only 556,600 25.8 700,600 26.8 830,400 26.9 968,600 27.1 1,119,700 27.3
Family with children 930,800 43.2 1,090,000 41.8 1,265,200 41.0 1,442,100 40.3 1,623,700 39.7
Other 127,900 5.9 148,200 5.7 166,800 5.4 190,400 5.3 211,500 5.2
Total 2,154,400 100.0 2,609,900 100.0 3,082,600 100.0 3,579,600 100.0 4,094,100 100.0
Components of population change 2011-51 2011-21 2021-31 2031-41 2041-51Births (persons) 3,780,300 791,800 900,100 977,600 1,110,900
Deaths (persons) 2,002,600 381,400 436,300 536,300 648,600
Natural increase 1,777,700 410,400 463,800 441,200 462,300
Net overseas migration (persons) 2,640,700 587,100 643,800 681,500 728,300
Net interstate migration (persons) 130,400 70,400 20,000 20,000 20,000
Net migration 2,771,000 657,500 663,800 701,500 748,300

Victoria in Future 2016 Population and household projections to 2051 Page 13
Table 2. Projections for Greater Melbourne and Victoria’s regions, 2011 to 2051
Total population 2011 2021 2031 2041 2051Average annual percentage change
2011-2021 2021-2031 2031-2041 2041-2051
Greater Melbourne Capital City Area
4,169,400 5,106,700 6,058,800 7,016,000 8,024,100 2.0% 1.7% 1.5% 1.4%
Ballarat 148,700 170,300 197,600 225,500 255,400 1.4% 1.5% 1.3% 1.3%
Bendigo 142,700 164,700 190,700 217,300 245,400 1.4% 1.5% 1.3% 1.2%
Geelong 256,600 303,400 358,300 418,300 485,600 1.7% 1.7% 1.6% 1.5%
Hume 161,300 172,500 188,100 206,200 227,100 0.7% 0.9% 0.9% 1.0%
Latrobe - Gippsland 260,000 284,800 321,900 359,300 399,600 0.9% 1.2% 1.1% 1.1%
North West 149,600 147,700 150,100 153,400 157,400 -0.1% 0.2% 0.2% 0.3%
Shepparton 127,000 134,200 144,500 154,800 165,600 0.6% 0.7% 0.7% 0.7%
Warrnambool and South West
122,600 121,400 123,400 125,200 126,400 -0.1% 0.2% 0.1% 0.1%
All Regional SA4s 1,368,500 1,499,000 1,674,500 1,859,900 2,062,400 0.9% 1.1% 1.1% 1.0%
Victoria 5,537,800 6,605,700 7,733,300 8,876,000 10,086,500 1.8% 1.6% 1.4% 1.3%
Total households 2011 2021 2031 2041 2051Average annual percentage change
2011-2021 2021-2031 2031-2041 2041-2051
Greater Melbourne Capital City Area
1,588,000 1,974,200 2,363,100 2,775,900 3,201,900 2.2% 1.8% 1.6% 1.4%
Ballarat 61,700 72,000 84,200 96,800 110,100 1.6% 1.6% 1.4% 1.3%
Bendigo 58,700 69,100 80,900 92,900 105,400 1.6% 1.6% 1.4% 1.3%
Geelong 104,000 123,700 146,600 171,800 199,700 1.8% 1.7% 1.6% 1.5%
Hume 67,100 74,100 82,200 90,400 99,200 1.0% 1.0% 0.9% 0.9%
Latrobe - Gippsland 109,700 123,400 141,500 159,300 177,800 1.2% 1.4% 1.2% 1.1%
North West 62,900 64,400 66,900 69,000 70,800 0.2% 0.4% 0.3% 0.3%
Shepparton 51,400 56,200 62,000 67,300 72,400 0.9% 1.0% 0.8% 0.7%
Warrnambool and South West
50,900 52,700 55,100 56,300 56,800 0.3% 0.4% 0.2% 0.1%
All Regional SA4s 566,400 635,700 719,500 803,700 892,200 1.2% 1.2% 1.1% 1.1%
Victoria 2,154,400 2,609,900 3,082,700 3,579,600 4,094,200 1.9% 1.7% 1.5% 1.4%
Components of population change
2011-2031 2031-2051
Births DeathsNatural increase
Net migration
Total population
changeBirths Deaths
Natural increase
Netmigration
Total population
change
Greater Melbourne Capital City Area
1,337,200 555,100 782,200 1,107,200 1,889,400 1,665,400 820,100 845,300 1,120,000 1,965,300
Ballarat 41,700 28,400 13,300 35,600 48,900 53,100 41,200 11,900 45,900 57,800
Bendigo 40,100 27,200 12,900 35,100 48,000 49,800 40,000 9,800 44,900 54,700
Geelong 75,800 46,500 29,200 72,400 101,700 101,200 67,900 33,400 93,900 127,300
Hume 38,100 31,400 6,700 20,000 26,700 45,400 44,400 1,100 38,000 39,100
Latrobe - Gippsland 64,700 51,200 13,600 48,300 61,900 77,500 73,100 4,400 73,300 77,700
North West 34,600 30,000 4,600 -4,200 500 34,300 35,600 -1,300 8,600 7,300
Shepparton 32,700 24,500 8,300 9,200 17,500 34,900 33,000 1,900 19,200 21,100
Warrnambool and South West
27,000 23,400 3,500 -2,700 800 26,800 29,700 -2,900 5,900 3,000
All Regional SA4s 354,700 262,700 92,100 214,000 306,000 423,100 364,900 58,300 329,700 387,900
Victoria 1,691,800 817,700 874,200 1,321,300 2,195,500 2,088,500 1,185,000 903,500 1,449,700 2,353,200
Age distribution2011 2051
0 to 19 20 to 64 65 and over 0 to 19 20 to 64 65 and overPersons Share (%) Persons Share (%) Persons Share (%) Persons Share (%) Persons Share (%) Persons Share (%)
Greater Melbourne Capital City Area
1,015,000 24.3 2,613,900 62.7 540,400 13.0 1,802,000 22.5 4,575,600 57.0 1,646,500 20.5
Ballarat 38,700 26.0 86,000 57.8 24,000 16.2 60,700 23.8 136,400 53.4 58,200 22.8
Bendigo 36,900 25.9 82,000 57.5 23,700 16.6 55,600 22.7 129,800 52.9 60,000 24.4
Geelong 64,900 25.3 149,800 58.4 41,900 16.3 116,700 24.0 257,100 53.0 111,700 23.0
Hume 41,700 25.9 91,300 56.6 28,300 17.5 52,100 22.9 115,200 50.7 59,800 26.3
Latrobe - Gippsland 65,600 25.2 146,600 56.4 47,700 18.4 88,900 22.2 203,300 50.9 107,400 26.9
North West 39,200 26.2 82,400 55.1 27,900 18.7 35,200 22.4 80,100 50.9 42,100 26.7
Shepparton 34,600 27.3 70,300 55.3 22,100 17.4 37,500 22.6 83,100 50.2 45,100 27.2
Warrnambool and South West
32,600 26.6 68,600 56.0 21,400 17.4 28,000 22.2 61,700 48.8 36,600 29.0
All Regional SA4s 354,300 25.9 777,100 56.8 237,000 17.3 474,700 23.0 1,066,800 51.7 520,900 25.3
Victoria 1,369,300 24.7 3,391,000 61.2 777,500 14.0 2,276,700 22.6 5,642,400 55.9 2,167,400 21.5

Victoria in Future 2016 Population and household projections to 2051 Page 14
Table 3. Projections by LGA, 2011 to 2031
Local Government
Area
Total population Total households% Aged under
20 years% Aged 65
years or older
2011 2021 2031Annual % change 2011-21
Annual % change 2021-31
2011 2021 2031Annual % change 2011-21
Annual % change 2021-31
2011 2031 2011 2031
Central Melbourne Melbourne (C) 100,200 177,000 229,800 5.9 2.6 48,900 87,100 114,400 5.9 2.8 13.4 16.2 6.5 11.2
Maribyrnong (C) 75,200 101,300 130,400 3.0 2.6 30,200 40,300 52,300 2.9 2.7 20.8 23.5 10.0 11.5
Port Phillip (C) 97,300 118,900 143,100 2.0 1.9 49,900 59,700 71,000 1.8 1.8 13.3 16.6 9.9 13.4
Stonnington (C) 98,900 120,700 135,600 2.0 1.2 45,600 56,000 63,100 2.1 1.2 17.2 19.1 14.3 16.4
Yarra (C) 78,900 103,800 122,000 2.8 1.6 36,500 47,500 56,000 2.7 1.7 14.8 18.3 9.6 14.4
Eastern Melbourne Boroondara (C) 167,100 185,900 199,300 1.1 0.7 63,900 72,800 79,600 1.3 0.9 24.2 21.7 14.6 19.5
Knox (C) 154,600 164,100 180,300 0.6 0.9 56,100 63,000 71,300 1.2 1.2 25.4 21.8 12.6 23.5
Manningham (C) 116,700 128,500 139,100 1.0 0.8 42,200 47,800 52,300 1.2 0.9 22.5 20.7 19.2 25.2
Maroondah (C) 107,300 119,100 132,200 1.1 1.0 41,800 47,700 53,800 1.3 1.2 24.9 22.9 14.7 19.9
Monash (C) 177,300 199,800 216,000 1.2 0.8 65,200 73,500 79,800 1.2 0.8 21.6 22.0 17.1 17.6
Whitehorse (C) 157,500 178,100 193,600 1.2 0.8 60,700 68,900 75,300 1.3 0.9 22.9 22.5 17.1 18.8
Yarra Ranges (S) 148,900 156,300 170,300 0.5 0.9 55,300 60,900 68,200 1.0 1.1 26.9 23.9 12.3 22.5
Northern MelbourneBanyule (C) 123,000 133,300 145,000 0.8 0.8 47,700 52,600 57,900 1.0 1.0 23.4 22.8 15.6 20.7
Darebin (C) 142,900 167,200 191,900 1.6 1.4 57,600 67,600 78,000 1.6 1.4 20.6 21.3 14.4 14.5
Hume (C) 174,300 228,700 293,900 2.8 2.5 57,100 77,200 101,300 3.1 2.8 30.1 28.7 9.0 15.0
Moreland (C) 154,200 187,700 216,300 2.0 1.4 62,400 76,100 87,700 2.0 1.4 20.5 22.0 14.7 13.4
Nillumbik (S) 62,700 64,200 67,600 0.2 0.5 21,000 23,100 25,500 1.0 1.0 28.6 22.3 9.4 25.0
Whittlesea (C) 160,800 240,400 314,000 4.1 2.7 54,300 82,700 108,900 4.3 2.8 27.0 27.7 10.5 16.0
Southern MelbourneBayside (C) 96,100 107,600 116,800 1.1 0.8 37,300 42,700 47,900 1.4 1.2 25.5 21.3 17.5 24.5
Cardinia (S) 75,800 118,000 161,700 4.5 3.2 27,200 42,600 59,500 4.6 3.4 30.3 29.5 10.5 16.0
Casey (C) 261,300 349,100 437,500 2.9 2.3 87,000 120,300 153,700 3.3 2.5 30.4 27.6 8.8 16.2
Frankston (C) 130,400 142,500 155,200 0.9 0.9 52,200 58,400 64,600 1.1 1.0 25.6 24.1 13.6 20.3
Glen Eira (C) 137,200 156,000 170,400 1.3 0.9 55,500 62,700 68,700 1.2 0.9 23.0 23.3 14.5 16.4
Greater Dandenong (C) 142,200 169,700 193,600 1.8 1.3 50,000 59,500 67,700 1.8 1.3 24.1 26.3 13.9 14.6
Kingston (C) 148,300 165,100 182,700 1.1 1.0 58,900 66,800 75,300 1.3 1.2 23.0 21.5 15.9 20.3
Mornington Peninsula (S) 149,300 164,400 181,800 1.0 1.0 61,400 69,000 77,300 1.2 1.1 24.4 22.6 21.4 27.9
Western MelbourneBrimbank (C) 191,500 210,900 227,500 1.0 0.8 65,200 75,000 83,000 1.4 1.0 25.5 23.3 11.3 18.7
Hobsons Bay (C) 87,400 98,600 109,400 1.2 1.1 34,400 39,500 44,100 1.4 1.1 23.6 23.5 13.6 18.9
Melton (C) 112,600 171,000 266,000 4.3 4.5 37,800 59,000 92,600 4.6 4.6 30.9 28.9 6.5 11.8
Moonee Valley (C) 112,200 129,900 146,400 1.5 1.2 45,000 52,300 59,200 1.5 1.2 22.2 23.0 15.3 18.0
Wyndham (C) 166,700 267,400 361,400 4.8 3.1 57,700 91,400 125,600 4.7 3.2 29.8 31.0 6.7 12.1

Local Government
Area
Total population Total households% Aged under
20 years% Aged 65
years or older
2011 2021 2031Annual % change 2011-21
Annual % change 2021-31
2011 2021 2031Annual % change 2011-21
Annual % change 2021-31
2011 2031 2011 2031
Central Highlands RegionA rarat (RC) 11,300 10,700 10,600 -0.6 -0.1 4,700 4,600 4,700 -0.1 0.2 23.4 19.4 20.0 28.5
B al larat (C) 95,200 113,800 136,900 1.8 1.9 39,200 47,000 56,600 1.8 1.9 26.7 26.6 15.0 18.5
G olden Plains (S) 19,000 23,600 29,000 2.2 2.1 6,700 8,400 10,500 2.3 2.2 30.3 27.5 10.6 17.6
H epburn (S) 14,600 15,300 16,500 0.4 0.7 6,400 7,100 7,900 1.0 1.1 22.9 17.8 18.9 33.2
M oorab ool (S) 28,700 36,100 46,100 2.3 2.5 10,900 14,400 18,700 2.8 2.7 28.4 24.9 12.8 21.6
P yrenees (S) 6,800 7,000 7,400 0.4 0.5 3,000 3,200 3,500 0.9 0.9 22.3 17.2 20.8 32.9
G2 1 RegionColac- O t way (S) 20,800 19,900 20,000 -0.4 0.0 8,800 8,800 9,100 0.1 0.3 25.5 20.9 18.5 29.1
Gre ater G eelong (C) 215,800 253,200 296,400 1.6 1.6 88,300 104,400 122,400 1.7 1.6 24.9 24.4 16.7 21.9
Q ueenscl i f fe (B) 3,100 3,000 3,100 -0.2 0.2 1,400 1,400 1,500 0.1 0.6 19.5 15.2 31.7 43.2
Sur f Co as t (S) 26,700 32,300 39,600 1.9 2.0 10,500 12,700 16,000 2.0 2.3 27.2 24.7 14.1 20.6
Gippsland RegionB ass Co as t (S) 30,200 37,000 44,800 2.0 1.9 13,600 16,800 20,300 2.1 1.9 22.1 21.8 23.4 26.2
B aw B aw (S) 43,400 54,300 67,700 2.3 2.2 17,400 22,500 28,400 2.6 2.4 27.1 24.5 16.4 23.1
Eas t Gippsland (S) 42,800 47,100 52,200 1.0 1.0 18,800 21,400 24,200 1.3 1.2 23.2 19.6 23.0 31.7
Latrob e (C) 73,800 75,000 81,200 0.2 0.8 30,900 32,200 35,200 0.4 0.9 26.5 24.8 15.4 23.9
South Gippsland (S) 27,500 28,500 30,700 0.3 0.7 11,600 12,300 13,500 0.6 0.9 24.8 22.0 19.5 28.2
Wel l ington (S) 42,100 42,700 45,200 0.1 0.6 17,300 18,200 19,800 0.5 0.8 25.8 23.0 16.6 26.7
G reat Sout h Coas t RegionCorangamite (S) 16,500 15,100 14,200 -0.9 -0.6 6,800 6,600 6,500 -0.3 -0.2 27.8 20.6 19.0 29.9
Glenelg (S) 19,800 18,700 18,300 -0.6 -0.3 8,600 8,500 8,600 -0.1 0.1 25.6 20.6 17.3 32.4
M oyne (S) 16,200 16,600 17,400 0.3 0.5 6,400 6,900 7,600 0.8 0.9 27.9 22.1 15.9 26.7
Southern Grampians (S) 16,600 15,400 14,800 -0.8 -0.4 7,100 6,800 6,800 -0.4 -0.1 25.8 22.3 19.6 30.4
Warrnamb ool (C) 32,700 35,700 38,700 0.9 0.8 13,300 15,000 16,600 1.2 1.0 27.1 24.7 15.7 22.5
H ume RegionA lpine (S) 12,100 11,800 11,900 -0.2 0.1 5,200 5,300 5,400 0.1 0.3 22.6 19.2 20.7 33.3
B enal la (RC) 13,800 13,300 13,400 -0.4 0.1 6,000 6,000 6,200 -0.1 0.3 24.6 21.1 21.2 32.6
Gre ater Shepp ar ton (C) 61,800 67,000 73,700 0.8 1.0 24,300 26,900 30,200 1.1 1.2 28.4 25.9 14.6 20.7
Indigo (S) 15,300 15,700 16,300 0.2 0.4 6,200 6,600 7,100 0.7 0.7 26.2 21.3 16.7 29.5
M ans f ie ld (S) 7,900 8,700 9,600 0.9 1.0 3,300 3,700 4,100 1.0 1.0 25.4 24.0 18.0 27.0
Mitchel l (S) 35,100 47,100 81,600 3.0 5.6 12,900 18,000 30,100 3.4 5.3 29.6 28.5 11.6 14.9
M oira (S) 28,400 29,900 32,000 0.5 0.7 11,900 13,100 14,500 0.9 1.0 25.5 20.9 21.3 31.3
Murr indindi (S) 13,300 14,300 15,600 0.7 0.9 5,700 6,400 7,100 1.1 1.0 22.9 19.2 18.6 30.7
Strathb ogie (S) 9,600 10,200 10,800 0.6 0.6 4,300 4,700 5,100 0.9 0.8 20.9 18.6 25.0 34.3
Towong (S) 5,900 5,700 5,500 -0.4 -0.3 2,600 2,500 2,500 0.0 0.0 24.2 19.5 21.5 32.8
Wangarat ta (RC) 27,200 27,200 27,800 0.0 0.2 11,600 11,900 12,500 0.3 0.5 25.5 21.8 19.1 28.6
Wodonga (RC) 36,000 43,400 52,100 1.9 1.8 14,400 17,800 21,700 2.2 2.0 29.3 26.8 12.0 18.6
Loddon M allee N or t h RegionB uloke (S) 6,500 5,500 4,900 -1.6 -1.1 2,900 2,600 2,400 -1.1 -0.9 24.3 19.7 23.8 34.5
Camp asp e (S) 36,900 37,400 38,800 0.1 0.4 15,200 16,200 17,300 0.6 0.7 26.7 21.8 19.1 29.8
G annawarra (S) 10,500 9,500 8,800 -1.0 -0.8 4,600 4,400 4,200 -0.4 -0.4 24.6 19.3 24.1 38.1
Mi ldura (RC) 51,800 55,300 59,400 0.6 0.7 21,200 23,600 26,100 1.1 1.0 28.1 23.8 15.9 24.5
Swan Hi l l (RC) 20,900 20,400 20,700 -0.2 0.1 8,400 8,600 8,900 0.2 0.3 27.5 24.0 16.3 22.4
Loddon M allee Sout h Region Central G oldf ie lds (S) 12,600 12,700 13,100 0.1 0.3 5,700 6,000 6,400 0.6 0.6 22.8 17.8 24.7 35.4
Gre ater B endigo (C) 102,000 121,700 144,600 1.8 1.7 41,600 50,000 59,800 1.9 1.8 26.6 25.4 15.5 20.6
Loddon (S) 7,500 7,100 6,700 -0.7 -0.5 3,400 3,300 3,300 -0.1 0.0 22.7 15.2 23.4 39.7
M acedon Ranges (S) 42,900 49,600 57,500 1.5 1.5 15,900 19,300 23,000 2.0 1.8 28.2 23.2 13.4 23.8
M ount A lexander (S) 17,900 18,700 20,000 0.5 0.6 7,800 8,600 9,500 1.0 1.0 22.4 17.4 20.5 32.5
Wimmera Sout h M allee Region Hindm arsh (S) 5,900 5,100 4,600 -1.3 -1.0 2,500 2,300 2,100 -1.0 -0.8 24.8 21.1 23.3 31.2
H orsham (RC) 19,500 20,500 21,800 0.5 0.6 8,300 8,900 9,500 0.6 0.7 26.4 25.4 17.7 21.8
N or thern Grampians (S) 12,100 11,100 10,800 -0.8 -0.3 5,300 5,100 5,100 -0.3 0.0 23.6 19.4 20.2 34.2
Wes t W immera (S) 4,300 3,500 3,000 -2.1 -1.5 1,900 1,600 1,400 -1.7 -1.1 23.4 17.8 23.0 29.9
Yarr iambiack (S) 7,200 6,300 5,600 -1.4 -1.1 3,200 2,900 2,700 -0.9 -0.8 24.0 19.1 24.7 36.9
U nincorp oratedUnincorp orated V ic 800 800 800 0.2 0.5 300 300 400 0.2 0.5 23.6 23.0 19.8 27.1

Victoria in Future 2016 Population and household projections to 2051 Page 16
Flow chart of projection processFigure 11 below illustrates the process by which
projections are produced. From the top left of the flow
chart follow the analysis, assumptions, models and
outputs from state level to LGA projections.
INPUTS MODEL OUTPUT
Figure 11. Flow chart of projections process
END
START
State / region age / sex model
ERP by age and sex, by region
Households by type, dwellings, by region
LGA level housing unit model
Total ERP, dwellings by LGA
ERP by age and sex, by LGA
Households by type, by LGA
LGA level household model
Dwelling construction Dwelling demolition Dwelling occupancy Average household size Non-private dwellings
Individual living arrangements
Base population Births and deaths Overseas migration Interstate migration Intrastate migration
State / region household model
LGA level age / sex model
Births and deaths Implied net migration
Individual living arrangements

VIF2016 online productsThe following profiles and data products are available
to be viewed or downloaded online at:
www.delwp.vic.gov.au/victoria-in-future
VIF2016 data productsProjections for Victoria for individual years
from 2011 to 2051
• Population by single year of age and sex
• Total population and components of population
change
Projections for Victoria, Greater Melbourne and
Statistical Areas level 4 (SA4) in Victoria’s regions for
every fifth year from 2011 to 2051
• Population by five-year age group and sex
• Total population and components of
population change
• Total population, households and dwellings
• Households by household type
Projections for Local Government Areas and Victoria in
Future Small Areas (VIFSAs) in Victoria for individual
years from 2011 to 2031
• Total population
Projections for Local Government Areas and Victoria in
Future Small Areas (VIFSAs) in Victoria for every fifth
year from 2011 to 2031
• Population by five-year age group and sex
• Total population, households and dwellings
• Households by type
VIF2016 one-page profilesSummaries of VIF2016 data for Local Government Areas
including information on population by age and sex,
households and dwellings from 2011 to 2031.
Victoria in Future 2016 Population and household projections to 2051 Page 17

Notes W