victoria (state of) and... · is bolstered by exceptional access to external markets, thereby...
TRANSCRIPT

Victoria (State of)Primary Credit Analyst:Anna Hughes, Melbourne (61) 3- 9631-2010; [email protected]
Secondary Contact:Claire Curtin, Sydney 612-9255-9882; [email protected]
Table Of Contents
Major Rating Factors
Rationale
Outlook
Comparative Analysis
Institutional Framework
Economy
Financial Management
Budgetary Flexibility
Budgetary Performance
Debt
Contingent Liabilities
Related Criteria And Research
November 14, 2011
www.standardandpoors.com/ratingsdirect 1
913637 | 300750493

Victoria (State of)
Major Rating Factors
Strengths:
• Strong institutional framework
• Very strong management and ongoing fiscal discipline
• Strong and diversified economy
Issuer Credit Rating
AAA/Stable/A-1+
Weaknesses:
• Like all Australian states, a degree of structural imbalance between revenue powers and expenditure
responsibilities
Rationale
The ratings on Victoria are supported by: our opinion of the strong institutional framework benefiting state
governments in Australia, Victoria's very capable and conservative management, and the state's resilient and
diversified economy. These strengths are offset--as with all Australian states--by an institutional framework that
features some structural imbalance between revenue powers and expenditure responsibilities.
The state governs in a supportive financial environment. In our opinion, Australia's system support and the
predictability of federal-state relations are among the strongest in the world, and we expect this to remain so. In
particular, Australia adopts a system of fiscal equalization, which is administered by an independent commission.
Under this system, however, Victoria receives less than its average per-capita share of the goods and services tax
(GST) pool.
Recent changes to the formula have led to increased volatility, particularly in regard to the treatment of
capital-expenditure grants provided to state governments by the Commonwealth. The biggest change, however, has
been the move from five-year averaging to three-year averaging. The Commonwealth government has commissioned
a review of the formula; however, it is unlikely that any changes will be implemented prior to 2014.
The government's very strong financial management provides ongoing financial stability. The Victorian government
continues to deliver on its fiscal strategy, including the delivery of at least an A$100 million surplus. We note that
there was some slippage in operating expenditure; however, it was less than 1%. Similar to the other Australian
states, the Victorian government is focused on the sustainability of the state's budgetary performance, particularly in
light of the lower-than-forecast GST receipts. Specifically, the government has established an Independent Review of
State Finances, and is expected to implement both revenue and expenditure measures over the forward estimates,
resulting in an improved budgetary position. In regard to the state's debt burden, it is our expectation that it will
peak by fiscal 2013 and then stabilize over the remaining forward estimates at around 90% of operating revenues.
In our view, Victoria's economy is strong and diversified, with high per-capita income. In 2010, Victoria's gross
state product (GSP) per capita was A$54, 793 compared with the national average of A$57, 965. The state's
economy is more diversified than other Australian states'. While Victoria has some concentration in the higher-end
manufacturing sector, this dependence is easing. The potentially volatile sectors of agriculture, mining,
manufacturing, and construction account for around a combined 27% of state output, which is similar to the
Standard & Poors | RatingsDirect on the Global Credit Portal | November 14, 2011 2
913637 | 300750493
national average of 25%.
Limited budgetary flexibility is a credit weakness of the Australian states, including Victoria, but this has not
impeded strong fiscal outcomes. Under Australia's institutional environment, the Commonwealth government has
control over most taxes, whereas the states assume most of the responsibilities for delivering services. Victoria relies
on about 43% of its consolidated operating revenues from the Commonwealth. On the expenditure side, the states
are responsible for the politically sensitive areas of health, education, and justice. Furthermore, state government
capital expenditure as a percentage of total expenditure is typically less than 15%.
Liquidity
Victoria's short-term rating is 'A-1+'. We consider the state's liquidity position as being very positive. At June 30,
2011, Victoria's short-term liabilities of A$3.3 billion were offset by liquid assets of A$4.8 billion. Although we
assess Victoria's 86% debt servicing (12 months of maturing debt plus interest payments) ratio as neutral, the level
is bolstered by exceptional access to external markets, thereby supporting its liquidity position.
Victoria's access to external liquidity is exceptional. Similar to Germany and Canada, the Australian states utilize a
well-developed capital market for their funding. The capital markets in Australia are deep and liquid, and are
expected to remain so. Victoria's individual characteristics support its access to external liquidity. Historically,
Victoria has not experienced difficulty in accessing Australian and international markets, and our expectation is that
this will continue. While the Commonwealth government's guarantee of state debt was withdrawn on Dec. 31,
2010, it is likely that the Commonwealth would offer Victoria a guarantee if needed, further supporting the state's
liquidity. TCV did not utilize the Commonwealth's guarantee.
Further supporting the state's liquidity is the Liquidity Management Strategy. The Department of Treasury and
Finance, in conjunction with the Treasury Corp. of Victoria (the state's central borrowing authority), has developed
a whole of government Liquidity Management Strategy. The strategy includes a contingency plan for dealing with
abnormal disruption in financial markets or adverse liquidity conditions specific to the state.
Outlook
The stable outlook reflects our opinion of the government's commitment to fiscal prudence. This includes a fiscal
strategy that seeks to maintain an adequate operating performance and strong balance sheet.
The ratings on the state could come under pressure if the ratio of net financial liabilities (net debt and unfunded
superannuation) to operating revenue exceeds 130% because of a change in government policy. It is unlikely that
this will occur over the short-to-medium term.
Comparative Analysis
Victoria is more closely comparable to the Australian states of New South Wales and South Australia than the
resource-rich states of Western Australia and Queensland. Victoria's accrual operating performance has compared
well against its non-resource 'AAA' rated peers. The state's general government cash operating balances as a
proportion of operating revenue have averaged 7.7% for the five years to fiscal 2010. This compares well against
5.1% in South Australia (AAA/Stable/A-1+) and 7.0% in New South Wales (AAA/Stable/A-1+). Victoria's
after-capital expenditure performance remains stronger than New South Wales', largely reflecting New South Wales'
www.standardandpoors.com/ratingsdirect 3
913637 | 300750493
Victoria (State of)

challenging capital program.
Victoria's balance sheet compares well against its domestic peers'. Victoria's tax-supported (general government and
public trading enterprises) debt levels as a proportion of operating revenue are stronger than New South Wales',
South Australia's, and the lower-rated state of Queensland (AA+/Stable/A-1+). Unlike New South Wales,
Queensland, and Western Australia, Victoria's debt is concentrated in the general government and not in the riskier
public non-financial corporations sector.
Victoria's economic growth on average has been stronger than its main peer's--New South Wales--over the past 10
years. Victoria's economic growth tends to track the national average, unlike New South Wales, whose economic
performance until recently has been subdued compared with the national average. Victoria also enjoys better
budgetary flexibility, as there is less pressure to spend on its infrastructure. Further, Victoria does not have risks
associated with an energy sector, unlike New South Wales.
Victoria's debt and financial performance compares well to its 'AAA' rated international peers. In general, the
Australian system factors in a lower level of support from higher levels of government than in Germany and a higher
level of support than in Canada and Switzerland. In relation to its international peers, only general government
comparisons are possible. The state's balance sheet compares well against international peers (see table 1), with the
levels of debt for each entity reflecting the level of system support enjoyed by the regional government.
Table 1
State of Victoria 2011 Peer Comparison
Victoria (StateOf)
Basel-Country(Canton Of)
Bavaria (StateOf)
BritishColumbia
(Province Of)
New SouthWales (State
Of)Queensland
(State Of)South Australia
(State Of)
Issuer CreditRating (localcurrency)
AAA/Stable/A-1+ AAA/Stable/A-1+ AAA/Stable/A-1+ AAA/Stable/A-1+ AAA/Stable/A-1+ AA+/Stable/A-1+ AAA/Negative/A-1+
Issuer CreditRating(foreigncurrency)
AAA/Stable/A-1+ AAA/Stable/A-1+ AAA/Stable/A-1+ AAA/Stable/A-1+ AAA/Stable/A-1+ AA+/Stable/A-1+ AAA/Negative/A-1+
Five-year averages (two years of actual data, current budget, and two years of Standard & Poor's forecast)--
Operatingbalance (% ofadjustedoperatingrevenues)
5.99 [2010-2014] 1.49 [2009-2013] 6 [2009-2013] N.A. 6.66 [2009-2013] 4.40 [2009-2013] 4.33 [2009-2013]
Balance aftercapitalaccounts (%of adjustedtotalrevenues)
(2.3)[2010-2014] (5.45)[2009-2013] (5.41)[2009-2013] N.A. (3.15)[2009-2013] (12.18)[2009-2013] (6.66)[2009-2013]
Total adjustedrevenues (mil.A$)
45, 761 2,622.99* 53,218.01* 40,043.91 53,597.57* 38,263.13* 14,535.91*
Transfersreceived (% oftotal adjustedrevenues)
48.64 18.81* 9.42* 19.7 46.20* 48.16* 56.25*
Standard & Poors | RatingsDirect on the Global Credit Portal | November 14, 2011 4
913637 | 300750493
Victoria (State of)
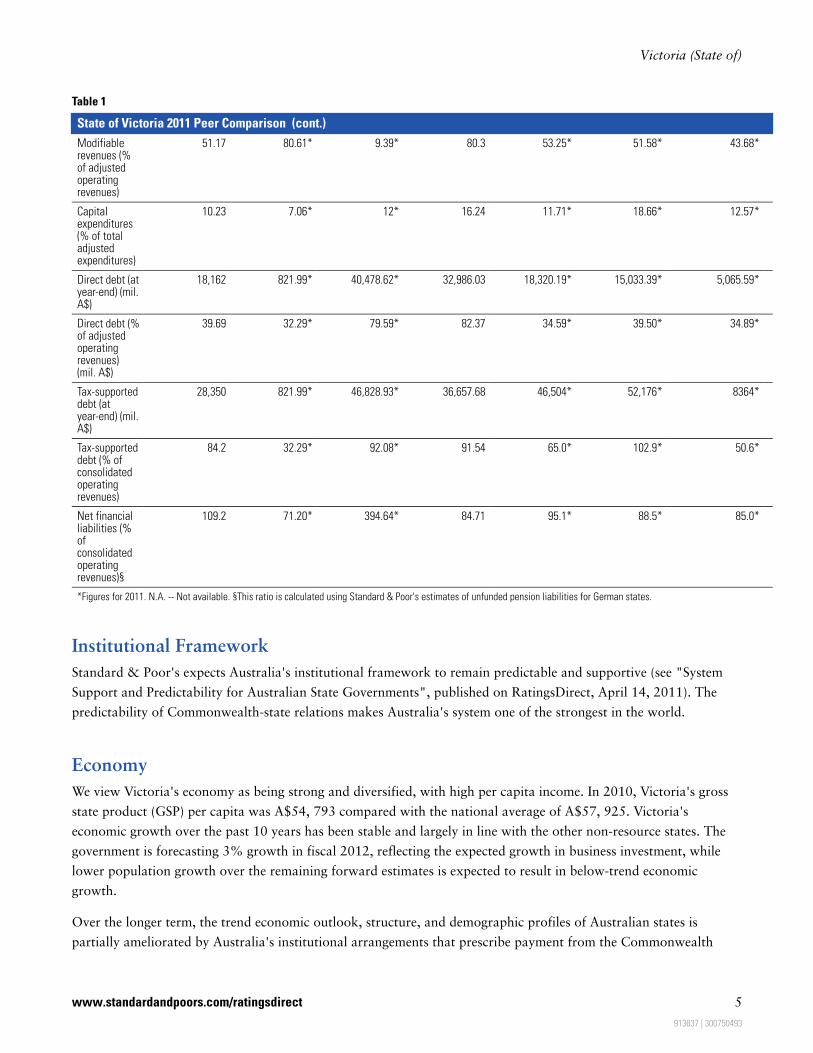
Table 1
State of Victoria 2011 Peer Comparison (cont.)
Modifiablerevenues (%of adjustedoperatingrevenues)
51.17 80.61* 9.39* 80.3 53.25* 51.58* 43.68*
Capitalexpenditures(% of totaladjustedexpenditures)
10.23 7.06* 12* 16.24 11.71* 18.66* 12.57*
Direct debt (atyear-end) (mil.A$)
18,162 821.99* 40,478.62* 32,986.03 18,320.19* 15,033.39* 5,065.59*
Direct debt (%of adjustedoperatingrevenues)(mil. A$)
39.69 32.29* 79.59* 82.37 34.59* 39.50* 34.89*
Tax-supporteddebt (atyear-end) (mil.A$)
28,350 821.99* 46,828.93* 36,657.68 46,504* 52,176* 8364*
Tax-supporteddebt (% ofconsolidatedoperatingrevenues)
84.2 32.29* 92.08* 91.54 65.0* 102.9* 50.6*
Net financialliabilities (%ofconsolidatedoperatingrevenues)§
109.2 71.20* 394.64* 84.71 95.1* 88.5* 85.0*
*Figures for 2011. N.A. -- Not available. §This ratio is calculated using Standard & Poor's estimates of unfunded pension liabilities for German states.
Institutional Framework
Standard & Poor's expects Australia's institutional framework to remain predictable and supportive (see "System
Support and Predictability for Australian State Governments", published on RatingsDirect, April 14, 2011). The
predictability of Commonwealth-state relations makes Australia's system one of the strongest in the world.
Economy
We view Victoria's economy as being strong and diversified, with high per capita income. In 2010, Victoria's gross
state product (GSP) per capita was A$54, 793 compared with the national average of A$57, 925. Victoria's
economic growth over the past 10 years has been stable and largely in line with the other non-resource states. The
government is forecasting 3% growth in fiscal 2012, reflecting the expected growth in business investment, while
lower population growth over the remaining forward estimates is expected to result in below-trend economic
growth.
Over the longer term, the trend economic outlook, structure, and demographic profiles of Australian states is
partially ameliorated by Australia's institutional arrangements that prescribe payment from the Commonwealth
www.standardandpoors.com/ratingsdirect 5
913637 | 300750493
Victoria (State of)

government to state governments to offset the differences in available revenue or the responsibility for providing
services. However, the short-term impact of changes in economic growth can significantly impact Victoria's
own-source revenues (primarily conveyance duty) as well as the GST revenues it receives from the Commonwealth,
therefore reducing the state's budgetary flexibility.
The state's economy is more diversified than other Australian states'. While Victoria has some concentration in the
higher-end manufacturing sector, this dependence is easing. The potentially volatile sectors of agriculture, mining,
manufacturing, and construction account for around 27% of state output, which is similar to the national average
of 25%.
Victoria has recorded strong population growth but as noted is expected to ease reflecting lower net overseas
migration. Located in the south-east of Australia, Victoria is the second most populous state, with a population of
around 5.6 million or about 25% of the total Australian population. To March 2011, Victoria recorded annual
population growth of 1.5% compared with Australia's growth of 1.4%. Projections are for growth to moderate to
an average of 1.5% per annum over the forward estimates. This compares to 1.6% for Australia. Victoria's
demographic profile largely reflects Australia's profile with a total dependency ratio of around 31.5%.
Financial Management
Victoria's financial management is a very positive ratings factor. Within Australia there is a culture of long-term
planning and transparency. Each Australian state prepares an annual budget based on accruals that include four
years of forecasts for the general government, the public trading enterprises sector, and the non-financial public
sector (i.e. consolidated accounts). The states also prepare mid-year budget updates as well as releasing final
outcomes generally within six months of the end of the fiscal year. Annual reports are audited by the state's
independent auditor general.
The Victorian government continues to deliver on its fiscal strategy, including the delivery of at least a A$100
million surplus. We note that there was some slippage in operating expenditure; however, it was less than 1%.
Similar to the other Australian states, the Victorian government is focused on the sustainability of the state's
budgetary performance, particularly in light of the lower-than-forecast GST receipts. Specifically, the government
has established an Independent Review of State Finances and is implementing both revenue and expenditure
measures over the forward estimates.
The Treasury Corp. of Victoria (TCV), the state's central borrowing authority, is responsible for managing
Victoria's borrowings. All of TCV's financial obligations are guaranteed by the state, and the rating on TCV reflects
the ratings on the state. TCV performs the state's treasury and debt-management function and funds Victoria's
public sector borrowings (see separate report on TCV, published on Global Credit Portal, on Feb. 23, 2011).
Victoria's investments are managed centrally by the Victorian Funds Management Commission. The asset allocation
of the public sector assets is moderately aggressive relative to private-sector peers. About 60% of investments were
held in Australian and international equities and property at June 30, 2011. Given the long-tailed nature of the
schemes and over-funding, a degree of volatility from higher-risk assets can be absorbed.
Victoria's risk-management strategies appear adequate. The state government has developed a Victorian
Government risk-management framework that identifies key risk categories and applicable frameworks. This risk
Standard & Poors | RatingsDirect on the Global Credit Portal | November 14, 2011 6
913637 | 300750493
Victoria (State of)
map has been updated to adopt the new Australian Risk Management Framework.
The government enjoys an absolute majority in both of the state's houses of parliament, which assists the
government with introducing its policy initiatives, and relies on the support of independents or other parties to pass
legislation. This is not uncommon in Australian politics and is not expected to affect the business of government, as
all parties typically provide undertakings to support the government's "supply" bills. The next state election is not
due until Nov. 29, 2014.
Budgetary Flexibility
Australian states, including Victoria, have moderate budgetary flexibility. With around 35% of its consolidated
operating revenues modifiable, and capital expenditure as a percentage of total expenditure averaging less than 15%
over the forward estimates, Victoria's budgetary flexibility is moderate. This is primarily the result of the Australian
institutional environment, in which the Commonwealth holds most of the taxation powers, whereas the states have
most of the responsibilities for delivering politically-sensitive services such as health, education, and policing.
Victoria is a donor state under Australia's equalization system. Under the Commonwealth Grants Commission's
(CGC) 2011 review of GST-revenue-sharing relativities, Victoria's distribution-relativity factor decreased
significantly, which will result in the state receiving a much smaller share of the GST pool. Further, the
smaller-than-forecast size of the pool also contributed to Victoria receiving a smaller grant. In fiscal 2011, Victoria
received about 45% of its consolidated revenues from the Commonwealth. Current forecasts suggest that
Commonwealth grants will continue to decline over the forecast period.
We also note that recent changes to the distribution formula have lead to increased volatility, particularly in regard
to the change from five-year averaging to three-year averaging and the treatment of capital-expenditure grants
provided to the state governments by the Commonwealth. The Commonwealth government has commissioned a
review into the formula; however, it is unlikely that any changes will be implemented prior to 2014. We expect that
Victoria will remain a donor state under any changes to the distribution formula. We also note that the
Commonwealth government held a tax summit in October 2011. It remains unclear as to how this summit will
impact the Australian states; however, a taskforce has been established to review state taxes. In regard to the
Commonwealth resource rent tax and carbon tax, there has to date been no impact on mining investment in
Victoria.
Victoria has limited capacity to generate one-off income. During the 1990s, the Victorian government sold or
privatized the majority of its government-related businesses, with those remaining being in the lower-risk general
government sector. Victoria has fewer public trading enterprises than some of its peers, such as Queensland, New
South Wales, and Western Australia. In particular, Victoria's business ownership is primarily in lower-risk water
and low-income public housing, whereas Queensland, New South Wales, and Western Australia are more dependent
revenues from the higher-risk energy sector.
Budgetary Performance
Victoria's budgetary performance is moderate, in our view. Victoria's consolidated cash operating balance is
expected, over a five-year period (2010-2014), to average around 8% of consolidated operating revenues; while its
average after-capital deficit is forecast by the government to average around 7% over the same period.
www.standardandpoors.com/ratingsdirect 7
913637 | 300750493
Victoria (State of)
The state's operating performance weakened in fiscal 2011, primarily as a result of lower GST receipts. Partly
supported by the advance payment of A$500 million from the Commonwealth for the 2011 Victorian floods,
Victoria recorded both cash and accrual surpluses in fiscal 2011. The state's cash operating position is expected by
the government to remain solid over the forward estimates, averaging around 7.5%.
In our view, the state's accrual operating position is moderate, with the state forecasting small deficits over the
forecast period. We note that the exclusion of the Commonwealth flood payment from fiscal 2011's actuals results
in a small accrual operating deficit. Further, while the payment has boosted 2011's actuals, its advance payment
means that Victoria may record an accrual deficit in fiscal 2012. The size and timing of surpluses (or deficits) is
dependent on the impact of economic events on GST revenues and taxation; as well as the government's response to
weaker operating revenue growth. Given the state's track record of budgetary flexibility, it is our expectation that
the state will continue to adjust its operating expenditures.
Victoria's after-capital-expenditure deficits reflect a weaker operating position as well as a significant
capital-expenditure program. The state's capital program will keep Victoria's after-capital expenditure position in
deficit, meaning that part of the capital program is being funded by debt rather than operating funds. The state is
anticipating the nonfinancial public sector's after-capital-expenditure balance as a proportion of operating revenue
to average a deficit of around 5.3% over the four years to 2015.
Debt
Victoria's tax-supported debt levels and its interest burden are consistent with an 'AAA' rating. The state's increased
capital-infrastructure plan to fiscal 2015 will increase debt in both the general government and the
government-trading enterprises. Tax-supported debt is expected to reach around 85% of operating revenues in
2015, with the interest burden averaging around 4.5% over 2011-2013. The weakening of the state's operating
position over fiscal 2011 has meant that the level of debt needed to fund the capital program has increased in
comparison with last year's budget (see chart 1). However, debt levels and the state's interest burden are expected to
remain consistent with an 'AAA' rating over the forecast period.
Standard & Poors | RatingsDirect on the Global Credit Portal | November 14, 2011 8
913637 | 300750493
Victoria (State of)
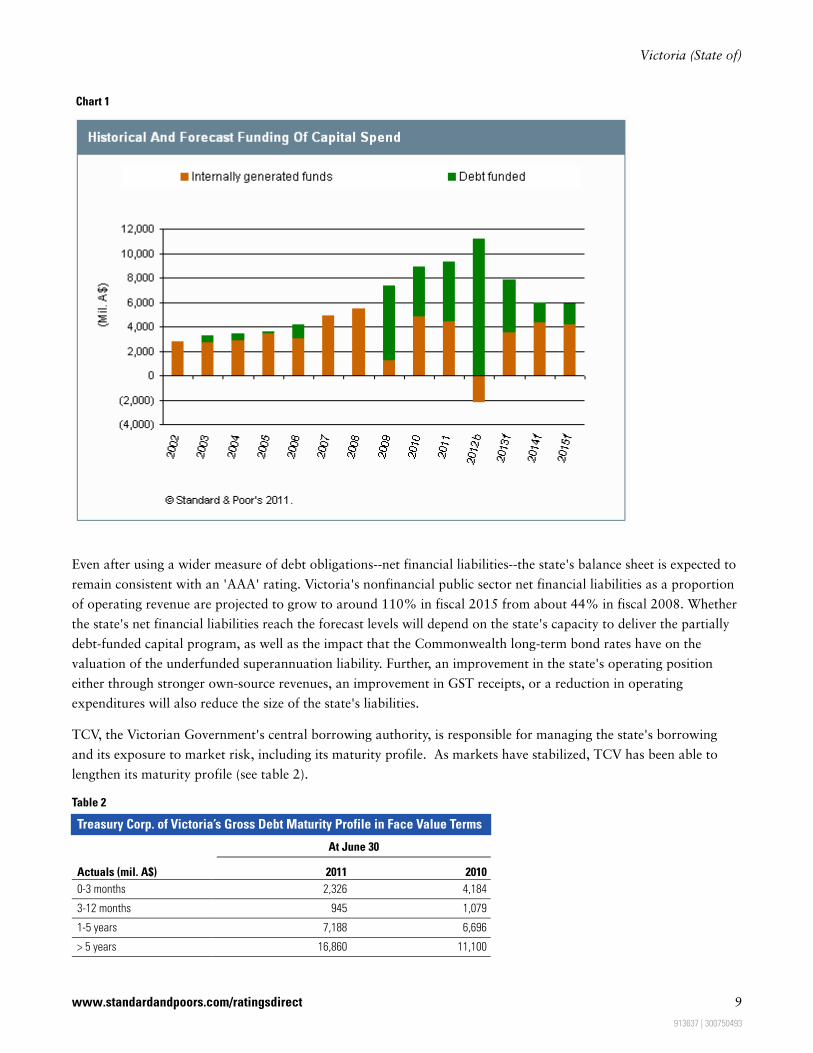
Chart 1
Even after using a wider measure of debt obligations--net financial liabilities--the state's balance sheet is expected to
remain consistent with an 'AAA' rating. Victoria's nonfinancial public sector net financial liabilities as a proportion
of operating revenue are projected to grow to around 110% in fiscal 2015 from about 44% in fiscal 2008. Whether
the state's net financial liabilities reach the forecast levels will depend on the state's capacity to deliver the partially
debt-funded capital program, as well as the impact that the Commonwealth long-term bond rates have on the
valuation of the underfunded superannuation liability. Further, an improvement in the state's operating position
either through stronger own-source revenues, an improvement in GST receipts, or a reduction in operating
expenditures will also reduce the size of the state's liabilities.
TCV, the Victorian Government's central borrowing authority, is responsible for managing the state's borrowing
and its exposure to market risk, including its maturity profile. As markets have stabilized, TCV has been able to
lengthen its maturity profile (see table 2).
Table 2
Treasury Corp. of Victoria’s Gross Debt Maturity Profile in Face Value Terms
At June 30
Actuals (mil. A$) 2011 2010
0-3 months 2,326 4,184
3-12 months 945 1,079
1-5 years 7,188 6,696
> 5 years 16,860 11,100
www.standardandpoors.com/ratingsdirect 9
913637 | 300750493
Victoria (State of)

Table 2
Treasury Corp. of Victoria’s Gross Debt Maturity Profile in Face ValueTerms (cont.)
Total 27,319 23,059
Victoria's active participation in the public-private partnership (PPP) market flows through to the state's debt
balance, and is not a contingent liability for the state. We regard the state's conservative approach of treating PPP
projects as finance leases and including them on its balance sheet as a credit strength. Victoria currently has 19
groups of projects, worth A$10 billion. At the end of fiscal 2011, six PPP projects were under construction, and an
additional one was in the procurement stage.
Contingent Liabilities
Victoria's contingent liabilities remain manageable, noting that only a small portion, if any, is likely to crystallize at
any specific point in time. The state has guarantees and other contingent liabilities estimated at A$2.2 billion at June
30, 2011, or around 4.5% of revenue. It also has other liabilities that include the state's fully funded statutory
insurance companies.
Other liabilities include:
The Victorian WorkCover Authority (VWA), the state monopoly workers' compensation insurer. At June 30, 2011,
the scheme was more than 100% funded, with the A$9.4 billion actuarial estimate of liabilities met by A$10.9
billion assets.
The Transport Accident Commission (TAC), the state monopoly compulsory third-party motor vehicle insurer. At
June 30, 2011, the TAC's A$8.7 billion assets funded 97% of the A$8.9 billion liability estimate.
The Victorian Managed Insurance Authority (VMIA), the state's self-insurer for the public sector. At June 30,
2011, VMIA's A$1.8 billion in assets was matched by its A$1.8 billion liabilities estimate.
Local government. Given that Australian local governments are legislatively responsible to their respective states, we
consider them a contingent liability of the state. However, given the level of state government oversight we believe
that the contingent liability is small.
Table 3
Victoria Non-Financial Public Sector Financial Statistics
Year ended June 30
(Mil. A$) 2011 2010 2009 2008 2007
Accrual
Taxation revenue 14,661 13,548 12,457 12,709 11,565
Current grants and subsidies 22,419 22,713 18,850 17,208 14,634
Interest income 536 382 474 565 506
Other revenue 11,940 10,992 10,285 9,866 10,754
Operating revenue 49,556 47,634 42,065 40,347 37,459
Interest expenses 1,630 1,362 1,128 802 780
Depreciation 3,576 3,366 2,520 2,335 2,202
Other expenses 43,937 42,139 38,203 35,292 32,650
Standard & Poors | RatingsDirect on the Global Credit Portal | November 14, 2011 10
913637 | 300750493
Victoria (State of)

Table 3
Victoria Non-Financial Public Sector Financial Statistics (cont.)
Operating expenditure 49,143 46,867 41,851 38,428 35,632
Net operating balance 413 767 214 1,919 1,827
Net lending (5,304) (4,980) (4,794) (1,144) (1,054)
Cash
Operating revenue 49,182 48,182 42,767 40,710 37,152
Operating expenditure 44,924 43,522 39,915 35,848 33,202
Operatng balance 4,258 4,660 2,853 4,862 3,950
Capital spending 9,289 8,924 7,373 5,466 4,865
Net capital receipts 342 317 344 241 (77)
Cash surplus (deficit) (4,689) (3,948) (4,176) (363) (992)
KEY FINANCIAL RATIOS
Operating revenue growth 4.0 13.2 4.3 7.7 8.6
Operating expenditure growth 4.9 12 8.9 7.8 6.3
Cash operating balance/cash receipts 8.7 9.7 6.7 11.9 10.6
Accrual operating balance/op. revenue 0.8 1.6 0.5 4.8 4.9
Net interest expense/ operating revenue 2.2 2.1 1.6 0.6 0.7
Gross Interest Expense/operating revenue 3.0 2.6 2.4 2.0 2.0
Net lending/operating revenue (10.7) (10.5) (11.4) (2.8) (2.8)
Cash Surplus (Deficit)/receipts (9.5) (8.2) (9.8) (0.9) (2.7)
Capital expenditure/total payments 17.1 17.0 15.6 13.2 12.8
As at June 30
Financial assets 8,519 8,221 7,622 9,222 7,984
Gross debt 28,350 23,145 18,444 13,903 12,751
Unfunded superannuation 22,843 22,598 20,755 12,959 9,915
Other financial liabilities 4,811 4,627 4,511 4,189 6,249
Net debt 19,832 14,924 10,822 4,681 4,767
Net financial liabilities 42,675 37,522 31,577 17,640 14,682
KEY LIABILITY RATIOS (%)
Gross debt/operating revenue 57.2 48.6 43.8 34.5 34
Net debt/operating revenue 40.0 31.3 25.7 11.6 12.7
Net financial liabilities/operating revenue 86.1 78.8 75.1 43.7 39.2
Table 4
Victoria General Government Sector Financial Statistics
Year ended June 30
(Mil. A$) 2011 2010 2009 2008 2007
Accrual
Taxation revenue 14,858 13,741 12,627 12,863 11,702
Current grants and subsidies 22,426 22,718 18,970 16,021 14,646
Interest income 420 334 378 452 423
Other revenue 8,324 7,794 7,310 8,004 8,115
Operating revenue 46,027 44,585 39,285 37,340 34,886
www.standardandpoors.com/ratingsdirect 11
913637 | 300750493
Victoria (State of)

Table 4
Victoria General Government Sector Financial Statistics (cont.)
Interest expenses 986 843 642 438 459
Depreciation 2,010 1,870 1,516 1,416 1,335
Other expenses 42,514 41,229 36,876 33,839 31,758
Operating expenditure 45,510 43,942 39,034 35,693 33,552
Net operating balance 517 644 251 1,647 1,334
Net lending (2,254) (2,194) (1,184) 637 (257)
Cash 0
Operating revenue 45,764 45,154 39,222 37,965 34,942
Operating expenditure 42,867 41,951 37,241 33,923 32,178
Operating balance 2,896 3,203 1,981 4,042 2,764
Capital spending 4,886 4,661 3,147 2,709 2,812
Net capital receipts 184 187 268 177 226
Cash surplus (deficit) (1,806) (1,271) (898) 1,510 178
KEY FINANCIAL RATIOS
Operating revenue growth 3.2 13.5 5.2 7.0 9.1
Operating expenditure growth 3.6 12.6 9.4 6.4 7.7
Cash operating balance/cash receipts 6.3 7.1 5.0 10.6 7.9
Accrual operating balance/op. revenue 1.1 1.4 0.6 4.4 3.8
Net interest expense/ operating revenue 1.2 1.1 0.7 0 0.1
Gross Interest Expense/operating revenue 2.0 1.7 1.5 1.2 1.2
Net lending/operating revenue (4.9) (4.9) (3.0) 1.7 (0.7)
Cash Surplus (Deficit)/receipts (3.9) (2.8) (2.3) 4.0 0.5
Capital expenditure/total payments 10.2 10.0 7.8 7.4 8.0
As at June 30
Financial assets 6,035 5,850 5,397 5,297 5,076
Gross debt 18,162 14,092 10,957 8,173 7,789
Unfunded superannuation 22,780 22,534 20,672 12,927 9,900
Other financial liabilities 4,520 4,358 4,277 3,973 4,379
Net debt 12,126 8,242 5,561 2,876 2,713
Net financial liabilities 34,907 30,776 26,233 15,803 12,613
KEY LIABILITY RATIOS
Gross debt/operating revenue 39.5 31.6 27.9 21.9 22.3
Net debt/operating revenue 26.3 18.5 14.2 7.7 7.8
Net financial liabilities/operating revenue 75.8 69.0 66.8 42.3 36.2
Table 5
Summary Of Published Rating Factor Scores*
Institutional framework Predictable and supportive
Financial management Very positive
Liquidity Very positive
Indicative credit level AAA/AA+
Overriding factors Nil
Standard & Poors | RatingsDirect on the Global Credit Portal | November 14, 2011 12
913637 | 300750493
Victoria (State of)
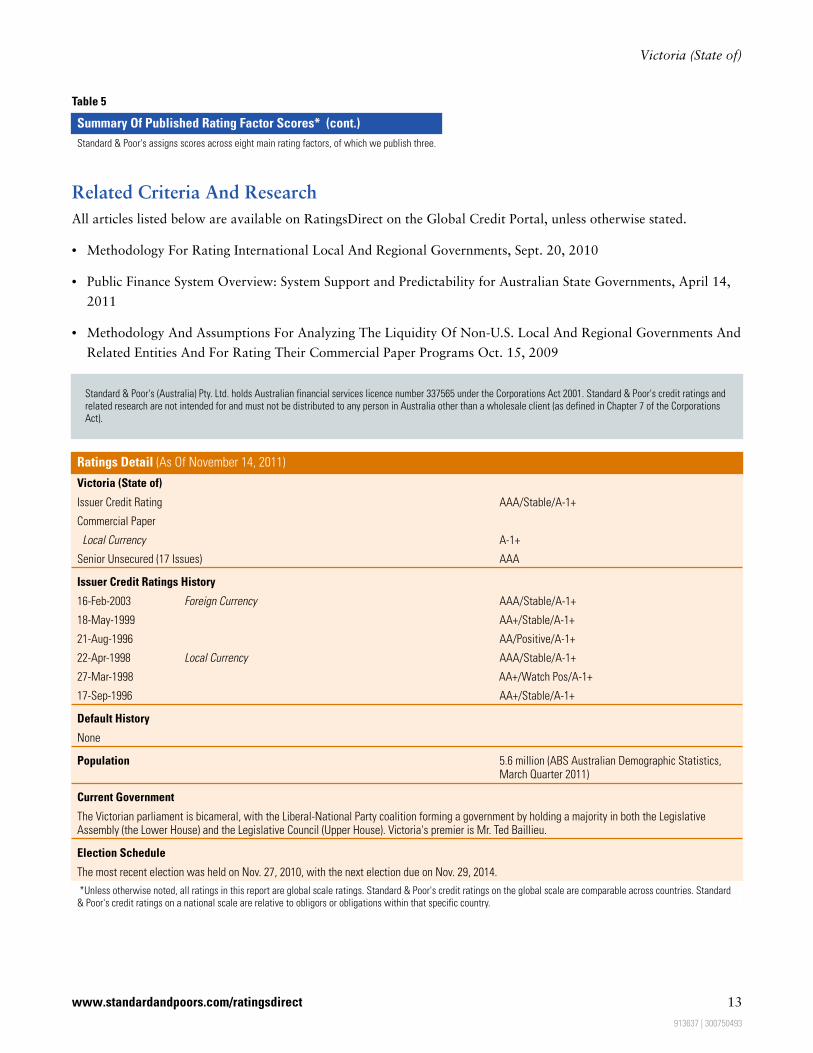
Table 5
Summary Of Published Rating Factor Scores* (cont.)
Standard & Poor's assigns scores across eight main rating factors, of which we publish three.
Related Criteria And Research
All articles listed below are available on RatingsDirect on the Global Credit Portal, unless otherwise stated.
• Methodology For Rating International Local And Regional Governments, Sept. 20, 2010
• Public Finance System Overview: System Support and Predictability for Australian State Governments, April 14,
2011
• Methodology And Assumptions For Analyzing The Liquidity Of Non-U.S. Local And Regional Governments And
Related Entities And For Rating Their Commercial Paper Programs Oct. 15, 2009
Standard & Poor's (Australia) Pty. Ltd. holds Australian financial services licence number 337565 under the Corporations Act 2001. Standard & Poor's credit ratings and
related research are not intended for and must not be distributed to any person in Australia other than a wholesale client (as defined in Chapter 7 of the Corporations
Act).
Ratings Detail (As Of November 14, 2011)
Victoria (State of)
Issuer Credit Rating AAA/Stable/A-1+
Commercial Paper
Local Currency A-1+
Senior Unsecured (17 Issues) AAA
Issuer Credit Ratings History
16-Feb-2003 Foreign Currency AAA/Stable/A-1+
18-May-1999 AA+/Stable/A-1+
21-Aug-1996 AA/Positive/A-1+
22-Apr-1998 Local Currency AAA/Stable/A-1+
27-Mar-1998 AA+/Watch Pos/A-1+
17-Sep-1996 AA+/Stable/A-1+
Default History
None
Population 5.6 million (ABS Australian Demographic Statistics,March Quarter 2011)
Current Government
The Victorian parliament is bicameral, with the Liberal-National Party coalition forming a government by holding a majority in both the LegislativeAssembly (the Lower House) and the Legislative Council (Upper House). Victoria's premier is Mr. Ted Baillieu.
Election Schedule
The most recent election was held on Nov. 27, 2010, with the next election due on Nov. 29, 2014.
*Unless otherwise noted, all ratings in this report are global scale ratings. Standard & Poor's credit ratings on the global scale are comparable across countries. Standard
& Poor's credit ratings on a national scale are relative to obligors or obligations within that specific country.
www.standardandpoors.com/ratingsdirect 13
913637 | 300750493
Victoria (State of)
S&P may receive compensation for its ratings and certain credit-related analyses, normally from issuers or underwriters of securities or from obligors. S&P reserves the rightto disseminate its opinions and analyses. S&P's public ratings and analyses are made available on its Web sites, www.standardandpoors.com (free of charge), andwww.ratingsdirect.com and www.globalcreditportal.com (subscription), and may be distributed through other means, including via S&P publications and third-partyredistributors. Additional information about our ratings fees is available at www.standardandpoors.com/usratingsfees.
S&P keeps certain activities of its business units separate from each other in order to preserve the independence and objectivity of their respective activities. As a result,certain business units of S&P may have information that is not available to other S&P business units. S&P has established policies and procedures to maintain theconfidentiality of certain non-public information received in connection with each analytical process.
Credit-related analyses, including ratings, and statements in the Content are statements of opinion as of the date they are expressed and not statements of fact orrecommendations to purchase, hold, or sell any securities or to make any investment decisions. S&P assumes no obligation to update the Content following publication in anyform or format. The Content should not be relied on and is not a substitute for the skill, judgment and experience of the user, its management, employees, advisors and/orclients when making investment and other business decisions. S&P's opinions and analyses do not address the suitability of any security. S&P does not act as a fiduciary oran investment advisor. While S&P has obtained information from sources it believes to be reliable, S&P does not perform an audit and undertakes no duty of due diligence orindependent verification of any information it receives.
No content (including ratings, credit-related analyses and data, model, software or other application or output therefrom) or any part thereof (Content) may be modified,reverse engineered, reproduced or distributed in any form by any means, or stored in a database or retrieval system, without the prior written permission of S&P. The Contentshall not be used for any unlawful or unauthorized purposes. S&P, its affiliates, and any third-party providers, as well as their directors, officers, shareholders, employees oragents (collectively S&P Parties) do not guarantee the accuracy, completeness, timeliness or availability of the Content. S&P Parties are not responsible for any errors oromissions, regardless of the cause, for the results obtained from the use of the Content, or for the security or maintenance of any data input by the user. The Content isprovided on an "as is" basis. S&P PARTIES DISCLAIM ANY AND ALL EXPRESS OR IMPLIED WARRANTIES, INCLUDING, BUT NOT LIMITED TO, ANY WARRANTIES OFMERCHANTABILITY OR FITNESS FOR A PARTICULAR PURPOSE OR USE, FREEDOM FROM BUGS, SOFTWARE ERRORS OR DEFECTS, THAT THE CONTENT'S FUNCTIONINGWILL BE UNINTERRUPTED OR THAT THE CONTENT WILL OPERATE WITH ANY SOFTWARE OR HARDWARE CONFIGURATION. In no event shall S&P Parties be liable to anyparty for any direct, indirect, incidental, exemplary, compensatory, punitive, special or consequential damages, costs, expenses, legal fees, or losses (including, withoutlimitation, lost income or lost profits and opportunity costs) in connection with any use of the Content even if advised of the possibility of such damages.
Copyright © 2011 by Standard & Poors Financial Services LLC (S&P), a subsidiary of The McGraw-Hill Companies, Inc. All rights reserved.
Standard & Poors | RatingsDirect on the Global Credit Portal | November 14, 2011 14
913637 | 300750493