video advertisement mining for predicting revenue using
TRANSCRIPT

Purdue UniversityPurdue e-Pubs
Open Access Theses Theses and Dissertations
Spring 2015
Video advertisement mining for predicting revenueusing random forestYuan Hsin HuangPurdue University
Follow this and additional works at: https://docs.lib.purdue.edu/open_access_theses
Part of the Business Administration, Management, and Operations Commons, ComputerSciences Commons, and the Management Information Systems Commons
This document has been made available through Purdue e-Pubs, a service of the Purdue University Libraries. Please contact [email protected] foradditional information.
Recommended CitationHuang, Yuan Hsin, "Video advertisement mining for predicting revenue using random forest" (2015). Open Access Theses. 499.https://docs.lib.purdue.edu/open_access_theses/499

Graduate School Form 30
Updated 1/15/2015
PURDUE UNIVERSITY
GRADUATE SCHOOL
Thesis/Dissertation Acceptance
This is to certify that the thesis/dissertation prepared
By Yuan Hsin Huang
Entitled
VIDEO ADVERTISEMENT MINING FOR PREDICTING REVENUE USING RANDOM FOREST
For the degree of Master of Science
Is approved by the final examining committee:
John A. Springer
Chair
Julia M. Taylor
Eric T. Matson
To the best of my knowledge and as understood by the student in the Thesis/Dissertation
Agreement, Publication Delay, and Certification Disclaimer (Graduate School Form 32),
this thesis/dissertation adheres to the provisions of Purdue University’s “Policy of
Integrity in Research” and the use of copyright material.
Approved by Major Professor(s): John A. Springer
Approved by:
Jeffrey Lynn Whitten 4/22/2015
Head of the Departmental Graduate Program Date


VIDEO ADVERTISEMENT MINING FOR PREDICTING REVENUE
USING RANDOM FOREST
A Thesis
Submitted to the Faculty
of
Purdue University
by
Yuan Hsin Huang
In Partial Fulfillment of the
Requirements for the Degree
of
Master of Science
May 2015
Purdue University
West Lafayette, Indiana
ii
This work is devoted to my husband Wei-Chung Hsu, my family members Chung-Tong
Huang, Shu-Yu Su, Yu-Chen Huang, Hung-Rai Huang, my lovely grandmother, and my
best friend Yin-Yu Huang.
All their loves and supports prompt me to persist what I always pursued for.
Hope Grandmother and Yin-Yu also feel proud and happy for me in Heaven.

iii
ACKNOWLEDGEMENTS
I would like to express deepest appreciation to my major professor John. A.
Springer, who offered me the first opportunity to open the eyesight of data warehousing
and data science domain in America. Without his fully trust and supports, I cannot work
on my enthusiastic topics with full freedom. Special thanks goes to Dr. Matson and Dr.
Taylor, who guided my research and participated in my final defense committee.
I am also thankful to my prior major professor- Ying-Chin Ho in Taiwan, who is
not a mentor but also a good friend for me. His inspiration and experience-sharing always
help me recover from the frustrations. I am very proud that I was his student and also the
alumnus of Purdue University same as he.
Moreover, I take this opportunity to express my sincere gratitude toward my
supervisor- Michelle. K.Y. Chen, colleagues Douglas Huang and Landy Kan in Avon
Cosmetics (Taiwan) Ltd. Michelle is a very optimistic person, who works hard and
guided me to the marketing area. Her successful paradigm always encourages me to work
like her. Douglas was my mentor who firstly taught me the knowledge of forecasting
methods and started my first step of data science. Even after leaving Avon Cosmetics
(Taiwan) Ltd. many years, all the kind people who were still willing to recommend me to
attend the Purdue University, made me feel deeply moved, especially Landy’s great
efforts.
Furthermore, many thanks to my supervisors- Stephanie Wu and Michelle Chao in
Taiwan Mobile Co. Ltd in Taiwan as well. Stephanie and Michelle provided me the first
chance to enter the cloud relevant industry and played the critical role in my career path.
They will never know their fully supports and encouragements are how meaningful to me

iv
when I started my road in America. Words cannot express my deep thanks to them,
especially Stephanie.
Finally, my husband Wei-Chung Hsu was the reason I started my new life in
America and his big supports are the always strength why I can insist on my goal. Many
thanks to my parents, elder sister and younger brother. They were always there cheering
me up and stood by me through the good times and bad. I would also like to appreciate
and cherish the memory of my grandmother and my best friend Yin-Yu Huang. Although
both they left me during the time I went to America, I will always miss both their smiles
and confidence in my insistence forever.

v
TABLE OF CONTENTS
Page
LIST OF TABLES ........................................................................................................... vii
LIST OF FIGURES ........................................................................................................ viii
LIST OF ABBREVIATIONS ........................................................................................... ix
GLOSSARY ........................................................................................................................x
ABSTRACT ...................................................................................................................... xii
CHAPTER 1. INTRODUCTION ................................................................................1
1.1 Scope .....................................................................................................................2
1.2 Significance...........................................................................................................3
1.3 Research Questions ...............................................................................................4
1.4 Assumptions ..........................................................................................................5
1.5 Limitations ............................................................................................................6
1.6 Delimitations .........................................................................................................6
1.7 Summary ...............................................................................................................7
CHAPTER 2. LITERATURE REVIEW .....................................................................8
2.1 Interactive Advertisement .....................................................................................9
2.1.1 Advertisement Involvement ........................................................................10
2.1.2 Advertisement Evaluation ..........................................................................10
2.2 Video Mining ......................................................................................................11
2.3 Two Step Clustering Analysis ............................................................................13
2.4 Sentiment Analysis .............................................................................................14
2.5 Random Forest ....................................................................................................18
2.6 Summary .............................................................................................................20
CHAPTER 3. FRAMEWORK AND METHODOLOGY.........................................21
3.1 Research Hypothesis ...........................................................................................21

vi
Page
3.2 Data Collection .....................................................................................................22
3.2.1 Raw Data Extraction ...................................................................................22
3.2.2 Threads to Validity .....................................................................................23
3.3 Data Transformation for Variables .....................................................................24
3.3.1 The Cluster Number of Viewer Segmentation .............................................24
3.3.2 Sentiment Analysis ......................................................................................27
3.3.2.1 Lexical Syntactical Pattern Generator ...............................................27
3.3.2.2 The Conversion of Two Predictors ....................................................29
3.4 Modeling Procedure ............................................................................................30
3.5 Summary .............................................................................................................32
CHAPTER 4. RESULTS ...........................................................................................33
4.1 Introduction .........................................................................................................33
4.2 Data Summary ....................................................................................................33
4.3 Two Step Clustering Analysis for Viewer Segmentation ...................................34
4.4 Sentiment Analysis .............................................................................................36
4.5 Random Forest Model.........................................................................................46
4.5.1 The Out-of-Bag Error Estimate .................................................................47
4.5.2 The Evaluation of Variable Importance ......................................................49
4.5.3 Proximity Measure ......................................................................................51
4.5.4 Receiver Operating Characteristic Curve ...................................................53
CHAPTER 5. CONCLUSIONS AND RECOMMENDATIONS .............................54
5.1 Discussion ...........................................................................................................54
5.2 Conclusions .........................................................................................................56
5.3 Recommendations ...............................................................................................57
LIST OF REFERENCES ...................................................................................................60

vii
LIST OF TABLES
Table Page
4.1 Summary of Data Collection ...................................................................................... 34
4.2 Distribution of Sentiment Data ................................................................................... 37
4.3 Summary of Feature Tag ............................................................................................. 37
4.4 Summary of Positive Sentiment ................................................................................. 40
4.5 Summary of Negative Sentiment ................................................................................ 40
4.6 Confusion Matrix of Response Variable ..................................................................... 47
4.7 OOB Error Rate in Different Tree Size ....................................................................... 48
4.8 Summary of Variable Importance ............................................................................... 51

viii
LIST OF FIGURES
Figure ............................................................................................................................. Page
3.1 Lexical Syntactic Pattern Generator ......................................................................... 29
4.1 Sihouette Measure of Cohesion and Separation ....................................................... 36
4.2 Cross-Validation for the Feature Classification (K=6) ............................................. 38
4.3 Test Set for the Examination of Classification Effect ............................................... 39
4.4 Cross-Validation for the Positivity in Positive Sentiment (K=6).............................. 40
4.5 Test Set for the Examination of Positivity Classification. ........................................ 41
4.6 Cross-Validation for the Negativity in Negation (K=6) ........................................... 42
4.7 Test Set for the Examination of Negativity Classification ....................................... 42
4.8 Effect of Different Negativity in Negation ............................................................... 43
4.9 Comparison between Logical Negation and Negative Tags ..................................... 43
4.10 Distinction between Neutral Tags and Positive Tags ................................................ 44
4.11 Distinction between Neutral Tags and Negative Tags .............................................. 45
4.12 Distribution for Degree of Polarity(49 videos). ........................................................ 46
4.13 OOB Error Rate in Different Tree Size..................................................................... 48
4.14 Mean Decrease of Gini impurity index ..................................................................... 49
4.15 Mean Decrease of Accuracy ..................................................................................... 50
4.16 Measure of Similarity ............................................................................................... 52
4.17 ROC Curve for Random Forest Model ..................................................................... 53

ix
LIST OF ABBREVIATIONS
Several terms are required to define within this document. The definition of those
terms are indicated as below:
API Application Programming Interface
CART Classification and Regression Tree
JJ Adjective
LSP Lexical Syntactic Pattern
NN Noun
NP Noun Phrase
OOB Out of Bag Error
ORF Offline Random Forest
POS Part Of Speech
RFM Recency, Frequency, Monetary Value
ROC Receiver Operating Characteristic Curve
ROLEX-SP classifier Rules of Lexical Syntactic Patterns
UGC User Generated Content
VB Verb
WOM Word Of Mouth

x
GLOSSARY
Several terms are required definition as follows:
API: Application program interface is a group of routines for creating software
applications that indicates how software components should interact and are
utilizing when programming graphical user interface components.
Bagging: This method is also called Bootstrap Aggregation. It is an ensemble
machine learning algorithm that creates bootstrap samples of a training set using
sampling with replacement. Its classification is accomplished by plurality voting.
CART: Classification and regression trees are machine learning methods for
constructing forecasting models showed as decision trees which are achieved by
recursively partitioning the data space and fitting a simple prediction model
within each partition.
Confusion Matrix: A table visualizes the performance of a machine learning
algorithm. Each column of the matrix stands for the instances in a predicted class,
while each row indicates the instances in an actual class. Through the comparison,
it is clear whether two classes are confused or not.
Logical Negation: A preposition role in reversing the meaning of opinions.
Mean Decrease Accuracy: It is determined by the normalized difference of the
classification accuracy for the out-of-bag data, which was randomly permuted.
The bootstrap iterations of Mean Decrease Accuracy make its estimate unduly
optimistic.
Mean Decrease Gini: A measure of variable relevance to the classification
dependent on the Gini impurity index, averaging the sum of overall weighted
impurity decreases for all trees in the forest.

xi
Out-of-Bag Error Rate: It indicates the estimate of generalization error, averaging
all the internal errors of forests. It had a similar multiple training process of leave-
one-out cross-validation without additional computational workload.
Proximity Measure: An anomaly detection method that adopts proximities
between pairs of classes to investigate the similarity between individuals and
identifies the outliers.
Random Forest: A schema for building a classification ensemble with a set of
decision trees grows in the different bootstrapped aggregation of the training set
on the basis of CART (Classification and Regression Tree) and the Bagging
techniques.
Receiver Operating Characteristic Curve: It is constructed to diagnose the
accuracy of the model. The region under the ROC curve referred to the percentage
of randomly determining which is true on the basis of the uninformative test; the
greater area represents the better test.
ROLEX-SP Classifier: Rules of Lexical Syntactic Patterns is an approach for
automatic induction of rules to build text classifiers that depends on lexical
syntactic patterns as a set of features to classify text documents.
Sentiment Analysis: Opinion mining is the domain of the computational study that
analyzes people’s opinions, sentiments and emotions expressed in the text.

xii
ABSTRACT
Yuan-Hsin, Huang. M.S., Purdue University, May 2015. Video Advertisement Mining
for Predicting Revenue Using Random Forest. Major Professor: John A. Springer.
Shaken by the threat of financial crisis in 2008, industries began to work on the topic of
predictive analytics to efficiently control inventory levels and minimize revenue risks. In
this third-generation age of web-connected data, organizations emphasized the
importance of data science and leveraged the data mining techniques for gaining a
competitive edge. Consider the features of Web 3.0, where semantic-oriented interaction
between humans and computers can offer a tailored service or product to meet
consumers’ needs by means of learning their preferences. In this study, we concentrate on
the area of marketing science to demonstrate the correlation between TV commercial
advertisements and sales achievement. Through different data mining and machine-
learning methods, this research will come up with one concrete and complete predictive
framework to clarify the effects of word of mouth by using open data sources from
YouTube. The uniqueness of this predictive model is that we adopt the sentiment analysis
as one of our predictors. This research offers a preliminary study on unstructured
marketing data for further business use.

1
CHAPTER 1. INTRODUCTION
With the maturity of social media websites, the resulting word of mouth effects
(WOM) have already deeply impacted not only an individual’s psychological state but
also an organization’s performance. Thus, a large amount of contextual data is
increasingly arising without a concrete and complete adoption in marketing science.
Essentially, from the perspective of marketing strategy, companies have begun to shift
their emphasis from merely managing product line mixes to optimizing customer lifetime
value. In other words, the prior focus on suitable product line management to maximize
per concept contribution has evolved into developing diverse customer-oriented plans to
strengthen and further expand their market share. TV commercial advertisements are the
typical communication platform to deliver brand value and introduce new products to
consumers.
Moreover, as a vast number of viewers increasingly shift to digital media to watch
videos online, the radical changes of target audience behaviors caused by the rapid
development of the social media ecosystem will offer not only a suitable platform to
study viewer data but also paint a comprehensive picture of the pool involved in social
media. Therefore, all the contextual sentiments derived from real customers’ feedback
and related quantitative variables- such as the amount of feedback evaluation- can be
integrated into one forecasting model to generate corresponding trustworthy sales
prediction by a random forest algorithm. Through the split among a random subset of the

2
predictors, this forecasting mechanism provides an estimate of what predictors are
important in the classification when generating an internal unbiased estimate of the
generalization error as the forest building progresses—rather than directly deleting the
predictors.
1.1 Scope
Aimed at TV commercial advertisements put on YouTube by official company
owners, the proposed study will explore one specific consumer product: Coca-Cola.
Regarding the two advertisement types, one is brand advertising for delivering brand
value and the other is product advertising for the new product launch. This research will
explore both types of advertisement. Based on the time period of 2009 to 2014 and
limited to the North America region, the search space for this study will focus on
quarterly advertisements and their corresponding sales data from official earnings release
reports.
The main reason why this research focused on the TV commercial advertisements
created by the Coca-Cola Company is its excellent reputation for advertising and
marketing manipulation. Generally speaking, the earnings report always consists of all
brands of product lines; thus, the performance evaluation for one single brand is very
hard to specify. Undoubtedly, the product portfolio belonging to the Coca-Cola brands is
more purely representative of the sales achievement. Apart from Coca-Cola's consistent
40% plus market share in the U.S.-its related product lines account for a significant
portion of total net operating revenue between all brands of the Coca-Cola Company.
Therefore, this case study focuses on the TV commercial advertisements from all Coca-
Cola Company’s accounts on YouTube to proceed with relevant video mining.

3
In terms of the model’s predictors, the textual comments in English left on TV
commercial advertisements on YouTube will be defined as one of the key factors for
building up the forecasting system. The subscribed channels from users who left opinions
can be used to categorize user preferences and can be also deemed as one influential
factor to integrate with their social shares for further viewer segmentation. Moreover, the
related numerical indices covering viewer traffic and video evaluation, e.g., number of
likes and dislikes and length of video, will be elaborated in this proposed forecasting
model.
After conducting the processes of data collection and features classification, the
implementation of this predictive schema is to adopt random forest as the ensemble
learning approach. This is in order to simulate the possible association between video
advertisements and corresponding quarterly net operating revenue.
1.2 Significance
Generally speaking, pre-campaign sales prediction through early orders is an
extremely important component for both marketing and supply chain teams to achieve
their key performance indexes. This prediction mechanism can be regarded as a warning
signal for detecting and preventing any further revenue risk. However, there are still
several restrictions on this pre-campaign forecasting. Firstly, this predictive model is
dependent on the volume of early orders. For example, a short campaign decreases the
number of early orders, which will lead to an inaccurate estimation. Moreover, there is
limited time to create corresponding plans. Hence, this method always causes either a
heavy workload for team members or unsurprisingly poor performance due to lack of
flexibility.

4
Additionally, TV commercial and video advertisements always account for a
heavy portion of the marketing budget, even only for the promotion of key products or
the intent of brand awareness. Compared with other types of advertisements, video
advertisements can easily employ word-of-mouth effects and leave further impressions
on a consumer’s mind. Nevertheless, traditional approaches for assessing the
performance of video advertisements cannot effectively link the causal relationship
between customer perception and sales.
Thus, from the perspective of organizational performance, the accuracy of sales
prediction through the proposed advertisement mining will offer more flexible space and
time to adjust marketing plans. Before early-order pre-forecasting for campaigns, this
prediction method can strengthen risk control of both inventory and sales. Furthermore,
one can obtain critical successful rules for advertisement design and marketing plan.
Another advantage is to infer if the heavy budget allocation on advertisements is
appropriate or if any other improvement is needed.
1.3 Research Questions
From the perspective of marketing science, the main research questions of this
study were:
1. How can advertisement mining be leveraged to assist in sales prediction?
2. How can marketers take advantage of user preferences and their socially
influential powers to categorize viewer segmentation? What are the main clusters
of preferences for viewers who watched Coca-Cola advertisements on YouTube?
3. Do the predictors related with traffic concept have a significant impact on sales
performance?

5
4. How can one efficiently classify sentiment to improve ROLEX-SP performance?
5. What is the predictive effect of sentiment analysis, including the feature-scoring
and degree of polarity?
1.4 Assumptions
Subsequent research was dependent on the following assumptions:
The coverage of advertisements adopted in this paper can be considered as typical
of advertisement types produced by the Coca-Cola Company.
The comments on a TV commercial advertisement were voluntarily left by active
YouTube users, and they can be regarded as general viewpoints that are
representative of the target audience.
The subscribed-to channels or videos of these YouTube who left comments on a
TV commercial advertisement can be utilized to categorize their preferences.
The highest frequency of channel subscriptions can be taken for granted as a
viewer’s major preference.
The preferences of viewers who never subscribed to any channels, can be
disregarded; instead, those preferences can be simulated by others who have
complete subscription data for the same video.
The possibility of external economic factors that influenced quarterly revenue has
been excluded in this study. This study only focused on the cause and effect
between an advertisement and, accordingly, the quarterly report of earnings.

6
1.5 Limitations
This research was restricted by the following boundaries:
The collection of sentiment was only derived from the official communities
created by the Coca-Cola Company, which included the following user accounts:
Coca-Cola, Coca-Cola Light, Coca-Cola Zero and CocaColaCo.
The quantity of sentiment for further classification in each video did not exist at
the same scale; it was limited by the maximum number of comments we can
extract.
We cannot acquire exact revenues generated from the relevant advertisement;
therefore, only the official earning release can be simulated as the reasonable
outcome variable in this study.
1.6 Delimitations
The admitted delimitations for this research were as follows:
The scope was limited to Coca-Cola brands (Coca-Cola, Coca-Cola Zero, Diet
Coke) and two types of advertisements (product advertisements and brand
advertisements). Other types were not taken into consideration in this study.
This study only concentrated on the integration of sentiment analysis, user
preference and associated quantitative variables—including the length of video,
feedback evaluation and viewer counts—to build up a random forest without
considering any other possible predictors.

7
1.7 Summary
This chapter explained why this was an imperative research topic and what the
research expected to demonstrate from the specific experimental design. In addition, this
section also pointed out a list of assumptions, limitations and delimitations to specify the
studying scope. The next chapter presented a brief summary of relevant literature
covering advertisement evaluation, the practice of video mining, the characteristic and
application of two step clustering method, the classification of sentiment analysis, the
principle of the random forest-learning algorithm.

8
CHAPTER 2. LITERATURE REVIEW
Researchers persistently pursue ways to leverage the effective analytical models
on predicting future possible scenarios. Due to the ever-increasing surge of accessible
textual information in all types of web documents nowadays, researchers can
aggressively decipher the mining rule of unstructured data. They adopt statistical natural
language processing methods and machine learning algorithms to develop extensive
unsupervised applications such as the forecasting mechanism (Manning & Schütze, 2002).
Accordingly, scholars can utilize a hybrid recommender engine based on mixed data-
mining techniques to elaborate a predictive support system.
The main focus of this study is to build up a sound sales forecasting module by
integrating a sentiment-oriented video advertisement analysis based on the modified
ROLEX-SP classifier (Rules of Lexical Syntactic Patterns) and the clusters of viewer
segmentation. Consequently, this literature review serves as a guideline to provide a
broad, holistic coverage and summation of specific data-mining domains for the purposes
of future research.
The opening section presents an overview of advertisement effects involving the
impact by the emergence of interactive advertisement. The levels of audience
involvement in the advertisement are subsequently mentioned, and we will further
discuss the evolutionary methods of advertisement evaluation. The next part stresses the
research results from recent studies of video-mining, and summarizes the contributions to

9
media exploration. Moreover, the third section accounts for the principle and application
of a two-step clustering algorithm and illustrates the practicality with related hybrid
design from historical studies. Then, the fourth section outlines current approaches of
semantic classification and derives the utilization of sentiment analysis. Finally, the
random forest method, applied to bridge content-based predictors with sales generation,
is explained in detail. Along with the clear description of the principal algorithm, several
predictive mechanisms relying on the random forest approach are demonstrated.
2.1 Interactive Advertisement
With gaining widespread popularity of adopting web 2.0 nowadays, the video
sharing Websites can represent as one of the typically online UGC (user generated
content) paradigms. They permit the audience to upload, share, distribute or store video
content on the internet and simultaneously comment on the content posted by the peers.
In recent years, most video sharing services are regarded as an optimal interactive
platform to embed in advertisement mechanism including banner ads and mid-roll video
ads (Saito & Murayama, 2010). The most representative website, YouTube, makes users
stream their video content, and over 6 billion hours of video are watched each month
(YouTube Statistics, 2014). In addition, the incredible scalability of website traffic, more
than 1 billion unique users visiting YouTube each month, witnesses the prosperity of
interactive video-sharing platform. According to the study of Fen and Florian (2014),
four variables "Search", "Category", "Best Rating" and "Popular" can be granted as the
key indicators to perform the data mining prototype on YouTube. Therefore, this study
will adopt the most active interactive video-sharing platform YouTube to examine the

10
relationship between contextual feedback on commercial TV advertisement and
corresponding financial performance by means of comprehensive mining techniques.
2.1.1 Advertisement Involvement
The value delivery of advertisement has great influence on the achievement of
sales target. Generally speaking, the concept of involvement plays an imperative role in
the field of consumer behavior and closely relates with variations in marketing
performance. In the light of audience involvement in advertising, references show that
individuals under high advertising involvement would generate more message attention
and further perform a brand evaluation (Laczniak, Muehling & Grossbart, 1989). Based
on this assumption, more belief strength and attitude towards ads would be elicited as
well (Laczniak & Muehling, 1993). Andrews, Durvasula and Akhter (1990) identified
that a consumer under high advertising involvement has more search and shopping
behavior and more complexity of decision-making. Additionally, he needs more time to
examine alternatives and easily perceived product attribute differences. Even though low-
involved consumers might not show much impact of advertising communications on
beliefs, they might be induced more easily than highly involved consumers to try a new
product or brand (Robertson, 1976). Accordingly, comments left behind and embedded
on interactive video sharing platform-YouTube can be deemed a kind of advertising
involvement. Regardless of the level of viewer involvement in advertising, the sentiment
mining undoubtedly offers a pretest of subsequent revenue generation.
2.1.2 Advertisement Evaluation
Researchers came up with many theories to execute the evaluation of advertising
effectiveness; in other words, to verify whether an advertisement campaign achieved

11
prospective effects through evaluating the process after the implementation of activities.
From the perspective of psychology research, Lewis (1989) put forward the influential
advertising psychological model of AIDA. It demonstrated the effectiveness of an
advertising activity by measuring whether or to what extent can the advertising cause the
consumers’ attention, arousing their interest, stimulating their desire, and changing their
action. Colley (1961) defined advertising goals for measured advertising results that
mainly represented the audience’s psychological change before and after the advertising
campaign intuitively, unknown - known - understand - be convinced - action. In other
words, the role of emotional factors in decision-making was extremely emphasized in this
model. Furthermore, Lang (1980) explored the relationships with attitude, cognitive,
brand interest, purchase intention, and finally formed the evaluation system based on joy
attention value - influence. With respect to the evaluation structure of AC Nielsen,
through a simulated environment of advertisements, it conducted an emulation test to
examine four aspects of advertisement: appetency, persuasion, infectivity and
communication effect. To summarize, most evaluation structures concerned with
consumer’s psychological process don’t take the role of consumer’s initiative demand
and response into consideration. In this study, more emphasis will be concentrated on
transforming advertisement effectiveness into real sales report. Through analyzing lexical
messages left by viewers to consider their psychological cognition, the researcher will
assess the numerical value generated from TV advertisement.
2.2 Video Mining
With the widespread adoption of video sharing websites, scholars transfer their
attention to digital videos mining. The video can be defined as one kind of content-based

12
multimedia data which is typically analyzed from the viewpoint of specific video
semantic annotation- text, audio and visual information. Zhang (2012) proposed one
efficient video mining schema that combined object recognition, continuous speech
recognition and video caption text recognition. He applied the dense sub graph finding
approach to explore the semantic relationship between two neighboring words that only
reserved the noun and verb words.
Additionally, in terms of feature-based video mining approach, it can be
categorized as video clustering mining, video classification mining and video association
mining. The video clustering mining leverages the clustering algorithms such as k-means
method on organizing the videos based on their homogeneous feature objects (Latecki &
Wild, 2002). As for the video classification mining, it emphasized to dig out the implicit
patterns among video objects like the semantic descriptions. In practice, Saravanan and
Srinivasan (2010) also focused on the attribute extraction- fields of image processing,
segmentation, edge detection, pattern recognition to design one efficient video frame-
based retrieval system. After grouping all the extracted features from videos, this
structured data can be examined if there exists any associated patterns by the association
rule (Xie & Chang et al., 2003). Apart from using low-level features with little meanings
for naïve users, researchers (Zhu, Wu, A.K. & Wu, 2005) designed a knowledge-
based video indexing and content management framework for sports domain
specific videos. They took advantage of multilevel sequential association rule to explore
the relationship between the audio and visual cues.
In terms of the interactive characteristic of videos, majority of the studies
concentrate on analyzing the components of the video itself rather than the subjective

13
facts provided from the viewers. However, the audience is the most significant key to
determine the influential effect of the videos. Hence, instead of studying the video’s
elements, the true experience of viewers is the main focus of this study, involving the
classification of viewers’ preference and their attitudes toward this video.
2.3 Two Step Clustering Analysis
Customer segmentation is the primary marketing emphasis for effectively
positioning the right role of portfolio strategies. Consider the scalability and complexity
of data, researchers (Chiu, Fang, Chen, Wang & Jeris, 2001) demonstrated the design of
two step clustering algorithm that performed well for mixed type attributes in large
database environment. The fundamental procedures of this two-stage approach is to
execute a pre-clustering step by the decrease in log-likelihood distance measure at first
and then conduct a modified hierarchical agglomerative clustering algorithm to
categorize the dense regions sequentially into homogenous clusters (Mooi & Sarstedt,
2011). In general, the number of clusters is automatically assessed by calculating
measures of fit such as Akaike Information Criterion or Bayesian information criterion
(Schwarz, 1978).
Literatures showed many successful applications of the two stage clustering
method that contribute to the gain of competitive edge. In terms of customer
segmentation in one Pakistan mobile telecommunication company, researchers (Salar,
Moaz, Faryal, Ali, Aatif & Ahsan, 2013) adopted customers’ daily call and SMS usage as
well as revenue generation data, discretized via binning method, to do the classification
and uncover the usage behaviors.

14
Moreover, some scholars also took advantage of data mining technology to
develop the new type of two-step clustering approach. Namver, Gholamian & KhakAbi
(2010) leveraged RFM (Recency, Frequency, Monetary Value), demographic and
customer lifetime value data to construct one new customer segmentation model. The
mechanism they developed is to leverage k-means technique on the construction of
intelligent customer segmentation based on the two-phase clustering schema. This study
aimed at customer data in banking industry and grouped the existing customers according
to their shared transactional behavior and characteristics. Through the analysis, this
research help marketers establish better customer relationship management strategies,
reduce the churn and find the good opportunities for up and cross selling.
In practice, the two step clustering algorithm is not merely useful for marketing
use but also for the behavior prediction. The study of Higgs and Abbas (2013) revealed
that each driver showed a unique distribution of behavior, but some of the behaviors
existed in more than one driver but at different frequencies through the two-stage
clustering method. Regarding the adoption of this methodology in this research, it is
definitely necessary for the process of variable transformation. In this study, the number
of segmentation, categorized by users’ subjective preferences and their social influence-
total upload views and subscription counts, is examined by means of the two-step
clustering algorithm, proposed by Chiu et al. (2001).
2.4 Sentiment Analysis
Researchers started to study sentiments and opinions earlier (Das & Chen, 2001;
Morinaga et al., 2002; Pang, Lee & Vaithyanathan, 2002; Tong, 2001; Turney, 2002;
Wiebe, 2000) than the term sentiment analysis first appeared in (Nasukawa & Yi, 2003).

15
Bing (2012) elucidated that sentiment analysis, also called opinion mining, is the domain
of the computational study that analyzes people’s opinions, sentiments and emotions
expressed in the text. With the explosive growth of social media, individuals and
organizations are increasingly using the content in these media for decision making.
Therefore, many studies attempt to dig out the potential for a number of applications, for
example: Xujuan, Xiaohui and Jianming (2013) proposed a Tweets Sentiment Analysis
Model to spot the societal interest and general people’s opinions in regard to a social
event. They took Australian federal election 2010 event as an example of sentiment
analysis experiments to demonstrate the effectiveness of the system.
References show that sentiment classification is the significant focus to
extensively study (Pang & Lee, 2008), which organize user opinions and classify opinion
comments into positive, negative and neutral categories by means of scaling system.
Essentially, the general classification methods can be fallen into two categories,
semantic-based and learning-based. Hatzivassiloglou and Wiebe used four different
levels to do sentiment analysis including word level, phrase level, sentence level, and
document level (2000). Therefore, in terms of semantic-oriented classification, the
sentiment dictionary or a large-scale knowledge database (Hugo, Henry & Ted, 2003)
helps to organize sentiments to assign to individual documents (Tetsuya & Jeonghee,
2003; Pero & Alison, 2001). Three representative methods are correspondingly generated
to establish it including manual construction (Das & Chen, 2001), semi-automatic
construction (Hu & Liu, 2004) and automatic construction (Kamps & Marx, 2002).
Through the bag-of-words approach, Turney (2002) regarded a document as a
mere collection of words without considering the association between individual words

16
that is called term-counting approach. This method clarified all words’ sentiment and
then combined their value to judge the real meaning behind the overall sentiment with
aggregation functions. Besides, Bunescu (2003) was applied to classify positive and
negative sentiments for whether a sentence is subjective or objective. However, phrase
level categorization can’t effectively identify the true sentiment once multiple sentiments
within one sentence.
Aimed at developing the new classifier from different domains of knowledge, one
modified version of ROLEX-SP classifier (Rules of Lexical Syntactic Patterns) was
proposed by Mohammed and Samer (2014). In fact, it was very suitable to this social
networking generation. Essentially, the principle of ROLEX-SP is to construct the
specific textual classifier to enhance the possibility of accurate judgment for the semantic
classifier. Consequently, the modified framework has three layers to divide the data
collection into domain-specific collections and further assign the classification task. The
first homogeneous data layer minimizes ambiguity among heterogeneous data collected
from a specific domain of knowledge and simultaneously contributes to accurate retrieval
of relevant information. And the second layer offers the logic of classifying data to
transform the first layer data into the given domain. Lastly, the access layer at the top
controls semantic connections among different knowledge sources and facilitates
modularity. In this rule, multi-class classification feature assumes that some information
might be related to other knowledge database and good for better performance and less
ambiguity.
Nevertheless, semantic classification is too complicated to establish a systematic
database; accordingly researchers leveraged the machine-aided methods on getting better

17
performance for sentiment categorization. By means of machine learning approaches,
Pang and Lee (2004) redefined the semantic classification problem as a kind of statistical
classification task. Regarding learning-oriented approach, Barbosa and Feng (2010) did a
two-step automatic sentiment analysis for tweets classification. In case more labeling
effort in developing classifiers, a noisy training set was adopted, and tweets were grouped
into subjective and objective category. After that, subjective tweets are assigned to either
positive or negative group.
As a matter of fact, traditional learning techniques such as Naive Bayes,
Maximum Entropy and Support Vector Machines are typically applied to do opinion
classification. On the other hand, features of each comment can be simple words (Durant
& Smith, 2007), n-grams (Kushal, Lawrence and David, 2003), and syntactic relations
(Nasukawa, Bunescu & Niblack, 2003), which are used to define the semantic orientation.
Nirmala and Murali (2012) utilized SVM model to build up their discriminate function to
predict the hotspots based on sentiment analysis in online forums. Accuracy of this
polarity classification is low in sentiment analysis due to the dimension of feature space
is quite large in text classification tasks. In other words, the classification issue is quite
linearly separable and therefore linear kernel is commonly used (Theresa, Janyce & Paul,
2005). Wu and Ren (2011) generated an influence probability model to do the twitter
sentiment analysis. Any tweet beginning with @username is the retweet and mainly
correlated with influenced probability. Hence, the probability and association rule play
the imperative role in opinion classification that logic of syntax highly correlates with the
order of phrases.

18
2.5 Random Forest
Random Forest is a schema for building a classification ensemble with a set of
decision trees that grow in the different bootstrapped aggregation of the training set on
the basis of CART (Classification and Regression Tree) and the Bagging techniques
(Breiman, 2001). Instead of exploring the optimal split predictor among all controlled
variables, this learning algorithm determines the best parameter at each node in one
decision tree by randomly selecting a number of features. Unquestionably, this process
not only ensures the model scale well when each feature vector owns many features, but
also lessons the interdependence between the features. In other words, from the viewpoint
of Random Forest, the attributes with low correlation are less vulnerable to inherent noise
in the data (Criminisi, Shotton & Konukoglu, 2012). On the other hand, the diversity in
each tree effectively restrains the possibility of an overfitting issue. The classification
decision is yielded by averaging the mode of the class output by individual trees.
In view of Random Forest’s classification performance, Breiman (2001) regarded
the Out-of-Bag (OOB) error rate as a signal of how well a forest classifier works on the
data. The estimate of out-of-bag error rate can replace cross validation approach to
examine the explanation ratio of Random Forest model through the average of
misclassification results over all trees made from the bootstrap sample. Theoretically, the
classification strength of each individual tree and the correlation between trees affect the
error rate of the Random Forest classifier. Therefore, to increase selected features
improves both the correlation between the trees and the strength of each tree.
Compared with CART approach, Random Forest method fits a multitude of
CARTs into bootstrap sets resampled from the training set. Moreover, it precedes the

19
forecasting work through the mode of the predictions iterated by the fitted CARTs. In
order to avoid disadvantages of CART- high variance, the modification of the Random
Forest method not only adds the Bagging method but also adopts randomized node
optimization to further reduce the CART variance (Mei, He, T., & Qu, 2014). In other
words, single decision trees often lead to high variance or high bias.
Theoretically, Random Forest approach can produce a reasonable predictive
model to form the highly accurate prediction by getting a natural balance between the two
extremes: high variance or high bias. Many researches have demonstrated that Random
Forest classifiers can achieve high accuracy in classifying data in domains of high
dimensions with many classes (Banfield, Hall, Bowyer, & Kegelmeyer, 2007). Moreover,
studies- the real time key point recognition (Parkour, 2013) and semantic segmentation
(Shotton, Johnson & Cipolla, 2008) adopting Random Forest algorithm, are also the
evidences to illustrate the better or comparable performance to other classification
methods. Generally, the practice of Random Forest is realized on different design of
forecasting framework. One instance is that scholars (Georga, Protopappas, Polyzos &
Fotiadis, 2012) employed the Random Forests regression technique to solve the problem
of subcutaneous glucose concentration prediction in type 1 diabetes on the basis of a
multivariate dataset obtained under free-living conditions.
Theoretically, Random Forest approach can produce a reasonable predictive
model to form the highly accurate prediction by getting a natural balance between the two
extremes: high variance or high bias. Many researches have demonstrated that Random
Forest classifiers can achieve high accuracy in classifying data in domains of high
dimensions with many classes (Banfield, Hall, Bowyer, & Kegelmeyer, 2007). Moreover,

20
studies- the real time key point recognition (Parkour, 2013) and semantic segmentation
(Shotton, Johnson & Cipolla, 2008) adopting Random Forest algorithm, are also the
evidences to illustrate the better or comparable performance to other classification
methods. Generally, the practice of Random Forest is realized on different design of
forecasting framework. One instance is that scholars (Georga, Protopappas, Polyzos &
Fotiadis, 2012) employed the Random Forests regression technique to solve the problem
of subcutaneous glucose concentration prediction in type 1 diabetes on the basis of a
multivariate dataset obtained under free-living conditions.
Regarding the methodology of this study, original Random Forest is the only
option to bridge the association between advertisement video and revenue generation in
place of any advanced Random Forest models.
2.6 Summary
This chapter has provided an overview of pertinent literature for the
advertisement mining and predictive system including sentiment analysis, two step
clustering approach and random forest algorithm. Unlike traditional methods of
evaluating advertisement performance, more emphases are put on opinion mining of
interactive advertisement and the subsequent transforming linkage between textual data
and quantitative sales report in this paper. From this literature review, we can conclude,
although many researchers worked on topics of sentiment classification and application
of customer segmentation, there is a noticeable shortage of predictive model for the effect
of word of mouth. Therefore, this research firstly adopts the random forest algorithm to
examine the ensemble effect of TV commercial advertisement.

21
CHAPTER 3. FRAMEWORK AND METHOGOLOGY
The purpose of this study was to propose a new sales prediction approach based
on adopting data-mining discovery knowledge rules for video advertisements. The main
benefit of this forecasting mechanism was to build up more solid pre-campaign predictive
mechanisms that offered abundant time- and customer-driven information to adjust
subsequent marketing campaign plans. Another benefit was the ability to extract the
influential factors on the success of the advertisement campaigns.
Essentially, this predictive framework aimed to exploit the random forest
approach to identify the importance of the predictors without removing any independent
variables. In other words, through this ensemble method, all the key factors in the
advertising model were fully taken into consideration without over-fitting and
sensitiveness to noisy data. Therefore, the effect of customer opinions and the number of
viewer segmentations were completely evaluated if there existed any relationship with
revenue performance. This mechanism was further refined by multiple tool kits including
Python, MySQL, R programming language and SPSS Statistics.
3.1 Research Hypothesis
The major purpose of this study was to examine the associated strength and
feasibility of our hypotheses as below:
1. Most industries can adopt TV commercial advertisements to quantify customer
satisfaction, as demonstrated by a sales prediction system.

22
2. The viewer segmentation can be grouped by the viewers’ preference and their
socially influential power. The analysis of viewer clusters can offer
comprehensive guidelines regarding viewer behaviors, including their subjective
preference boundaries and influential shares of social networking, to improve the
company’s advertising strategy. Consequently, the number of viewer clusters
helped build the revenue prediction model.
3. The polarity of each comment was influenced by prior comments regarding the
same advertising video, but was not be influenced by other similar advertising
comments. In other words, each advertising video can be regarded as having
independent data. We can make use of the lexicon compiled by partial advertising
videos to effectively study the dependent sentiment data within one advertising
video.
3.2 Data Collection
With respect to data sources for this research, input and output datasets both must
be retrieved from an open and reliable database system to test if the association between
each other was significant.
3.2.1 Raw Data Extraction
In terms of input-data comments of video advertisements, the process of
extracting raw data was to exploit Google API and YouTube Data API version2 and
version3 (Application Programming Interface) with the Python programming language.
The process was used to gather comments left on TV commercial advertisements shown
on YouTube along with the corresponding profile data of each distinct user who left
messages, including the user’s subscribed channels, total upload views and subscription

23
counts. This programming language package also can help retrieve all related video data,
e.g., the length of the video and the video’s traffic evaluation (viewer counts, the number
of comments, and the number of thumbs-up and thumbs-down). After cleaning these data,
a complete database for establishing a subsequent predictive model was built by means of
MySQL. Moreover, the dependent variable of net operating revenues was obtained from
the official quarterly earning release reports disclosed on the Coca-Cola Company’s
official website.
3.2.2 Limitation of the Data
This research mainly leveraged YouTube Data API (v2, v3) to fetch the search
results of specific videos. Though its full-fledged functionality can fulfill the needs of
discovering online videos, there were still several execution limitations in manipulating
YouTube API to retrieve video data in practice. With regard to the quota limitation, the
problem of execution was that 500 write requests per video constituted the upper limit for
requesting data; beyond that, the server disconnected. That is to say, when one video
attracted over 500 records of comments, it was necessary to repeat the request and tackle
the inevitable issue of data overlapping. Therefore, the time of cleaning data
exponentially increased along with the increase of data. On the other hand, another
general daily quota limit was that only 50,000 requests per project per day were allowed
to be retrieved. Considering the above common overlapping scenarios, the lead time for
preparing the dataset costs became much longer with regard to the YouTube Data API
quota limitations.
Additionally, this study focused on the video advertisements on YouTube
uploaded by the Coca-Cola Company; therefore, the accessible quantity of video data

24
was restricted. The official communities owned by the Coca-Cola Company were
composed of the following accounts: Coca-Cola, Coca-Cola Light, Coca-Cola Zero, and
CocaColaCo. Furthermore, considering the specified research boundary, only the video
advertisements played in North America are used for this research. All the limitations for
enhancing research validity set the boundary on the available data volume.
3.3 Data Transformation for Variables
This forecasting mechanism utilized eight predictors to explore the video
advertisements. Seven of these independent variables were quantitative, including: video
lengths, viewer counts, thumbs up, thumbs down, all comments, the cluster number of
viewer segmentation and feature scoring of sentiment. The mere qualitative predictor was
the degree of the polarity generated by the sentiment analysis. Unquestionably, three of
the predictors—the cluster number of viewer segmentation, feature scoring and degree of
polarity produced by sentiment analysis—must be re-processed for further predictive
analysis; they were discussed in the following sections.
3.3.1 The Cluster Number of Viewer Segmentation
The complexity of this predictor lied in its two analytic layers. The first stage was
to identify the principal preferences of individual viewers—who left opinions on one
video advertisement from their lists of subscribed channels—and the social influential
indexes, including total upload views and subscription counts. Subsequently, the next
step was to execute the statistical approach/two-step clustering method to obtain the ideal
grouping numbers for each video.

25
With reference to the concrete procedure of the first stage, the goal was to
recognize whether the viewer account has channel subscriptions and whether or not we
can narrow the research scope. This was based on the assumption that people with high
involvement in any functionality of social media reflected the true experience to the
videos. It implied that the user accounts were active and worthy of learning on. After
reserving the viewer information regarding who has subscribed to channels, the other
non-subscribing viewers were temporarily omitted; their preferences were not included in
this predictor’s component. In light of the remaining viewers, the rule was to adopt the
category with the maximum frequency from their subscribed channels as their
representations of preference.
Accordingly, the second stage was to deploy the segmentation setting for carrying
out the two-step clustering method. In the first step, this research undertook a modified
hierarchical agglomerative clustering procedure that combines the objects sequentially to
construct homogenous clusters on the basis of log-likelihood distance measure. The
calculation formula for this probability-based distance between clusters Ci and Cj can be
defined as follows:
d(i, j) = ξi + ξj− ξ(i, j) (1)
Where
ξv = VN (
AK
K 1
½ log(2ˆk +
2ˆvk ) +
BK
K 1
2ˆVKE ) (2)

26
and
2ˆVKE =
KL
l V
VKl
N
N
1
logV
VKl
N
N (3)
ξv was similar as a variance within cluster v (v = i, j, (i, j) ). The first formula
VN
AK
K 1
½ log( 2ˆk + 2ˆ
vk ) measured the dispersion of the continuous variables Xj within
cluster v. If 2ˆk was ignored in the expression for ξv, the distance between clusters i and j
was exactly the decrease in the log-likelihood function after integrating cluster i with j.
In terms of the second entropy part VN (
BK
K 1
2ˆVKE ), it was used to evaluate the
dispersion of the categorical variable ( Bacher, Wenzig & Vogler , 2004).
As for the second stage, this study allowed the technique to automatically
determine how many clusters were retained by calculating the measure of fit-Bayesian
Information Criterion of Schwarz (1978). There was no doubt the procedure returned the
best number of clusters for further use. Narinc (2010) defined the Bayesian Information
Criterion as the math formula below:
)ln(*)ln(* npn
SSNnBIC (4)
Where
n = number of observations in the model fitting
SSR = Sum of squares of residuals of the model
p = number of model parameters

27
Regarding this independent variable’s processing, it was necessary to make use of
Python programming language to identify the individual viewer’s preference. Moreover,
SPSS Statistics was utilized to do the two-step clustering analysis as follows.
3.3.2 Sentiment Analysis
Another significant analytic point of this study was to assess the strength of the
WOM on sales achievement. The principal component of sentiment can be divided into
two predictors: feature-scoring and degree of polarity for forecasting use.
In terms of feature-scoring, it can be interpreted as the normalized weighting of a
feature’s orientation by means of statistical evaluation. On the other hand, the majority of
viewers’ attitudes toward the video advertisement experience can be defined as the
degree of polarity. Additionally, the pre-processing work for producing both independent
variables from opinions was to compile the lexicon, which involves the feature indexes
and terms of polarity (positive, negative, neutral), along with logical words, to
automatically identify the semantic location and further work on the classification. All
the procedures for generating both predictors were clarified accordingly.
3.3.2.1 Lexical Syntactic Pattern Generator
Based on the ROLEX-SP (Mohammed & Aysu, 2011) schema, this research added
additional neutral and logical terms to strengthen the capability of classification rather
than merely judging by positive and negative semantic patterns. The lexical syntactic
patterns were extracted in accordance with the existence of a category’s lexicon. Hence
the compilation of the lexicon had a critical influence on the performance of
classification. In this study, the lexicon not only comprised the distinguished feature

28
indexes to the specific Coca-Cola advertising eyestops but also the set of polarity terms.
All the synonyms, antonyms, and co-existing concepts of these entries were categorized
in this exclusive dictionary, which covered all the expressions of advertisement
experience.
Subsequently, the lexical-based classifiers automatically parsed the corpus and
applied the statistical scoring function to obtain the feature-weighting as its score, and
conducted the inference of polarity at the same time. Figure 3.1 indicated the procedure
for how lexical syntactic pattern generators were derived from the sentiment data. This
process split the corpus of video data into three disjointed parts: training set, validation
set and test set. All these sets were randomly selected from the corpus in the ratio 50% :
25% : 25% with replacement.
In terms of the 25 videos sampled as the training set, the most important task was
to categorize the sentiment into two groups of classification: feature indexes and
tendency LSP. The feature indexes contained 9 groups: Brand, Icon, Image, Music,
Story_Festival, Story_Theme, Design, Issue, and Competitor. The purpose of identifying
features was to analyze the core message, which implied the subjects the viewer cared
about most.
Moreover, the tendency of lexical syntactic patterns comprised categories
including positive, negative, neutral and logical words. In particular, the logic of using
neutral patterns was that the tendency terms following the neutral phrases determined the
polarity of a sentence. It can exclude any possibility of mistaken judgement. Take, for
example, “feel like” as one of the illustrations; without the involvement of neutral

29
patterns, the phrase was identified as positive due to the word “like”. Furthermore, the
logical patterns were interpreted as the words that can thoroughly reverse the tendency of
opinions, such as the word “not” and phrase “devoid of”. How the statistical algorithm
converted these patterns into a classification rule to produce two predictors—feature-
scoring and degree of polarity—was discussed in the next section.
•Goal: to extract positive, negative, logical and neutral lexical syntactic patterns from training set
- 25 videos(TS): randomly select 50% videos as traning set
total 2571 comments: Y2009 2 videos, Y2011 3 videos, Y2012 3 videos, Y2013 5 videos, Y2014 11 videos
Begin
2. For each video(vid i) from TS, each vidi consists of one sentiment document(d i).
Therefore, pi=Parse(di,Lexicon(Cf,C
+,C
-,C
n,C
l∈Ci)).
3. Each pi can be grouped into P (p i∈P).
4. accuracy(pi,Ci)=Ncorrect(pi,Ci)/Ncover(pi) Ncover(pi)>0
if Ncover(pi)=0, accuracy(pi,Ci)=0
6. Return ( P+={}, P-={}, Pn={}, Pl={} )
End
1. P+={}, P
-={}, P
n={}, P
l={}
(1)Feature Index(Cf): Brand, Icon, Image, Music, Story_Festival, Story_Theme, Design, Issue, Competitor
(2)Tendency LSP: Positive(C+), Negative(C
-), Neutral(C
n), Logical(C
l)
LSP Generator
5. If accuracy(pi,Ci)>=threshold then, pci+ = pci
+ ∩ p ; pci
- = pci
- ∩ p ; pci
n = pci
n ∩ p; pci
l = pci
l ∩ p
•Output: Positive P+, Negative P
-, Neutral P
n, Logical P
l
•Method: Apply below instructions
•Input: Lexicon, 25 videos
- Lexicon: Feature Index and Tendency LSP
(1)Feature Index: Brand, Icon, Image, Music, Story_Festival, Story_Theme
Figure 3.1 Lexical Syntactic Pattern Generator
3.3.2.2 The Conversion of Two Predictors
After recognizing all the terms from the lexicon, an individual comment set left
by one viewer was independently diagnosed if his or her experience toward that specific
video advertisement was good, bad or can’t be determined. With regard to the coverage

30
of each video, the separate sentiment set can be judged from two dimensions—its
emphasized feature and polarity. Additionally, the chi-square statistical test was adopted
to grade all the sentiment sets of one video by means of a contingency table. The scores
can stand for the strength of the striking feature and the polarity on the video. Through
the transformation of the scoring function, this study leveraged the chi-square scores as
the feature scores and determined the degree of polarity. Below was the chi-square
formula:
2X =
)_(
)__( 2
FREQUENCYEXPECTED
FREQUENCYEXPECTEDFREQUENCYOBSERVED
3.4 Modeling Procedures
This model involved four phases. The first stage entailed collecting data and
creating one database to store that data. The second stage entailed processing the data,
especially in terms of viewer segmentation and sentiment classification. The third stage
applied statistical methods such as Random Forest to build up the predictive system. The
final stage was to verify the predictive performance. After the implementation of this
predictive model, we adopted some validation approaches to examine its performance.
There were more explanations to account for the major tasks in each phase, as described
below.
Phase 1. Database Setup
After collecting all the data by means of API (Application Programming
Interface), the infrastructure of the database was established to create tables to store data
and subsequently clean the noisy data. There were four tables:
(1) Comment table. Each video had its own VID. For each advertisement

31
video, this database used its VID as the table name.
(2) Subscription table. This table contained all the subscription channels.
(3) User table. This table contained all the user information who posted the
comments.
(4) Video table. This table contained all the video information, including
targeting advertisement videos and favorite videos.
Phase 2. Data Processing
In this stage, the transformation of two separate variables was constructed and
then combined into one predictive schema. This model put more emphasis on content-
based filtering. In light of the content-based filtering variable, sentiment analysis was the
imperative predictor to adopt in this model.
The proposed framework to develop semantics and syntactic classification was
the modification of Rules of Lexical Syntactic Patterns (ROLEX-SP classifier). The idea
was to construct more layers for connecting classifiers from different series of
advertisements semantically in the specific domain. That was, this modified ROLEX-SP
classification put more emphasis on the lexicon compilation and subsequently leveraged
one of the statistical methods on assessing the feature scoring and the degree of polarity.
The goal was to identify the tendency of the viewing experience and the features that
people highlighted more significantly in their opinions, for deriving an association with
sales performance.
In terms of a predictive system, aside from unstructured data analysis, user
preference was regarded as one of the factors that impacted sales generation and was
categorized by what channel to which the user had subscribed. Dimensionality reduction

32
promptly created the correct forecasting engine bridge between input- and output-sales
generation. Therefore, all the classifications in each factor of this hybrid forecasting
framework concentrated on minimal but proper groupings to represent the real viewers’
experience.
Phase 3. Predictive System Modeling
Through R programming language, the proposed forecasting model followed the
principle of a Random Forest algorithm to construct trees. Each tree in the ensemble was
built from a sample drawn with a replacement from the training set. Furthermore, when
splitting a node during the construction of the tree, the split that was picked was the best
split among a random subset of the features. Because this algorithm combined classifiers
by averaging their probabilistic prediction instead of letting each classifier vote for a
single class, this predictive schema yielded an overall better model. Additionally,
regarding the output, a data-earning release report was retrieved from the official website
of the Coca-Cola Company, which made all the financial reports public for investors.
Phase 4. Validation
The study examined the case study and inferred if it was suitable to leverage
video advertisements on predictive tasks via the execution of forecasting. Based on my
proposed forecasting framework, it can verify which variable mix contributed to higher
accuracy for the aforementioned consumer product company.
3.5 Summary
This chapter had depicted the methodology used in this study. It provided a
detailed description of predictors, how they were obtained and classified, and how we
used them to build the forecasting mechanism.

33
CHAPTER 4. RESULTS
4.1 Introduction
Results from the parametric research outlined in the previous chapter were
presented in this section. The findings included the overview of data and the data analysis
generated from the two-step clustering approach for viewer segmentation, along with the
performance evaluation of this predictive schema developed by the random forest
algorithm. Through the exploration of video advertisement and its target audience
behavior, the knowledge base was created to assess the value of word-of-mouth and make
the utilization of social media transparent. Ultimately, these results were applied to
determine the forecasting effect if the video advertisement played on social media
followed a consistent trend with the subsequent sales achievement. If so, it can be
regarded as a predictive signal for the adjustment of a future marketing strategy.
4.2 Data Summary
In consideration of the aforementioned search criteria, 49 videos were gathered
from the official Coca-Cola communities on YouTube. Among these videos, the quantity
of each yearly video advertisement distributed in an unbalanced fashion: 3 from year
2009, 1 from year 2010, 4 from year 2011, 6 from year 2012, 12 from year 2013 and 23
from year 2014. In addition, the total records of sentiment sets were 36,464, based on
each viewer who left comments below the video. No one opinion necessarily stood for
one independent user account, which meant an overlapping phenomenon exists. The data

34
showed that the total number of distinct user accounts was 12,427. It can be inferred that
the viewers probably tended to leave multiple comments on the same or other videos. On
the other hand, one record of a sentiment set commonly consists of more than one.
However, the overlapping was not serious enough to impact the study of viewer
preference. An overview of the retrieved data was shown in Table 4.1.
Table 4.1 Summary of Data Collection
Year Quarter Number of Ad
Videos Records of Sentiment
Net Operating
Revenues
2009 2 3 215 3,655
2010 1 1 1,011 1,932
2011 1 2 893 4,687
2011 2 2 432 5,504
2011 4 1 3 4,993
2012 1 2 651 4,921
2012 3 1 132 5,670
2012 4 2 10,520 5,292
2013 1 6 2,287 4,887
2013 2 1 189 5,713
2013 3 2 1,593 5,719
2013 4 3 420 5,271
2014 1 6 14,770 4,793
2014 2 9 1,070 5,717
2014 3 1 99 5,599
2014 4 7 2,179 5,370
Grand Total 49 36,464
4.3 Two Step Clustering Analysis for Viewer Segmentation
Results showed the average percentage of viewers who posted reviews on video
advertisements and also subscribed to channels on YouTube. This average was 50% per
video. According to the analysis of these viewer data, the number of channels viewers
subscribed to on average is approximately 20. Accordingly, it implied that a group

35
participating in the discussion of experience-sharing generally had a high level of
involvement in the social media platform.
This study followed the definition of video category created by YouTube. In light
of YouTube’s requirements, the user must choose the appropriate category from its
predefined categories for the video the viewer uploaded. Therefore, leveraging this
function and data on automatic classification efficiently reduced the error of diagnosis
and the execution time. The coverage of this research involved 17 categories: Music,
Games, Film, Entertainment, Sports, How-to, People, Animals, Autos, Comedy,
Education, Nonprofit, Shows, Tech, News, Travel, and Others. Among these categories,
the analysis revealed that Music, Entertainment and Games were the main viewing
preferences of users who watched and commented on the Coca-Cola video
advertisements. Thus, future advertising design can take these three user preferences into
consideration, although it was difficult to indicate if there existed any preference
difference between viewers who watched the advertisements on a social video-sharing
platform or on cable television.
After integrating two indexes of social network influential power—total upload
views and subscription counts—the two-step clustering method was adopted to determine
the optimal number of viewer segmentation for each videos. According to the principle of
likelihood distance measure and Schwarz’s Bayesian criterion, when the cluster quality
was between 0.2 and 0.5, it can be judged as an acceptable classification quality. Once
the cluster quality was greater than 0.5, the quality was judged as good. As seen in Figure
4.1, the cluster quality mainly lied in fair and good conditions on the basis of the
silhouette measure of cohesion and separation in this study. Most video data can be

36
partitioned among 2 to 3 groups of viewers. With the increase of viewer volume, data
apparently showed the growth of segmentation numbers. In this study, 7 groups were the
maximum number of clusters for categorizing the video’s viewer pool.
Figure 4.1 Sihouette Measure of Cohesion and Separation
4.4 Sentiment Analysis
The lexicon was compiled as 5 tag categories—feature, positive, negative, logical,
and neutral—by gathering the keywords from the training set of 25 videos. The total
number of word count was 46,051. Regarding the word count distribution of each index,
Table 4.2 presented all the ratios; the positive section apparently occupied the highest
portion (41%). Notably, the negative part only accounted for 4%; however, 16% of word
counts fell in the logical section, which was used to convert the inclination of opinions.
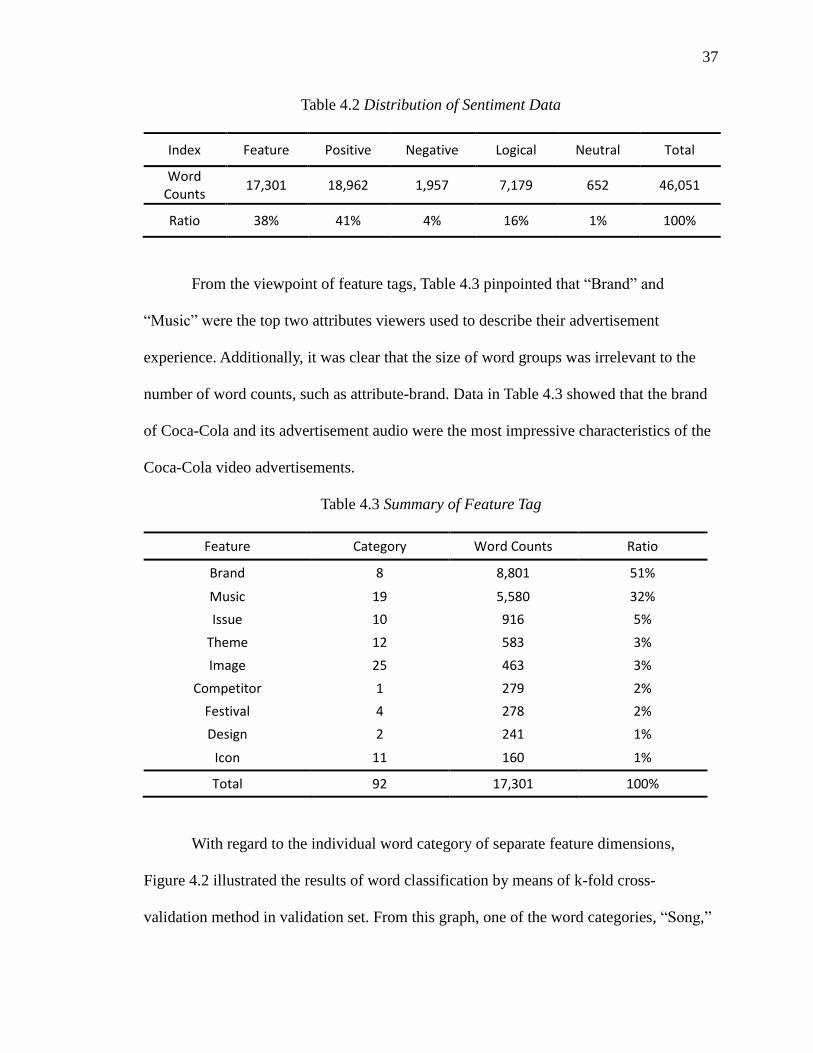
37
Table 4.2 Distribution of Sentiment Data
Index Feature Positive Negative Logical Neutral Total
Word Counts
17,301 18,962 1,957 7,179 652 46,051
Ratio 38% 41% 4% 16% 1% 100%
From the viewpoint of feature tags, Table 4.3 pinpointed that “Brand” and
“Music” were the top two attributes viewers used to describe their advertisement
experience. Additionally, it was clear that the size of word groups was irrelevant to the
number of word counts, such as attribute-brand. Data in Table 4.3 showed that the brand
of Coca-Cola and its advertisement audio were the most impressive characteristics of the
Coca-Cola video advertisements.
Table 4.3 Summary of Feature Tag
Feature Category Word Counts Ratio
Brand 8 8,801 51%
Music 19 5,580 32%
Issue 10 916 5%
Theme 12 583 3%
Image 25 463 3%
Competitor 1 279 2%
Festival 4 278 2%
Design 2 241 1%
Icon 11 160 1%
Total 92 17,301 100%
With regard to the individual word category of separate feature dimensions,
Figure 4.2 illustrated the results of word classification by means of k-fold cross-
validation method in validation set. From this graph, one of the word categories, “Song,”

38
was a relatively better classifier to identify the feature of Music compared to the other
two categories of “Music” and “Version”. Furthermore, Figure 4.3 showed that the word
category of “Song” had the dominant classification effect for identifying the feature of
music in the test set; the accuracy of feature classification in all word coverage of
documents was fairly strong as well.
Figure 4.2 Cross-Validation for the Feature Classification (K=6)

39
Figure 4.3 Test Set for the Examination of Classification Effect
Moreover, tables 4.4 and 4.5 showed the JJ (adjective) and VB (verb) were the
most common part-of-speech (POS) tags for viewers to express their feelings of
experience. All these tags went through the process of k-fold cross-validation and
subsequently verified their classification performance in the test set. Figure 4.4 utilized
the words “Beautiful”, “Good” and “Wonderful” to examine the implementation of
classification. Obviously, the word “Good” represented a normal adjective to describe the
viewing experience, but the word “Beautiful” can clearly reflect the attitude toward some
specific characteristics in the advertisement. In addition, the graph also pointed out that
the word “Wonderful” was not a powerful positivity.
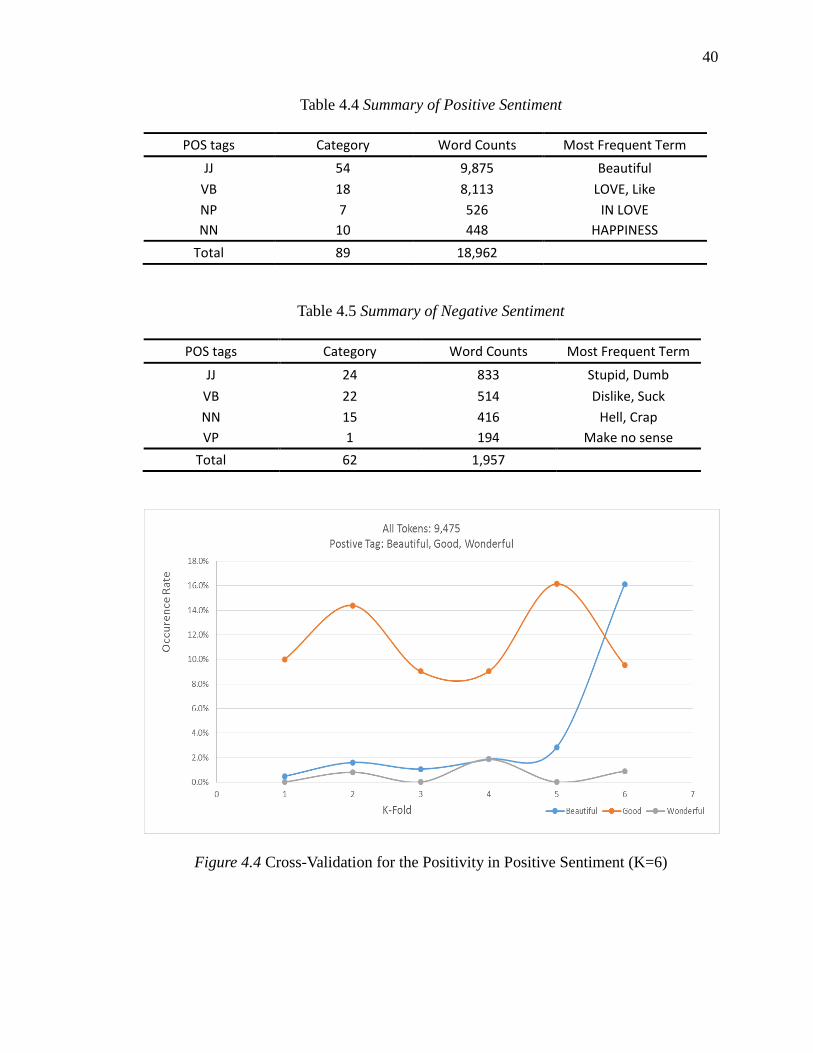
40
Table 4.4 Summary of Positive Sentiment
POS tags Category Word Counts Most Frequent Term
JJ 54 9,875 Beautiful
VB 18 8,113 LOVE, Like
NP 7 526 IN LOVE
NN 10 448 HAPPINESS
Total 89 18,962
Table 4.5 Summary of Negative Sentiment
POS tags Category Word Counts Most Frequent Term
JJ 24 833 Stupid, Dumb
VB 22 514 Dislike, Suck
NN 15 416 Hell, Crap
VP 1 194 Make no sense
Total 62 1,957
Figure 4.4 Cross-Validation for the Positivity in Positive Sentiment (K=6)

41
Figure 4.5 Test Set for the Examination of Positivity Classification
Similarly, figures 4.6 and 4.7 presented the classification effect of negativity in
negation. Word categories such as “Stupid” and “Fake” were more prevalent annotations
with great classification effects for how viewers responded to the video advertisements,
than “Terrible”. Furthermore, Figure 4.8 illustrated the word category “Stupid” in overall
negation to explore the effects of distinct word components. The plot validated that the
classification effect of the word ”Stupid” dominated all other synonyms, including
“Silly” and “Dumb”. Hence, it can be concluded that negative tags categorized from the
training set had a healthy classification performance in the test set as well.

42
Figure 4.6 Cross-Validation for the Negativity in Negation (K=6)
Figure 4.7 Test Set for the Examination of Negativity Classification

43
Figure 4.8 Effect of Different Negativity in Negation
Moreover, the logical negation played a preposition role in reversing the meaning
of opinions. In Figure 4.9, the validation experiment adopted 6 folds to verify the
contrasts between logical negation and negative tags. Apparently, logical negation
empowered the linguistic structure more powerfully to identify the classification of
polarity.
Figure 4.9 Comparison between Logical Negation and Negative Tags

44
Regarding the neutral tags, Figure 4.10 exhibited less confusion caused by the
neural terms in this corpus through the cross-validation method. To take the word group
“Look Like” as an example, it didn’t have enough strength to impact the inclinations of
opinion as compared to the strength of the word group “Like”. Thus, it can be inferred
that a strong influence from positive tags overwhelms the impact from neutral tags.
Subsequently, Figure 4.11 also leveraged the most frequently used neutral term “Can Not
Stand” to compare with the intensity of negative tags such as “Not”. Evidence
demonstrated that both positive and negative POS tags mainly determined the attitudes
toward the video advertisement.
Figure 4.10 Distinction between Neutral Tags and Positive Tags

45
Figure 4.11 Distinction between Neutral Tags and Negative Tags
As for the determination of polarity, this study followed the ROLEX-SP classifier
approach to locate all part-of-speech tags through above LSPs at first, and exploited the
chi-square scoring function to return its feature scores as degree of polarity and the
polarity itself.
From the experimentation, neutral tendency accounted for a major portion of
polarity (75%, 35 videos) in this sentiment text, and positive responses occupied the
second-largest proportion (20%, 10 videos). Only 4 videos returned the negative feedback
(8%). In Figure 4.12, the distribution took advantage of the quartile to transform the chi-
square scores as three degrees of polarity—Low, Medium, High—to investigate the
strength of each polarity. Evidence revealed that neutrality with medium power was the
mainstream in this data. Even in the positivity or negation, there was no significant
influence that reinforced or weakened the inclination of polarity. To sum up, a majority of
the Coca-Cola video advertisements offered viewers a neutral or good experience.

46
Figure 4.12 Distribution for Degree of Polarity (49 videos)
4.5 Random Forest Model
This study adopted Classification Random Forest to examine the achievement of
this predictive framework. Hence, the response variable of net operating revenue was
transformed into a multiclass categorical predictor: high, medium and low. The revenue
categorization was judged by the quartile of the net operating revenue; if the revenue was
greater or equal than the third quartile of overall data, it was identified as the high level
revenue. If the revenue lied between first quartile and third quartile, then it was
recognized as the medium level and the remainder was low level. In addition, this
research separated the dataset into a 75% training set and 25% test set that relied on the
sampling without replacement to verify the model’s predictive effect.
In this section, all the parameters and the tree simulation generated by the
Random Forest algorithm were further discussed as follows: the out-of-bag error, variable
importance indices, proximity measure, and tree structure. Moreover, the evaluation of
predictive performance was demonstrated by Receiver Operating Characteristic Curves
(ROC) as well.

47
4.5.1 The Out-of-Bag Error Estimate
In terms of the out-of-bag error, this estimate of generalization error had a similar
multiple training process of leave-one-out cross-validation without additional
computational workload. From the experimentation, the output of this Random Forest
model showed that the estimate of out-of-bag error rate was 55.56% on the basis of 500
trees in the forest, and the 3 predictors sampled at each split. Additionally, the confusion
matrix revealed that the misclassification rates were generally high among three
dependent variables. Table 4.6 showed that only medium-level revenue had relatively less
classification error (25%). However, there was no significant classification boundary for
high and low levels of revenue.
Table 4.6 Confusion Matrix of Response Variable
Dependent Variable: Revenue
H L M Class.Error
H 0 0 9 100%
L 0 4 7 63%
M 1 3 12 25%
* H: High level L: Low level M: Medium level
Consider the impact of one tuning parameter—the number of trees in building
random forests. Both Table 4.7 and Figure 4.13 implied that the research should reduce
the size of trees down to 400 and gain relatively little loss in the increase of error.
Nevertheless, Table 4.7 also showed that a small number of trees (ntree=100) apparently
had large error rates (66.67%). Therefore, this research used 400 random trees as the
optimal tree size to build up the forecasting forest.

48
Table 4.7 OOB Error Rate in Different Tree Size
ntree OOB 1 2 3
100 66.67% 88.89% 63.64% 56.25%
200 61.11% 100.00% 72.73% 31.25%
300 55.56% 100.00% 72.73% 18.75%
400 50.00% 100.00% 63.64% 12.50%
500 55.56% 100.00% 63.64% 25.00%
Figure 4.13 OOB Error Rate in Different Tree Size

49
4.5.2 The Evaluation of Variable Importance
Regarding the assessment of variable significance, the feature selection based on
the Gini impurity index manipulated a regularized linear classification to reduce the
dimensionality of this optimal subset of features and exclude the noise from the
classification work. In the Random Forest algorithm, Mean Decrease Gini represented a
measure of variable relevance to the classification dependent on the Gini impurity index,
averaging the sum of overall weighted impurity decreases for all trees in the forest.
Figure 4.14 displayed that three of the attributes in this model were obviously significant
to assist the classification: the number of all comments, the number of thumbs up and the
viewer counts. Evidently, the features related with traffic concept played a pivotal role in
segmenting distinct characteristics of individual explanatory variables; however, the
predictors—feature scores, the number of viewer segmentation and the polarity—did not
present conspicuous effects of classification.
Figure 4.14 Mean Decrease of Gini impurity index
Regarding the permutation measure of impact on accuracy, Figure 4.15 pinpointed
that the features with higher values of mean decrease in accuracy—video length, viewer

50
counts and the number of thumbs up and down—were more imperative to the
classification of prediction. Nevertheless, the independent variables—the number of
viewer segmentation, feature scores, polarity and the number of comments—showed less
importance to the accuracy of output.
Essentially, the main difference between Mean Decrease Accuracy and Mean
Decrease Gini was whether the calculation is based on the out-of-bag data or not. In other
words, Mean Decrease Accuracy was determined by the normalized difference of the
classification accuracy for the out-of-bag data, which was randomly permuted. The
bootstrap iterations of Mean Decrease Accuracy made its estimate unduly optimistic, but
Mean Decrease Gini was immune to this issue due to its manipulation that relied on the
data used to fit trees. In Table 4.8, the feature of the number of comments was useful to
differentiate the feature space, but did nothing to strengthen the output of forecasting.
Figure 4.15 Mean Decrease of Accurace

51
Table 4.8 Summary of Variable Importance
High Low Medium MeanDecreaseAccuracy MeanDecreaseGini
len 4.310541 3.333754 -2.02161 2.98779 1.500544
like 1.182817 -0.22512 0.916229 0.7733121 6.109954
dislike -1.26247 1.542705 0.081146 0.3241799 1.291617
viewer -0.08671 1.352347 0.719293 0.8485249 5.988672
allc -1.50358 -1.09983 -2.00338 -2.2456001 6.188275
seg 1.838202 1.921321 -2.27885 -0.119943 0.52006
score -0.76538 -0.17701 0.089373 -0.2524489 0.776212
pol -0.84609 0.364208 -1.02507 -0.4951433 0.246888
4.5.3 Proximity Measure
Apart from providing high-fidelity data, the anomaly detection was typically
tightly concerned with the exploration of novelty. In the Random Forest algorithm,
proximities between pairs of classes helped investigate the similarity between individuals.
Figure 4.16 presented the analysis of proximity measure to highlight three video outliers
from the training set. Although the Random Forest method was theoretically robust
against irrelevant outliers in training data, summarizing the distinct characteristics of
these three video advertisements was conducive to future advertisement design.
According to Figure 4.16, video 35, video 32 and video7 were specified as the
outlying observations with dissimilarity between others. In terms of video 35, its aim was
to gather all Coke fans’ originality to express the indescribable feeling from enjoying
Coke. From prior sentiment analysis, brand was the core feature viewers emphasized on
video 35, and its overall evaluation of opinions was positive. The advertisement style of
video 35 focused on the creative ideas derived from an individual’s brand and drinking
experience, which was quite different from other advertisement ideas. Moreover, consider

52
the principal schema of video 32, which was on a mission to convert Coca-Cola Light’s
likers to lovers. Unwavering passion was the theme pursued in this advertisement, rather
than an emphasis on the sub-brand of Coca-Cola Light. Thus, music was the most
frequent feature viewers mentioned via their comments, instead of the brand.
Finally, the theme of video 7 was to present the concept of “open happiness,”
which meant that Coca-Cola brought happiness to human beings. This topic was
representative of one of the classical Coca-Cola advertisement themes and features;
music was significantly reflected in the opinion-mining. All of these three videos should
be studied to investigate the reasons why the diversity existed for further development of
advertising strategy.
Figure 4.16 Measure of Similarity

53
4.5.4 Receiver Operating Characteristic Curve
The receiver operating characteristic curve (ROC) was typically constructed to
diagnose the accuracy of the model. The dimensions between the diagonal line revealed
the measure of discrimination, which indicated the ability of the experiment to correctly
classify the results. The region under the ROC curve referred to the percentage of
randomly determining which was true on the basis of the uninformative test.
Consequently, the area under the ROC curve reflected how good the model was at
distinguishing. In other words, the greater area represented the better test.
Figure 4.17 exhibited that the classification probability of this predictive
framework fell under the area of the ROC curve. This evidence demonstrated an unsound
model that had insensitivity to the revenue classification; the accuracy of predicted
classification was mere 30.77%.
Figure 4.17 ROC Curve for Random Forest Model

54
CHAPTER 5. CONCLUSIONS AND RECOMMENDATIONS
The overriding purpose of this chapter was to outline overall research and provide
some imperative recommendations as guidelines for future research. The first section of
the chapter explained the aim of this research and discussed the design of this predictive
schema used to explore the association between video advertisement and earning
generation. Subsequently, the second section summarized the major findings along with
the examination of forecasting performance. Finally, the implications of mining the video
advertisements on YouTube and further suggestions for improving the predictive model
were discussed.
5.1 Summary
Undoubtedly, social video-sharing media has subverted the ecology of the
advertising media, as demonstrated by the explosive growth of traffic on YouTube during
recent years. Through this new type of media, the uniqueness of advertisement mining
begins to concentrate on the extended application of the true target audience’s experience.
Consequently, this study attempted to employ several marketing factors obtained from
YouTube to establish classification random forests for the value discovery of video
advertisements.
Apart from objective factual variables—e.g., the length of video and predictors
related with traffic-viewer counts, the number of comments viewers left, the number of

55
thumbs up and down—both sentiment analysis and the number of viewer segmentation
were the spotlight in this research. Hence the process of variable transformation was
necessary for the deployment of this predictive framework. Simultaneously, we can
identify some prominent inferences from the perspective of viewers.
In practice, the number of viewer segmentation was determined by the viewers’
preferences, i.e., subscribed channels on YouTube; and their socially influential powers,
i.e., subscription counts and total upload views. The differentiation of viewer clusters was
implemented by the two-step clustering algorithm that adopted Schwarz’ log-likelihood
distance measure and Bayesian information criterion to automatically return the ideal
number of clusters.
Moreover, in terms of sentiment analysis, feature scores and its polarity were
regarded as two separate predictors in this study, even though typical research generally
regarded feature scores as the degree of polarity. All the lexical syntactical patterns
attested to their classification effects by the k-fold cross-validation approach. The attitude
detection was subsequently allowed to be acquired by means of modified ROLEX-SP
approach, involving the neutral and logical negation POS tags.
To provide real-world practice, this study retrieved video advertisements on
YouTube from the Coca-Cola Company to realize the predictive structure and verify its
feasibility of measuring the value of word-of-mouth. Unfortunately, the forecasting
performance was not reliable enough to bridge the connection between video
advertisements and revenue generation. However, there were still many distinct findings
from the process of building this predictive model regarding either the analysis of viewer

56
segmentation or opinion-mining, and even model improvement. All of these discoveries
were generalized in the next section.
5.2 Conclusions
In light of the viewer segmentation, viewers with high involvement in the Coca-
Cola video advertisements on YouTube mainly fell into three preference categories:
“Music”, “Entertainment” and “Games” as defined by their most frequently subscribed-to
channels on YouTube. The variables relevant to the traffic concept, i.e., total upload
views and subscription views, cooperated well with the user preference to determine the
optimal number of segmentations. Moreover, evidence also demonstrated that no
relationship existed between the number of segmentation and viewer counts.
Additionally, from the angle of opinion-mining, a majority of viewer perceptions
of the Coca-Cola Company’s video advertisements were neutral or slightly positive with
mild strength. In the advertising domain, the positive, negative and logical negation part-
of-speech tags dominated the expression of feelings, instead of the unobvious
classification effect from neutral tags. On the other hand, positive tags and logical
negation tags had the absolutely significant classification effects on attitude detection in
the advertising area as well.
Regarding the whole random forests, the ideal out-of-bag error rate was 50% on
the basis of 400 trees. In addition, the confusion matrix clarified that the optimal
classification paradigm of this model was merely realized on the medium-level revenue.
As far as the variable importance was concerned, features associated with the traffic—i.e.,
the number of all comments, the number of thumbs up and the viewer counts—had

57
significant feature spaces different from the attributes with unmarked feature boundaries,
i.e., feature scores, the number of viewer segmentation and the polarity.
Separately, the important features for the accuracy of prediction were input
variables- video length, viewer counts and the number of thumbs up and down. In
particular, although the feature of the number of comments had a distinct classification
effect on feature differentiation, it cannot consolidate the predictive results. Moreover, we
must consider that the anomalies in these video advertisements, the creativity from
sharing the Coca-Cola experience and the background music piquing viewers’ interests
rendered the advertisements unique.
In summary, the predictive performance in this classification of random forests
was not perfectly good; it was only 30.77%. Rather than the word-of-mouth effect and
viewer clusters, the traffic factors and the time investment for the video advertisements
were conducive to revenue achievement. However, the poor result did not indicate that
word-of-mouth and customer segmentation were inappropriate for forecasting. The
inference of this frustrating output was discussed in the following section for further
reforms and exploration.
5.3 Recommendations
The conclusion of this research resulted in several recommendations from two
perspectives. Firstly, regarding the implementation of this predictive model, the variable
transformation should be reviewed and strengthened. That is to say, in terms of the
segmentation clusters, almost half of viewers who joined the discussion didn’t subscribe
to any channels. This study ignored this significant percentage of viewer preferences,

58
which possibly resulted in a less-representative result of viewer segmentation. Therefore,
adoption of other relevant behaviors regarding the preference of this group, such as
uploaded videos, can reasonably consolidate the reliability of this predictor.
Furthermore, the lexicon compilation should be extended to cover missing words,
including misspelled words and new word categories. For example, the word
“awesoooome” expressed the same meaning of the word “awesome” but was not
included in this dictionary. We must keep in mind that the comments left on social media
often have grammar and spelling errors. Thus, expanding the coverage of the word
categories will be helpful to enhance the accuracy of opinion classification.
The second recommendation for further studies was to extend this preliminary
work by adding new predictors, testing other models to fit or changing the independent
variable.
With regard to involving new predictors, variables related to the traffic concept were
worthy to add in this model; this also corresponded to the external trend. Aside from the
random forests algorithm, many other classification learning methods can be leveraged
on this measurement, such as SVM (Support Vector Machine), based on this precursory
research. Finally, the target variable of this study was classified by the net operating
revenues from the earning release reports as different levels of revenue indexes.
Nevertheless, it only reflected the quarterly performance rather than the monthly base.
Hence, the ambiguous differentiation between each definite timeline probably leaded to
poor classification of predictions. Any other data with more concrete presentation of
performance will reinforce this forecasting framework.

59
The adoption of social video-sharing sites is a prevalent trend in this generation.
Effective leverage of the data generated from this kind of social media is becoming a vital
analytic task. Typically, companies have viewed this challenge in a profit-making light;
therefore, enterprises are eager for optimal mining solutions to explore the connection
between revenue generation and social goods data. This research provided a complete
paradigm of one social-goods mining practice and outlined the behavior analytics for
future extensions.

LIST OF REFERENCES

60
LIST OF REFERENCES
Adomavicius, G., and Tuzhilin, A. (2005). Toward the next generation of recommender
systems: A survey of the state-of-the-art and possible extensions. IEEE
Transactions on Knowledge and Data Engineering, 17(6), 734-749.
doi: 10.1109/TKDE.2005.99
Amir, S., Christian, L., Jakob, S., Martin, G., and Horst, B. (2009). On-line random
forests. 2009 IEEE 12th International Conference on Computer Vision Workshops
(ICCV Workshops), 1393-1400. doi: 10.1109/ICCVW.2009.5457447
Bedi, P., and Agarwal, S.K. (2011). Preference learning in aspect-oriented recommender
system. 2011 International Conference on Computational Intelligence and
Communication Networks (CICN), 611-615. doi: 10.1109/CICN.2011.132.
Bedi, P., and Vashisth, P. (2011). Interest-based recommendation using argumentation.
Journal of Artificial Intelligence, Asian Network for Scientific Information
Journal, 4, 119-142. doi: 10.3923/jai 2011
B., H., and M., A. (2013). A two-step segmentation algorithm for behavioral clustering of
naturalistic driving styles. 2013 16th International IEEE Conference on
Intelligent Transportation Systems (ITSC), 857-862.
doi: 10.1109/ITSC.2013.6728339
Breese, J.S., Heckerman, D., and Kadie, C. (1998). Empirical analysis of predictive
algorithms for collaborative filtering. In Proceedings of the 14th Conference on
Uncertainty in Artificial Intelligence, 43-52.
Cassidy, A., and Deviney, F. (2014). Calculating feature importance in data streams with
concept drift using online random forest. 2014 IEEE International Conference on
Big Data, 23-28. doi: 10.1109/BigData.2014.7004352
Chen, T.Y., Wang, H.P., and Tsui, C.W. (2008). Validating the integrated paradigm for
advertising involvement with the intuitionistic fuzzy set theory. 2008 IEEE
International Conference on Fuzzy Systems (IEEE World Congress on
Computational Intelligence), 797-804. doi: 10.1109/FUZZY.2008.4630462

61
Chiu, T., Fang, D., Chen, J., Wang, Y., and Jeris, C. (2001). A robust and scalable
clustering algorithm for mixed type attributes in large database
environment. KDD '01 Proceedings of the Seventh ACM SIGKDD International
Conference on Knowledge Discovery and Data Mining, 263-268.
Das, S., and Chen, M. (2001). Yahoo! for Amazon: Extracting market sentiment from
stock message boards. Proceedings of the 8th Asia Pacific Finance Association
(APFA).
Devi, K.N., and Bhaskarn, V.M. (2012). Online forums hotspot prediction based on
sentiment analysis. Journal of Computer Science, 8(8), 1219-1224.
Dongre, J., Prajapati, G.L., and Tokekar, S.V. (2014). The role of apriori algorithm for
finding the association rules in data mining. 2014 International Conference on
Issues and Challenges in Intelligent Computing Techniques (ICICT), 657-660.
doi: 10.1109/ICICICT.2014.6781357
Georga, E., Protopappas, V., Polyzos, D., and Fotiadis, D. (2012). A predictive model of
subcutaneous glucose concentration in type 1 diabetes based on random
forests. 2012 Annual International Conference of the IEEE Engineering in
Medicine and Biology Society (EMBC), 2889-2892.
doi: 10.1109/EMBC.2012.6346567
Gill, P., Arlitt, M., Li, Z., and Mahanti, A. (2007). YouTube traffic characterization: A
view from the edge. ACM SIGCOMM Internet Measurement Conference, IMC'07.
Gong, S.J., Ye, H.W., and Shi, X.Y. (2008). A collaborative recommender combining item
rating similarity and item attribute similarity. 2008 International Seminar on
Business and Information Management, 58-60. doi: 10.1109/ISBIM.2008.190.
Gotardo, R., A., Teixeira, C., A., C., and Zorzo, S., D. (2008). An approach to
recommender system applying usage mining to predict users’ interests. 2008 15th
International Conference on Systems, Signals and Image Processing, 113-116.
doi: 10.1109/IWSSIP.2008.4604380
Gotardo, R.A., Teixeira, C.A.C., and Zorzo, S.D. (2008). An approach to recommender
system applying usage mining to predict users’ interests. 2008 15th International
Conference on Systems, Signals and Image Processing, 113-16.
doi: 10.1109/IWSSIP.2008.4604380
Greenwald, A.G., and Leavitt, C. (1984). Audience involvement in advertising: Four
levels. Journal of Consumer Research. doi: 10.1.1.18.9202

62
Hammond, K., and Varde, A.S. (2013). Cloud based predictive analytics: Text
classification, recommender systems and decision support. 2013 IEEE 13th
International Conference on Data Mining Workshops (ICDMW), 607-612.
doi: 10.1109/ICDMW.2013.95
Han, J., Kamber, M., and Pei, J. Data mining concepts and techniques. 3rd ed. Morgan
Kaufmann, 2012.
Herlocker, J.L., Konstan, J.A., Borchers, A., and Riedl, J. (1999). An algorithmic
framework for performing collaborative filtering. Proc. 22nd Int'l ACM SIGIR
Conf. Research and Development in Information Retrieval, 230-237.
Higgs, B., & Abbas, M. (2013). A two-step segmentation algorithm for behavioral
clustering of naturalistic driving styles. 2013 16th International IEEE Conference
on Intelligent Transportation Systems (ITSC), 857-862.
doi: 10.1109/ITSC.2013.6728339
Hu, M., Liu, B. (2004). Mining and summarizing customer reviews. Proceedings of the
10th International Conference on Knowledge Discovery and Data Mining
(KDD), 168-177.
Iwahama, K., Hijikata, Y., and Nishida, S. (2004). Content-based filtering system for
music data. 2004 International Symposium on Applications and the Internet
Workshops (SAINTW’04), 480-87. doi: 10.1109/SAINTW.2004.1268677
Kannan, S., and Bhaskaran, R. (2009). Association rule pruning based on interestingness
measures with clustering. International Journal of Computer Science Issues
(IJCSI), 6(1), 35-43.
Keke, C., Scott, S., Ying, C., and Li, Z. (2008). Leveraging sentiment analysis for topic
detection. 2008 IEEE/WIC/ACM International Conference on Web Intelligence
and Intelligent Agent Technology, 265-271.
doi: 10.1109/WIIAT.2008.188
Lai, K., and Wang, D. (2013). Understanding the external links of video sharing sites:
Measurement and analysis. IEEE Transactions on Multimedia, 15(1), 224-235.
doi: 10.1109/TMM.2012.2225030
Leo, B. (2001). Random forests. Machine Learning, 45(1), 5-32.
Li, N., Wu, and D.D. (2010). Using text mining and sentiment analysis for online forums
hotspot detection and forecast. Decision Support Systems, 48(2), 354–368.
doi:10.1016/j.dss.2009.09.003
Manning, C., and Schütze, H. Foundations of statistical natural language processing.
Cambridge, MA: MIT Press., 1999.

63
Mei, J., He, D., R., H., T., H., and Qu, G. (2014). A random forest method for real-time
price forecasting in New York electricity market. 2014 IEEE PES General
Meeting | Conference & Exposition, 01-05. doi: 10.1109/PESGM.2014.6939932
Mohammed, GH. AL Z., and Samer, S. (2014). The application of semantic-based
classification on big data. 2014 5th International Conference on Information and
Communication Systems (ICICS), 1-5. doi: 10.1109/IACS.2014.6841941
Mooi, E., & Sarstedt, M. (2011). Cluster Analysis. In a concise guide to market
research: The process, data, and methods using IBM SPSS statistics. Springer.
Masood, S., Ali, M., Arshad, F., Qamar, A.M., Kamal, A., and Rehman, A. (2013).
Customer segmentation and analysis of a mobile telecommunication company of
Pakistan using two phase clustering algorithm. 2013 Eighth International
Conference on Digital Information Management (ICDIM), 137-142.
doi: 10.1109/ICDIM.2013.6693978
Namvar, M., Gholamian, M., and KhakAbi, S. (2010). A two phase clustering method for
intelligent customer segmentation. 2010 International Conference on Intelligent
Systems, Modelling and Simulation (ISMS), 215-219.
doi: 10.1109/ISMS.2010.48
Neethu, M.S., and Rajasree, R. (2013). Sentiment analysis in Twitter using machine
learning techniques. 2013 Fourth International Conference on Computing,
Communications and Networking Technologies (ICCCNT), 1-5.
doi: 10.1109/ICCCNT.2013.6726818
Reutterer, A., and Mild, T. (2003). An improved collaborative filtering approach for
predicting cross-category purchases based on binary market basket data. Journal
of Retailing and Consumer Services, 10 (3), 123-133.
Saito, Y., and Murayama, Y. (2010). Implementation of an internet broadcasting system
with video advertisement insertion based on audience comments. 2010
International Conference on P2P, Parallel, Grid, Cloud and Internet
Computing, 505-510. doi: 10.1109/3PGCIC.2010.86
Santamaría, S.S., Varela, J.A.P., and Serrano, J.G. (2010). Taking advantage of Web 2.0
and video resources for developing a social service: Babelium Project, the Web
community for foreign language speaking practice. 2010 IEEE 10th International
Conference on Advanced Learning Technologies (ICALT), 597-598.
doi: 10.1109/ICALT.2010.169
Saravanan, D., and Srinivasan, S. (2010). Data mining framework for video data. 2010
Recent Advances in Space Technology Services and Climate Change (RSTSCC),
167-170. doi: 10.1109/RSTSCC.2010.5712827

64
Sentiment Analysis and Opinion Mining (1st ed.). (2012). Morgan and Claypool.
Spaeth, A., and Desmarais, M.C. (2013). Combining collaborative filtering and text
similarity for expert profile recommendations in social websites. User Modeling,
Adaptation, and Personalization, 178-89. doi: 10.1007/978-3-642-38844-6_15
Sunita B., A. (2013). Recommendation system using unsupervised machine learning
algorithm & association rule mining. International Journal of Engineering
Research and Development (IJERD), 1(1), 01-11.
Retrieved from http://www.ijerd.net/Journalcureentissue.asp
Vekariya, V., and Kulkarni, G., R. (2012). Notice of violation of IEEE publication
principles hybrid recommender systems: Content-boosted collaborative filtering
for improved recommendations. 2012 International Conference on
Communication Systems and Network Technologies (CSNT), 649-53.
doi: 10.1109/CSNT.2012.218.
Yu, K., Schwaighofer, A., Tresp, V., T., Xu, X., and Kriegel, H.P. (2004). Probabilistic
memory-based collaborative filtering. IEEE Transactions on Knowledge and Data
Engineering, 16(1), 56-69. doi: 10.1109/TKDE.2004.1264822
Wang, J.C., and Chai, S.C.A. (2013). An investigation on how designing video
advertisements influences secondary school students' perception of learner
autonomy. 2013 IEEE 63rd Annual Conference International Council for
Educational Media (ICEM), 1-16. doi: 10.1109/CICEM.2013.6820163
Wilson, T., Wiebe, J., and Hoffmann, P. (2005). Recognizing contextual polarity in
phrase-level sentiment analysis. Proceedings of Human Language Technology
Conference and Conference on Empirical Methods in Natural Language
Processing (HLT/EMNLP), 347–354.
Wu, Y., and Ren, F. (2011). Learning sentimental influence in Twitter. 2011 International
Conference on Fu- Ture Computer Sciences and Application (ICFCSA), 119–122-
119–122.
Xu, K., Li, H., Liu, J., Zhu, W., and Wang, W. (2010). PPVA: A universal and transparent
peer-to-peer accelerator for interactive online video sharing. 2010 18th
International Workshop on Quality of Service (IWQoS), 1-9.
doi: 10.1109/IWQoS.2010.5542762
Xu, Y., and Du., H. (2011). Empirical study on the evaluation of the advertising
effectiveness. 2011 International Conference on Electrical and Control
Engineering (ICECE), 187-90. doi: 10.1109/ICECENG.2011.6057438

65
Yadav, C., Wang, S., and Kumar, M. (2013). An approach to improve apriori algorithm
based on association rule mining. 2013 Fourth International Conference on
Computing, Communications and Networking Technologies (ICCCNT), 1-9.
doi: 10.1109/ICCCNT.2013.6726678
Yazdi, A.S.H., and Kahani, M.(2014). A novel model for mining association rules from
semantic web data. 2014 Iranian Conference on Intelligent Systems (ICIS), 1-4.
doi: 10.1109/IranianCIS.2014.6802574
Yu, L., and Dong, A. (2010). Hybrid product recommender system for apparel retailing
customers. 2010 WASE International Conference on Information Engineering
(ICIE), 356-360. doi: 10.1109/ICIE.2010.91
Zhang, P., Ma, J., and Sun, X. (2008). Intelligent delivery of interactive advertisement
content. Bell Labs Technical Journal, 13(3), 143-158.
doi: 10.1002/bltj.20330
Zhang, S. (2012). Video semantic mining and annotation. 2012 World Automation
Congress (WAC), 1-3.
Zhang, T., Ramakrishnan, R., & Livny, M. (2013). BIRCH: A new data clustering
algorithm and its applications. Data Mining and Knowledge Discovery, 1(2), 141-
182. doi:10.1023/A:1009783824328
Zhao, N., L., B., and P., Bellot. (2013). Video sharing websites study content
characteristic analysis. 2013 IEEE RIVF International Conference on Computing
& Communication Technologies - Research, Innovation, and Vision for the Future
(RIVF), 64-69. doi: 10.1109/RIVF.2013.6719868
Zhou, F., and Dransart, F. (2014). Online statistics of keyword-indexed YouTube
videos. 2014 Sixth International Conference on Communication Systems and
Networks (COMSNETS), 1-4. doi: 10.1109/COMSNETS.2014.6734910
Zhou, X., Tao, X., Yong, J., and Yang, Z. (2013). Sentiment analysis on tweets for social
events. 2013 IEEE 17th International Conference on Computer Supported
Cooperative Work in Design (CSCWD), 557-562.
doi: 10.1109/CSCWD.2013.6581022
Zhu, X., Wu, X., A.K., E., Feng, Z., and Wu, L. (2005). Video data mining: Semantic
indexing and event detection from the association perspective. IEEE Transactions
on Knowledge and Data Engineering, 17(5), 665-677.
doi: 10.1109/TKDE.2005.83