vietnam cashew market report q1/2018 -...
TRANSCRIPT

VIETNAM CASHEW MARKET REPORT Q1/2018

2
Content
Abbreviations 3 3. Cashew Market in Vietnam 40
Report Summary 4 3.1 Definitions and Classification 40
1. Business Environment 6 3.2 Process and Production Technology 45
1.1 Macroeconomic situation 6 3.3 Production 51
1.2 Legal Framework 11 3.4 Consumption 58
1.3 Impact of Trade Agreements 17 3.5 Export - Import 61
2. Global Cashew Industry 21 3.6 Price 66
2.1 Industry Value Chain 22 4. Risks in Vietnam Market 69
2.2 Production 23 5. Planning 73
2.3 Consumption 28 6. Prospects and Forecasts 76
2.4 Export - Import 31 7. Enterprise Analysis 80
2.5 Price Movement 34 Financial Statement Appendix 97
2.6 Current situation in some typical countries 36

3
Danh mục từ viết tắt
GCC Global Cashew Council
INC International Nut and Dried Fruit Council
NHHH/SBV State Bank of Vietnam
GDVC General Department of Vietnam Customs
GSO General Statistics Office of Vietnam
MARD Ministry of Agriculture and Rural Development
LLC Limited Liability Company
Vinacas Vietnam Cashew Association
VIRAC Vietnam Industry Research And Consultancy

4
Report Summary
Cashew is mainly planted in India, Ivory Coast,
Brazil and Vietnam.
The raw cashew production output is
continuously increasing by CARG = 3% during
the 2009/2010 – 2016/2017 season.
The cashew kernels production output globally
in the season 2016/2017 continues increasing
and reaches about 754.7 thousand tons
The demand for cashew kernel consumption
reaches 787 thousand tons in 2017, increasing
by 10% compared to 2016.
In 2016, cashew kernels export globally
reached about 498.1 thousand tons, decreasing
slightly compared to 2015 which was 502.4
thousand tons.
Vietnam is currently the largest exporter of
cashew kernel in the world with the exports
accounting for 56% of the global output in
2016.
In 2017, the cashew growing area is estimated
to be 240.4 thousand hectares, 252 thousand
tons of the output which was decreased by
almost 50,000 thousand tons compared to
2016.
Although Vietnam is the greatest exporter of
cashew, the industry in Vietnam still faces
challenges, for example, the domestic
production output only meets 1/3 of the
export processing enterprises.
The domestic consumption of the cashew
kernels accounts for 10% and the rest is for
export.
THE CONTENT IS INTENTIONALLY REMOVED FOR DEMO
PURPOSE

5
Report Summary
There are still opportunities for the prospects
of cashew industry in Vietnam to grow in the
next few years.
According to Vinacas, in 2017, the whole
industry makes attempt to reach 330 thousand
tons of exporting types of cashew kernel with
over $3.3 billion
In 2016, most of the enterprises have positive
growth of net revenue and the average growth
reached 13.9%.
Olam Vietnam is the largest revenue earner.
THE CONTENT IS INTENTIONALLY REMOVED FOR DEMO
PURPOSE

Content
6
1. Business Environment
1.1 Macroeconomic Situation
1.2 Legal Framework
1.3 Free Trade Agreements

1. Business Environment
1.1. Macroeconomic Situation
7
Sources: VIRAC, GSO
Sources: VIRAC, GSO
Gross domestic product (GPD) in the first 9 months of 2017 is
estimated to increase by 6.41% compared to the same period last
year, in specific, Q1 increased by 5.15%, Q2 increased by 6.28% and
the increasing estimation for Q3 is 7.46%.
In terms of the increase by 6.41% of the whole economy in the first
9 months of this year,
Cashew is one of the key products of Vietnamese agriculture in the
global market.
GDP growth from 2011-9M/2017
GDP structure due to the current price, Sep/2017
THE CONTENT IS INTENTIONALLY REMOVED FOR DEMO
PURPOSE

1. Business Environment
1.1. Macroeconomic Situation
8
Sources: VIRAC, GSO
Available income and household expenditure, 2008 – 2017fMillion dong Available income has the uprising trend which is the positive driving
force for the spending on dining demand.
The continuous increase in available income and household
expenditure in the past few years has been the development
motivation for the cashew industry in the country.
Vietnam is currently
having fastest speed of growing the Middle class and Upper class in the
Southeast Asia and forecasted to reach 33 million people in 2020
Population structure divided by classes (expenditure), 2013 – 2020f
Sources: VIRAC collected, BCG
Million people
THE CONTENT IS INTENTIONALLY REMOVED FOR DEMO
PURPOSE

1. Business Environment
1.1. Macroeconomic Situation
9
Sources: VIRAC, MARD
In the first 9 months of 2017, the vegetables and fruits product is 1st
ranked, replacing coffee to be the main agricultural products of Vietnam
export structure.
Cashew has always been the main agricultural export product in many
years of Vietnam.
Sources: VIRAC, MARD
Million USD
The export structure of main agricultural
export products of Vietnam, 9M/2017
Price and cashew proportion in main agricultural products, 2010 – 9M/2017e
THE CONTENT IS INTENTIONALLY REMOVED FOR DEMO
PURPOSE

1. Business Environment
1.1. Macroeconomic Situation
10
Sources: VIRAC, SBV
The exchange rates of VND/USD in the first 9 months of 2017 remains
stable which is around 22,400.
• According to the national financial supervisory, in the last months of
2017, the exchange rate of VND/USD will be strongly impacted by
the demand for foreign currency resulted from high trade deficit.
• Currently, cashew of Vietnam is mainly used to export and America
is the greatest market for Vietnam.
Sources: VIRAC, Nielsen
• Consumer Confidence Index of Vietnam increased sharply in
Q4/2016 by 112 points.
Exchange rate of VND/USD, 2016-9/2017
Consumer Confidence Index, 2014 - 2016
THE CONTENT IS INTENTIONALLY REMOVED FOR DEMO
PURPOSE

Content
11
1. Business Environment
1.1 Macroeconomic Situation
1.2 Legal Framework
1.3 Free Trade Agreements

1. Business Environment
1.2. Legal Framework
12
• QCVN 01-08:2009/BNNPTNT
• QCVN 01–27: 2010/BNNPTNT:
• TCVN 4850:2010
Abbreviations used to classify the cashew kernels
Descriptions English Abbreviations
THE CONTENT IS INTENTIONALLY REMOVED FOR DEMO
PURPOSE

1. Business Environment
1.2. Legal Framework
13
Quality classification of cashew kernels
Levels SignsNumber of
kernels/kg
Number of
kernels/lbTradenames Descriptions
THE CONTENT IS INTENTIONALLY REMOVED FOR DEMO
PURPOSE

1. Business Environment
1.2. Legal Framework
14
Levels SignsNumber of
kernels/kg
Number of
kernels/lbTradenames Descriptions
Quality classification of cashew kernels (continue)
THE CONTENT IS INTENTIONALLY REMOVED FOR DEMO
PURPOSE

1. Business Environment
1.2. Legal Framework
15
• TCCS 2013 /HĐT/VINACAS:
General technical requirements:
Quality classification requirements
Classification on raw cashew nuts
No. Cashew nuts which DO NOT pass through the tube
with hole diameter as follows
Size (Cashew nuts/kg)
THE CONTENT IS INTENTIONALLY REMOVED FOR DEMO
PURPOSE

1. Business Environment
1.2. Legal Framework
16
Types of export and import taxes applied for cashew industry
Group of regulations on import and export cashew
THE CONTENT IS INTENTIONALLY REMOVED FOR DEMO
PURPOSE

Content
17
1. Business Environment
1.1 Macroeconomic situation
1.2 Legal Framework
1.3 Free Trade Agreements

1. Business Environment
1.3 Free Trade Agreements
18
Vietnam trade integration process from 1995 to present
Until the end of 2016, Vietnam has signed, implemented, and is negotiating a total of 16 FTAs. Accession to international trade agreements brings
opportunities and challenges for domestic firms.
THE CONTENT IS INTENTIONALLY REMOVED FOR DEMO
PURPOSE

1. Business Environment
1.3 Free Trade Agreements
19
Vietnam – EU (EVFTA) free trade agreement
• Opportunities:
• Challenges:
• Solutions:
THE CONTENT IS INTENTIONALLY REMOVED FOR DEMO
PURPOSE

1. Business Environment
1.3 Free Trade Agreements
20
RCEP trade agreement
• Opportunities:
• Challenges:
Solutions:
THE CONTENT IS INTENTIONALLY REMOVED FOR DEMO
PURPOSE

Content
21
2. Global Cashew Industry
2.1 Industry Value Chain
2.2 Production
2.3 Consumption
2.4 Export – Import
2.5 Price Movement
2.6 Current situation in some typical countries

2. Global cashew industry
2.1 Industry value chain
22
Industry value chain
Sources, VIRAC collected
THE CONTENT IS INTENTIONALLY REMOVED FOR DEMO
PURPOSE

Content
23
2. Global Cashew Industry
2.1 Industry Value Chain
2.2 Production
2.3 Consumption
2.4 Export – Import
2.5 Price Movement
2.6 Current situation in some typical countries
24
Sources: VIRAC, Cashew Handbook
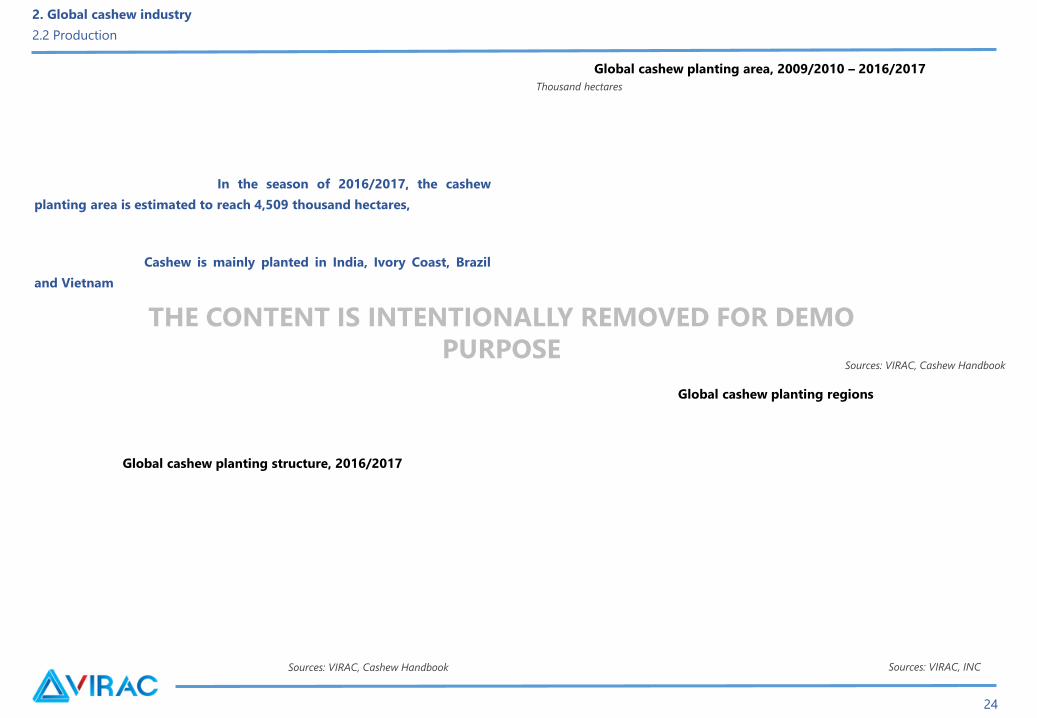
In the season of 2016/2017, the cashew
planting area is estimated to reach 4,509 thousand hectares,
Cashew is mainly planted in India, Ivory Coast, Brazil
and Vietnam
Thousand hectares
Sources: VIRAC, Cashew Handbook
2. Global cashew industry
2.2 Production
Global cashew planting regions
Sources: VIRAC, INC
Global cashew planting structure, 2016/2017
Global cashew planting area, 2009/2010 – 2016/2017
THE CONTENT IS INTENTIONALLY REMOVED FOR DEMO
PURPOSE

25
Thousand tons
Sources: VIRAC, Cashew Handbook
2. Global cashew industry
2.2 Production
Sources: VIRAC, Cashew Handbook
India is the largest country of producing raw cashew with 851
thousand tons in the season of 2016/22017
Global raw cashew production output, 2009/2010
– 2016/2017
Global structure of cashew production, 2016/2017
The raw cashew production output is continuously increasing by CARG = 3%
during the 2009/2010 – 2016/2017 season
THE CONTENT IS INTENTIONALLY REMOVED FOR DEMO
PURPOSE

The global cashew kernel production output in the season
2016/2017 continues reaches 754.7 thousand tons and increases by
4% compared to the previous season.
The main producer in season 2016/2017 is the Ivory Coast.
In the season 2016/2017, the production value
reaches about 6,720 million USD, increases by 34.4% compared to
the last season.
26
Thousand tons
Sources: VIRAC, INC
2. Global cashew industry
2.2 Production
Sources: VIRAC, INC Sources: VIRAC, INC
Million USD
Global cashew kernel production output, 2006/2007 –
2016/2017
Cashew kernel production structure, 2016/2017 Global cashew production value, 2006/2007 – 2016/2017
THE CONTENT IS INTENTIONALLY REMOVED FOR DEMO
PURPOSE

In the season 2016/2017, cashew is 4th ranked in terms of production
output
However, the production value is 2nd ranked with 6,726 million USSD
27
Million USD
2. Global cashew industry
2.2 Production
Sources: VIRAC, INC
Sources: VIRAC, INC
Thousand tons
The global cashew industry is facing demand exceeding supply
problem.
Production value of types of raw nut in the world,
2016/2017
Production output of cashew nuts compared to other nuts, 2006/2007 –
2016/2017
THE CONTENT IS INTENTIONALLY REMOVED FOR DEMO
PURPOSE

Content
28
2. Global Cashew Industry
2.1 Industry Value Chain
2.2 Production
2.3 Consumption
2.4 Export – Import
2.5 Price Movement
2.6 Current situation in some typical countries

The demand for cashew kernel consumption is estimated to reach 787
thousand tons, increase by 10% compared to 2016
The
main consumption markets are India, America, Europe and Middle East
Netherlands is now the highest cashew consumption per capita country in
the world, approximately 1.39kg/person/year in 2015.
29
2. Global cashew industry
2.3 Consumption
Thousand tons
Kg/year
Sources: VIRAC, INC Sources: VIRAC, INC
Sources: VIRAC, INC
Kg/year
Global cashew kernel consumption
structure, 2016e
Global cashew kernel consumption, 2011 – 2017e
Consumption per capita of some typical cashew
consumption countries, 2011 - 2015
THE CONTENT IS INTENTIONALLY REMOVED FOR DEMO
PURPOSE

30
2. Global cashew industry
2.3 Consumption
Sources: VIRAC, INC
From 2010 to present, the demand has gone up by 53% and within 7 years, there are at least 4 years that the demand exceeds the supply
The increase in demand is strong in China and Europe – 2 markets which account for 70% of the consumption globally, making the export rise to a record
number in history which was 503,713 thousand tons in 2014.
Thousand tons
Consumption of dried nuts in the world, 2011 - 2015
THE CONTENT IS INTENTIONALLY REMOVED FOR DEMO
PURPOSE
Content
31
2. Global Cashew Industry
2.1 Industry Value Chain
2.2 Production
2.3 Consumption
2.4 Export – Import
2.5 Price Movement
2.6 Current situation in some typical countries
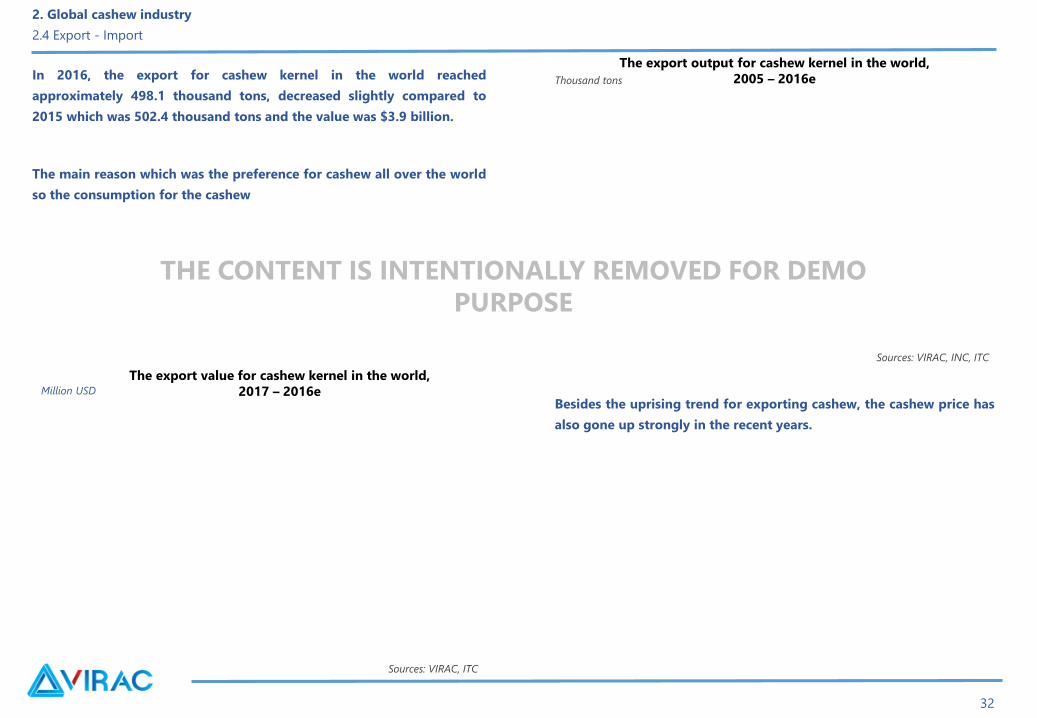
In 2016, the export for cashew kernel in the world reached
approximately 498.1 thousand tons, decreased slightly compared to
2015 which was 502.4 thousand tons and the value was $3.9 billion.
The main reason which was the preference for cashew all over the world
so the consumption for the cashew
32
2. Global cashew industry
2.4 Export - Import
Sources: VIRAC, INC, ITC
Thousand tons
Sources: VIRAC, ITC
Million USD
Besides the uprising trend for exporting cashew, the cashew price has
also gone up strongly in the recent years.
The export value for cashew kernel in the world,
2017 – 2016e
The export output for cashew kernel in the world,
2005 – 2016e
THE CONTENT IS INTENTIONALLY REMOVED FOR DEMO
PURPOSE

33
2. Global cashew industry
2.4 Export - Import
Sources: VIRAC,, ITC
Sources: VIRAC, ITC
Vietnam is now the largest cashew exporter in the world with the export
output accounting for 56% of the global output in 2016.
The second place is India with the output accounting for 17% of the global
output in 2016
America is the largest importer of cashew in the world
In Europe, Germany, Netherlands, France, Britain and Belgium are the great
importing of cashew countries
Cashew kernel import structure in the world, 2016e
Cashew kernel export structure in the world, 2016e
THE CONTENT IS INTENTIONALLY REMOVED FOR DEMO
PURPOSE

Content
34
2. Global Cashew Industry
2.1 Industry Value Chain
2.2 Production
2.3 Consumption
2.4 Export – Import
2.5 Price Movement
2.6 Current situation in some typical countries

In the first 9 months of 2017, the price movement has the tendency to
increase sharply.
35
2. Global cashew industry
2.5 Price movement
Sources: VIRAC, CBI Ministry of Foreign Affairs
In general, manufacture cost, insurances and transportation of raw cashew
account for about 50% of the cashew kernel’s retail price in the market
Cashew price in the world, 1/2015 – 10/2017
Sources: VIRAC collected
USD/kg
Analysis of cashew’s retail price by contribution ratio,
2016
THE CONTENT IS INTENTIONALLY REMOVED FOR DEMO
PURPOSE

Nội dung
36
2. Global Cashew Industry
2.1 Industry Value Chain
2.2 Production
2.3 Consumption
2.4 Export – Import
2.5 Price Movement
2.6 Current situation in some typical countries

The output of raw cashew in the season 2016/17 reached about 851 thousand
tons, accounting for 23% of the global output.
India is the largest consumption of cashew kernel country in the world, the
consumption is 25% of the total global supply
The cashew export of India is estimated to reach 176,000 tons in the season
2017/18, it increases compared to the season 2016/17 which was 155,000 tons
37
Thousand hectares
Sources: VIRAC, Cashew Handbook
Sources: VIRAC, Cashew Handbook, INC
Thousand tons
2. Global cashew industry
2.6 Current situation in some typical countries - India
Cashew planting area in India, 2009/2010 – 2016/2017
The production output in India, 2009/2010 – 2016/2017
THE CONTENT IS INTENTIONALLY REMOVED FOR DEMO
PURPOSE

38
Thousand hectares
Sources: VIRAC, Cashew Handbook
Sources: VIRAC, Cashew Handbook, INC
Thousand tons
2. Global cashew industry
2.6 Current situation in some typical countries – Ivory Coast
Ivory Coast is 2nd ranked in producing cashew in the world,Cashew planting area in Ivory Coast, 2010 – 2017e
The production output in Ivory Coast, 2009/2010 – 2016/2017
THE CONTENT IS INTENTIONALLY REMOVED FOR DEMO
PURPOSE

39
Thousand hectares
Sources: VIRAC, Cashew Handbook
Sources: VIRAC, Cashew Handbook, INC
Thousand tons
2. Global cashew industry
2.6 Current situation in some typical countries
Brazil always plays an important role which is one of the leading
countries in the world to produce, process and export cashew.
However, in the recent years, due to droughts in most states of
northeastern Brazil, their entire production system has declined.
The strong decline in production since 2012 has impacted on the
industry of processing and export
The output in 2018 is expected to be good like 2011 if the amount of
rain remains stable
The production output in Brazil, 2009/2010 – 2016/2017
Cashew planting area in Brazil, 2009/2010 – 2016/2017
THE CONTENT IS INTENTIONALLY REMOVED FOR DEMO
PURPOSE

Content
40
3. Cashew Market in Vietnam
3.1 Definitions and Classification
3.2 Process and Production Technology
3.3 Production
3.4 Consumption
3.5 Export - Import
3.6 Price

Season of cashew
The countries in the north of the equator, including India, Vietnam and west African have
the early harvest time from the beginning of the year to mid-year.
41
3. Cashew market in Vietnam
3.1 Definitions and Classification
Flowering time and harvest of cashew
THE CONTENT IS INTENTIONALLY REMOVED FOR DEMO
PURPOSE

Some terminologies and definitions
Classification of cashew kernels
42
The components of cashew
Category Commercial terminologies Descriptions
3. Cashew market in Vietnam
3.1 Definitions and Classification
THE CONTENT IS INTENTIONALLY REMOVED FOR DEMO
PURPOSE

Quality tolerance
43
Percent Defective Allowable The best types Type I Type II
Sources: VIRAC collected, INC
THE CONTENT IS INTENTIONALLY REMOVED FOR DEMO
PURPOSE
3. Cashew market in Vietnam
3.1 Definitions and Classification

Cashew kernel type I (scorched/dessert - LB)
44
The best type of cashew kernel (white)
White pieces Scorched pieces
3. Cashew market in Vietnam
3.1 Definitions and Classification
THE CONTENT IS INTENTIONALLY REMOVED FOR DEMO
PURPOSE

Content
45
3. Cashew Market in Vietnam
3.1 Definitions and Classification
3.2 Process and Production Technology
3.3 Production
3.4 Consumption
3.5 Export - Import
3.6 Price

46
3. Cashew market in Vietnam
3.2 Process and production technology
Cashew processing
THE CONTENT IS INTENTIONALLY REMOVED FOR DEMO
PURPOSE

47
Step 1: Moisture
Raw cashew classification machine
3. Cashew market in Vietnam
3.2 Process and production technology
THE CONTENT IS INTENTIONALLY REMOVED FOR DEMO
PURPOSE

48
Step 2: Heat treatment (Steaming/Roasting): The choice is either steaming or roasting
- There are two methods for roasting which are simply direct roasting in oil the cashew shells
- Steaming
Cashew roasted machine
THE CONTENT IS INTENTIONALLY REMOVED FOR DEMO
PURPOSE
3. Cashew market in Vietnam
3.2 Process and production technology

49
Step 3: Cutting and splitting
Step 4: Drying
Cashew cut and split machine
Step 5: Silk peeling off
Step 6: Classifying
.
Cashew silk peeled off machine
3. Cashew market in Vietnam
3.2 Process and production technology
THE CONTENT IS INTENTIONALLY REMOVED FOR DEMO
PURPOSE

50
Step 7: Quality control/Fumigation
Step 8: Packaging
3. Cashew market in Vietnam
3.2 Process and production technology
THE CONTENT IS INTENTIONALLY REMOVED FOR DEMO
PURPOSE
Content
51
3. Cashew Market in Vietnam
3.1 Definitions and Classification
3.2 Process and Production Technology
3.3 Production
3.4 Consumption
3.5 Export - Import
3.6 Price
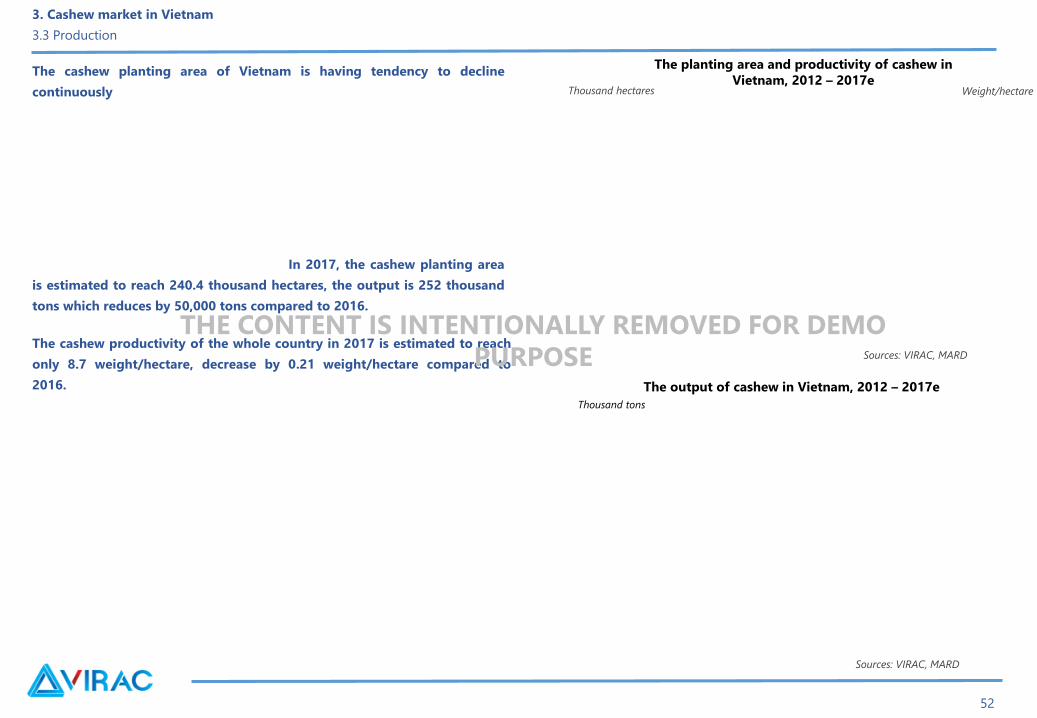
The cashew productivity of the whole country in 2017 is estimated to reach
only 8.7 weight/hectare, decrease by 0.21 weight/hectare compared to
2016.
52
3. Cashew market in Vietnam
3.3 Production
Thousand hectares
Sources: VIRAC, MARD
Weight/hectare
The cashew planting area of Vietnam is having tendency to decline
continuously
In 2017, the cashew planting area
is estimated to reach 240.4 thousand hectares, the output is 252 thousand
tons which reduces by 50,000 tons compared to 2016.
Thousand tons
Sources: VIRAC, MARD
The planting area and productivity of cashew in
Vietnam, 2012 – 2017e
The output of cashew in Vietnam, 2012 – 2017e
THE CONTENT IS INTENTIONALLY REMOVED FOR DEMO
PURPOSE
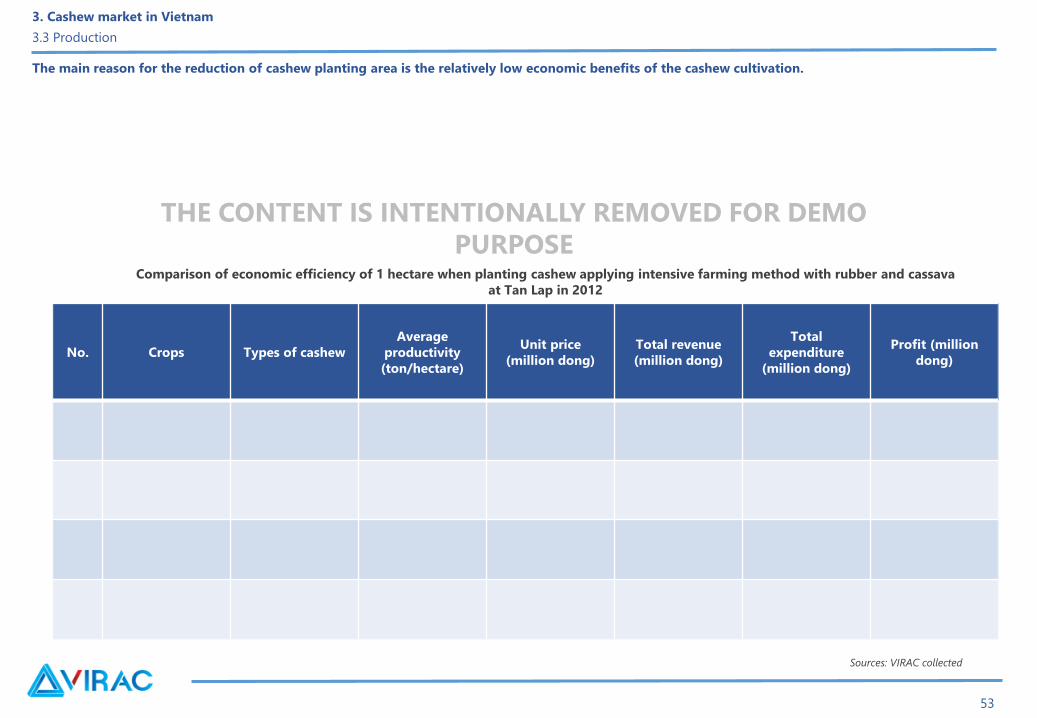
The main reason for the reduction of cashew planting area is the relatively low economic benefits of the cashew cultivation.
53
No. Crops Types of cashew
Average
productivity
(ton/hectare)
Unit price
(million dong)
Total revenue
(million dong)
Total
expenditure
(million dong)
Profit (million
dong)
Comparison of economic efficiency of 1 hectare when planting cashew applying intensive farming method with rubber and cassava
at Tan Lap in 2012
Sources: VIRAC collected
3. Cashew market in Vietnam
3.3 Production
THE CONTENT IS INTENTIONALLY REMOVED FOR DEMO
PURPOSE

Additionally, the productivity and planting area declined due to the impact of the weather.
Currently, Binh Phuoc is the province which has the largest planting area with 134,170 ha,
accounting for 44.7% of the country’s planting area. The cashew planting area in the
regions of the province
54
Sources: VIRAC collected
Dong Nai is 2nd ranked in terms of cashew planting area, now it has 38,000 ha of planting area, accounting for 12.7% of the country’s are and decreasing
thousands of hectare compared to previous season.
The planting area of some provinces in Tay Nguyen like Đắk Lắk, Gia Lai, Kon Tum, Đắk Nông, Lâm Đồng is reducing fast, which remain only 73,000 ha in
2016,
Cashew planting area structure, 2017e
3. Cashew market in Vietnam
3.3 Production
THE CONTENT IS INTENTIONALLY REMOVED FOR DEMO
PURPOSE

55
Thousand tonsThe cashew production industry in Vietnam has gained some remarkable
achievements, with 1st ranking in cashew kernel exports, 2nd ranking in
processing and 3rd in productivity and output in the world.
the domestic production output only meets 1/3
of the demands of the processing and export enterprises.
Thus, although Vietnam is a great export country, it has just participated in
simple processing, which is equal to 18% of the cashew value chain.
According to the Department of Agriculture, Forestry, Fishing and Salt
Processing, Vietnam has 345 businesses taking part in exporting cashew,
Sources: VIRAC, MARD
Cashew production situation, 2010 – 2017e
3. Cashew market in Vietnam
3.3 Production
THE CONTENT IS INTENTIONALLY REMOVED FOR DEMO
PURPOSE

To improve the situation which the domestic production only meets 1//3 of the demand from the processing and export enterprises, making these
business face many risks because of difficulty in input quality control, Vinacas has cooperated with the Ministry of Agriculture, Forestry and Fishing
Cambodia and also this country’s enterprises to build 1-million-ton of raw material region in the coming times.
56
Quality of cashew kernel in Vietnam
3. Cashew market in Vietnam
3.3 Production
THE CONTENT IS INTENTIONALLY REMOVED FOR DEMO
PURPOSE

57
Besides the production for cashew kernels, nowadays, these by-products are used by many companies to produce export products that bring in hundreds
of millions of dollars.
Some difficulties of cashew businesses in Vietnam
3. Cashew market in Vietnam
3.3 Production
THE CONTENT IS INTENTIONALLY REMOVED FOR DEMO
PURPOSE

Content
58
3. Cashew Market in Vietnam
3.1 Definitions and Classification
3.2 Process and Production Technology
3.3 Production
3.4 Consumption
3.5 Export - Import
3.6 Price

Cashew kernel wholes Cashew kernel butts Cashew kernel baby bits Cashew kernel powder Cashew kernel milk
Uses of cashew kernels
59
3. Cashew Market in Vietnam
3.4 Consumption
THE CONTENT IS INTENTIONALLY REMOVED FOR DEMO
PURPOSE

60
The domestic consumption for cashew kernel accounts for 10% and the rest
is for export. It is forecasted that the domestic consumption will rise in the
next few years.
Sources: VIRAC, VITIC
Tons
The domestic consumption of cashew in 2017 is estimated to reach
30.5 million tons
Domestic consumption of cashew kernel, 2012 – 2017e
3. Cashew Market in Vietnam
3.4 Consumption
THE CONTENT IS INTENTIONALLY REMOVED FOR DEMO
PURPOSE
Content
61
3. Cashew Market in Vietnam
3.1 Definitions and Classification
3.2 Process and Production Technology
3.3 Production
3.4 Consumption
3.5 Export - Import
3.6 Price

In the first 9 months of 2017, the processing and export enterprises reach
258.4 thousand tons of cashew, the exports is 2,561 million tons.
The cashew export of Vietnam continues to be 1st ranked in the
world when accounting for 50% of the raw processing cashew and above
60% export cashew kernel globally.
62
3. Cashew market in Vietnam
3.5 Export and Import – Export
Thousand tons
Sources: VIRAC, GDVC
Million USD
Value and output of cashew exports in Vietnam,
2013 – 9M/2017e
THE CONTENT IS INTENTIONALLY REMOVED FOR DEMO
PURPOSE

In terms of exported cashew categories,
63
Sources: VIRAC, GDVC
There are 80 countries which import cashew of Vietnam currently, in
specific, America is the largest importer with 35% of the output,
Sources: VIRAC, GDVC
Output structures of cashew exports by type,
9M/2017e
Market structures of cashew exports by output, 9M/2017e
3. Cashew market in Vietnam
3.5 Export and Import – Export
THE CONTENT IS INTENTIONALLY REMOVED FOR DEMO
PURPOSE

In the first 9 months of 2017, top 20 of cashew export businesses have
exported 111,604 tons, accounting for 43.59% of the total exports of
the whole industry
64
Tons
Sources VIRAC, GDVC
Sources: VIRAC, GDVC
Cashew export structures, 9M/2017e
Top largest cashew export enterprises in Vietnam, 9M/2017
3. Cashew market in Vietnam
3.5 Export and Import – Export
THE CONTENT IS INTENTIONALLY REMOVED FOR DEMO
PURPOSE

65
Thousand tons
Sources: VIRAC, GDVC
Million USD
Sources: VIRAC, GDVC
Cashew imports of Vietnam in September/2017 reduced strongly compared
to the previous month of the same period last year due to the decline of
the cashew material supply.
Until the end of September, Vietnam has imported over 1.1 million tons of
raw cashew with the total imports reaching above $2.18 billion, increasing
40.8% in terms of weigh and 81.2% of value compared to the same period
in 2016.
The value and imports of cashew in Vietnam, 2013
9M/2017e
Cashew import market by value, 9M/2017e
3. Cashew market in Vietnam
3.5 Export and Import – Import
THE CONTENT IS INTENTIONALLY REMOVED FOR DEMO
PURPOSE

Content
66
3. Cashew Market in Vietnam
3.1 Definitions and Classification
3.2 Process and Production Technology
3.3 Production
3.4 Consumption
3.5 Export - Import
3.6 Price

67
3. Cashew market in Vietnam
3.6 Price
The cashew farmers are excited due to the high purchase price in 2017 with
50,000 VND/kg of dry and warehousing nuts averagely (the average price in 2016 is 38,000 VND/kg).
In particular, the dry cashew kernel which is purchase in Binh Phuoc in the first 9 months of 2017 is averagely 54,000 VND/kg, increasing by 35%
compared to the same period in 2016.
It is forecasted that the price in the last months of 2017 and the beginning months in 2018 will remain high
Source: VIRAC collected
VND/kg
Price of dry cashew in Binh Phuoc, 1/2014 – 8/2017
THE CONTENT IS INTENTIONALLY REMOVED FOR DEMO
PURPOSE

Price of export cashew:
Import price:
68
Sources: VIRAC, GDVCSource: VIRAC collected
USD/ton
Average import cashew price, 1/2013 – 9/2017 Export price FOB HCM, 11/2016 – 9/2017
3. Cashew market in Vietnam
3.6 Price
THE CONTENT IS INTENTIONALLY REMOVED FOR DEMO
PURPOSE

4 Risks in Vietnam market
Content
69

Risks due to the dependence on materials
Risks when importing cashew
Competitive risks in cashew export market
70
4. Risks in Vietnam market
THE CONTENT IS INTENTIONALLY REMOVED FOR DEMO
PURPOSE

Interest rate risks
Weather risks
Economic risks
Environment risks
Other risks
71
4. Risks in Vietnam market
THE CONTENT IS INTENTIONALLY REMOVED FOR DEMO
PURPOSE
72
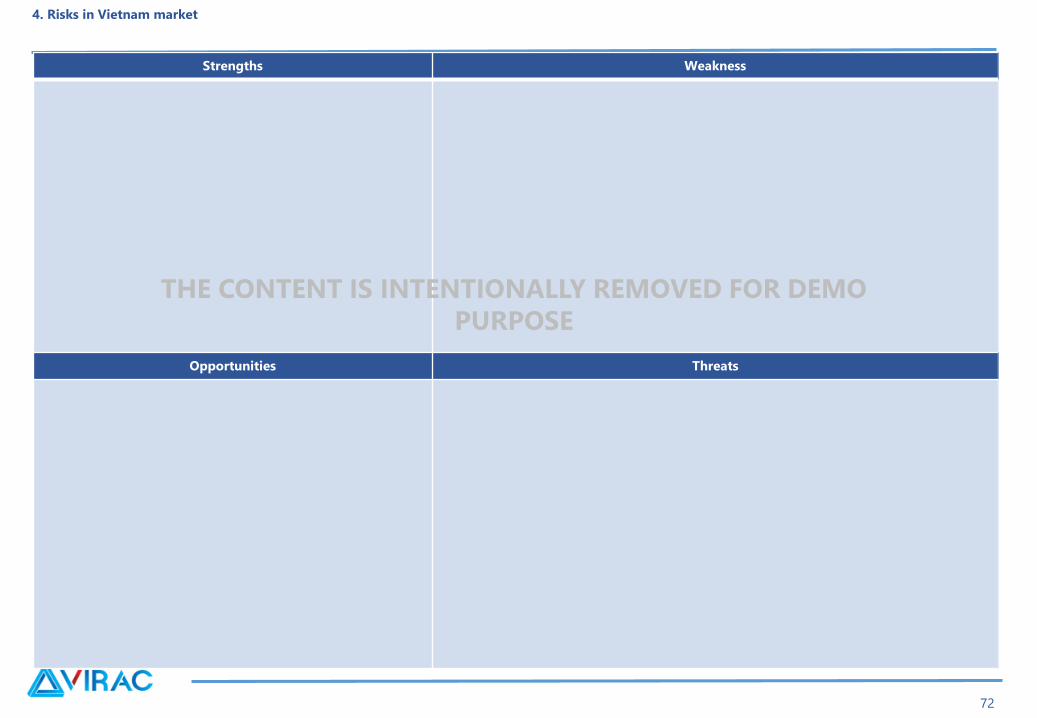
4. Risks in Vietnam market
Strengths Weakness
Opportunities Threats
THE CONTENT IS INTENTIONALLY REMOVED FOR DEMO
PURPOSE

5 Planning
Content
73

74
On February, 13th, 2015, Ministry of Agriculture and Rural Development has enacted the decision 579/QĐ-BNN-TT in regard to approving of
development plan for cashew industry up to 2020 and the orientation to 2030.
Development goals
Development plan up to 2020 and orientation to 2030
5. Planning
THE CONTENT IS INTENTIONALLY REMOVED FOR DEMO
PURPOSE

75
2. Planning for cashew processing
5. Planning
THE CONTENT IS INTENTIONALLY REMOVED FOR DEMO
PURPOSE

6 Prospects and Forecasts
Content
76

6. Prospects and Forecasts
Prospects
77
- Cashew industry in the world
- There are a lot of opportunities for the prospects of cashew industry in Vietnam to grow in the next few years
THE CONTENT IS INTENTIONALLY REMOVED FOR DEMO
PURPOSE

6. Prospects and Forecasts
Forecasts
78
- Cashew industry in the world
Global cashew council (GCC) has forecasted the total global output of the season 2017/2018 will reach 7.4 million tons of fresh cashew, which is equal to
3.322 million tons of raw cashew
- Forecast for Vietnam cashew industry
In 2017, the whole cashew industry will make efforts to export 330 thousand tons every types of cashew kernel with the exports of $3.3 billion
In 2018, Vinacas sets goal for reaching the exports $3.5 to $3.7 billion of the whole industry
It is predicted that the domestic material price will remain high in the last months of 2017 and the beginning months of 2018 due to the shortage of
processing and export material.
THE CONTENT IS INTENTIONALLY REMOVED FOR DEMO
PURPOSE

6. Prospects and Forecast
Forecast
79
Forecast in 2018 shows the loss of revenue of cashew output, being
reduced after the difficulties in weather in 2016 and 2017
In 2020, VIRAC predicts that the production output will increase slightly
and reach about 300 thousand tons due to the recovery of cashew
planting area
Thousand tons
Source: VIRAC
Thousand tons
In regard to cashew export in the next few years, it is predicted that
Vietnam will still remain 1st ranked country in exporting cashew in the
world. The forecast of VIRAC is the growth of Vietnam cashew export
output by 2.2%/year averagely from 2017 to 2020.
Forecast for cashew production output in
Vietnam, 2012 – 2020f
Forecast for cashew export output in Vietnam, 2013
– 2020f
THE CONTENT IS INTENTIONALLY REMOVED FOR DEMO
PURPOSE

Content
80
7. Enterprise analysis
81
7. Introduction of enterprises
Top of cashew processing and export enterprises of Vietnam
Names Addresses Total asset in
2016 (billion
VND)
Net revenue in
2016 (billion
VND)
THE CONTENT IS INTENTIONALLY REMOVED FOR DEMO
PURPOSE

OLAM VIETNAM LLC
82
Hoang Gia Luan Trade – Service LLC
THE CONTENT IS INTENTIONALLY REMOVED FOR DEMO
PURPOSE
Introduction of enterprises

83
Hanoi Trade Corporation - HAPRO
Hanoi Trade Corporation operates in some fields
Export:
Import :
Import market
THE CONTENT IS INTENTIONALLY REMOVED FOR DEMO
PURPOSE
Introduction of enterprises

84
Long Son Joint Stock Company
Annual revenue:
Total number of employees:
Rank:
Main business sectors:.
Additional business:
Long Sơn has 8 big factories which
producing cashew
THE CONTENT IS INTENTIONALLY REMOVED FOR DEMO
PURPOSE
Introduction of enterprises

85
Thao Nguyen Co., LTD
Total number of employees:
Main business sectors:
Production and business capacity of Thao Nguyen LTD mainly includes:
Export market consists of:
THE CONTENT IS INTENTIONALLY REMOVED FOR DEMO
PURPOSE
Introduction of enterprises

86
Hoang Son I Joint Stock Company
Address:
Main business sectors
Material sources
Export market:
Manufacture factory: Quality standard:
Main products:
THE CONTENT IS INTENTIONALLY REMOVED FOR DEMO
PURPOSE
Introduction of enterprises

87
Hai Viet LLC
Headquarter address:
Main business sectors:
Rals International Vietnam Co., LTD
Address:
Main business sectors:
Exports:
Phuc Vinh Manufacture – Trade LLC
THE CONTENT IS INTENTIONALLY REMOVED FOR DEMO
PURPOSE
Introduction of enterprises

88
Long An Processing and Export Joint Stock Company (LAFOOCO)
THE CONTENT IS INTENTIONALLY REMOVED FOR DEMO
PURPOSE
Introduction of enterprises

Content
89
7. Enterprise Analysis
7.1 Profitability
7.2 Operability
7.3 Performance efficiency
7.4 Profit Ratio

90
THE CONTENT IS INTENTIONALLY REMOVED FOR DEMO
PURPOSE
Billion VND
Source: VIRAC
In 2016, most of the enterprises in the industry have positive growth of net revenue and the average growth reaches 13.9%.
Olam Vietnam is the largest revenue enterprise in the industry due to the big-scaled operation with 10 agriculture processing factories in the Middle and
the Southern, is one of the greatest corporations that exports cashew, pepper and instant coffee in Vietnam
7. Enterprise analysis
7.1 Profitability
Net revenue, 2015 - 2016
91
Billion VND
Source: VIRAC
In 2016, most of the enterprises have their gross profit margin reduced compared to 2015
Gross profit margin, 2015 - 2016
7. Enterprise analysis
7.1 Profitability
THE CONTENT IS INTENTIONALLY REMOVED FOR DEMO
PURPOSE

Content
92
7. Enterprise Analysis
7.1 Profitability
7.2 Operability
7.3 Performance efficiency
7.4 Profit Ratio
93
Source: VIRAC
It can be seen that the common point of the enterprise in the industry is the main way to have the capital which is to borrow when the ratio between
debt and total asset is very high, above 70%, especially with the export business which have the rate above 90%
Repayment ability, 2015 - 2016
7. Enterprise analysis
7.2 Operability
THE CONTENT IS INTENTIONALLY REMOVED FOR DEMO
PURPOSE

94
Source: VIRAC
THE CONTENT IS INTENTIONALLY REMOVED FOR DEMO
PURPOSE
Hai Viet và Phuc Vinh is 2 companies with the highest pay ratio because they have the least debt in the top of cashew enterprises, which use mostly equity
capital
Pay ratio, 2015 -2016
7. Enterprise analysis
7.2 Operability

Content
95
7. Enterprise Analysis
7.1 Profitability
7.2 Operability
7.3 Performance efficiency
7.4 Profit Ratio

96
Source: VIRAC
THE CONTENT IS INTENTIONALLY REMOVED FOR DEMO
PURPOSE
Hoang Gia Luan Company has the fastest fixed asset turnover in the industry
On the contrary, Olam VN, Hapro, Hoang Son I have lower fixed asset turnover than the average level of the industry.
7. Enterprise analysis
7.3 Performance efficiency
Fixed asset turnover, 2015 - 2016

Content
97
7. Enterprise Analysis
7.1 Profitability
7.2 Operability
7.3 Performance efficiency
7.4 Profit Ratio
THE CONTENT IS INTENTIONALLY REMOVED FOR DEMO
PURPOSE
98
Source: VIRAC
Thao Nguyen và Long Son are the two companies which have the highest profit ratio in the top of cashew enterprise. ROA of Thao Nguyen in 2016
reached 22%, meanwhile the ROE in 2016 was 14.3$
Rals International VN has the lowest profit ratio in the top of enterprise while ROA in 2016 was -44.4%, ROE was -2579%.
In general, the profit ratio of cashew enterprises in 2016 increased slightly compared to 2015.
7. Enterprises analysis
7.4 Profit ratio
Profit ratio, 2015 - 2016

Top cashew export enterprises having reputation in 2015 due to the Ministry of Industry and Trade
99
Appendix
No. Name Exports (kg) Units for selection
Sources: VIRAC, Ministry of Industry and Trade
THE CONTENT IS INTENTIONALLY REMOVED FOR DEMO
PURPOSE

Content
100
Appendix for financial statement

Appendix
Financial Statement
101
Olam Vietnam LLC
BALANCE SHEET
Unit: VND 2015 2016
A. CURRENT ASSETS
I. Cash and petty cash
II. Temporary investments
III. Accounts receivable
1. From customers
IV. Inventory
B. LONG-TERM ASSETS
TOTAL ASSETS
A. CURRENT LIABILITIES
I. Current liabilities
1. Loan and Current liabilities
2. Taxes and accounts payable to the state
II. Long-term liabilities
1. Loan and Long-term liabilities
2. Long-term accounts payable
B. OWNER'S EQUITY
TOTAL LIABILITIES AND OWNER'S EQUITY
BUSINESS RESULTS REPORT
Unit: VND 2015 2016
Net revenue from sales and services
Cost of goods sold and services
Gross profit of goods sold and services
Profit from financial activities
Financial cost
Interest expense
Cost of goods sold
Administration cost
Net profit from business activities
Gross profit before tax
Current corporate income tax expense
Deferred corporate income tax expense
Profit after tax
CASH FLOW STATEMENT
Unit: VND 2015 2016
I. Cash flow from operations
Depreciation of fixed assets
Gain (Loss) from unrealized exchange rate differences
Net Cash flow from operations
II. Cash flow from investing
Shopping, building fixed assets and other long-term
assets
Net Cash flow from investing
III. Cash flow from financing
Net cash flow from financing
Net cash flow during the year
THE CONTENT IS INTENTIONALLY REMOVED FOR DEMO
PURPOSE

Appendix
Financial Statement
102
Hoang Gia Luan Trade – Service LLC
BALANCE SHEET
Unit: VND 2015 2016
A. CURRENT ASSETS
I. Cash and petty cash
II. Temporary investments
III. Accounts receivable
1. From customers
IV. Inventory
B. LONG-TERM ASSETS
TOTAL ASSETS
A. CURRENT LIABILITIES
I. Current liabilities
1. Loan and Current liabilities
2. Taxes and accounts payable to the state
II. Long-term liabilities
1. Loan and Long-term liabilities
2. Long-term accounts payable
B. OWNER'S EQUITY
TOTAL LIABILITIES AND OWNER'S EQUITY
BUSINESS RESULTS REPORT
Unit: VND 2015 2016
Net revenue from sales and services
Cost of goods sold and services
Gross profit of goods sold and services
Profit from financial activities
Financial cost
Interest expense
Cost of goods sold
Administration cost
Net profit from business activities
Gross profit before tax
Current corporate income tax expense
Deferred corporate income tax expense
Profit after tax
CASH FLOW STATEMENT
Unit: VND 2015 2016
I. Cash flow from operations
Depreciation of fixed assets
Gain (Loss) from unrealized exchange rate differences
Net Cash flow from operations
II. Cash flow from investing
Shopping, building fixed assets and other long-term
assets
Net Cash flow from investing
III. Cash flow from financing
Net cash flow from financing
Net cash flow during the year
THE CONTENT IS INTENTIONALLY REMOVED FOR DEMO
PURPOSE

Appendix
Financial Statement
103
Hanoi Trade Corporation - HAPRO
BALANCE SHEET
Unit: VND 2015 2016
A. CURRENT ASSETS
I. Cash and petty cash
II. Temporary investments
III. Accounts receivable
1. From customers
IV. Inventory
B. LONG-TERM ASSETS
TOTAL ASSETS
A. CURRENT LIABILITIES
I. Current liabilities
1. Loan and Current liabilities
2. Taxes and accounts payable to the state
II. Long-term liabilities
1. Loan and Long-term liabilities
2. Long-term accounts payable
B. OWNER'S EQUITY
TOTAL LIABILITIES AND OWNER'S EQUITY
BUSINESS RESULTS REPORT
Unit: VND 2015 2016
Net revenue from sales and services
Cost of goods sold and services
Gross profit of goods sold and services
Profit from financial activities
Financial cost
Interest expense
Cost of goods sold
Administration cost
Net profit from business activities
Gross profit before tax
Current corporate income tax expense
Deferred corporate income tax expense
Profit after tax
CASH FLOW STATEMENT
Unit: VND 2015 2016
I. Cash flow from operations
Depreciation of fixed assets
Gain (Loss) from unrealized exchange rate differences
Net Cash flow from operations
II. Cash flow from investing
Shopping, building fixed assets and other long-term
assets
Net Cash flow from investing
III. Cash flow from financing
Net cash flow from financing
Net cash flow during the year
THE CONTENT IS INTENTIONALLY REMOVED FOR DEMO
PURPOSE

Appendix
Financial Statement
104
Long Son Joint Stock Company
BALANCE SHEET
Unit: VND 2015 2016
A. CURRENT ASSETS
I. Cash and petty cash
II. Temporary investments
III. Accounts receivable
1. From customers
IV. Inventory
B. LONG-TERM ASSETS
TOTAL ASSETS
A. CURRENT LIABILITIES
I. Current liabilities
1. Loan and Current liabilities
2. Taxes and accounts payable to the state
II. Long-term liabilities
1. Loan and Long-term liabilities
2. Long-term accounts payable
B. OWNER'S EQUITY
TOTAL LIABILITIES AND OWNER'S EQUITY
BUSINESS RESULTS REPORT
Unit: VND 2015 2016
Net revenue from sales and services
Cost of goods sold and services
Gross profit of goods sold and services
Profit from financial activities
Financial cost
Interest expense
Cost of goods sold
Administration cost
Net profit from business activities
Gross profit before tax
Current corporate income tax expense
Deferred corporate income tax expense
Profit after tax
CASH FLOW STATEMENT
Unit: VND 2015 2016
I. Cash flow from operations
Depreciation of fixed assets
Gain (Loss) from unrealized exchange rate differences
Net Cash flow from operations
II. Cash flow from investing
Shopping, building fixed assets and other long-term
assets
Net Cash flow from investing
III. Cash flow from financing
Net cash flow from financing
Net cash flow during the year
THE CONTENT IS INTENTIONALLY REMOVED FOR DEMO
PURPOSE

Appendix
Financial Statement
105
Thao Nguyen LLC
BALANCE SHEET
Unit: VND 2015 2016
A. CURRENT ASSETS
I. Cash and petty cash
II. Temporary investments
III. Accounts receivable
1. From customers
IV. Inventory
B. LONG-TERM ASSETS
TOTAL ASSETS
A. CURRENT LIABILITIES
I. Current liabilities
1. Loan and Current liabilities
2. Taxes and accounts payable to the state
II. Long-term liabilities
1. Loan and Long-term liabilities
2. Long-term accounts payable
B. OWNER'S EQUITY
TOTAL LIABILITIES AND OWNER'S EQUITY
BUSINESS RESULTS REPORT
Unit: VND 2015 2016
Net revenue from sales and services
Cost of goods sold and services
Gross profit of goods sold and services
Profit from financial activities
Financial cost
Interest expense
Cost of goods sold
Administration cost
Net profit from business activities
Gross profit before tax
Current corporate income tax expense
Deferred corporate income tax expense
Profit after tax
CASH FLOW STATEMENT
Unit: VND 2015 2016
I. Cash flow from operations
Depreciation of fixed assets
Gain (Loss) from unrealized exchange rate differences
Net Cash flow from operations
II. Cash flow from investing
Shopping, building fixed assets and other long-term
assets
Net Cash flow from investing
III. Cash flow from financing
Net cash flow from financing
Net cash flow during the year
THE CONTENT IS INTENTIONALLY REMOVED FOR DEMO
PURPOSE
Appendix
Financial Statement
106
Hoang Son I Joint Stock Company
BALANCE SHEET
Unit: VND 2015 2016
A. CURRENT ASSETS
I. Cash and petty cash
II. Temporary investments
III. Accounts receivable
1. From customers
IV. Inventory
B. LONG-TERM ASSETS
TOTAL ASSETS
A. CURRENT LIABILITIES
I. Current liabilities
1. Loan and Current liabilities
2. Taxes and accounts payable to the state
II. Long-term liabilities
1. Loan and Long-term liabilities
2. Long-term accounts payable
B. OWNER'S EQUITY
TOTAL LIABILITIES AND OWNER'S EQUITY
BUSINESS RESULTS REPORT
Unit: VND 2015 2016
Net revenue from sales and services
Cost of goods sold and services
Gross profit of goods sold and services
Profit from financial activities
Financial cost
Interest expense
Cost of goods sold
Administration cost
Net profit from business activities
Gross profit before tax
Current corporate income tax expense
Deferred corporate income tax expense
Profit after tax
CASH FLOW STATEMENT
Unit: VND 2015 2016
I. Cash flow from operations
Depreciation of fixed assets
Gain (Loss) from unrealized exchange rate differences
Net Cash flow from operations
II. Cash flow from investing
Shopping, building fixed assets and other long-term
assets
Net Cash flow from investing
III. Cash flow from financing
Net cash flow from financing
Net cash flow during the year
THE CONTENT IS INTENTIONALLY REMOVED FOR DEMO
PURPOSE

Appendix
Financial Statement
107
Hai Viet LLC
BALANCE SHEET
Unit: VND 2015 2016
A. CURRENT ASSETS
I. Cash and petty cash
II. Temporary investments
III. Accounts receivable
1. From customers
IV. Inventory
B. LONG-TERM ASSETS
TOTAL ASSETS
A. CURRENT LIABILITIES
I. Current liabilities
1. Loan and Current liabilities
2. Taxes and accounts payable to the state
II. Long-term liabilities
1. Loan and Long-term liabilities
2. Long-term accounts payable
B. OWNER'S EQUITY
TOTAL LIABILITIES AND OWNER'S EQUITY
BUSINESS RESULTS REPORT
Unit: VND 2015 2016
Net revenue from sales and services
Cost of goods sold and services
Gross profit of goods sold and services
Profit from financial activities
Financial cost
Interest expense
Cost of goods sold
Administration cost
Net profit from business activities
Gross profit before tax
Current corporate income tax expense
Deferred corporate income tax expense
Profit after tax
CASH FLOW STATEMENT
Unit: VND 2015 2016
I. Cash flow from operations
Depreciation of fixed assets
Gain (Loss) from unrealized exchange rate differences
Net Cash flow from operations
II. Cash flow from investing
Shopping, building fixed assets and other long-term
assets
Net Cash flow from investing
III. Cash flow from financing
Net cash flow from financing
Net cash flow during the year
THE CONTENT IS INTENTIONALLY REMOVED FOR DEMO
PURPOSE

Appendix
Financial Statement
108
Ral International Vietnam Ltd
BALANCE SHEET
Unit: VND 2015 2016
A. CURRENT ASSETS
I. Cash and petty cash
II. Temporary investments
III. Accounts receivable
1. From customers
IV. Inventory
B. LONG-TERM ASSETS
TOTAL ASSETS
A. CURRENT LIABILITIES
I. Current liabilities
1. Loan and Current liabilities
2. Taxes and accounts payable to the state
II. Long-term liabilities
1. Loan and Long-term liabilities
2. Long-term accounts payable
B. OWNER'S EQUITY
TOTAL LIABILITIES AND OWNER'S EQUITY
BUSINESS RESULTS REPORT
Unit: VND 2015 2016
Net revenue from sales and services
Cost of goods sold and services
Gross profit of goods sold and services
Profit from financial activities
Financial cost
Interest expense
Cost of goods sold
Administration cost
Net profit from business activities
Gross profit before tax
Current corporate income tax expense
Deferred corporate income tax expense
Profit after tax
CASH FLOW STATEMENT
Unit: VND 2015 2016
I. Cash flow from operations
Depreciation of fixed assets
Gain (Loss) from unrealized exchange rate differences
Net Cash flow from operations
II. Cash flow from investing
Shopping, building fixed assets and other long-term
assets
Net Cash flow from investing
III. Cash flow from financing
Net cash flow from financing
Net cash flow during the year
THE CONTENT IS INTENTIONALLY REMOVED FOR DEMO
PURPOSE

Appendix
Financial Statement
109
Long An Processing and Export Joint Stock Company (LAFOOCO)
BALANCE SHEET
Unit: VND 2015 2016
A. CURRENT ASSETS
I. Cash and petty cash
II. Temporary investments
III. Accounts receivable
1. From customers
IV. Inventory
B. LONG-TERM ASSETS
TOTAL ASSETS
A. CURRENT LIABILITIES
I. Current liabilities
1. Loan and Current liabilities
2. Taxes and accounts payable to the state
II. Long-term liabilities
1. Loan and Long-term liabilities
2. Long-term accounts payable
B. OWNER'S EQUITY
TOTAL LIABILITIES AND OWNER'S EQUITY
BUSINESS RESULTS REPORT
Unit: VND 2015 2016
Net revenue from sales and services
Cost of goods sold and services
Gross profit of goods sold and services
Profit from financial activities
Financial cost
Interest expense
Cost of goods sold
Administration cost
Net profit from business activities
Gross profit before tax
Current corporate income tax expense
Deferred corporate income tax expense
Profit after tax
CASH FLOW STATEMENT
Unit: VND 2015 2016
I. Cash flow from operations
Depreciation of fixed assets
Gain (Loss) from unrealized exchange rate differences
Net Cash flow from operations
II. Cash flow from investing
Shopping, building fixed assets and other long-term
assets
Net Cash flow from investing
III. Cash flow from financing
Net cash flow from financing
Net cash flow during the year
THE CONTENT IS INTENTIONALLY REMOVED FOR DEMO
PURPOSE

Appendix
Financial Statement
110
Phuc Vinh Manufacture – Trade LLC
BALANCE SHEET
Unit: VND 2015 2016
A. CURRENT ASSETS
I. Cash and petty cash
II. Temporary investments
III. Accounts receivable
1. From customers
IV. Inventory
B. LONG-TERM ASSETS
TOTAL ASSETS
A. CURRENT LIABILITIES
I. Current liabilities
1. Loan and Current liabilities
2. Taxes and accounts payable to the state
II. Long-term liabilities
1. Loan and Long-term liabilities
2. Long-term accounts payable
B. OWNER'S EQUITY
TOTAL LIABILITIES AND OWNER'S EQUITY
BUSINESS RESULTS REPORT
Unit: VND 2015 2016
Net revenue from sales and services
Cost of goods sold and services
Gross profit of goods sold and services
Profit from financial activities
Financial cost
Interest expense
Cost of goods sold
Administration cost
Net profit from business activities
Gross profit before tax
Current corporate income tax expense
Deferred corporate income tax expense
Profit after tax
CASH FLOW STATEMENT
Unit: VND 2015 2016
I. Cash flow from operations
Depreciation of fixed assets
Gain (Loss) from unrealized exchange rate differences
Net Cash flow from operations
II. Cash flow from investing
Shopping, building fixed assets and other long-term
assets
Net Cash flow from investing
III. Cash flow from financing
Net cash flow from financing
Net cash flow during the year
THE CONTENT IS INTENTIONALLY REMOVED FOR DEMO
PURPOSE

REPORT DISCLAIMER
111
Report Disclaimer:
This document has been prepared in good faith on the basis of information available at the date of publication without any independent verification. VIRAC has
produced this report for private circulation to professional clients only. All information and statistical data herein have been obtained from sources we believe to
be reliable and made to ensure the accuracy of the contents of the pages of the report at the time of preparation. Such information has not been independently
verified and VIRAC makes no representation or warranty, whether express or implied, of any kind with respect to the document and its contents, information and
materials. The content found in this report is proprietary to VIRAC and is provided solely for your personal and non-commercial use. You agree that you will not
use this report for any purpose that is unlawful and that you will not reproduce the report or redistribute it outside your organisation, or place it on a website for
public access without the express written permission of VIRAC.
SHOULD YOU NEED ANY ASSISTANCE, PLEASE CONTACT US:
VIETNAM INDUSTRY RESEARCH AND CONSULTANT (VIRAC JSC.,)
6 th Floor, Anh Minh Building, 36 Hoang Cau, O Cho Dua, Dong Da, Hanoi, Vietnam
Website: http://virac.com.vn/
Email: [email protected] | Tel: +84 463289520

Thank you !