franke.uchicago.edufranke.uchicago.edu/.../bpro29000-2015/team28-paper.docx · web viewcalled...
TRANSCRIPT

Barriers to Developing Solar Energy in Saudi Arabia:
A Profitability Analysis of the Transition to Solar Energy and a Cost-
Benefit Analysis of Installing 41 GW of Solar Energy by 2032
Energy & Energy Policy
University of Chicago
Team 28
Junil Kim, Sang Won Lee, Melissa Park, Jay Rho, Chan Yoon,
TABLE OF CONTENTS1
I. INTRODUCTION
1. Purpose
2. Background Information
3. Need for Transition
II. Solar Energy Transition in Saudi Arabia
1. Technological Overview
1.1 Solar Thermal System Technology
1.2 Concentrated Solar Panel (“CSP”)
1.3 Photovoltaic System Technology
1.4 Potential Technological Barriers in Saudi Arabia from Its
Geographical Issue
1.5 Solutions to the Potential Technological Barriers
2. Economic Overview
2.1 Economic Barriers with Petroleum Subsidies
III. Profitability Analysis
1. Background
2. Profitability Model: Opportunity Cost
3. Result
4. Interpretation
IV. Cost-Benefit Analysis
1. Background
2. RETScreen Analysis
2.1 Energy Production Estimation
2.2 Financial Feasibility Assessment
2.3 GHG Emissions Analysis
3. RETScreen Results
3.1 Projected Energy Production
3.2 Financial Analysis Results
2
3.3 GHG Emissions Reductions
4. RETScreen Sensitivity Analysis
4.1 Global Solar Radiation
4.2 Losses Due to Sand and Dust
4.3 Initial Costs
4.4 Income from GHG Emissions Reduction Credit Trading
4.5 Electricity Export Rate
5. Remarks
V. CONCLUSION
VI. WORK CITED
I. IntroductionAround the world, countries conventionally gained energy from fossil fuels (coal, crude oil,
3

natural gas). These conventional energy sources have increasingly been an area of study to people
around the world, where the advantages and disadvantages of these non-renewable energy are studied
in order to develop alternative renewable sources. Renewable energy sources refer to inexhaustible
resources such as sunlight, wind, rain, tides, waves, and geothermal heat. These renewable energy
sources are to serve as alternative sources to fossil fuels and nuclear fuel. The transition of energy
sources has been one of the greatest goals of the century, with the aim of abolishing nuclear energy,
coal, and other non-renewable energy sources to create a system of 100% renewable energy.
During recent years, concerns of decreasing fossil fuel reserves and environmental issues
have caused more and more conventional sources to convert to renewable energy. This transition to
renewable and sustainable energy sources take strong political and social power and also decades of
time to accomplish. This transition is seen to be crucial in many different ways.
One of the most important issue is its environmental aspect. The continued use of this
conventional forms of energy has seen to affect the earth’s ecological survival, as well as the health of
humans and other living creatures on earth. People’s health have been affected by air pollution that
arise from power plants, and acid rain that cause premature death with other severe side effects. Long-
run fossil fuel use also have been proven to cause carbon-dioxide emissions that result in severe
global warming issues.
Since 2014, the OPEC and its de-facto leader Saudi Arabia have maintained supply of oil
high to keep low prices. The decision to defend market share, instead of cutting back on output, came
through in attempts to drive high-cost producers such as U.S. shale producers out of the market. Such
measures are in stark contrast with what we witnessed in 1973 when OPEC nations cut back on
supply. Today’s measure comes at a high cost, as current oil prices are significantly below the
breakeven points for different nations. However, we believe such political gambit does not alter the
fact that fossil fuel reserves are diminishing and renewable energy development is yet to be at par to
completely replace conventional energy.
Although people realize the issues of using conventional resources – especially burning and
extracting fossil fuels, the proving issues have not stopped countries from gaining energy from these
sources as well as increased consumption of oil and fuel. There is still the issue of ever-increasing
population, with assumed increase of about 9,000 people per hour. Although the demand for fossil
fuels and dependence on conventional sources will grow due to constraints of alternatives, the
continued increase of population and increased demand of nonrenewable energy along with the
limited amount of reserves will result in a future that will have to rely on increased use of renewable
energy.
It would be ideal to use conventional energy sources without the externalities, but currently
with carbon dioxide emission and global warming, there seems to be stringent unresolved negative
externalities of using these resources. Nevertheless, the sunk cost of these resources, the cost that
4

comes with transition of energy to renewable energy sources, and the barriers to renewable energy are
just a few factors hindering the process of building a new era of clean energy. Regardless of whether
the process is easy or difficult, however, sooner or later the world would have to deal with sustainable
measures of living with the ever-damaging environment and costly figures.
1. Purpose
The purpose of this research paper is to examine the potential and profitability of Saudi
Arabia’s transition to developing and exporting renewable energy, namely solar energy. Saudi Arabia
is a very interesting case study in that we attempt to show that even for a country rich with
conventional energy sources, making the transition to renewable energy can be profitable. The paper
examines a general background for the non-renewable energy sources and the country’s transition
towards solar energy as its main renewable energy source. Then, we conduct a profitability analysis
considering for externalities and economic factors, and a cost-benefit analysis. From the analyses, the
feasibility and profitability of converting energy sources are determined. Finally, the results of the
analyses and their implications are discussed.
2. Background Information on Saudi Arabia’s use of nonrenewable energy
Saudi Arabia’s main source of energy is in oil and natural gas. Because of the country’s
wealth in its natural resources, oil and natural gas were its main sources of electric generation.1
Particularly, Saudi Arabia is the world’s top oil exporter and producer. Its economy is petroleum-
based. Oil accounts for 90% of the country’s exports and nearly 75% of government revenues.
Compared to the world, it was the largest crude oil exporting country and second largest country with
oil reserves.2
2.1 Reserve
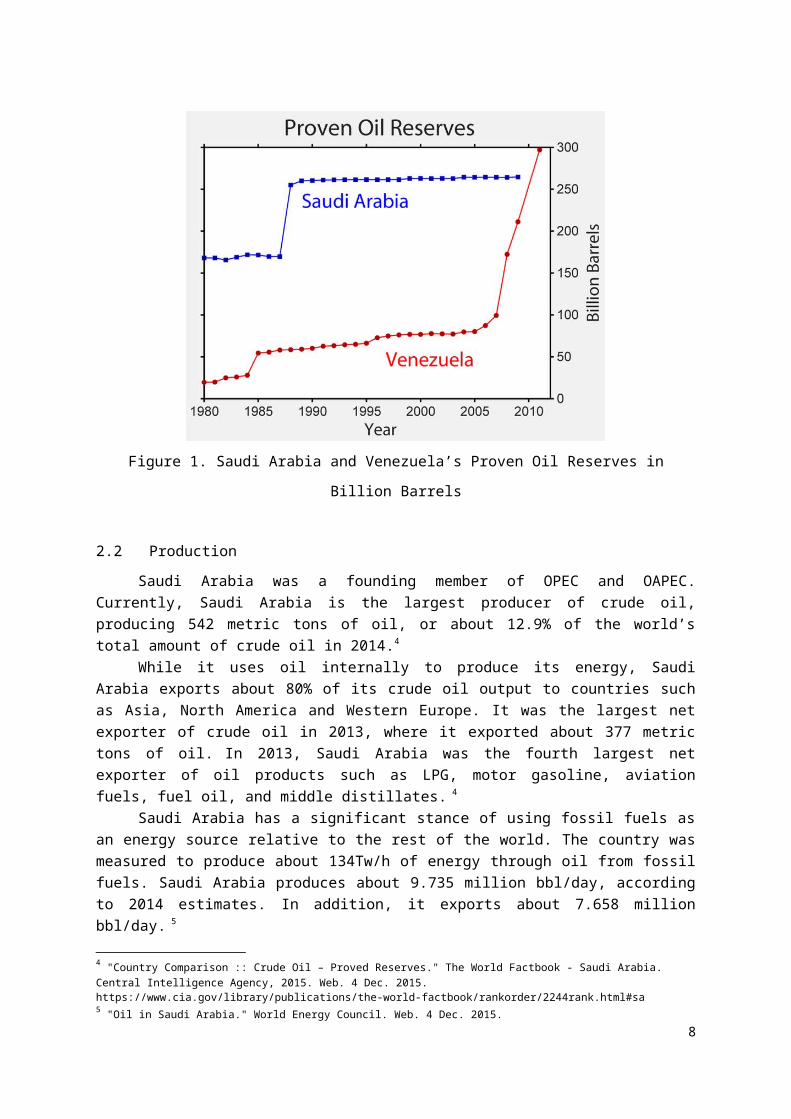
Currently, Saudi Arabia is the second largest country with proved oil reserves, owning about
one-fifth of the world’s proven oil reserves. They had the largest reserves in the world until Venezuela
announced their proven reserves in January 2011 (Figure 1).3
1 "Saudi Arabia Electricity - Production by Source." - Energy. CIA World Factbook, 21 Feb. 2013. Web. 3 Dec. 2015. http://www.indexmundi.com/saudi_arabia/electricity_production_by_source.html.2 "The World Factbook - Saudi Arabia." Central Intelligence Agency. Web. 23 Nov. 2015. https://www.cia.gov/library/publications/the-world-factbook/geos/sa.html. 3 "Venezuela: Oil Reserves Surpasses Saudi Arabia's." Ahramonline. Reuters, 16 Jan. 2011. Web. 4 Dec. 2015. http://english.ahram.org.eg/NewsContent/3/14/4060/Business/Markets--Companies/Venezuela-Oil-reserves-surpasses-Saudi-Arabias.aspx.
5
Figure 1. Saudi Arabia and Venezuela’s Proven Oil Reserves in Billion Barrels
2.2 Production
Saudi Arabia was a founding member of OPEC and OAPEC. Currently, Saudi Arabia is the largest producer of crude oil, producing 542 metric tons of oil, or about 12.9% of the world’s total amount of crude oil in 2014.4
While it uses oil internally to produce its energy, Saudi Arabia exports about 80% of its crude oil output to countries such as Asia, North America and Western Europe. It was the largest net exporter of crude oil in 2013, where it exported about 377 metric tons of oil. In 2013, Saudi Arabia was the fourth largest net exporter of oil products such as LPG, motor gasoline, aviation fuels, fuel oil, and middle distillates. 4
Saudi Arabia has a significant stance of using fossil fuels as an energy source relative to the rest of the world. The country was measured to produce about 134Tw/h of energy through oil from fossil fuels. Saudi Arabia produces about 9.735 million bbl/day, according to 2014 estimates. In addition, it exports about 7.658 million bbl/day. 5
Every square meter of Saudi Arabia produces over 7 kilowatts of energy daily in each 12 hours of sun power. If the country was to use up their solar energy supply each day, they would use about 12,425 TWh of electricity, which is enough to use for 72 years. 6
4 "Country Comparison :: Crude Oil – Proved Reserves." The World Factbook - Saudi Arabia. Central Intelligence Agency, 2015. Web. 4 Dec. 2015. https://www.cia.gov/library/publications/the-world-factbook/rankorder/2244rank.html#sa5 "Oil in Saudi Arabia." World Energy Council. Web. 4 Dec. 2015. https://www.worldenergy.org/data/resources/country/saudi-arabia/oil6 Alhouti, Aljowhara. "Deployment of Solar Energy in Saudi Arabia: A Case Study." The George Washington University Law School Course on Energy and Environment. Web. 30 Nov. 2015. https://gwujeel.files.wordpress.com/2013/09/johara-alhouti.pdf
6

Figure 2. Saudi Arabia Crude Oil Production 1950-2012
2.3 Consumption
According to a study of the Energy Information Administration, Saudi Arabia is the largest
oil consuming nation in the Middle East and the fifteenth largest consumer of total primary energy in
2008. Saudi Arabia consumed approximately 3 million barrels per day (bbl/d) of oil in 2012, almost
double 2000 levels, because of strong industrial growth and subsidized prices. There was constant
worries from scientific research that along with their increasing consumption oil, the population of
Saudi Arabia would lead them to drain their supply of oil. The population of the country has risen
17% since 1995, with domestic energy demand increasing about 8% per year since 2012. From the
amount of oil the country produces, Saudi uses about one-quarter of its production domestically.
Research shows that the demand has increased and will further boost in the domestic consumption of
oil.
3. Need for Transition / Reasons away from non-renewable energy source
Ever since oil was first struck in Saudi Arabia in March 1938, the Middle Eastern kingdom
has long enjoyed its status of being the top crude oil exporter in the world. Saudi Arabia has been so
well endowed with a resource that is fundamental to the functioning of the global economy. The
kingdom is heavily dependent upon petroleum, as the oil and gas sector account for approximately
85% of export earnings1. It thus comes as a surprise that Saudi Arabia is highly determined to
transition to renewable energy. There seems to be no compelling reason in the near term for what may
7
be a very costly transition for a country that could continue making profits simply by maintaining the
status quo: selling more oil. However, Saudi Arabia has pronounced a detailed initiative to produce a
total of 54GW of energy by 2032 from renewable sources, of which 41GW will be produced by solar
energy. The transition is not necessarily about addressing environmental concerns or climate change,
but is fundamentally driven from an economic standpoint. The goal of such policy is to meet
significant proportion of domestic energy demands through renewable energy and use saved oil
productions for export, thereby simultaneously dominating the both conventional and renewable
energy market. Hence, producing petroleum and promoting renewable energy is not a mutually
exclusive agenda for the country. Based on its conventional revenue sources from oil, the transition is
essentially an investment.
We believe that such transition makes much economic sense. Fossil fuels are expected to
deplete within the next 50 years and historically, energy transition from wood to coal, coal to oil have
taken significant lengths of time. For a country so dependent upon the world’s reliance on petroleum,
there is great need for an alternative. Therefore, we want to examine if transitioning to renewable
energy, even for a petroleum-rich country like Saudi Arabia, can be profitable. What follows in the
paper is a profitability assessment of the transition, whereby we point out the huge price gap between
domestic and foreign oil price to underscore the significant amount of opportunity costs realized from
excess subsidy of domestic oil consumption. Investing in renewable energy is a more efficient means
to meet increasing energy demand than subsidies and creates further revenue sources. We also
examine an in-depth cost-benefit analysis of the aforementioned policy to determine the validity of
such massive investments. Although renewable energy must someday be developed to its maximum
potential, our goal in this paper is to determine if now can be the profitable time for the transition.
II. Solar Energy Transition in Saudi ArabiaBefore going into an in-depth analysis on the profitability and cost-benefit analysis, it is
important to understand the technological and economic advantages and disadvantages of the use of
solar energy in Saudi Arabia.
1. Technological Overview
In this section, we will discuss solar technologies that are currently available to build power
plants in desert areas of Saudi Arabia. The section will also discuss the potential barriers that will
challenge the nation in terms of technology and possible solutions for the obstacles.
1.1 Solar Thermal System Technology
In the case of Solar Thermal System, there are more steps involved when transforming solar
energy into electricity. First, solar collectors capture and concentrate sunlight to heat synthetic oil 8

called therminol, or in a simple term, “heating fluid”, which then heats water to create steam. Next,
the steam is piped to an onsite turbine-generator to produce electricity, which is then transmitted over
power lines. On days without much sunlight, the plant has a supplementary natural gas boiler and an
energy storing system using materials like molten salts. The plant can either burn natural gas to heat
the water, creating steam to generate electricity or use the stored energy in molten salt to run the plant
to generate electricity. “Figure 1” below shows the schematic diagram of how solar thermal power
plant works for a better understanding.
The advantages of Solar Thermal System Technology can seem to be attractive, but they also
come with big price tags. To note one of the unique advantage that Solar Thermal System Technology
offers is that it is a reliable source of electricity regardless of the amount of sunshine because it can
store the heat energy in the form of molten salts. The “Figure 2” shows how molten salt can be used in
the system to store energy. The cold salt with temperature of 350oC is heated by sunlight to about
565oC, which is then stored in “Hot Tank”. In addition to this unique feature, there are many more
advantages. For instance, there are no serious environmental consequences regarding global warming
and pollution. Also, there are no extra fuel costs, which is significant compared to traditional fossil
fuels.
Figure 3. Schematic Diagram of Process of Solar Thermal Power Plant
9

However, as previously mentioned, these advantages come with high costs. The system
requires significantly higher costs, as much as 50%, than the other systems to be mentioned later in
the paper. Furthermore, water must always be supplied at all times, which can be problematic when
constructing the system in a desert. There is also a limitation in size when constructing a power plant
using this system. To be profitable, the size of the power plant has to be at least 50MW, which
contrasts to Photovoltaic System Technology that is sold in size as small as 5 Watt. Lastly, the
gestation time for a power plant is long, which can take up to 7 years. As a comparison, Power plant
using Photovoltaic System only takes as short as six months to complete construction. [3]
Figure 4. Schematic Diagram of How Molten Salt Is Used to Store Heat Energy
1.2 Concentrated Solar Panel (“CSP”)
Concentrated Solar Panels are similar to Solar Thermal System Technology, but the
difference is in how they collect the solar energy. In the case of Solar Thermal System Technology,
each panel absorbs the heat energy from solar array as shown in the “Figure 1” above. However, in
the case of CSP, instead of using solar panels to collect solar arrays, it uses mirrors, which then reflect
the sunlight to a designated receiver. The designated receiver obtains all the solar heat energy, which
is utilized to heat working fluids just like how Solar Thermal System Technology utilizes the solar
heat energy. The following steps are identical to those of Solar Thermal System Technology, where
the heated working fluid is used to generate super-heated steam to drive a generator through a steam
turbine or a heat engine to generate electricity. The unique feature and advantage of CSP is its
superior storage option. The power storage for the system usually takes the form of storing heat for
later use, which is in contrast to how Photovoltaic System works, which will be further examined later
in the paper.
10

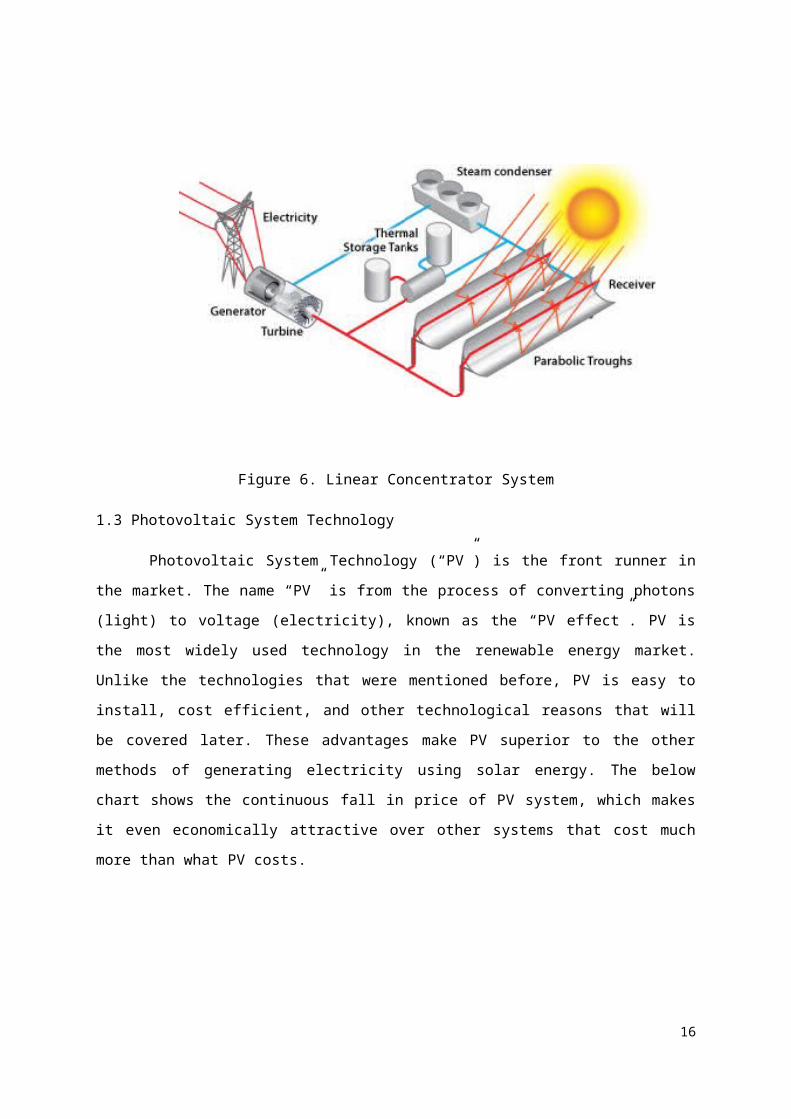
There are three main types of systems that are available using CSP technology; Power Tower
System, Linear Concentrator System, Dish/Engine System. When constructing a power plant, the first
two systems, Power Tower System and Linear Concentrator System, are commonly used, but the
Dish/Engine System is not as popular as the other two because of its low capacity of generating
electricity. Each “dish” can generate only about 25 KW, when the other two systems can have
capacity up to 200 MW or even bigger in the specific case of Linear Concentrator System.
Figure 5. Power Tower System
Figure 6. Linear Concentrator System11

1.3 Photovoltaic System Technology
Photovoltaic System Technology (“PV”) is the front runner in the market. The name “PV” is
from the process of converting photons (light) to voltage (electricity), known as the “PV effect”. PV is
the most widely used technology in the renewable energy market. Unlike the technologies that were
mentioned before, PV is easy to install, cost efficient, and other technological reasons that will be
covered later. These advantages make PV superior to the other methods of generating electricity using
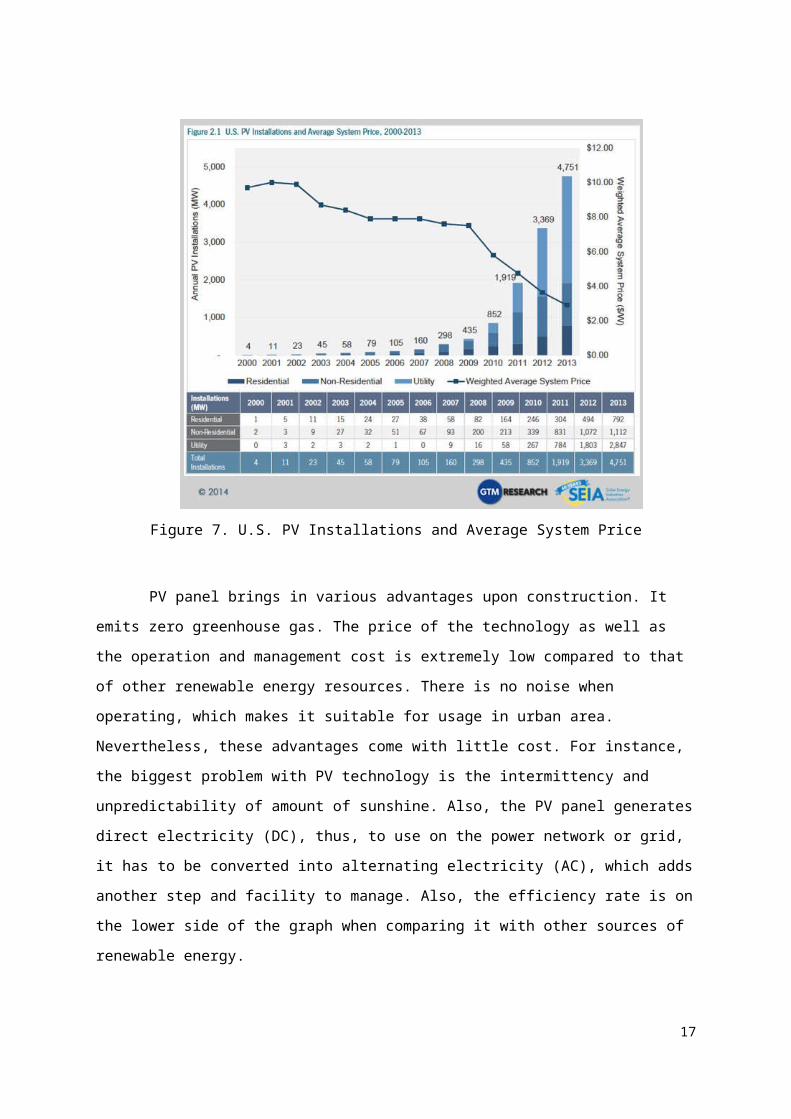
solar energy. The below chart shows the continuous fall in price of PV system, which makes it even
economically attractive over other systems that cost much more than what PV costs.
Figure 7. U.S. PV Installations and Average System Price
PV panel brings in various advantages upon construction. It emits zero greenhouse gas. The
price of the technology as well as the operation and management cost is extremely low compared to
that of other renewable energy resources. There is no noise when operating, which makes it suitable
for usage in urban area. Nevertheless, these advantages come with little cost. For instance, the biggest
problem with PV technology is the intermittency and unpredictability of amount of sunshine. Also,
the PV panel generates direct electricity (DC), thus, to use on the power network or grid, it has to be
converted into alternating electricity (AC), which adds another step and facility to manage. Also, the
efficiency rate is on the lower side of the graph when comparing it with other sources of renewable
12

energy.
PV system converts sunlight directly into electricity, opposed to the other two methods
where the sunlight was used indirectly to generate electricity. So, how does PV technology work? To
borrow explanations by Solar Energy Industries Association, “Photons strike and ionize
semiconductor material on the solar panel, causing outer electrons to break free of their atomic bonds.
Due to the semiconductor structure, the electrons are forced in one direction creating a flow of
electrical current.” The detailed schematic diagram example is presented below as “Figure 8”.
Figure 8. Diagram of Typical Crystalline Silicon Solar Cell
Thus, the panels are the core component of the system. There are several kinds of panels that
are slightly different from each other. The five major categories are Monocrystalline Silicon PV
panels, Polycrystalline Silicon PV panels, Amorphous Silicon PV panels, and other Thin-film PV
panels. First, Monocrystalline panel is the most efficient photovoltaic technology, converting about
15% to even 20% of the sun’s energy into electricity on average, which is greater than those of other
types, which usually sit between 5% and 13% of efficiency. With its superior production ability
compare to its peers, it can be space-efficient as well as perform well even under low-light condition.
Though, it is very vulnerable to the outside conditions such as, it can break down fairly easier than
others by dirt or snow, which can be critical factors when installing panels in the middle of desert.
13
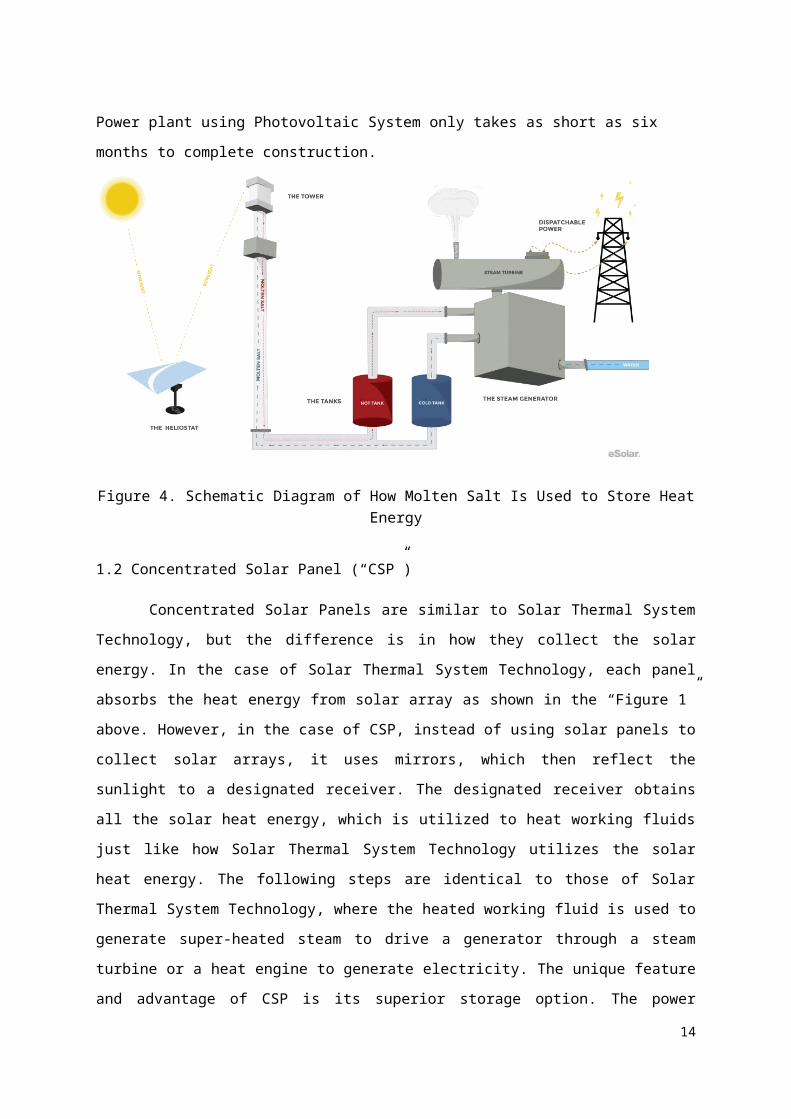
Figure 9. Monocrystalline Panel Diagram
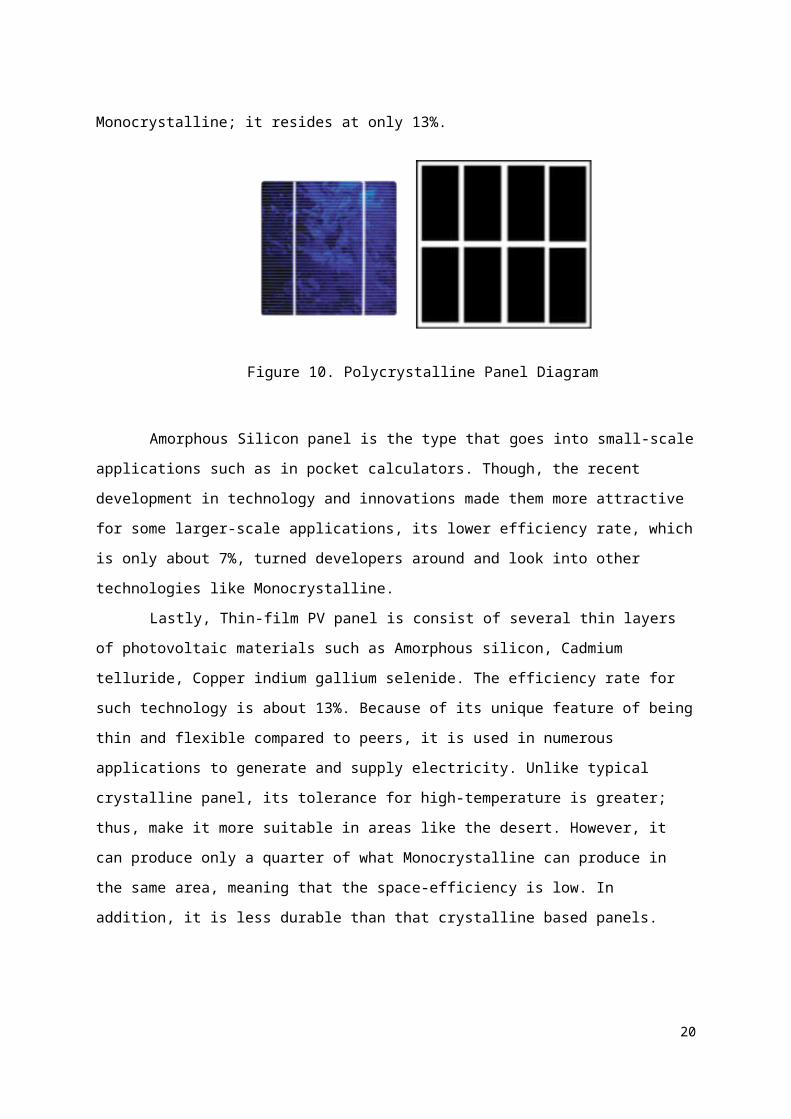
We now consider the Polycrystalline panel. It is very similar to a Monocrystalline panel, but
a major difference between Monocrystalline panel and Polycrystalline panel is the existence of
Czochraski process. Czochraski process is used “to create monocrystalline silicon, which results in
large cylindrical ingots. Four sides are cut out of the ingots to make silicon wafers and a significant
amount of the original silicon ends up as waste. However, in the case of Polycrystalline panel, the
process of making is much simpler, thus, cost less and the amount of waste silicon is noticeably lower
compare to monocrystalline. Though, because of the recent fall in price of PV panels, the price
difference between the two is very small. Also, the efficiency rate is lower than that of
Monocrystalline; it resides at only 13%.
Figure 10. Polycrystalline Panel Diagram
Amorphous Silicon panel is the type that goes into small-scale applications such as in pocket
calculators. Though, the recent development in technology and innovations made them more
attractive for some larger-scale applications, its lower efficiency rate, which is only about 7%, turned
developers around and look into other technologies like Monocrystalline.
Lastly, Thin-film PV panel is consist of several thin layers of photovoltaic materials such as
Amorphous silicon, Cadmium telluride, Copper indium gallium selenide. The efficiency rate for such
technology is about 13%. Because of its unique feature of being thin and flexible compared to peers, it 14

is used in numerous applications to generate and supply electricity. Unlike typical crystalline panel, its
tolerance for high-temperature is greater; thus, make it more suitable in areas like the desert.
However, it can produce only a quarter of what Monocrystalline can produce in the same area,
meaning that the space-efficiency is low. In addition, it is less durable than that crystalline based
panels.
Figure 11. Types of PV
1.4 Potential Technological Barriers in Saudi Arabia from Its Geographical Issue
In a specific case in Saudi Arabia, there are two major barriers of Saudi Arabia’s transition to
Solar Energy: extreme heat waves and frequent dust storms. First, let us discuss how frequent dust
storms become a significant hurdle from a technology standpoint. Saudi Arabia, a country that the
most of its land is covered with deserts, experiences severe dust storm very frequently. This factor can
be very critical when it comes to installing solar panels over a desert land to produce electricity. Not
only does dust reduce the life-span of the panels, but also it reduces efficiency by a significant
amount, knowing that solar panel is already in the lower side of the graph when it is compared with
other sources of renewable energy. It is claimed that if the panels are not regularly cleaned after each
dust storm, they lose about 0.6% in efficiency rate per day, which can ultimately go up to 60%.
In addition, a research team from Stanford University conducted an experiment with PV
modules installed in the Dhahran region in Saudi Arabia to see how production of electricity is
affected by dust. The team installed four Monocrystalline PV modules and two Polycrystalline PV
modules to test and monitor daily. The results were dreadful. Not only does the dust that get on the
panels hurt production, but the sand scattered in the air blocks the sun, causing problems for the
panels to absorb radiation. No cleaning performed during the time span of 6 months, more than 50%
of power output reduction was observed. There was also one dust storm that single handedly caused
15
20% decrease in power output. Though, it was observed that rainfall helps clean the dust on the
panels, but rain is not frequent in Saudi Arabia for us to solely rely on natural cleaning of the panels.
High temperature is another noticeable problem with Saudi Arabia. It may seem counter-
intuitive, but solar panel’s efficiency is lower with rise in temperature. The same team conducted an
analysis on data from 18 grid connected PV plants located globally, including Austria, Germany, Italy,
Japan, and Switzerland. 17 out of 18 PV modules in those regions showed reduction in efficiency
varying between 1.7% and 11.3% due to temperature change.
Figure 12. Correlation between PV Module Efficiency and Module Temperature in Dhahran,
Saudi Arabia
The graph above shows the result of the analysis on annual loss in efficiency due to
temperature change in the Dhahran region. As the temperature of the PV module rose from 38oC to
48oC, the efficiency of the PV module decreased from 11.6% to 10.4%, which results in a temperature
coefficient of -0.11△E/%oC. The interpretation of the temperature coefficient is the change in
efficiency with a unit decrease in temperature.
High temperature and dust storms are the main obstacles that will challenge Saudi Arabia
when transitioning to solar powered energy from fossil fuels. Saudi Arabia must find a way to make
the transition economically feasible by reducing these detrimental effects. Nevertheless, there are a
number of new technologies under development to overcome these environmental factors.
1.5 Solutions to the Potential Technological Barrier
As previously examined, sand storms can be a serious obstacle when generating electricity
using solar panels due to dust residue on the panel that disrupts the entire process. Thus, it is crucial to
16
develop a technology or method to resolve this problem economically for Saudi Arabia.
First, let us discuss a possible solution for dust storms in Saudi Arabia. The technology that
recently came into the spotlight is the NOMADD developed by a team from King Abdullah
University of Science and Technology. NOMADD, “NO water Mechanical Automated Dusting
Device”, uses brush to clean the dust off the panels. It leaves no scratch or damage to panels, while
removing 99.6% of dusts with a cost effective daily clean. NOMADD can clean 1MW or 1000MW
system in under only 30 minutes. Also, the NOMADD system is scalable, meaning it can be specially
customized for each different project.
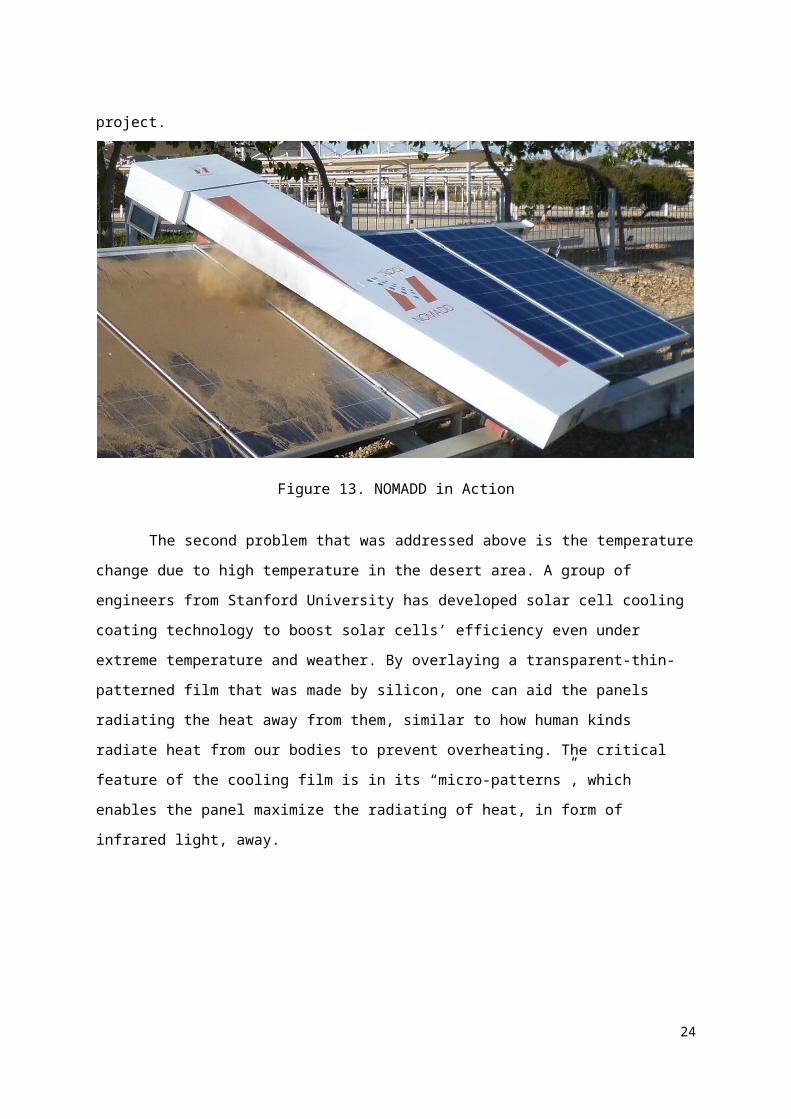
Figure 13. NOMADD in Action
The second problem that was addressed above is the temperature change due to high
temperature in the desert area. A group of engineers from Stanford University has developed solar cell
cooling coating technology to boost solar cells’ efficiency even under extreme temperature and
weather. By overlaying a transparent-thin-patterned film that was made by silicon, one can aid the
panels radiating the heat away from them, similar to how human kinds radiate heat from our bodies to
prevent overheating. The critical feature of the cooling film is in its “micro-patterns”, which enables
the panel maximize the radiating of heat, in form of infrared light, away.
17

2. Economic Overview
This section addresses the economic barriers to developing solar energy, namely petroleum
subsidies backed by the government.
2.1 Economic barriers with petroleum subsidies
For many years, Saudi Arabia has subsidized the consumption of fossil fuels. Pre-tax energy
subsidies is the difference between the value of consumption at world and domestic prices. Domestic
price of fossil fuels have been maintained at significantly lower levels compared to international
market price. Saudi Arabia currently spends about US$86bn a year on petroleum subsidies, which
translates into a gallon of regular gasoline costing about 46 cents7. According to the IMF, energy
subsidies cost Saudi Arabia US$107bn, approximately 13.2% of GDP in 20158. Due to such low
domestic prices, it comes as no surprise that Saudi Arabia is the world’s largest consumer of oil per
capita with 4.7 metric tons (35 barrels) a year9. Furthermore, rapid population growth (3.2% per year)
is increasing fuel consumption (7% per year). It is evident that subsidies are becoming an economic
burden on the government and cannot be sustained for an indefinite period of time.
Why then does Saudi Arabia maintain such monstrous subsidies on domestic consumption?
There have been several reasons for keeping domestic prices of fossil fuels low. First and foremost,
the citizens consider cheap oil prices as a birthright and demand that their national resource be readily
available to the public. Subsidies have long been an easy and effective means for the government to
distribute state benefits to the people and provide support and protection to the poor. Other positive
effects can be managing inflation through lower energy prices and deterring potential protests.
However, the negative impacts of subsidies are significant, mainly economic inefficiency in terms of
foregone profits from petroleum exports and high fiscal cost for the government.
The lost revenue from not charging the international price for domestic petroleum
consumption represents an implicit transfer and an opportunity cost for the economy. Subsidies
introduce distortions to the energy sector. Low fuel prices encourages its continued use at the expense
of renewable energy and thus, acts as an economic barrier to the development of renewable energy.
Subsidies exert pressure on national budgets, crowding out expenditure in other areas such as
healthcare and education. In the long run, subsidies ultimately jeopardize the long-run productivity of
the economy.
There have been previous dialogues on reducing such enormous subsidies on domestic
production. However, the kingdom’s oil minister, Ali al-Naimi, stated in November that Saudi Arabia
7 “Saudi Arabia Considers Cutting Energy Subsidies. Web. 27 Oct. 2015. http://www.wsj.com/articles/saudi-arabia-considers-cutting-energy-subsidies-14459470078 “Saudi Arabia looks to reform energy subsidy programme. Web. 12 Nov. 2015. https://next.ft.com/content/b9e1d072-893d-11e5-90de-f44762bf98969 “Saudi Arabia Must Review Its Oil Subsidies, Former Adviser Says. Web. 27 Dec. 2012. http://www.bloomberg.com/news/articles/2012-12-27/saudi-arabia-must-review-its-oil-subsidies-former-adviser-says
18

did not need to reduce its substantial domestic energy subsidies because it was not “in dire need” for
slashing domestic energy assistance. From an economic standpoint, we believe domestic energy
subsidies must be gradually reduced if Saudi Arabia is serious about a successful transition and meet
its stated goal of producing 41GW from solar energy by 2032.
19
III. Profitability Analysis1. Background
1.1 Petroleum dependent electricity production
Saudi Arabia produces over 60% of its electricity through oil conversion. Generally, countries are
more likely to consume natural gas or coal to meet higher summer electricity demands. But for Saudi
Arabia, there is no domestic gas production and most of its natural gas is associated gas, which is
produced along with oil from the same wellbore. Even though it has the world’s fourth largest gas
reserve, its production is directly related to oil production. Such bond between oil and gas made the
government to regulate mass extraction of natural gas as it defects the oil. Furthermore, efforts in
Saudi Arabia to expand onshore non-associated gas production have experienced difficulties in
finding and extracting natural gas because of the high sulfur content of the natural gas and low
domestic natural gas prices.
Figure 14. Saudi Arabia’s use of crude oil for electric generation (2009-2014)
1.2 Oil Subsidy
The domestic oil price in Saudi Arabia is less than 10% of the market price the country sells to
other countries. It is about $4.3/barrel for oil. The public perception of oil in Saudi Arabia is taken as
a birth right for the Saudi Arabian. This signifies that the government heavily subsidizes oil to
decrease the price. The total budget for energy subsidy amounts to $86 billion which amounts to over
10% of the country’s GDP. This is, without doubt, a burdensome weight on the government’s budget.
2. Profitability Model from Opportunity Cost
The current export price of oil is $41.61/barrel. Although the price is decreasing, the
opportunity cost of domestic use of oil is big enough to be better off by exporting the amount of oil
20

that could be reduced from domestic consumption. Electric generation from use of PV could reduce
the amount of oil used to generate electricity. This reduced amount could be exported at a market
price without subsidization. Thus, profits are made with an increase in PV penetration in generating
electricity.
We test this theory as an economic model considering the actual costs and revenue. Break
down of the cost are as follows: investing of initializing new facilities such as PV and storage, the
maintenance fee of power plants, the cost for purchasing fuel in the conventional generation sector
and other expenses such as human resources expenditure.
Another cost factor we introduce is the levelized cost of electricity (LCOE). The
characteristic of PV cost is that it has high initiation cost but relatively low maintenance or generation
cost compared to other source of energy production. We therefore use LCOE, which is the net present
value of the unit cost of electricity over the lifetime of the generating asset. It can be calculated as the
net present value of all costs over the lifetime of the asset divided by the total electrical energy output of
the asset.
Formula used for calculating the LCOE of renewable energy technologies:
It = Investment expenditures in time t
Mt = Operations and maintenance expenditure in the year t
Ft = Fuel expenditures in the year t
Et = Electricity generation in year t
r = Discount rate
n = Economic life system
The rate considers electricity from the PV plant that is dispatched to the power grid to serve electricity
needs in Saudi Arabia. This rate is assumed to be equivalent to the cost of electricity production,
which is estimated to be $0.154 per kWh (Maesheng, Gento, 2013).
Thus a generation cost equation could be made with the variables considered.
denotes the annual fuel consumption when PV penetration is assumed. denotes the domestic
purchase price of fuel. represents the annual maintenance fee of the PV plants, denotes the
annual accumulated generation from PV, represents averaged cost of keeping battery per year, and
21

K is for other expenditures.
As mentioned above, the domestic purchase price is $4.3/barrel. Battery is assumed to be
AGM sealed battery LC-LA1233P by Panasonic. Due to high temperature of the geography, the
lifetime of the battery is reduced to 8years. Considering the size of the project with 1 unit battery to be
around $45, the total cost of keeping battery per year should be $2.4 million per year. Annual
maintenance fee and other expenditure are held as constants. These last two variables cancel out by
the change in revenue equation.
The generation cost equation considers PV penetration. In order to calculate the change in
cost, business-as-usual cost equation has to be calculated. In this equation, every variables related
to PV is not considered. Thus the equation run downs to
denotes the annual fuel consumption without PV penetration assumption.
Thus the change in cost, or the additional cost from using PV breaks down to
On the other hand, there’s the revenue equation. The saved oil from PV penetration could be exported
to make revenue at a much higher price. Numbering down the opportunity cost of the oil export, the
revenue is calculated as
represents the exporting price of crude oil which is $41/barrel.
Thus the net profit equation would be change in revenue minus change in cost.
The profit result is from the perspective of the KSA which is the government. The final ratio that can
be used to scale the profitability of PV penetration profitability model would be the net profitability
per TWh generation and the return on investment rate ROI. could be defined as the net profit
E divided by the accumulated annual generation amount. This ratio can be used to figure out the
optional penetration rate of PV that maximizes the net profit. On the other hand ROI rate can be used
to evaluate the yield rate and the investment risk thereof.
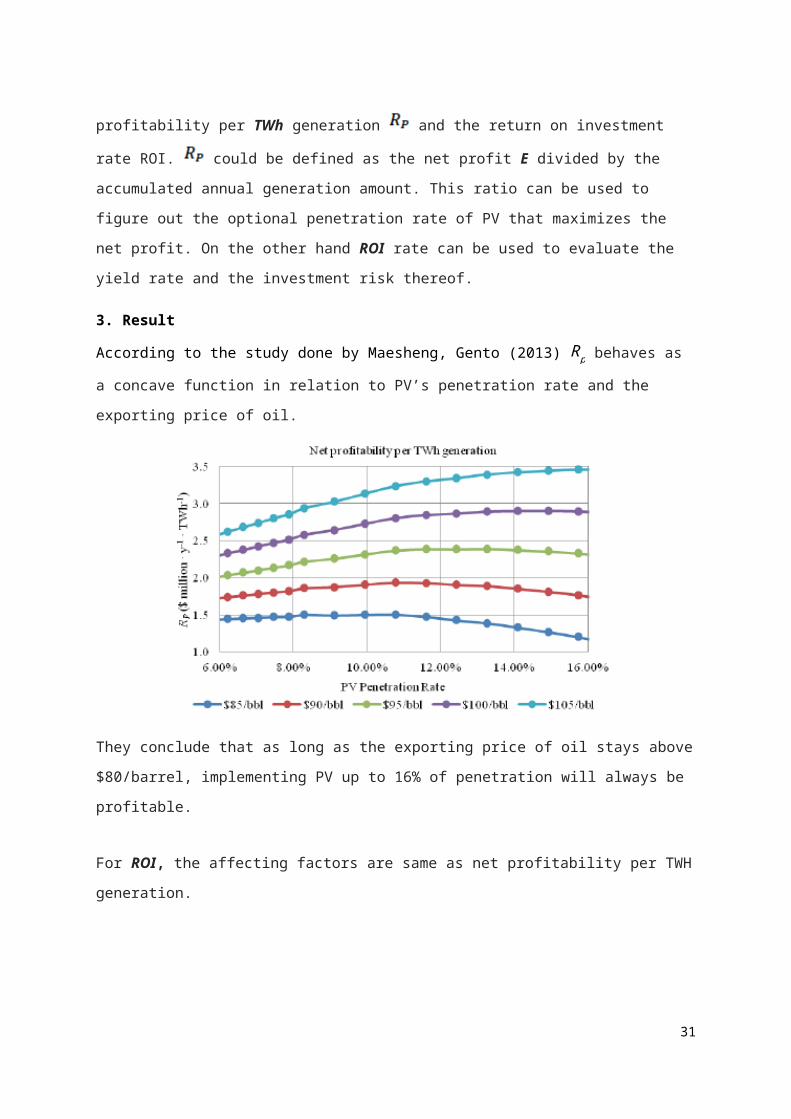
3. Result
According to the study done by Maesheng, Gento (2013) Rp behaves as a concave function in relation
to PV’s penetration rate and the exporting price of oil.22

They conclude that as long as the exporting price of oil stays above $80/barrel, implementing PV up
to 16% of penetration will always be profitable.
For ROI, the affecting factors are same as net profitability per TWH generation.
For ROI, the graph turns out to be descending with respect to PV’s penetration rate. This highlights
the fact that high PV penetration requires more expenditure on maintaining system stability.
The reason why the Rp graph turns out to be concave down is because system stability deteriorates as
PV penetration expands. Deterioration reflects the need for larger backup capacity from both the PV
and conventional energy sector.
23
As PV penetration go over 10%, the backup accumulated generation surges. This accounts for the
concave down rate of profitability per TWh.
4. Interpretation
The conclusion Maesheng, Gento (2013) makes is under an assumption that the price of oil
move around $85/barrel to $105/barrel. However, current (2015) price of oil per barrel remains
around $41/barrel.
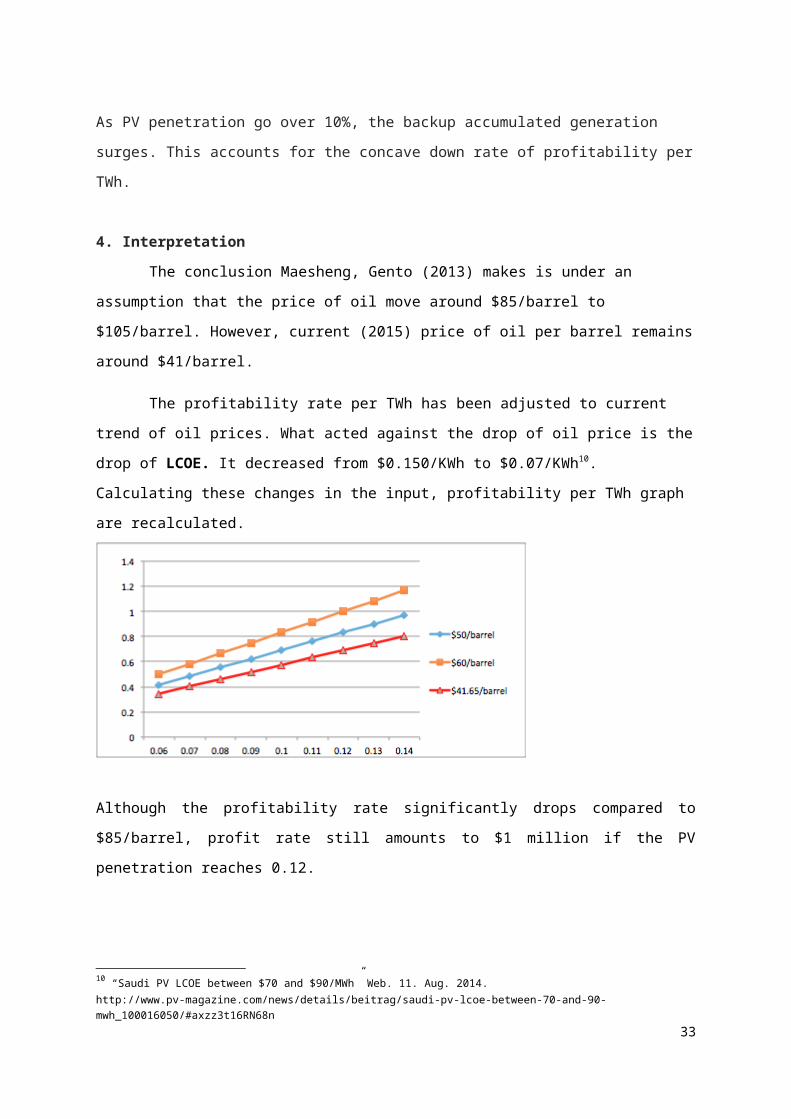
The profitability rate per TWh has been adjusted to current trend of oil prices. What acted
against the drop of oil price is the drop of LCOE. It decreased from $0.150/KWh to $0.07/KWh10.
Calculating these changes in the input, profitability per TWh graph are recalculated.
Although the profitability rate significantly drops compared to $85/barrel, profit rate still amounts to
$1 million if the PV penetration reaches 0.12.
10 “Saudi PV LCOE between $70 and $90/MWh” Web. 11. Aug. 2014. http://www.pv-magazine.com/news/details/beitrag/saudi-pv-lcoe-between-70-and-90-mwh_100016050/#axzz3t16RN68n
24

25

IV. Cost-Benefit Analysis1. Background
1.1 Policy Assessment
Saudi Arabia has announced that it has delayed $109 billion worth of solar investment that
aims at building up 41 GW of solar power by 2032 to 204011. In order to assess this change of policy
regarding solar energy development, we examine the costs and benefits associated with constructing a
41 GW PV power plant. The energy production capabilities, economic costs and benefits, and GHG
emissions reductions associated with this plant are estimated using the RETScreen software.
Moreover, we are going to estimate what percentage of domestic electricity demand will be covered
by the PV-generated electricity production in 2032. Such policy assessment is especially important as
Saudi Arabia’s increasing electricity demand, high solar radiation levels, and lofty goal to be a leader
in clean energy make Saudi Arabia an optimal candidate for increased use of PV energy.
1.2 Methodology
This study has two main components in its analysis, shown in figure below. First, we lay out
which assumptions to be used for the input values in the RETScreen analysis, which is composed of
energy production, financial feasibility and GHG emissions reductions. Second, we will discuss the
results from the RETScreen analysis. Finally, we will conduct RETScreen sensitivity analysis to
investigate how sensitive the results are in accordance with the variations in the input values.
11 Bloomberg Business – Saudi Arabia delays $109 billion solar plant by 8 years - http://www.bloomberg.com/news/articles/2015-01-20/saudi-arabia-delays-109-billion-solar-plant-by-8-years
26

1.3 RETScreen Model
RETScreen was created in 1996 by the Natural Resources Canada’s Canmet Energy Research
Center and can be downloaded for free12. This software enables decision makers to weigh the costs and
benefits of installing renewable energy (RE) projects. RETScreen is available in 35 languages and is used
worldwide by universities, colleges, private firms, and consultants for evaluating RE projects.
RETScreen software consists of user-friendly Excel worksheets standardized to provide a low-cost
preliminary assessment of RE projects. The software has flexibility options allowing users to select more
complex frameworks, which require more information but have more accurate and detailed results, or basic
frameworks for quick, inexpensive calculations. RETScreen uses built-in calculations to make the program
more user-friendly, requiring less detailed information and less computational power.
The RETScreen model calculates three different estimates for this PV project: energy
production, financial feasibility, and GHG emissions reduction. The modeler provides inputs like PV
module type, location of the PV plant, a variety of costs, electricity transmission, and 14 more, which
are then used in calculations. The following sections will discuss the various user-defined inputs
selected for the model’s worksheets.
12 RETScreen International - Download http://www.retscreen.net/ang/download.php
27
2. RETScreen Analysis
2.1 Energy Production Estimation
2.1.a. Site Selection
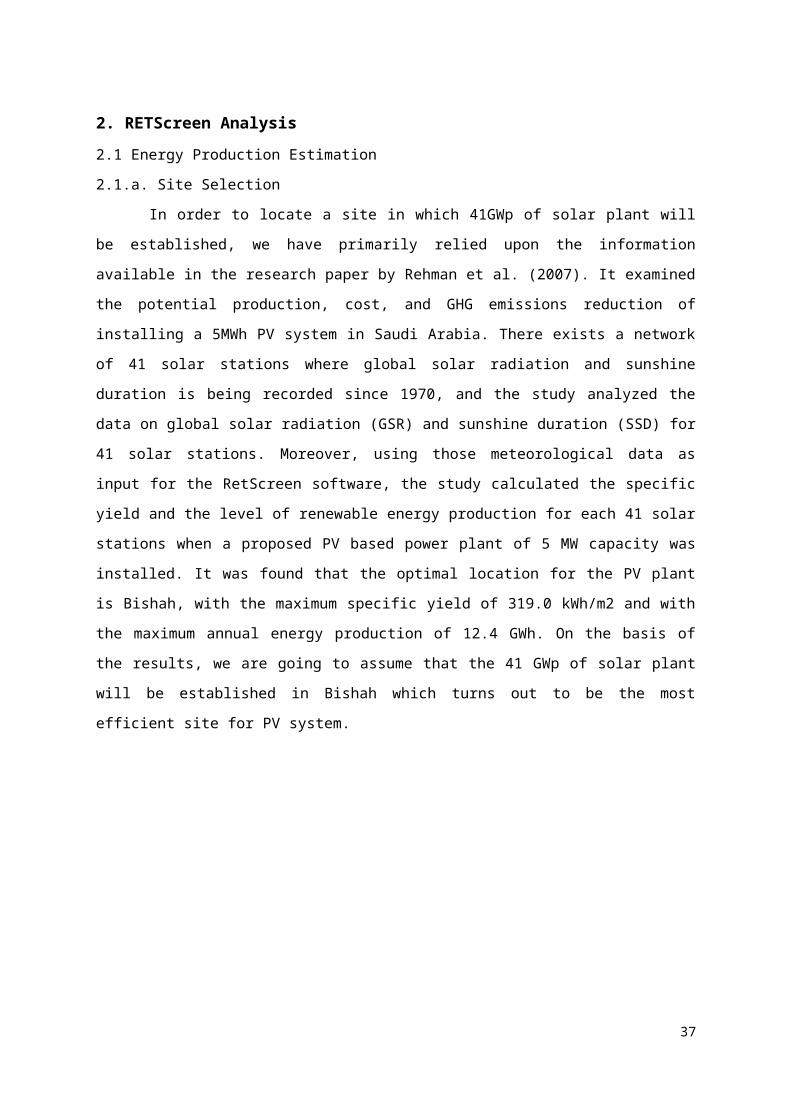
In order to locate a site in which 41GWp of solar plant will be established, we have primarily
relied upon the information available in the research paper by Rehman et al. (2007). It examined the
potential production, cost, and GHG emissions reduction of installing a 5MWh PV system in Saudi
Arabia. There exists a network of 41 solar stations where global solar radiation and sunshine duration
is being recorded since 1970, and the study analyzed the data on global solar radiation (GSR) and
sunshine duration (SSD) for 41 solar stations. Moreover, using those meteorological data as input for
the RetScreen software, the study calculated the specific yield and the level of renewable energy
production for each 41 solar stations when a proposed PV based power plant of 5 MW capacity was
installed. It was found that the optimal location for the PV plant is Bishah, with the maximum specific
yield of 319.0 kWh/m2 and with the maximum annual energy production of 12.4 GWh. On the basis
of the results, we are going to assume that the 41 GWp of solar plant will be established in Bishah
which turns out to be the most efficient site for PV system.
28

2.1.b. Global Solar Radiation
In order to accurately predict the electricity generation from the solar module, RETScreen
must have site-specific global solar radiation (GSR) values. GSR values represent the energy from the
sun striking a horizontal surface. RETScreen offers two options for inserting insolation and weather
data into the RETScreen models: 1) worldwide ground-based meteorological data from the
RETScreen weather database that has been collected from more than 1,000 locations of ground
monitoring stations, and 2) the 22-year average GSR values from NASA’s Surface Meteorology and
Solar Energy database. For the worldwide ground-based meteorological data, ground stations are
located near the populated area, making this option useful if the project is located near one of those
stations, and the second one is useful if the project is located away from any ground monitoring
stations.
The red dots represent ground monitoring station data locations and the blue dots represent the NASA
global satellite/analysis data locations for populated areas.
29

Bishah has both ground monitoring station data and NASA global satellite/analysis data location.
However, since the area in which we assume to construct 41 GW plant is far away from the ground
monitoring station data locations, this model will use the climate data from NASA’s Surface
Meteorology and Solar Energy database, other than from the RETScreen weather database. The GSR
values from both RETScreen ground monitoring station data locations and NASA’s Surface
Meteorology and Solar Energy database are shown in <Table 1>.
30
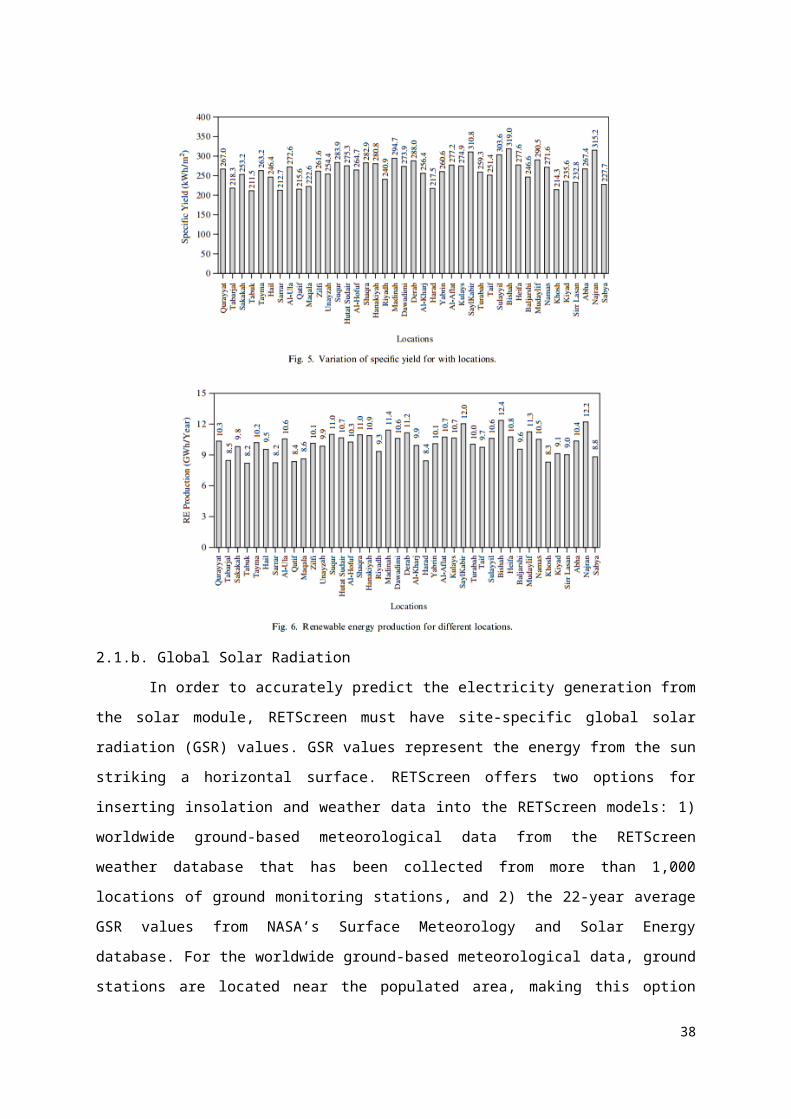
<Table 1> Monthly variation of global solar radiation in Bishah (kWh/m²/Day)
Month GSR (RETScreen) GSR (NASA)
January 5.02 4.78
February 6.21 5.55
March 6.89 6.03
April 7.57 6.41
May 7.71 6.87
June 8.39 7.21
July 8.13 6.84
August 7.88 6.37
September 7.65 6.41
October 7.13 6.03
November 6.22 5.03
December 5.23 4.58
Annual 7.00 6.01
31

2.1.c. Selection of a PV-module
1. PV-Module
RETScreen requires information about the specific PV module used to calculate energy production.
PV modules consist of collections of cells that convert the sun’s energy into direct current (DC) electricity,
and a group of PV modules together form an array. The number of modules in the system is selected to
provide the desired energy production. Large number of PV-modules with widely different characteristics is
available in the market, and RETScreen has an existing database of module brands with associated input
data required to run RETScreen.
The study by El-Shimy (2009) examined a number of different solar PV module types. A survey of
the characteristics of most of the available PV-modules from different manufactures was done, and PV-
modules with efficiency less than 15% were not selected in this study. After the candidate modules list was
formed, the selection of a specific module from the candidate module list was then based on the value of
ratio of the module capacity and its frame area (Capacity/Area criteria). Based on the stated selection
criteria, the study selected the model with the maximum ratio of capacity/area, which turned out to be the
mono-So-HIP-205BA3 PV-module from Sanyo. Since the procedure through which the PV module was
selected in this study helps choose the PV module that optimizes its efficiency in terms of collecting the
maximum solar energy with the minimum area needed for installation, this paper will assume the same PV
module that was selected in the study by El-Shimy (2009).
32
2. Tracking system
RETScreen offers four selections for the type of sun tracking device upon which the solar collector
is mounted. The options from the drop-down list are; “Fixed”, “One-axis”, “Two-axis”, and “Azimuth”.
“Fixed” is selected if the solar collector is mounted on a fixed structure while the remaining choices may be
selected if the solar collector is mounted on a tracker. A tracker moves the solar collector in a prescribed
way to minimize the angle of incidence of beam radiation on the collector’s surface. Hence, incident beam
radiation (i.e., solar energy collected) is maximized. In this paper, two-axis tracker, which always position
PV-modules surface normal to the beams of the sun by rotating about two axes, is selected to maximize the
electrical energy production from the considered PV power plant.
3. PV Miscellaneous losses
Power production of photovoltaics can decrease significantly with the accumulation of dust or sand
on the surface of the PV cell, often called “soiling.” There have been numerous studies of the soiling effect
on PV cells (Kimber et al., 2006; Tang et al., 2006; Thornton, 1992). The soiling effect is especially
important in the desert conditions of Saudi Arabia, where sand storms can deposit large amounts of dust and
sand on the PV cell. This loss of energy production is input into the model as “miscellaneous losses,”
representing the percentage decrease in production.
The proposed PV system utilizes a two-axis tracking system, which will experience fewer
production losses as compared to a fixed solar collector. Solar tracking systems maximize electricity
production by rotating the PV module throughout the day to follow the sun path to increase the direct
sunlight received by the panel. Tracking arrays can also be useful to protect against destructive sandstorms,
often higher above ground and movable to decrease wind load, rotating the face of the PV cell away from
the dust and wind (Thornton, 1992).
A 1990 study by Said examined the performances of photovoltaic and thermal modules during
several months of outdoor exposure in Saudi Arabia. In the case of photovoltaic modules, the monthly
average degradation was 7%. In our model, we take into account that the tracking arrays (two-axis for our
model) will further prevent the effects of soiling. Therefore, we assume that dust and soiling will decrease
annual production by 5 %. Later, sensitivity analysis will be performed to measure how the input value for
PV miscellaneous losses affect the result.
4. Inverter
Direct current into alternating current (DC/AC) inverters are utilized in the proposed power plant to
convert DC into AC to feed the grid. From the study by El-Shimy (2009), each inverter has an efficiency of
95% and a capacity of 4750 kW for 5MW PV system. Therefore, for our model, we will assume the same
efficiency and multiply the given capacity by 8,200 (5MW x 8,200 = 41 GW), which results in the capacity
of 38,950,000 kW.
33

The below screenshot is a following result; two-axis, 41 GW mono-Si-HIP-205BA3 PV-module
from Sanyo, consisting of 200000002 units; its efficiency would be 17.4% and the solar collector area
would be around 235 km2; miscellaneous losses from soiling would be 5%; the efficiency, capacity, and
miscellaneous losses of the inverter would be 95%, 38,950,000 kW, and 0% respectively.
Considering that the solar collector area would be around 235 km2, the below is a hypothetical
blueprint of where the proposed PV- system will be constructed.
2.2 Financial Feasibility Assessment
34

RETScreen’s financial analysis accounts for the benefits of the electricity produced and the costs of
the PV power plant. These estimates are then used to show financial statistics, like net present value (NPV),
simple payback period (SPP), and internal rate of return (IRR) of the project.
The cost components are divided into initial cost, annual (operation and maintenance) cost. The initial
cost is further broken into: feasibility study, development, engineering, power system, and balance of
system & miscellaneous.
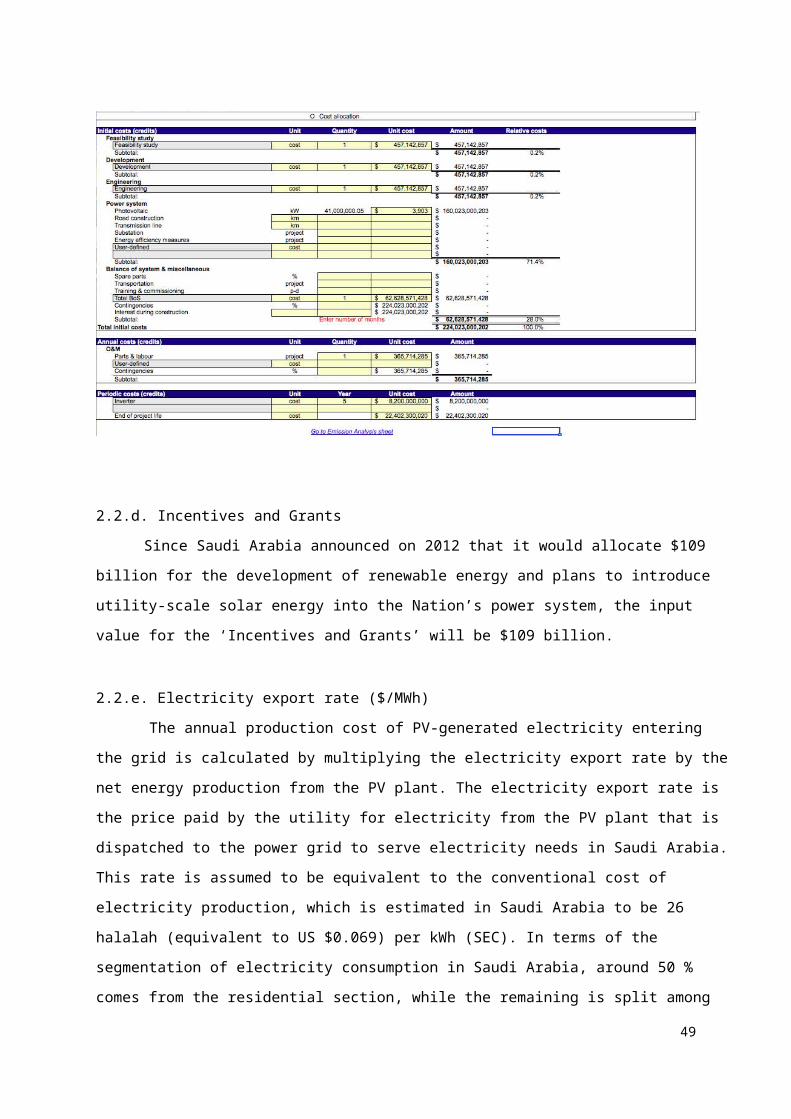
2.2.a. Initial Costs
The unit cost of the photovoltaic panels is estimated as $ 800 per panel for mono-So-HIP-205BA3
PV-module from Sanyo. Since the proposed PV system consists of 200000002 units, the total equipment
costs $ 160 billion. Due to unavailability of data, the study adopts estimate of the shares of the various cost
components from a previous study as follows: feasibility study (0.2%); development cost (0.2%);
engineering cost (0.2%); renewable energy equipments (71.4%); and balance of plant cost (28%). (El-
Shimy, 2009; Rehman et al., 2007; Hrayshat, 2009). The PV module costs will makeup the majority of the
costs of the system.Since these figures are merely estimates, extrapolating from previous studies, the
sensitivity analysis scenario discussed later will assume how the financial feasibility assessment changes
with the differing prices.
For this study, we estimated the cost of the renewable energy equipment, and apportioned other cost
components for the base-case scenario. Therefore, the feasibility study, development, and engineering
estimates would be $ 457.142 million respectively. The balance of system (BoS) costs are estimated to be
$62.628 billion. BOS costs include the tracking system, inverter, electrical components, and installation.
The total initial cost is predicted to be $228.571 billion.
2.2.b. Annual costs & Periodic Costs
Annual costs consist of operating and maintenance and periodic costs, such as replacing inverters.
Operating and maintenance costs are relatively small as PV systems are low maintenance. A 2005 report on
the performance of a 3.5 MW power plant in Arizona documented every maintenance cost for three years,
and found average annual cost to be 0.16% of total initial cost (Moore et al., 2005). Applying this 0.16%
cost assumption, the PV plant would have an estimated $365,714,285. Periodic costs are fairly low as PV
modules themselves are very durable and often come with 20 year guarantees. Inverters, however, have a
shorter lifetime and are estimated to cost approximately $2 million every 5 years for replacement for 10MW
(El-Shimy, 2009). Therefore, this study assumes 2,000,000 x 4,100 = $8.2 billion.
2.2.c. End-of-life costs (of Salvage value)
35

One other thing to be taken into consideration is the end-of-life costs for a PV system after
its life; a recent study examining the financial aspect of solar power project estimated that a PV
system would be worth 10% of its original value after 30 years (Komoto et al., 2009). Using this
assumption, we assume that the PV system’s salvage value to be approximately $22.857 billion. A
summary of the values to compute the expected cost for the 41 GWp PV power plant is shown below
in <Table 2>.
<Table 2> Initial, periodic, annual, and end-of-life cost for the PV power system
Type of Cost $ USD % of Initial Costs
Feasibility Study $457,142,857 0.2%
Development $457,142,857 0.2%
Engineering $457,142,857 0.2%
Equipment $160,023,000,203 71.4%
Balance of System Costs (BOS Costs) $62,628,571,428 28.0%
Total Initial Costs $224,023,000,202 100.00%
Inverter Replacement Costs $8,200,000,000 Every 5 years
Operation and Maintenance $365,714,285 Annually
End-of-Life Costs (Salvage Value) $22,402,300,020 10%
2.2.d. Incentives and Grants
36
Since Saudi Arabia announced on 2012 that it would allocate $109 billion for the development of
renewable energy and plans to introduce utility-scale solar energy into the Nation’s power system, the input
value for the ‘Incentives and Grants’ will be $109 billion.
2.2.e. Electricity export rate ($/MWh)
The annual production cost of PV-generated electricity entering the grid is calculated by
multiplying the electricity export rate by the net energy production from the PV plant. The electricity export
rate is the price paid by the utility for electricity from the PV plant that is dispatched to the power grid to
serve electricity needs in Saudi Arabia. This rate is assumed to be equivalent to the conventional cost of
electricity production, which is estimated in Saudi Arabia to be 26 halalah (equivalent to US $0.069) per
kWh (SEC). In terms of the segmentation of electricity consumption in Saudi Arabia, around 50 % comes
from the residential section, while the remaining is split among industry, commercial sector and
governmental agencies (21%, 15% and 12% respectively). As will be seen in the later section, the annual
electricity production from the proposed PV system will be around 124,271,432 MWh (= 123 billion GWh).
This figure will be about 20% to 40 % of total electricity consumption by 2032. Therefore, the assumption
that the whole electricity produced from the PV system will be sold to the industry, commercial and
governmental sections at highest price is reasonable. Moreover, since the Saudi Arabia uses Time of Use
(TOU) tariff system for measuring the cost of electricity consumption, we will assume that the price of
electricity will remain the same throughout the project life, meaning that the electricity export escalation
rate is 0%.
2.2.f. Inflation Rate
37
There are many estimates for the forecasts of inflation rates for Saudi Arabia ranging from 2.5 - 3%. The
projection below is one of many examples from IMF, and it forecasts the inflation to be 2.85%13. For this
model, we will simply use the inflation rate of 2.7% in 2014 (World Bank) for simplicity.
2.2.g. Discount Rate
Due to the unavailability of data for the discount rate, this model will assume the input values as
were estimated in other previous studies (El-Shimy, 2009; Rehman et al., 2007; Hrayshat, 2009). For this
model, the discount rate will be 5%.
2.2.h. Project Life
According to Renewable Power Generation Costs in 2014 by international renewable energy
agency, the economic life for the solar PV is 25 years; moreover, other previous studies adopt the project
life as 25 years (El-Shimy, 2009; Rehman et al., 2007; Hrayshat, 2009). Therefore, this model will assume
the project life to be 25 years.
2.2.i. Income from GHG Emissions Reduction Credit Trading
RETScreen also can account for the monetary value of GHG emission reductions. However, our
baseline assumption is that these external benefits will not be included, as Saudi Arabia currently has no
monetary incentives in place for GHG emissions reduction. Thus, this proposed PV project is assumed to
receive no GHG emissions credits; however, one sensitivity analysis scenario discussed later assumes GHG
emissions credits are received for the plant.
13 Forecast of Inflation Rate in Saudi Arabia from ‘STATISTA’- inflation forecast http://www.statista.com/statistics/268062/inflation-in-saudi-arabia/
38

The inflation rate, discount rates, and other financial indicators are shown below.
2.3 GHG Emissions Analysis
GHG emissions analysis helps the user estimate the greenhouse gas emission reduction (mitigation)
potential of a proposed clean energy project. To calculate GHG emissions reductions, the net amount of
annual energy produced from the 41 GW power plant is assumed to represent an equivalent amount of
conventional electricity that no longer needs to be produced. The base case electricity system is calculated
by inputs of the electricity source mixture by fuel type, GHG emission factor, and baseline transmissions
and distribution (T&D) losses. GHG emission factors is defined as the mass of greenhouse gas emitted per
unit of energy produced. Losses from transmissions and distribution are reported to be 2% and 8%,
respectively, all of which add up to 10% for the T&D losses (Miller, 2009).
RETScreen compares this baseline GHG emissions case with the proposed new electricity
system, which has integrated the 41 GW power plant into the electricity grid. The PV plant is 100%
powered by solar radiation and emits no GHGs. The transmission and distribution (T&D) losses for
the proposed new electricity system are assumed to be 10% as well.
3. RETScreen Results
3.1 Projected Energy Production
The proposed power plant is projected to produce approximately 102,090,306 MWh ( = 102 billion
kWh) annually of (alternating current) electricity available for export to the electricity grid. This number
takes into account losses from sand and dust, as well as the effects of inverter efficiency and outside
temperatures on performance of the PV system. Total net electricity consumption in Saudi Arabia in 2014
was 240 billion kWh (CIA, 2010). Thus, this plant could meet the needs of about half of total domestic
electricity consumption. Moreover, total net electricity consumption in 2032 will be ranging from 430
billion to 720 billion kWh; given this information, the 41 GW power plant would account for 15-25% of
total electricity consumption by 2032. The power plant capacity factor represents the ratio of actual energy
39

output compared with the plant’s optimal nameplate capacity. The PV power plant capacity factor is
estimated to be 28.4%. The peak electricity export occurs in the month of June, when production is 9,453
billion kWh.
3.2 Financial Analysis Results
40

RETScreen calculates numerous financial indicators, enabling comparisons among other investment
projects and reflection on the economic feasibility of any project. The main financial indicators are reported
further discussed in the following paragraphs.
In NPV analysis, the present value of all cash inflows is compared with the present value of all cash
outflows associated with an investment project. The difference between the present values of these cash
flows, called the NPV, determines whether the project is generally an acceptable investment or not. Positive
NPV values are an indicator of a potentially feasible project. The NPV for this project is shown in below.
This shows the calculations for the net present value of the PV project.
The NPV for the PV plant with a 25-year assumed lifetime is - $ 65.334 billion. Equation shows
that components of the NPV equation. The energy production cost measures the total cost for producing one
kWh of electricity and is estimated to be $114.41/MWh. The net benefit-cost (BC) ratio compares the cost
of the project’s equity to the benefits of all income over the 25-year lifetime in present value. The net BC
ratio is projected to be 0.71. Ratios larger than 1 are desired for projects, as the benefits would be greater
than the costs. Annual life cycle savings (ALCS) represents the yearly benefit of the PV plant, taking into
account net present value, project lifetime, and the discount rate. The ALCS for the project is projected to be
-$ 4,635 billion annually. The simple payback period indicates how many years it takes to recoup the initial
and annual costs given positive annual income from the PV system. This PV power plant has a payback
period of 17.2 years.
The results summarized in Table 12 do not include estimates of GHG emission reduction benefits.
The current negative NPV demonstrates that without including the benefits of reduced GHG and air
pollutant emissions, solar power is not economically feasible. However, the conclusion may be different if
the income from GHG emissions reduction credit is taken into account.
41
42

43

3.3 GHG Emissions Reductions
For the base case electricity system (baseline), the GHG emissions factor for Saudi Arabia,
excluding T&D losses, is calculated to be 0.737 tons of CO2 per MWh per year.
When T&D losses are accounted for, the factor increases to 0.819 tons of CO2 per MWh. For the
base case system GHG summary (baseline), GHG emission is calculated to be 83,576,036 tons of CO2/yr.
This emissions rate is compared with the proposed PV power plant, which has a GHG emissions
zero factor of zero. However, T&D losses are taken into account, whereby GHG emission is calculated to be
8,357,603 tons CO2/yr
The model estimates that the PV plant will reduce GHG emissions by 75,218,432 tons of CO2
annually. Assuming a 25-year lifetime for the plant, approximately 1,880,460,814 tons of CO2 emissions
will be avoided as the PV power plant replaces the need of some electricity from the existing power grid.
44

4. RETScreen Sensitivity Analysis
4.1 Global Solar Radiation
The current global solar radiation (GSR) values reflect the 22-year averaged insolation data
from NASA. However, if we use the data from the worldwide ground-based meteorological data from
the RETScreen weather database, which has higher average GSR values, then RETScreen predicts a
more favorable situation. The difference in GSR values are likely due to the fact that the locations of
GSR records are slightly different. If these records were used,. The annual electricity production is
estimated to increase to 124 billion kWh per year. Given the increase in projected energy production,
electricity production costs decrease to $93.99/kWh, and NPV decrease to $-43.764 billion. These
changes show that site specific GSR values are important to accurately predict energy production
potential at any location.
45

4.2 Losses Due to Sand and Dust
There is a wide range of possible percentage losses in the energy production due to sand and dust on
the PV panel. The value for miscellaneous losses was changed from its original value of 5% to 2% and 10%
in order to examine effects on resulting values. If the PV panel had losses of 2 percent due to sand and dust,
the resulting energy production would increase to 105 billion kWh per year, with a capacity factor of 29.3%.
The NPV would decrease to - $62.199 billion and electricity production cost decreases to $110.91/kWh.
Conversely, if PV losses were projected to be 10 percent, the energy production would be 96 billion kWh,
with a capacity factor of 26.9%. The NPV would increase to $-70.560 billion and electricity production cost
increases to $120.76/kWh.
4.3 Initial Costs
The initial cost of the project may also vary. Total installed costs for solar PV systems have fallen
rapidly since 2008 as a result of significant overcapacity in module manufacturing and cut-throat
competition (International Energy Agency, 2009). Assuming that the price of PV module will decrease
significantly, the NPV will be approximately reach a break-even point (close to zero), if the initial cost
decreases by 29.1643106%. The resulting initial cost will be $158.688 billion.
4.4. Income from GHG Emissions Reduction Credit Trading
It is currently assumed that the PV project receives no benefit from GHG emissions reduction, with
GHG emissions reduction credits valued at $0/ ton CO2 eq. However, financial indicators would improve
when GHG credits trading is included. Carbon trading schemes attempt to internalize the externalities of
GHG emissions by putting a price on emitting CO2. Clean energy projects in Saudi Arabia are eligible for
Clean Development Mechanism (CDM) funding. The CDM was established under the Kyoto Protocol as a
way for developed countries to fund GHG emissions reductions projects in other countries, where projects
are potentially less expensive. The carbon prices observed vary significantly, from less than $1/tCO 2 to
$130/tCO2. The majority of emissions (85 percent) are priced at less than $10/tCO2. (World Bank, 2015).
Thus, a RETScreen analysis was conducted that assumes that the PV plant would receive GHG
emissions credits of $10/ton, with a 5% escalation rate for 25 years. The benefit from this income has
46
$752,184,325 annually; however, this benefit is not enough to make the project profitable with the NPV
only decreasing to $-46.530 billion. In order for the NPV to reach its break-even point, GHG reduction
credit rate should be increased by 247.44%, whereby its rate becomes $34.7410/tCO2.
4.5. Electricity export rate
In order for the NPV to reach its break-even point,electricity export rate should be increased by
65.808%, whereby its rate becomes $114.41/MWh.
5. Remarks
According to the RETScreen Software, the energy production potential for large scale PV power
plants in Saudi Arabia is extremely high, with a capacity factor of 28.4%. A 41 GW power plant close to
Bisha city is predicted to generate 102 billion kWh of electricity each year. However, large-scale PV power
plants are currently not profitable, with an estimated NPV of -$65.334 billion for a 41 GW facility. We 47

believe this negative NPV demonstrates why Saudi Arabia delayed its announced policy of developing $109
billion worth of solar investment to build up 41 GW of solar power by 2032.
The financial feasibility of the project is highly dependent on 1) the initial cost of the PV system, 2)
the electricity rate the PV plant will receive for power delivered to the grid, and 3) the GHG emissions
credits rate. The current expected price of $69/MWh is too low to generate enough profits for the project to
be viable. In order to for NPV to reach a break-even point, the electricity export rate would have to be
$45.41/MWh greater. Thus, the PV project would be profitable if a feed-in-tariff were established that
would guarantee a purchase price of the electricity generated.
The initial costs of constructing a 41 GW of solar power are too expensive at this rate. From the
sensitivity analysis, it is found that the initial costs has to be lower by 29.1643106% for the NPV to reach its
break-even point, whereby the resulting initial cost will be $158.688 billion. This implication is nonetheless
not impractical, as the emergence of Chinese market for PV module keeps driving the price down. It could
be inferred that Saudi Arabia delayed its investment, so that the price of PV module keeps decreasing to a
level that the initial costs will not partake the significant portion of the $109 billion subsidy.
Moreover, the GHG emissions credit rate is not high enough. That is, the benefit from this income
is not high enough to offset the benefit of developing a renewable energy capacity. From the sensitivity
analysis, it is found that GHG reduction credit rate should be increased by 247.44% - its rate becoming
$34.7410/tCO2, in order for this project to be financially feasible.
Additional research is highly recommended, as there are limitations to the RETScreen model.
This analysis examined the feasibility of only PV energy and no other renewable energy source such
as wind, concentrated solar, and geothermal. In addition, RETScreen requires fixed values for inputs
while a range of possible values could be more appropriate in cases where uncertainty exists such as
imputing GSR values, the electricity export rate, and initial costs values. Such uncertainty has to be
accounted for, when evaluating such renewable energy policy as that of Saudi Arabia, since the
magnitude of utility-sized project is significantly greater than either the residential-sized or
commercial-sized projects.
V. ConclusionThroughout the course of this paper, we highlighted that Saudi Arabia certainly has the
potential to make the transition to renewable energy. The kingdom has abundant conventional energy
source (at least for the time being) and renewable energy source, namely petroleum and sun radiation,
respectively. The government clearly understands the need for renewable energy development,
acknowledges that their oil dependence is too high, digging deeper into their limited oil reserves, and
thus proclaimed in 2012 an ambitious goal of developing 54GW of energy from renewable sources.
Without doubt, such efforts are greatly welcomed and applauded. Renewable energy is the future and
must be developed to its full potential. 48
However, we take a step further to examine if the current economic environment is a
profitable time for such a transition. The profitability analysis identifies that even with today’s lower
oil prices, if PV penetration rates reach 12%, it is a profitable transition for Saudi Arabia. Further
considering the fact that today’s low oil prices are mostly consequences of a political and deliberate
measure by Saudi Arabia to crowd out higher-cost producers of oil, and that oil prices will rebound to
higher levels in the following years, we believe there are greater opportunities to gain profits by
addressing the inefficiency of oil subsidies and increasing exports. The cost-benefit analysis is
targeted to examine the validity of the government’s policy. Using the RETScreen software, we take
multiple factors and variables into account to determine the NPV of the policy. The results show a
negative NPV, which can be an explanation for the 8-year delay in meeting its goals. By no means
does this imply that Saudi Arabia should not make the transition to renewable energy; the results
merely signify that under the given assumptions and current state of technological and economic
environment, reaching the goal of developing 41GW of solar energy by 2032 comes at greater costs
than benefits. Renewable energy development is the ultimate goal but our analysis shows that now is a
costly time for the transition. Nevertheless, that cost may not simply be a one-time “expense”, but a
worthwhile expenditure, an investment for the future. The interpretation remains at each country’s
discretion and is a further valid study. In so far as Saudi Arabia, we conclude that renewable energy
transition is a feasible but yet to be an entirely profitable agenda.
49

VI. Works CitedI. Introduction
Alhouti, Aljowhara. "Deployment of Solar Energy in Saudi Arabia: A Case Study." The George Washington University Law School Course on Energy and Environment. Web. 30 Nov. 2015. https://gwujeel.files.wordpress.com/2013/09/johara-alhouti.pdf
"Country Comparison: Crude Oil – Proved Reserves." The World Factbook - Saudi Arabia. Central Intelligence Agency, 2015. Web. 4 Dec. 2015. https://www.cia.gov/library/publications/the-world-factbook/rankorder/2244rank.html#sa
"Oil in Saudi Arabia." World Energy Council. Web. 4 Dec. 2015. https://www.worldenergy.org/data/resources/country/saudi-arabia/oil
"Petroleum (Oil) Production". International Petroleum Monthly (U.S. Energy Information Administration). Apr 2008. Web. 4 Dec. 2015
"Saudi Arabia Electricity - Production by Source." - Energy. CIA World Factbook, 21 Feb. 2013. Web. 3 Dec. 2015. http://www.indexmundi.com/saudi_arabia/electricity_production_by_source.html.
"The World Factbook - Saudi Arabia." Central Intelligence Agency. Web. 23 Nov. 2015. https://www.cia.gov/library/publications/the-world-factbook/geos/sa.html.
"Venezuela: Oil Reserves Surpasses Saudi Arabia's." Ahramonline. Reuters, 16 Jan. 2011. Web. 4 Dec. 2015. http://english.ahram.org.eg/NewsContent/3/14/4060/Business/Markets--Companies/Venezuela-Oil-reserves-surpasses-Saudi-Arabias.aspx.
II. Solar Energy Transition in Saudi Arabia
Alshakhs, Mohammed. "Challenges of Solar PV in Saudi Arabia." Stanford University. 13 Dec. 2013. Web. 25 Nov. 2015. <http://large.stanford.edu/courses/2013/ph240/alshakhs2/>.
Boyden, Luke. "What Are Mono Silicon, Poly Silicon And Thin Film Solar Panels?" Clean Energy Reviews. 24 Aug. 2014. Web. 12 Nov. 2015. <http://www.cleanenergyreviews.info/blog/pv-panel-technology>.
"Barriers to Saudi Solar Power." Crossroads Arabia. 24 May 2012. Web. 14 Nov. 2015. <http://xrdarabia.org/2012/05/24/barriers-to-saudi-solar-power/>.
"Concentrating Solar Power Technologies Offer Utility-scale Power Production." U.S. Energy Information Administration. 16 Mar. 2011. Web. 31 Oct. 2015. <https://www.eia.gov/todayinenergy/detail.cfm?id=530>.
"Concentrated Solar Power: Versatile Technology with Huge Potential for Clean and Affordable Energy." Solar Server. Web. 24 Nov. 2015. <http://www.solarserver.com/solar-magazine/solar-report/solar-report/concentrated-solar-power.html>.
Green, Dino. "Advantages and Disadvantages of Solar Photovoltaic – Quick Pros and Cons of Solar PV." Renewable Energy World. Com. 19 Dec. 2012. Web. 17 Nov. 2015. <http://blog.renewableenergyworld.com/ugc/blogs/2012/12/advantages-and-disadvantages-of-solar-photovoltaic-quick-pros-and-cons-of-solar-pv.html>.
50
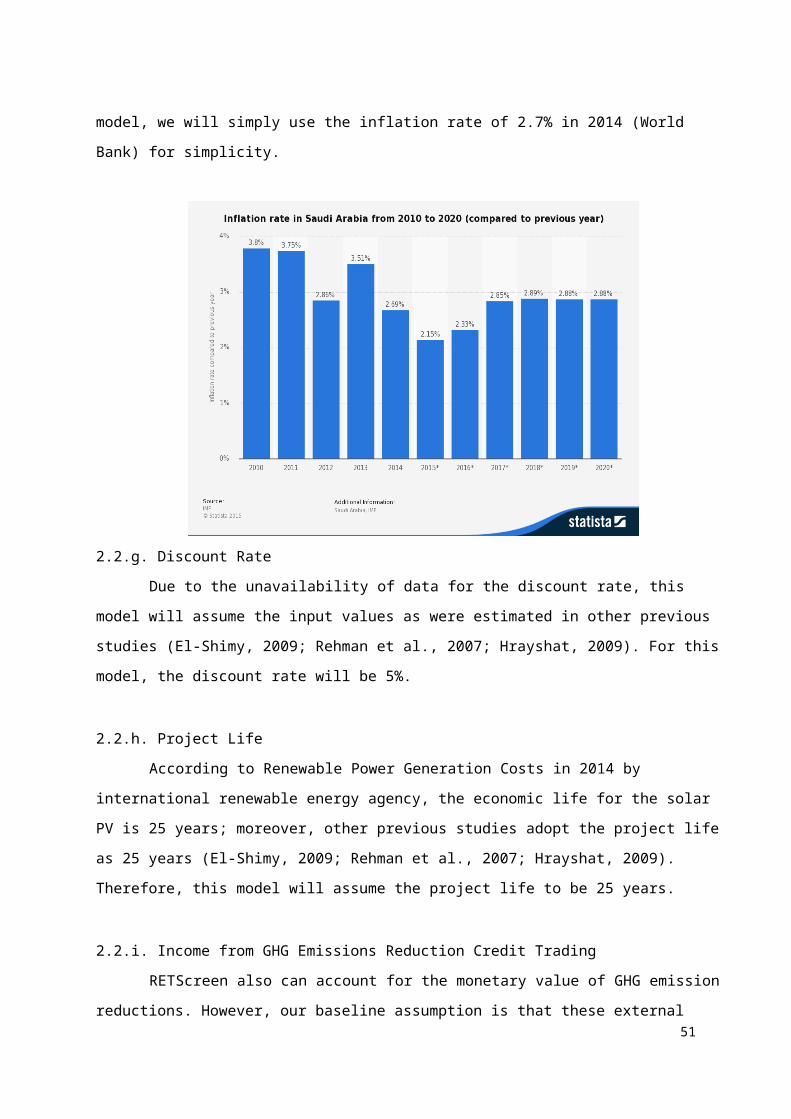
Green, Dino. "Solar Energy Systems: Concentrated Solar Power (CSP)." Renewable Green Energy Power. 4 Jan. 2012. Web. 24 Nov. 2015. <http://www.renewablegreenenergypower.com/concentrated-solar-power/>.
Maehlum, Mathias. "Which Solar Panel Type Is Best? Mono- vs. Polycrystalline vs. Thin Film." Energy Informative. 18 May 2015. Web. 27 Oct. 2015. <http://energyinformative.org/best-solar-panel-monocrystalline-polycrystalline-thin-film/#monocrystalline-silicon>.
NOMADD. Web. 28 Nov. 2015. <http://www.nomaddesertsolar.com/the-nomadd-technology.html>.
"Photovoltaic (Solar Electric)." Solar Energy Industries Association. Web. 16 Nov. 2015. <http://www.seia.org/policy/solar-technology/photovoltaic-solar-electric>.
"Power Generation: Moten Salt." ESolar. Web. 22 Nov. 2015. <http://www.esolar.com/applications/ms-power/>.
Richard, Michael. "Rugged Robot from Saudi Arabia Cleans Dusty Solar Panels without Using Water." Tree Hugger. 9 July 2014. Web. 19 Oct. 2015. <http://www.treehugger.com/solar-technology/rugged-robot-saudi-arabia-cleans-dusty-solar-panels-without-using-water.html>.
Shah, Abhishek. "Advantages and Disadvantages of Solar Thermal Energy (Power Towers,Parabolic Troughs)." Green World Investor. 7 July 2011. Web. 24 Nov. 2015. <http://www.greenworldinvestor.com/2011/07/07/advantages-and-disadvantages-of-solar-thermal-energy-power-towersparabolic-troughs/>.
"Solar - How Solar Plants Work." NextEra Energy Resources. Web. 21 Nov. 2015. <http://www.nexteraenergyresources.com/what/solar_works.shtml>.
"Solar Photovoltaic Technology Basics." National Renewable Energy Laboratory. Web. 28 Oct. 2015. <http://www.nrel.gov/learning/re_photovoltaics.html>.
Steel, William. "Stanford Engineers Develop Solar Cell Cooling Coating To Boost Efficiency." Clean Technica. 30 Sept. 2015. Web. 19 Nov. 2015. <http://cleantechnica.com/2015/09/30/stanford-engineers-develop-solar-cell-cooling-coating-boost-efficiency/>.
"Types of Photovoltaic (PV) Cells." National Energy Foundation. Web. 4 Nov. 2015. <http://www.nef.org.uk/knowledge-hub/solar-energy/types-of-photovoltaic-pv-cells>.
"Types of Solar Panel." C-Changes. Web. 6 Nov. 2015. <http://www.c-changes.com/types-of-solar-panel>.
Waco, Damian. "How Heat Affects Solar Panel Efficiency." Civic Solar. 8 Nov. 2011. Web. 7 Nov. 2015. <http://www.civicsolar.com/resource/how-heat-affects-solar-panel-efficiency>.
III. Cost-Benefit Analysis
Bloomberg Business (2015), Saudi Arabia delays $109 billion solar plant by 8 years - http://www.bloomberg.com/news/articles/2015-01-20/saudi-arabia-delays-109-billion-solar-plant-by-8-years
51

Clean Development Mechanism (CDM) - http://www.cdmdna.gov.sa/index.aspx
CIA. (2012). CIA World Factbook – Saudi Arabia. 2012, from https://www.cia.gov/library/publications/the-world-factbook/geos/sa.html
El-Shimy, M. (2009). Viability analysis of PV power plants in Egypt. Renewable Energy, 34(10), 2187-2196.
Hrayshat, E. S. (2009). Viability of solar photovoltaics as an electricity generation source for Jordan. Renewable Energy,
International Energy Agency. (2009). Trends in photovoltaic applications: survey report of selected IEA countries between 1992 and 2008 No. EIA-PVPS T1-18: 2009)
Kimber, A., Mitchell, L., Nogradi, S., & Wenger, H. (2006). The effect of soiling on large grid-connected photovoltaic systems in California and the southwest region of the United States. Paper
presented at the Conference Record of the 2006 IEEE 4th World Conference on Photovoltaic Energy Conversion, 2 2391-2395.
Komoto, K., Ito, M., van der Vleuten, P., Faiman, D., & Kurokawa, K. (2009). Energy from the desert: Very large scale photovoltaic systems: Socio-economic, financial, technical and environmental aspects. International Energy Agency Photovoltaic Power Systems Program.
Miller, K. (2009). Electricity and water demand forecast 2009-2030. Abu Dhabi Water & Electricity Company.
Moore, L., Post, H., Hansen, T., & Mysak, T. (2005). Photovoltaic power plant experience at Tucson Electric Power, Energy Conversion and Resources, 2005, 387–394.
NASA Surface Meteorology and Solar Energy - Location; https://eosweb.larc.nasa.gov/cgi-bin/sse/[email protected]
Rehman, S., Bader, M. A., & Al-Moallem, S. A. (2007). Cost of solar energy generated using PV panels. Renewable and Sustainable Energy Reviews, 11(8), 1843-1857.
RETScreen International. (2001-2004). Clean energy project analysis: RETScreen engineering and cases textbook. Canada: Minister of Natural Resource.
RETScreen International - Download http://www.retscreen.net/ang/download.php
Said SAM. Effects of dust accumulation on performances of thermal and photovoltaic flat-plate collectors. Applied Energy 1990; 37(1): 73–84, DOI: 10.1016/ 0306-2619(90)90019-A
Saudi Electricity Company https://www.se.com.sa/en-us/Pages/ChangingTariffForCommercialAndIndustrialSectors.aspx
Statista - inflation forecast in Saudi Arabia - http://www.statista.com/statistics/268062/inflation-in-saudi-arabia/
Tang, Y., Raghuraman, B., Kuitche, J., TamizhMani, G., Backus, C., & Osterwald, C. (2006). An evaluation of 27 years old photovoltaic modules operated in a hot-desert climatic condition.
52

The International Renewable Energy Agency - http://www.irena.org/documentdownloads/publications/irena_re_power_costs_2014_report.pdf
Thornton, J. (1992). The effect of sandstorms on PV arrays and components. Paper presented at the Conference: SOLAR92: American Solar Energy Society Cocoa Beach, FL (United States), 15-18 Jun 1992,
World Bank - Saudi Arabia inflation data http://data.worldbank.org/indicator/FP.CPI.TOTL.ZG/countries/1W?display=default
World Bank (2015) - Carbon Pricing - http://www-wds.worldbank.org/external/default/WDSContentServer/WDSP/IB/2015/09/21/090224b0830f0f31/2_0/Rendered/PDF/State0and0trends0of0carbon0pricing02015.pdf
53