circabc.europa.eu · web viewd 250 (50 kt/yr and below)1 105 (200 kt/yr) 1 65 @ 600 kt/yr1...
TRANSCRIPT

Data gathering and impact assessment for a possible technical review of the IPPC Directive – Part 2
Fact Sheet C.2.Extension of current IPPC activity definition
Potential amendment C2: Extension of the current IPPC activity definition – to make all WID plants subject to IPPC
Status: final – 25/09/2007
1. IssueAim of the study: The present work identifies the issues related to a possible extension of the IPPC Directive to cover all incineration and co-incineration plants covered by the Waste Incineration Directive. The current work is based on a background literature survey, and inputs from various relevant associations and other stakeholders. It also takes into account the comments of the Advisory Group members on the draft final report.
Background: Incineration of both hazardous and non-hazardous wastes may cause emissions of substances which pollute the air, water, and soil and have harmful effects on human health. The Directive 2000/76/EC on the incineration of waste (WID) aims at preventing or limiting the negative effects on the environment from the incineration and co-incineration of waste. This has to be achieved through the application of operational conditions, technical requirements, and emission limit values for waste incineration and co-incineration plants within the Community. At present, some of the plants covered by the WI Directive also fall under the scope of the IPPC Directive. Hence, there are two different permitting regimes for waste incineration installations (IPPC and the non-IPPC ones). However, it can be noted that WI Directive sets only minimum obligations which are not necessarily sufficient to comply with the IPPC Directive. The possible extension of the IPPC Directive to cover all incineration and co-incineration plants covered by WID could lead to potential environmental improvements because non-IPPC WI installations, which at present are not subject to permitting conditions based on the “Best Available Technologies” (BAT), would have to improve their performance as BAT evolves. Further, extending the IPPC Directive to cover all WID plants could be advantageous in terms of legislative simplification. Indeed, IPPCD and WID have quite similar but separate requirements and therefore, from a regulation perspective, it might be beneficial to integrate both directives, which would involve putting all incineration under IPPC. Issue summary:This work intends to investigate whether the potential benefits of including all WI plants under the IPPCD could exceed the possible costs and other possible negative impacts of such a change. In particular, the main issues to be looked upon in this analysis include:
What is the interface between the IPPC and the Waste Incineration Directives? How many plants that fall under WID do not fall under IPPC? In practice, what are the compliance mechanisms for plants being under WID but
not under IPPC for an industry? What would be the costs and benefits of making all the WID plants subject to
IPPC Directive as well? How many MS have all plants falling under WID also subject to their legislation
transposing the IPPC Directive?
2. Current practice
As the main objective of this fact sheet is to identify the issues related to a possible extension of the IPPC Directive to cover all incineration and co-incineration plants covered by the Waste Incineration Directive, following is a brief introduction to these two directives.
VITO and BIO, with Institute for European Environmental Policy and IVM 1

Data gathering and impact assessment for a possible technical review of the IPPC Directive – Part 2
Fact Sheet C.2.Extension of current IPPC activity definition
The Waste Incineration Directive
The aim of the Waste Incineration Directive is to prevent or reduce, as far as possible, air, water, and soil pollution caused by the incineration or co-incineration of waste, as well as the resulting risk to human health.
This Directive is intended to fill the gaps existing in the previous legislation concerning incineration (89/369/EEC, 89/429/EEC, and 94/67/EEC). Apart from the incineration of non-toxic municipal waste, its scope extends to the incineration of non-toxic non-municipal waste (such as sewage sludge, tyres and hospital waste) and toxic wastes not covered by Directive 94/67/EC (such as waste oils and solvents). At the same time, it is intended to incorporate the technical progress made on monitoring incineration-process emissions into the existing legislation, and to ensure that the international commitments entered into by the Community are met in terms of pollution reduction, and more particularly those laying down limit values for the emissions of dioxins, mercury, and particulate matter arising from waste incineration (protocols signed under the aegis of the United Nations' Economic Commission Convention on long-distance cross-border atmospheric pollution).
All incineration and co-incineration plants needs authorisation for operating. Permits must be issued by the competent authority in the MS and list the categories and quantities of hazardous and non-hazardous waste which may be treated, the plant's incineration or co-incineration capacity, and the used sampling and measurement procedures.
The WI Directive imposes stricter limit values and thus stringent operational conditions and technical requirements than the previous incineration directives.
The limit values for incineration plant emissions to atmosphere are set out in Annex V to the Directive. They concern heavy metals, dioxins and furans, carbon monoxide (CO), dust, total organic carbon (TOC), hydrogen chloride (HCl), hydrogen fluoride (HF), sulphur dioxide (SO2), nitrogen monoxide (NO) and nitrogen dioxide (NO2).
The limit values for co-incineration plant emissions to atmosphere are set out in Annex II. In addition, special provisions are laid down relating to cement kilns and other industrial sectors and combustion plants which co-incinerate waste.
As in the earlier Hazardous Waste Incineration Directive 94/67/EEC, the air emission limit values for co-incineration plants are based on the mixing rule if less than 40% of the resulting heat originates from hazardous waste and if untreated mixed MSW is not co-incinerated. The emission limit values in this case are set out in Annex V of the Directive. However, cement kilns can no longer apply the mixing rule but special provisions. The Directive also establishes ‘special provisions’ for combustion plants. These facilities have been granted extended deadlines of 2007, 2008, or 2010 depending on the pollutant.
Regarding the discharges of wastewater from the cleaning of the exhaust gas, all discharges need authorisation. This will guarantee that the emission limit values set out in Annex IV to the Directive are not exceeded. Rain or fire-fighting water need to be collected and analysed before being discharged.
The quantity and harmfulness of incineration residues must be reduced to a minimum and residues must, as far as possible, be recycled. When dry residues are transported, precautions must be taken to prevent their dispersion in the environment. Tests must be
VITO and BIO, with Institute for European Environmental Policy and IVM 2

Data gathering and impact assessment for a possible technical review of the IPPC Directive – Part 2
Fact Sheet C.2.Extension of current IPPC activity definition
carried out to establish the physical and chemical characteristics and polluting potential of residues.
The Directive provides for the mandatory provision of measurement systems enabling the parameters and relevant emission limits to be monitored. Emissions to atmosphere and into water must be measured periodically in accordance with Annex III and Article 11 of the Directive.
Applications for new permits must be made accessible to the public so that the latter may comment before the competent authority reaches a decision.
For incineration and co-incineration plants with a nominal capacity of two tonnes or more per hour, the operator must provide the competent authority with an annual report on the functioning and monitoring of the plant, which should also be made available to the public. A list of plants with a nominal capacity of less than two tonnes per hour must be drawn up by the competent authority and made available to the public. For these plants, it is not required the mentioned annual report.
Transposition of WID into national legislation was necessary by 28 December 2002. From this date onwards, new incinerators need to comply with the provisions of the WI Directive. The deadline to bring existing plants into compliance was 28 December 2005.
IPPC Directive
The IPPC Directive applies to specified waste activities and to industrial sectors which include co-incineration plants. In particular, IPPC covers waste incineration installations as it regulates installations for the disposal or recovery of hazardous waste (section 5.1 in the Annex 1) and installations for the incineration of municipal waste (section 5.2 in the Annex 1).
It does also cover co-incineration plants as it regulates sectors such as lime kilns and the cement kilns that are susceptible of co-incinerating waste and also the combustion installations greater than 50MW capacity.
Under the IPPC Directive, non-binding BAT reference documents referred to as BREFs are being prepared to help Member States in their IPPC implementation. BREFs have been published for the cement industry and for waste incineration and waste treatment.
The following sections focus on incineration and co-incineration plants in Europe, as defined in the Waste Incineration Directive. Annex A provides definitions of the terms used in this fact sheet.
2.1. Scope of the sector
Waste generation has grown fast during the last decades with increased economic growth. Consequently, waste has become an important environmental, social, and economic challenge. Each year, in the European Union alone, 1.3 billion tonnes of waste is thrown away.
VITO and BIO, with Institute for European Environmental Policy and IVM 3

Data gathering and impact assessment for a possible technical review of the IPPC Directive – Part 2
Fact Sheet C.2.Extension of current IPPC activity definition
Between 1990 and 1995, the amount of waste generated in Europe increased by 10%1. Most of this is either dumped into landfill sites (49%) or burnt in incinerators (18%). But both these methods create environmental damage. Landfilling not only takes up more and more land space which is a valuable resource, but can also cause air, water and soil pollution, by discharging carbon dioxide (CO2) and methane (CH4) into the atmosphere and chemicals and pesticides into the soil and groundwater. This in turn is harmful to human health as well as to flora and fauna. In the case of waste incineration, the major issue is the emissions to air.
By 2020, the OECD estimates that we could be generating 45% more waste than we did in 1995.
Current EU waste policy is based on a concept known as the waste hierarchy, according to which, the waste generation should be prevented and what cannot be prevented should be re-used, recycled, and recovered as much as feasible. Where waste that cannot be recycled or reused should be safely incinerated, with landfill to be used only as a last resort. Both these methods need close monitoring because of their potential for causing severe environmental damage.
a. Incineration plants
There are three main types of thermal waste treatment: pyrolysis - thermal degradation of organic material in the absence of oxygen gasification - partial oxidation incineration - full oxidative combustion
Gasification and pyrolysis also represent alternative thermal treatments that restrict the amount of combustion air to convert waste into process gas, increase the amount of recyclable inorganics, and reduce the amount of flue gas cleaning.
The reaction conditions (e.g. temperature, pressure, etc.) vary for these thermal treatments as well as the by-products from the reaction. Incineration is the most widely applied treatment method.
The incineration sector may be divided into the following main sub-sectors [EC 2006]:
1. Mixed municipal waste incineration: These installations treat typically mixed and largely untreated household and domestic wastes but sometimes may also include certain industrial and commercial wastes (industrial and commercial wastes are also separately incinerated in dedicated industrial or commercial non-hazardous waste incinerators).
2. Pre-treated municipal or other pre-treated waste incineration: Installations that treat wastes that have been selectively collected, pre-treated, or prepared in some way, such that the characteristics of the waste differ from mixed waste. Specifically prepared refuse derived fuel incinerators fall in this sub-sector.
3. Hazardous waste incineration: This includes incineration on industrial sites and incineration at merchant plants (owned by private companies, municipalities or partnerships), which usually receive a very wide variety of wastes).
4. Sewage sludge incineration: In some locations, sewage sludges are incinerated separately from other wastes in dedicated installations, whereas elsewhere such
1
VITO and BIO, with Institute for European Environmental Policy and IVM 4

Data gathering and impact assessment for a possible technical review of the IPPC Directive – Part 2
Fact Sheet C.2.Extension of current IPPC activity definition
waste is combined with other type of wastes (e.g. municipal wastes) for its incineration.
5. Clinical waste incineration: Dedicated installations for the treatment of clinical wastes, typically those arising at hospitals and other healthcare institutions, exist as centralised facilities or on the site of individual hospital, etc. In some cases, certain clinical wastes are treated in other installations, for example with mixed municipal or hazardous wastes.
In Annex B, more detailed information on the incineration of municipal waste, hazardous waste, sewage sludge and clinical waste is provided.
b. Co- incineration plants
Wastes can also be burned in other installations than dedicated waste incinerators. The primary objective of the waste incinerators is to stabilise and reduce the volume of wastes. However, energy recovery has now also become an essential objective. As indicated in section 2.1., the primary objective of co-incineration is the production of industrial products such as lime or cement, and the generation of energy.
In practice, the main industrial candidates to co-incinerate waste, besides waste incinerators, are cement kilns, steam and electricity producers, and lime kilns.
Some blast furnaces are also reported to use small quantities of carbon-containing secondary feedstock to substitute coke. Nevertheless, this sector argues that blast furnaces are neither incinerators nor co-incinerators (as defined by the WID), but installations where a reduction of the feedstock takes place (removal of oxygen from the iron ore). The coke used in blast furnaces is mainly a source of chemical reducing agent necessary to convert iron ore into hot metal; it can not be considered as a fuel to provide thermal energy. In those cases where the injection of a residual product into the blast furnace is practiced, those materials act as substitutes for coke and therefore as reducing agents and not as fuel now with the purpose of disposal [Eurofer, 2007].
A wide range of wastes are used as substitute or secondary fuels in co-incineration installations. These wastes include municipal solid waste, sewage sludge and industrial wastes such as plastics and paper/card from commercial and industrial activities (i.e. packaging waste or rejects from manufacturing), waste tyres, biomass waste (i.e. straw, untreated waste wood, dried sewage sludge), waste textiles, residues from car dismantling operations (automotive shredder residues - ASR) and hazardous industrial wastes with high calorific value, for example, waste oils, industrial sludge, impregnated sawdust, and spent solvents. The types of secondary fuels co-incinerated in industrial processes in Europe are summarised in Annex C.
Co-incineration facilities face few technical barriers to take advantage of the calorific value of the mineral content of the waste unless it is pre-treated to suit the incineration process. The main limitations derive from the composition of the waste and its possible contamination that can impact the quality of the industrial products.
In brief, while the dedicated incinerator must adapt to the waste, in co-incinerators it is waste that adapts to the processes.
The industrial actors involved in co-incineration have specific requirements for the waste they use. [IPTS, 1999].
VITO and BIO, with Institute for European Environmental Policy and IVM 5

Data gathering and impact assessment for a possible technical review of the IPPC Directive – Part 2
Fact Sheet C.2.Extension of current IPPC activity definition
Therefore, industrial wastes used as secondary fuels need to be processed to meet co-incineration specifications e.g. homogenisation to provide a consistent calorific value and the limiting compounds such as chlorine or phosphorous for clinker production. For example, industrial sludge, spent solvent, or waste oil are mixed with sawdust before being injected in cement kilns, old tyres are shredded, and sewage sludge is dried to 90%. [EC 2003].
More detailed information on the use of co-incineration in the cement industry, power plants and lime kilns is provided in Annex D.
c. Size and structure of the sector
Incineration plants
Around 20 - 25 % of the municipal solid waste (MSW) produced in the EU-15 is treated by incineration. Nevertheless, as it can be seen in table presented in Annex E, the use of incineration as a waste management technique varies greatly across Member States. Indeed, the variation of incineration in municipal waste treatments ranges from zero to 76 per cent.
As it can be seen in Annex E, in EU-15, approximately 200 million tonnes of waste per year may be considered suitable for thermal waste treatment. However, the total installed capacity of thermal waste treatment plants is only in the order of 50 million tonnes.
Around 12 % of the hazardous waste produced in EU-15 is incinerated (total production close to 22 million tonnes per year).
In EU-27, there are approximately 374 MSW incineration plants, more than 141 hazardous waste incineration plants( considering a reduction of the total number of installations in new MSs of 50% since 1999), and approximately 57 dedicated sewage sludge incinerators, as it can be seen in table 1 and table 2. The latter presents the annual quantities of municipal and hazardous waste arising and the number of incineration plants in New Member States.
Table 1 - Number and total capacity of existing incineration plants for municipal, hazardous and sewage sludge wasteCountry Total
number of MSW-incinerators
Capacity (Mt/yr)
Total number of HW-incinerators
Capacity (Mt/yr)
Total number of dedicated sewage sludge incinerators
Capacity (Mt/yr) (dry solids)
Austria 5 -8 0.5 -1.5 2 0.1 1Belgium 17 2.4 3 0.3 1 0.02Denmark 29-34 2.7-3.5 2 0.1 5 0.3Finland 1 0.07 1 0.1France 1281 13.6 203 1.0Cyprus 0 0
VITO and BIO, with Institute for European Environmental Policy and IVM 6

Data gathering and impact assessment for a possible technical review of the IPPC Directive – Part 2
Fact Sheet C.2.Extension of current IPPC activity definition
Malta 0 0Germany 64 16 312 1.23 23 0.63Greece 0 0Ireland 0 11Italy 32 -47 1.71-3.1 6 0.1Luxembourg 1 0.15 0Portugal 3 1.2 0Spain 9-10 1.13 -1.7 1 0.03Sweden 29-30 2.2-2.5 1 0.1Netherlands 11 5.3-5.5 1 0.1 2 0.19United Kingdom4
14-17 2.97-3 3 0.12 11 0.42
Norway 11-19 0.65
Switzerland 29 3.29 11 2 14 0.1Total 384-419 53.87-
58.1693 5.28 57 1.66
1 On 6 Jan 2003 123 MSW incinerators were operating with combined capacity of 2000t/h2 Figure includes installations used in the chemical industry3 Dedicated commercial sites only (i.e. not including in-house plants)4 The WI Directive requires Member States to report to the Commission on their implementation of the Directive. In order to assist the Member States, a questionnaire was adopted by the Commission. Even though the questionnaire is not required to be completed by the Member States until September 2009, the UK has voluntarily done so now in order to aid discussion of the WID in the context of the Commission’s review of the IPPC Directive. In this document, it is indicated that there are 85 incineration plants and 42 co-incineration plants in the United Kingdom. These figures are considerably higher than the ones provided by the available literature for United Kingdom.
Source: [EC, 2006, CEWEP 2007]
When the population in each country is taken into consideration, Denmark incinerates the largest amount of waste per capita (including commercial and industrial waste), namely 600 kg annually. Only Sweden, the Netherlands, and Luxembourg have the same coverage with waste-to-energy facilities for waste suitable for incineration.
VITO and BIO, with Institute for European Environmental Policy and IVM 7

Data gathering and impact assessment for a possible technical review of the IPPC Directive – Part 2
Fact Sheet C.2.Extension of current IPPC activity definition
Table 2 - Annual quantities of municipal and hazardous waste arising and the number of incineration plants in New Member StatesCountry MSWI
Data year
Municipal waste in 106 tonnes
Total number of MSWI
MSWI (>3 t/h)
Treated (Mt/yr)
Hazardous waste in 106 tonnes
Total number of HWI
HWI (>10 t/d)
Bulgaria 1998 3.199 0 0 0.548 0 0Czech Republic
1999 4.199 3 3 0.4 3.011 72 14
Estonia 1999 0.569 0 0 0.06 1 0Hungary 1998 5 1 1 0.3 3.915 7 Not
suppliedLatvia 1998 0.597 0 0 0.0411 0 0Lithuania 1999 1.211 0 0 0.2449 0 0Poland 1999 12.317 4 1 0.04 1.34 13 4Romania 1999 7.631 0 0 2.323 3 3Slovakia 1999 3.721 2 2 1.7376 Not
supplied 1
Slovenia 1995 1.024 0 0 0.025 0 0Totals 39.468 10 7 13.2456 96 22
Note: Totals are simple column totals and therefore include mixed year dataSource: [EC, 2006]
No data have been identified for the number of dedicated incinerators for clinical waste.
As illustrated in figure 1, the size of installations varies greatly across Europe. The average MSW incinerator capacity is about 200,000 tonnes per year. The smallest plant size seen is 60,000 tonnes per year and the largest is close to 500,000 tonnes per year. The annual MSW incineration capacity in individual European countries varies from 0 kg to over 550 kg per capita [EC, 2006].
VITO and BIO, with Institute for European Environmental Policy and IVM 8

Data gathering and impact assessment for a possible technical review of the IPPC Directive – Part 2
Fact Sheet C.2.Extension of current IPPC activity definition
Figure 1 – Average MSW incineration plant capacity by country
0 100 200 300 400 500 600
Austria
Belgium
Denmark
France
Germany
Italy
Netherlands
Portugal
Spain
Sw eden
United Kingdom
Norw ay
Sw itzerland
AVERAGE
Source: [EC, 2006]
Expansion of the incineration sector is anticipated in Europe over the next 10 – 15 years as alternatives are sought for the management of wastes diverted from landfill by the Landfill Directive. In fact, the sector has experienced an important expansion in the last decades in some Member States, for example Germany as illustrated in table 3.
Table 3 - Evolution of the waste incineration capacity in Germany.Year Number Capacity, in thousand
tonnes per year 1965 7 7181970 24 2,8291975 33 4,5821980 42 6,3431985 46 7,8771990 48 9,2001995 52 10,8702000 61 13,9992005 66 16,9002007 72 17,800Source: [FEM, 2006]
Primary energy production coming from renewable solid municipal waste (i.e. excluding biogas production) in the European Union is estimated at 5.3 Mtoe2 for 2005 (see Annex F), which represent a slight increase with respect to 2004 (+ 0.2 Mtoe).
2 Mtoe: million tons oil equivalent
VITO and BIO, with Institute for European Environmental Policy and IVM 9

Data gathering and impact assessment for a possible technical review of the IPPC Directive – Part 2
Fact Sheet C.2.Extension of current IPPC activity definition
Co-incineration plants
Table 4 presents the number of industrial plants co-incinerating industrial waste in Europe. This data suggests that the cement industry is the largest consumer of secondary fuels from industrial waste with about 106 kilns across Europe co-incinerating about 2.6 million tpa3 of secondary fuels from industrial origin. Hazardous waste such as waste oils and spent solvents mixed with sawdust or injected in liquid form at the flame are one of the most common wastes co-incinerated in cement kilns, estimated to amount to 1 million tpa. Tyres are also commonly used.
Nevertheless, these figures do not include plants co-incinerating municipal solid waste (MSW) and they are not exhaustive for every country. Further, this data dates from 2002-2003 mainly. Thus, the real number of co-incinerations installations in Europe may be higher.
Table 4 - Number of industrial plants co-incinerating industrial wastes in Europe a)
Country Cementkilns
Power plant(electricityand/or heat)
Brick kilns Others Total
Austria 10 7 2 165 b) 177Belgium 9 e) - - d)Denmark 1 e) - e) d)Finland 1 e) - e) b) d)France 23 e) - - d)Germany 31 (11) c) e) (>37) b) d)Greece - - - - -Ireland - - - - -Italy 5 (3) - - 5Luxembourg 1 - - - 1Netherlands 1 7 - - 8Portugal 1 (1) - - 1Spain 11 - e) - d)Sweden 3 e) - - d)United Kingdom
9 (+2) 1 + (2) -7 - 6 10-22*
Total 106 d) d) d) d)Notes:a) Figures in brackets are for planned facilities under construction or incompleteb) Including paper millsc) Data only referring to Northrhine Westfaliad) No completed information available. e) Secondary fuels are used but no detailed information available* 42 according to the response to the questionnaire sent to reporting on the implementation of Directive 2000/76/EC, and answered by UK before deadline
3 tpa: tonnes per annum
VITO and BIO, with Institute for European Environmental Policy and IVM 10

Data gathering and impact assessment for a possible technical review of the IPPC Directive – Part 2
Fact Sheet C.2.Extension of current IPPC activity definition
Source: [EC, 2003; DEFRA 2002]
Summary of key elements about the size and structure of the sector of the sector useful for this exercise.
In EU-15, approximately 200 million tonnes of waste per year may be considered suitable for thermal waste treatment. However, the total installed capacity of thermal waste treatment plants is only in the order of 50 million tonnes.
In EU-27, there are approximately 356 MSW incineration plants, more than 150 hazardous waste incineration plants, and approximately 57 dedicated sewage sludge incinerators. Germany and France are the countries with more incineration plants.
There are approximately 106 co-incineration plants in EU-15 in the cement industry. Co-incineration is also present in other industries such as the power sector.
d. Economic Impacts
The economic aspects of incineration vary greatly between regions and countries, not only due to technical aspects but also depending on waste treatment policies. In general, the costs of incineration are generally affected by different factors such as the actual requirements for the treatment of flue-gases/effluents (e.g. the imposed emission limit values can drive the selection of particular technologies that in some circumstances impose significant additional capital and operational costs), the efficiency of energy recovery, the treatment and disposal/recovery of ash residues (e.g. bottom ash may often be used for construction purposes, in which case, the landfilling cost is avoided), taxes or subsidies received for incineration and/or levied on emissions or the scale (there may often be significant disadvantages for small scale operation).
The owners and operators of incineration plants may be municipal bodies as well as private companies. Public/private partnerships are also common. The finance cost of capital investments may vary depending upon the ownership.
Waste incineration plants receive fees for the treatment of the waste, also called gate fees. As indicated before, they can also produce and sell electricity, steam, and heat, and recover other products, such as bottom ashes for use as civil construction material, iron scrap and non-ferrous scrap for use in the metal industry, HCl, salt, and gypsum. The price paid for these commodities, and the investment required to produce them, has a significant impact on the operational cost of the installation.
Table 5 shows the gate fees for selected MS in Europe.
Table 5: Gate fees in European MSW and HW incineration plants (€/t)Member states Municipal waste Hazardous WasteBelgium 56 – 130 100 – 1500Denmark 40 – 70 100 – 1500France 50 – 120 100 – 1500Germany 100 – 350 50 – 1500Italy 40 – 80 100 – 1000
VITO and BIO, with Institute for European Environmental Policy and IVM 11

Data gathering and impact assessment for a possible technical review of the IPPC Directive – Part 2
Fact Sheet C.2.Extension of current IPPC activity definition
Netherlands 90 – 180 50 – 5000Sweden 20 – 50 50 - 2500United Kingdom 20 – 40 Not availableSource: [EC, 2006]
It is important to highlight that there are several factors that will determinate the final gate fee at incineration plants including competition with alternative methods of waste management (landfills, fuel production, etc.) and investment and operational costs.
In Annex G, the variation in municipal waste incineration cost across MSs is presented. Note that the costs presented in this annex are different to those in Table 4 (which presents data on gate fees).
Revenues received from energy sales, which are strongly influenced by the level of support per kWh for electricity and/or heat generation, vary greatly across MS. For example, in Sweden and Denmark, gate fees are lower (see table 4), at least in part because of the revenue gained from the sales of thermal energy as well as electricity. Indeed, in Sweden, the generation of electricity is often not implemented in the face of considerable revenues for heat recovery.
In some other countries, support for electricity production has encouraged electrical recovery ahead of heat recovery. The UK, Italy, and Spain, amongst others, have at some stage, supported incineration through elevated prices for electricity generated from incinerators. In other MSs, the structure of incentives available for supporting renewable energy may also affect the relative prices of alternative waste treatments and hence competition prices [EC, 2006].
EmploymentThe data on employment for waste–to-energy plants that have been identified is presented in table 6. According to the available data, Germany is the country with more jobs generated by the waste-to-energy industry. This is in line with the fact that Germany is one of countries with more incineration and co-incineration plants in Europe.
Table 6- Employment created by the Waste-to-Energy industry
Country Direct Jobs Indirect JobsDenmark 1015 2500Austria ≈502 ≈2000Belgium (Flanders region) 800Germany 6,000 24,000Ireland 300*Italy 1,300Netherlands 2,000 3,000Portugal 261France 4,500**Spain 400*with the planned plants**Direct generated jobs associated to the thermal treatment of wasteSource: [CEWEP, 2006, FNADE, 2005]
Summary of key elements about the economic impact of the sector useful for this exercise.
VITO and BIO, with Institute for European Environmental Policy and IVM 12

Data gathering and impact assessment for a possible technical review of the IPPC Directive – Part 2
Fact Sheet C.2.Extension of current IPPC activity definition
Waste incineration plants receive fees for the treatment of the waste, also called gate fees. They can also produce and sell electricity, steam, and heat, and recover other products, such as bottom ashes for use as civil construction material, iron scrap and non-ferrous scrap for use in the metal industry, HCl, salt, and gypsum.
The gate fees vary from 20-50 Euros in Sweden to 100-350 in Germany for municipal waste and from 50-200 in Sweden to 50-500 in the Netherlands for Hazardous waste.
In the 10 countries for which data has been identified, the waste to energy sector generates approximately 17 000 direct jobs.
e. Interface between the IPPC and the WID Directives
Which plants are subject to WID?
As mentioned earlier, the Waste Incineration Directive applies not only to facilities intended for waste incineration ("dedicated incineration plants") but also to "co-incineration" plants (facilities whose main purpose is to produce energy or material products and which use waste as a regular or additional fuel, this waste being thermally treated for the purpose of disposal). The WID does not cover experimental plants for improving the incineration process and which treat less than 50 tonnes of waste per year and nor does it cover plants treating only:
vegetable waste from agriculture and forestry, the food processing industry or the production of paper;
wood waste; cork waste; radioactive waste; animal carcasses; waste resulting from the exploitation of oil and gas and incinerated on board
offshore installations.
Which plants are covered by WID but not subjected to IPPC?
At present, many of the plants that are covered by the WI Directive are also covered by the IPPC Directive, but not all of them. IPPC covers:
installations for the disposal or recovery of hazardous waste with a capacity exceeding 10 tonnes per day
installations for the incineration of municipal waste with a capacity exceeding 3 tonnes per hour,
combustion installations with a rated thermal input >50 MW.
Therefore, all incineration plants which are below those thresholds are not covered by the mentioned Directive.
Recital 13 of the WI Directive states that “Compliance with the emission limit values laid down by this Directive should be regarded as a necessary but not sufficient condition for compliance with the requirements of Directive 96/61/EC. Such compliance may involve more stringent emission limit values for the pollutants envisaged by this Directive,
VITO and BIO, with Institute for European Environmental Policy and IVM 13

Data gathering and impact assessment for a possible technical review of the IPPC Directive – Part 2
Fact Sheet C.2.Extension of current IPPC activity definition
emission limit values for other substances and other media, and other appropriate conditions.”
This makes clear that compliance with the emissions limit values laid down in the WI Directive does not remove the obligation to operate in compliance with all the provisions of the IPPC Directive, including a permit containing emission limit values or equivalent parameters and technical measures determined according to the provisions of Article 9(4) or Article 9(8) of the latter.
Regarding the incineration of municipal waste, the average capacity of the installations is above the threshold of 3 tonnes per hour established in the IPPC (see section 2.3.1). Therefore, it can be expected that most plants which are in the scope of WID also fall under the IPPC Directive. According to information provided by CEWEP4, there are approximately 15 plants incinerating municipal waste that operate with a capacity below 3 tonnes per hour [CEWEP, 2007]. Thus, it can be estimated that less than 5% of the installations incinerating municipal solid waste fall under the WID but not under the IPPCD.
Some small plants which did not comply with the WID by the 28th December have been closed. Because of their poor ability to comply with existing environmental legislation, most small plants are expected to disappear [IPTS, 1999]. This trend was observed in Denmark where a few minor facilities have chosen to cease operation. Indeed, while in 2004 there were 34 facilities (6 of which where below the threshold for the incineration of municipal established in IPPCD), in 2006 the amount of installations is 29, with 3 installations below the mentioned capacity value (10% of the installations). The 5 plants that were closed were of small size, with 3 of them below the threshold [Kleis, 2004; RenoSam, 2006].
According to EURITS5, which represents more than 90% of the EU's facilities concerned with hazardous waste incineration, all their members’ facilities are covered by both the WID and the IPPCD.
In new Member States, however, during 1998 and 1999, the number of this type of installations was approximately 100 (see table 2), of which 78% were below the threshold of 10 tonnes per day. In fact, during this period, only 22 installations for incineration of HW were above this threshold. The available data suggests that the Czech Republic and Poland are the two MS with more installations of this type. Nevertheless, this situation is gradually changing, and some small installations have closed down since the implementation of stricter legislation. For example, in Czech Republic, while in 1999 there were 72 installations, 20% of which had a capacity above 10 tonnes per day, in 2006 the number of plants had decreased to 31, 22 of which were below the threshold limit.
The Slovak and the Romanian Ministries also have several small dedicated waste incinerators operating, however, detailed data have not been obtained [Oekopol, 2007].
If considering that half of the installations treating hazardous waste in News MS have closed down since 1999 due to a poorer liability to comply with stricter legislation requirements, and that 70% are small installations (as in the in Czech Republic in 2006), the total amount of this type of installations in new MS can be estimated at 33, which represents 23% of the total number of installations in EU-27.
4 Confederation of European Waste-to-Energy Plants5 European Union for the responsible incineration and treatment of special waste
VITO and BIO, with Institute for European Environmental Policy and IVM 14

Data gathering and impact assessment for a possible technical review of the IPPC Directive – Part 2
Fact Sheet C.2.Extension of current IPPC activity definition
The co-combustion of waste in industrial furnaces (co-incineration) is usually covered by IPPC in the cases where the main activity is also covered (e.g. the lime and cement kilns).
In this regard, EUCOPRO6 indicated that the majority of the substitution fuels and raw materials generated from hazardous waste suitable for co-incineration are used in the cement industry, sector in which the co-incineration process is commonly subject to IPPC. This is in line with the information shown in table 4, which suggest that the cement industry is the main sector co-incinerating industrial wastes.
It is important to note that the interpretation of article 3.5 of the WID might vary throughout the European Union. In this regard, there are also other types of furnaces (boilers) that can also be considered to be co-incineration installations under the WID but that are out of the scope of the IPPCD. For example, certain furnaces (boilers) used in carpenter's workshops that use wood waste (treated waste wood) as fuel for heating their installations (facilities) or producing hot water would have to comply with the co-incineration provisions of the WID as the “main purpose” of the combustion installation could be the “generation of energy”7. Many of these installations do not fall under the IPPC regime according to Annex I point 5 IPPCD. In the case of small companies, the capacity of their furnaces for incinerating such hazardous waste is less than 10 tonnes per day. Furthermore their furnaces (boilers) are not “directly connected activities” as part of other IPPC installations [WKO, 2007]. These small co-incineration installations not covered by the scope of the IPPCD have been identified in Austria, for example.
Limit values
The tables in Annex H give the range of air emission limit values from some European MSW incineration plants and hazardous waste incineration plants (mainly German and Dutch installations) respectively. They also show for comparison the limit values established by the Waste Incineration Directive. Thirty minutes, daily and annual averages are shown. As it can be seen in this Annex, the industry is generally achieving operational levels that meet or perform better than the air emissions levels set in the Waste Incineration Directive.
Table 7 illustrates the interaction between the WID ELV and the BAT associated emission levels (BAT-AOELs) established in the Waste Incineration BREF for certain substances. As it can be seen in this table, the emissions that could be achieved through the application of these BATs are lower, in some cases more than half of the value established in the WID.
6 ECOPRO is an association of European companies active in pre-treatment operations of specific industrial waste.
7 Plants treating wood wastes are excluded from the qscope of the WID with the exception of wood waste wich might contain halogenated organic compounds or heavy metals as a result of treatment with wood-preservatives or coating.
VITO and BIO, with Institute for European Environmental Policy and IVM 15

Data gathering and impact assessment for a possible technical review of the IPPC Directive – Part 2
Fact Sheet C.2.Extension of current IPPC activity definition
Nevertheless, it is important to highlight that operational emission levels associated with the use of BAT are not the same as ELV. While the WID ELVs are minimum requirements that should be complied with constantly and under all conditions, the BAT-AELs indicated in the BREFs are guidance values and not prescriptive. The IPPC Directive requires permitting authorities to take BAT into account.
Indeed, the BREF on waste incineration clarifies the relationship between ELVs and BAT performances. It highlights that [EC, 2006]:
emission and performance levels associated with the use of BAT are not the same as ELVs
across the EU-25, where this is a matter for national or local competence, ELVs are set and enforced in different ways
the emission and performance levels given in the BREF are the operational performance levels that would normally be anticipated from the application of BAT
compliance with the ELVs set in permits and legislation naturally results in operational levels below those ELVs
at a particular installation, lowering emission level within the BAT range presented in the BREF may not represent the best overall solution considering costs and cross-media effects. Additionally, antagonism may exist between them i.e. lowering one may increase the other. For these reasons, it is not anticipated that an installation would operate with all parameters at the lowest levels in the BAT ranges.
Table 7 - Interaction of WID ELVs and the BAT-AELs from the Waste Incineration BREF (mg/m3 daily averages)
Directive 2000/76/EC (ELV)
Directive 96/61/EC BREF (BAT-AEL)
Dust 10 1-5HCl 10 1-8HF 1 <1SO2 50 1-40CO 50 5-30NOx 200 (400 if < 6
tonnes/hour)40-100 (SCR8)120-180 (no SCR)
Hg 0.05 0.001-0.02TOC 10 1-10Cd+Ti* 0.05 0.005-0.05∑ other metals* 0.5 0.005-0.5PCDD/PCDE* 0.1 (ngTEQ/m3) 0.01-0.1 (ngTEQ/m3)* Non-continuous samples
Figure 2 illustrates the differences between the WID ELV and the BAT-AEL in the WI BREF for NOx emissions.
Figure 2 - ELV (WID) and BAT (BREF WI) for NOx emissions
8 Selective Catalytic Reduction - a technique applied mainly for NOX reduction
VITO and BIO, with Institute for European Environmental Policy and IVM 16

Data gathering and impact assessment for a possible technical review of the IPPC Directive – Part 2
Fact Sheet C.2.Extension of current IPPC activity definition
The WID establishes special provisions for cement kilns co-incinerating waste, for combustion plants co-incinerating waste and for other sectors co-incinerating waste. These limits can be found in Annex I.
In this regard, the limit values established for co-incineration in cement plants in Directive are in line with what is likely to be achieved under BAT as defined in the BREF for cement industry [EC, 2001].
Further, the Waste Incineration BREF also provides with BAT-AEL for emissions to water.
VITO and BIO, with Institute for European Environmental Policy and IVM 17

Data gathering and impact assessment for a possible technical review of the IPPC Directive – Part 2
Fact Sheet C.2.Extension of current IPPC activity definition
Summary of key elements about the interface between WID and IPPC and the number of non-IPPC WID plants useful for this exercise.
Regarding the incineration of municipal waste, the average capacity of the installations is above the threshold of 3 tonnes per hour established in the IPPC. Therefore, it can be expected that most plants which are in the scope of WID do also fall under the IPPC Directive. It has been estimated that in EU-27 there are approximately 15 plants incinerating municipal waste with recovery of energy ( less than 5% of the installations) that operate with a capacity below 3 tonnes per hour, thus falling under the WID but not under the IPPCD.
Regarding installations for the incineration of hazardous waste, in EU-15 most plants are covered by both the WID and the IPPCD. However, the available data suggests that there are a considerable percentage of small HWI in new Member States that are currently not covered by IPPC as they operate below the threshold of 10,000 t/day, in particular in the case of Czech Republic. In this country, there were 22 installations treating hazardous waste below the threshold established in IPPC in 2006. It has been estimated that approximately 33 small plants could be in operation in new MS.
On the other hand, because of their poor ability to comply with existing environmental legislation, most small plants are expected to disappear in the future.
In the case of co-incineration plants, it can be assumed that most installations are already covered by IPPC. Nevertheless, and depending on the national classification of an installation as a “co-incineration plant” in accordance with article 3.5 of the WID, there might be certain types of furnaces or boilers of small capacity that are subject to the provisions of the WID but are not covered under IPPC (e.g. carpenter's workshop using treated waste wood for heating purposes or producing hot water).
The emissions that could be achieved through the application of BATs as determined in the Waste incineration BREF are lower (BAT-AELs), in some cases more than half of the value established in the WID (ELV).
f. Environmental impacts
Incineration plants
Waste and its management have significant environmental implications. The thermal treatment of waste may therefore be seen as a response to the environmental threats posed by poorly or unmanaged waste streams. It can result in an overall reduction in the environmental impact that might otherwise arise from the waste. However, in the course of the operation of incineration installations, emissions arise.
Essentially, the main direct impacts of the incineration of waste fall into the following categories:
process emissions to air and water (including odour) process residue production process noise and vibration energy consumption and production
VITO and BIO, with Institute for European Environmental Policy and IVM 18

Data gathering and impact assessment for a possible technical review of the IPPC Directive – Part 2
Fact Sheet C.2.Extension of current IPPC activity definition
raw material (reagent) consumption fugitive emissions – mainly from waste storage reduction of the storage/handling/processing risks of hazardous wastes.
Process emissions to air
Emissions to air have long been the focus of attention for waste incineration plants. In this regard, significant advances in technologies, for the cleaning of flue-gases in particular, have led to major reductions in the emissions to air. Nevertheless, the control of emissions to air remains an important issue for the sector.
In fully oxidative incineration, the main constituents of the flue-gas are water vapour, nitrogen, carbon dioxide, and oxygen. Depending on the composition of the material incinerated and on the operating conditions, certain amounts of CO, HCl, HF, HBr, HI, NOX SO2, VOCs, PCDD/F, PCBs and heavy metal compounds (among others) are formed. Depending on the combustion temperatures during the main stages of incineration, volatile heavy metals, and inorganic compounds (e.g. salts) are totally or partly evaporated. These substances are transferred from the input waste to both the flue-gas and the fly ash it contains. A mineral residue fly ash (dust) and heavier solid ash (bottom ash) are created.
Other releases to air may include, odour, – from handling and storage of untreated waste green house gases (GHGs) – from decomposition of stored wastes e.g. methane,
CO2
dusts, – from dry reagent handling and waste storage areas
Emissions of HCl, HF, SO2, NOx, and heavy metals depend mainly on the structure of the waste and the flue-gas cleaning quality. CO and VOC emissions are determined primarily by the technical parameters of the furnace and the degree of waste heterogeneity when it reaches the combustion stage. The furnace design and operation also affects NOx to a large extent. Dust emissions are very dependent upon flue-gas treatment performance. PCDD/PCDF emissions to air depend on waste structure, furnace (temperature and residence times) and plant operating conditions (reformation and de-novo synthesis are possible under certain conditions) and flue-gas cleaning performance.
Municipal waste incineration plants generally produce flue-gas volumes (at 11 % oxygen) of between 4500 and 6000 m³ per tonne of waste. For hazardous waste incineration plants, this value (at 11 % oxygen) is generally between 6500 and 10000 m³, depending mainly on the average thermal value of the waste. Plants using pyrolysis, gasification or oxygen enriched air supply results in lower flue-gas volumes per tonne of waste incinerated [EC, 2006].
Table 8 provides baseline emission factors (without abatement technology applied) for the incineration of municipal solid waste.
VITO and BIO, with Institute for European Environmental Policy and IVM 19

Data gathering and impact assessment for a possible technical review of the IPPC Directive – Part 2
Fact Sheet C.2.Extension of current IPPC activity definition
Table 8 – Emission factorsCompound Emission factorSO2 1.7 kg/tonne of MSWNOx 1.8 kg/tonne of MSWNM VOC9 0.02 kg/tonne of MSWCO 0.7 kg/tonne of MSWHCl 2.3 kg/tonne of MSWTSP10 18.3 kg/tonne of MSWPb 104 g/tonne of MSWCd 3.4 g/tonne of MSWHg 2.8 g/tonne of MSW
PCDD/Fs1125-1000 μg ITEQ/tonne of MSW
PM10 13.7PM2.5 9.2Source: [CORINAIR, 2006]
Table 9 provides emission factors for the incineration of industrial wastes with only particle emissions abatement equipment.
Table 9 – Typical emission factors for industrial waste incineration plants with only particle emission abatement equipment
Compound
Emission factor (g/tonne waste burned)
SO2 70NOx 2500NMVOC 7400PAH 0.02CO 125HCl 105Pb 35Cu 3Cd 3Mn 0,4Zn 21Co 0.3As 0.05Cr 0.3Ni 0.1Hg 3Source: [CORINAIR, 2006]
For carbon dioxide, 0.7 to 1.7 tonnes of CO2 is generated per tonne of incinerated municipal waste. This CO2 is released directly into the atmosphere and, as a result, the 9 Non-methane volatile organic compounds10 Total Suspended Particles11 polychlorinated dibenzo-para-dioxins and polychlorinated dibenzo furans – a series of chlorinated aromatic compounds, commonly known as ‘dioxins’.
VITO and BIO, with Institute for European Environmental Policy and IVM 20

Data gathering and impact assessment for a possible technical review of the IPPC Directive – Part 2
Fact Sheet C.2.Extension of current IPPC activity definition
climate relevant share of CO2, (resulting from the fossil origin) contributes to the greenhouse effect. Because municipal waste is a heterogeneous mixture of biomass and fossil material, the portion of CO2 from MSWIs of fossil origin (e.g. plastic) which is considered relevant to climate change is generally in the range 33 to 50 %. For the calculations, the proportion of climate – relevant CO2 is figured out as an average value of 0.415 tonnes of CO2 per ton of waste incinerated.
Using these emission factors for each pollutant and the statistics of solid municipal waste and hazardous waste incinerated per year in each country (Annex E), it is possible to estimate the annual emissions from the incineration of waste in Europe, which are presented in Annex J.
It is important to highlight that these annual emissions have been estimated using baseline emission factors (without abatement technology). Nevertheless, the incineration sector has undergone rapid technological development during the last decades leading to important reduction of the emissions. For more information in this regard, see section 2.7.
As discussed earlier, in the case of waste incineration of municipal solid waste, there are approximately 15 installations that are below the threshold established in IPPC. Assuming that all installations have a capacity of 2.5 t/h, it can be estimated that they treat approximately 225 000 tones per year12. From this figure, it can be estimated that the emissions from small dedicated incinerators treating municipal waste represent 0.5% of the total emissions from the incineration of municipal waste, as it can be seen in table 10.
Table 10 - Comparison between the emissions from the municipal solid waste incineration in total and the contribution from small incineration plants
Substance Emission factor (kg/t waste)
Emissions without abatement technology (tonnes/year)
Total MSWI Installation<3t/h
SOx 1.7 76524.31 328.5
CO 0.7 31510.01 157.5
NOx 1.8 81025.74 405
CO2 450 18680934.5 93375
Environmental impact indicators
a. Quantification of Environmental impacts In order estimate the contribution from small dedicated incineration plants, first the total environmental impacts of the sector will be calculated.
To illustrate the magnitude of the environmental impacts of waste incineration, their impact on key environmental indicators is calculated (see Annex K) and presented in the table below.
12 Assuming that the plant is in operation 24h and 250 days per year.
VITO and BIO, with Institute for European Environmental Policy and IVM 21

Data gathering and impact assessment for a possible technical review of the IPPC Directive – Part 2
Fact Sheet C.2.Extension of current IPPC activity definition
Table10: Environmental impact indicators for the production of waste derived fuel from MSW
Impact Unit Environmental impact MSW Industrial waste
Global warming kt CO2 eq 18680 1141Human toxicity kt 1,4-DB eq 26 137 1 445Fresh water aquatic ecotoxicity kt 1,4-DB eq 95 9 Freshwater sedimental ecotoxicity kt 1,4-DB eq 245 22Terrestrial ecotoxicity kt 1,4-DB eq 3 653 237Photochemical oxidation kt C2H4 eq 78 11Acidification kt SO2 eq 132 4Eutrophication kt PO4 eq 11 1
b. Environmental impacts and comparison with Europe activityAs these indicators use different measurement units, a comparison has been made with European per capita contribution to a specific impact13 in order to attribute relative importance to these indicators.
Table 12: Comparison with the average environmental impacts of one European citizen
Unit
Average impacts of one European citizen
MSW Industrial waste
ImpactsNumber of European citizen
ImpactsNumber of European citizen
a b b/a c c/aGlobal warming kt CO2 eq 9 18680 2076 1141 127
Photochemical oxidation kt C2H4 eq 1.50E-05
78 5 200 952 11 720 935
Acidification kt SO2 eq 4.50E-05 132 2 940 934
4 81 522
Eutrophication kt PO4 eq 7.00E-06 11 1 504 764
1 127 679
Remark: the same study cannot be applied to toxicity impacts (human toxicity, freshwater toxicity, etc.) because the IPP Study doesn’t quantify particulate matter emissions.Note: See Annex K for detailed calculation for the numbers presented in the table.
Such a comparison (see table above) clearly shows that the major environmental issue (among those quantified above) generated by the incineration of waste is the photochemical oxidation. Actually, potential photochemical oxidation caused by incineration of MSW and industrial waste corresponds to about 5.2 and 0.7 millions of European equivalent contribution to photochemical oxidation respectively.
The contribution from small plants incinerating municipal waste to these impacts can be expected to be considerably lower, given the smaller number of this type of installations.
13 European equivalent is the total EU-25 activity for one year divided by the European population (population in 2004: 458 973 000 – Source: Eurostat)
VITO and BIO, with Institute for European Environmental Policy and IVM 22
Data gathering and impact assessment for a possible technical review of the IPPC Directive – Part 2
Fact Sheet C.2.Extension of current IPPC activity definition
Process emissions to water
Depending on the type of flue-gas cleaning, water emissions may occur. Wet flue-gas cleaning is the main source of effluents, although in some cases this effluent is also eliminated by evaporation.
The principle potential sources of releases to water (process dependent) are: effluents from air pollution control devices, e.g. salts, heavy metals (HMs) final effluent discharges from waste water treatment plants, e.g. salts, heavy
metals boiler water - blowdown bleeds, e.g. salts cooling water - from wet cooling systems, e.g. salts, biocides road and other surface drainage, e.g. diluted waste leachates incoming waste storage, handling and transfer areas, e.g. diluted incoming wastes raw material storage areas, e.g. treatment chemicals residue handling, treatment and storage areas, e.g. salts, HMs, organics.
The wastewater produced at the installation can contain a wide range of potentially polluting substances depending upon its actual source. The actual release made will be highly dependent on the treatment and control systems applied [EC, 2006].
Residues
Although the types and quantities of residues varies greatly according to the installation design, its operation and waste input, the following main waste streams are commonly produced during the incineration process:
ashes and/or slag boiler ashes filter dust other residues from the flue-gas cleaning (e.g. calcium or sodium chlorides) sludge from waste water treatment
Table 13 summarises typical data on residues from municipal waste incineration. As it can seen in this table, state-of-the-art MSWI plants typically produce between 200 and 350 kg bottom ashes per tonne of waste treated.
Table 13 - Typical data on the quantities of residues arising from municipal waste incineration plants
Types of waste Specific amount (dry)(kg/t of waste)
Slag/ash (including grate siftings/riddlings) 200 – 350Dust from boiler and de-dusting 20 – 40FGC residues, reaction products only:Wet sorptionSemi-wet sorptionDry sorption
8 – 1515 – 357 – 45
Reaction products, and filter dust, from:Wet sorptionSemi-wet sorptionDry sorption
30 – 5040 – 6532 – 80
VITO and BIO, with Institute for European Environmental Policy and IVM 23

Data gathering and impact assessment for a possible technical review of the IPPC Directive – Part 2
Fact Sheet C.2.Extension of current IPPC activity definition
Loaded activated carbon 0.5 – 1Note: wet sorption residue has a specific dryness (e.g. 40 – 50 % d.s.)Source: [EC, 2006].
Noise and vibrationThe noise aspect of waste incineration are comparable with other heavy industries and with power generation plants. It is common practice for new municipal waste incineration plants to be installed in completely closed building(s), as far as possible. This normally includes operations such as the unloading of waste, mechanical pre-treatment, flue-gas treatment, and the treatment of residues. Usually, only some parts of flue-gas cleaning systems (pipes, tubes, SCR, heat exchangers, etc.), cooling facilities and the long-term storage of bottom ash are carried out directly in the open air [EC, 2006].
Energy consumptionWaste incinerators both produce and consume energy. In majority of cases, the energetic value of the waste exceeds the process requirements, which in turn may result in the net export of energy. This is often the case with municipal waste incinerators in particular.
Given the total quantities of waste arising, and its growth over years, the incineration of waste can be seen to offer a large potential source of energy. In some MS this energy source is already well exploited. Figure 3 shows the production of heat and electricity from municipal waste incineration plants in some Member States in 1999.
Figure 3 - Energy production by municipal waste incinerators in Europe (1999)
Source: [EC, 2006]
Co-Incineration plantsWhile in the case of dedicated waste incineration all the mineral elements in the emissions come from the waste and the combustion air, in the case of co-incineration, they also come from the other fuels used and in the case of cement production mainly
VITO and BIO, with Institute for European Environmental Policy and IVM 24

Data gathering and impact assessment for a possible technical review of the IPPC Directive – Part 2
Fact Sheet C.2.Extension of current IPPC activity definition
from the raw materials used. The exact nature of emissions is also a function of process conditions (e.g. amount of air, process temperature, time).
For example, in a cement kiln, gas temperatures are typically 800°C to 1200°C, higher than in a waste incinerator. This creates conditions that are much more favourable to the formation of thermal NOx from the combustion air. This chemical reaction cannot be avoided. Therefore, NOx production in a cement kiln is largely independent from the presence of waste. Along similar lines, flue gas concentrations of non-volatile heavy metals and often SO2 from a cement kiln are usually more related to natural levels in the raw materials and fuels used than to the waste, as long as the waste is fed at the flame end of the kiln.
No emission factors have been identified for co-incineration.
Summary of key elements about environmental impacts of the sector useful for this exercise.
Emissions to air have long been the focus of attention for waste incineration plants. In this regard, significant advances in technologies, for the cleaning of flue-gases in particular, have lead to major reductions in the emissions to air. Depending on the composition of the material incinerated and on the operating conditions, certain amounts of CO, HCl, HF, HBr, HI, NOX SO2, VOCs, PCDD/F, PCBs and heavy metal compounds (among others) are formed.
The main emissions from incineration are CO, NOx and CO2. It has been estimated that the emissions from small dedicated incinerators treating municipal waste represent 0.5% of the total emissions from the incineration of municipal waste.
It can be assumed that the overall environmental impacts from installations not covered by IPPC is small at this moment.
g. Techniques for prevention or reduction of environmental impacts
The incineration sector has undergone rapid technological development over the last 10-15 years. Much of this change has been driven by legislation specific to the industry, which in return, has resulted in reduced emissions to air from individual installations (see section 2.6).
Continuous process development is ongoing, with the sector now developing techniques which limit costs, whilst maintaining or improving environmental performance [EC 2006].
An important difference between incineration and co-incineration is the fact that while the dedicated incinerator will take all the waste coming in, with a high variability, the industrial facilities practicing co-incineration usually select and pre-treat the waste they handle to reduce variability and optimise its behaviour in the process. Therefore, the issue of process optimisation is important.
The BREF document for waste incineration deals only with the dedicated incineration of waste and not with co-incineration processes occurring for example in cement kilns and
VITO and BIO, with Institute for European Environmental Policy and IVM 25

Data gathering and impact assessment for a possible technical review of the IPPC Directive – Part 2
Fact Sheet C.2.Extension of current IPPC activity definition
large combustion plants. BAT for co-incineration is covered in the sector BREF where the waste is actually burned (e.g. cement industry).
In addition to best environmental practices for waste incineration, there is a variety of demonstrated combustion engineering, flue gas cleaning, and residue management techniques that are available for preventing and minimising emissions and the associated environmental impacts.
The WI BREF contains 63 specific recommendations concerning design and operation of incineration facilities and it must be expected that it will be of importance in connection with the development of future facilities. A summary of these BATs and best practices is presented in Annex L.
This document highlights that although some European installations have yet to be upgraded, the industry is generally achieving operational levels that meet or improve upon the air emission limit values set in Directive 2000/76/EC.
Abatement Rates and CostsThe flue-gas treatments applied at waste incineration installations have been developed over many years in order to meet stringent regulatory standards and are now highly technically advanced. Their design and operation are critical to ensure that all emissions to air are well controlled.
The following table illustrates how the capital cost of an entire new MSW installation can vary with the flue-gas and residues treatment process applied.
Table 14- Specific investment costs for a new MSWI installation related to the annual capacity and some types of flue-gas treatment in GermanyType of flue-gasCleaning
Specific investment costs (€/tonne waste input/year)100 kt/yr 200 kt/yr 300 kt/yr 600 kt/yr
Dry 670 532 442 347Dry plus wet 745 596 501 394Dry plus wet withresidue processing
902 701 587 457
Source: [EC, 2006]
Compliance Costs
As indicated earlier, compliance with the WID is not necessarily sufficient to meet IPPC requirements since the latter are more broadly based and involve different conditions. In practice, where incineration processes are also subject to IPPC, the regulator will set permit conditions on the basis of BAT taking into consideration factors such as: the technical characteristics of the unit, local environmental conditions, and the geographical location of the plant. Where conditions dictate that a lower NOx emission limit (lower than the WID limit) is required then this is the limit that should be set.
VITO and BIO, with Institute for European Environmental Policy and IVM 26

Data gathering and impact assessment for a possible technical review of the IPPC Directive – Part 2
Fact Sheet C.2.Extension of current IPPC activity definition
The table below presents a summary of WID incinerator and co-incinerator compliance costs (including the costs of monitoring and abatement). The costs presented in this table are based on those in ENTEC's final REIA report in 1998 prices, unless otherwise flagged [ENTEC, 1998]. These costs were estimated to be incurred from 2005 or 2006, when the implementation of the directive was to be finalised.
VITO and BIO, with Institute for European Environmental Policy and IVM 27

Data gathering and impact assessment for a possible technical review of the IPPC Directive – Part 2
Fact Sheet C.2.Extension of current IPPC activity definition
Table 15 - Summary of WID incinerator and co-incinerator compliance costs (including the costs of monitoring and abatement)
Process Compliance Costs for typical business (€kpa) 14
Waste Incineration
Municipal waste
42.5-512
Incineration Clinical waste
41-76
Sewage sludge 51-307General waste 52.7-192
Co-incineration Cement / lime kilns
234 - 1600
Power stations Data unavailableSource: [ENTEC, 1998]
If extending the IPPC Directive to cover all installations covered under the WID, the affected plants (i.e. the plants not already covered under IPPC) will have additional compliance costs associated with the different requirements established in the latter. For example, in the case of UK, requirements likely to incur additional costs immediately for incinerators/co-incinerators falling outside the scope of the IPPC Directive are those relating to the production of initial site surveys.
Summary of key elements about techniques for the reduction of the environmental impacts and the abatement and compliance costs for the sector useful for this exercise.
The incineration sector has undergone rapid technological development over the last 10-15 years. Much of this change has been driven by legislation specific to the industry, which has, in return, resulted in reduced emissions to air from individual installations. There is a BREF for Waste incineration, which deals only with the dedicated installations for incineration. Co-incineration processes occurring in cement kilns and large combustion plants are covered in the sector BREF where the waste is actually burned.
The flue-gas treatments applied at waste incineration installations have been developed over many years in order to meet stringent regulatory standards and are now highly technically advanced.
The possible extension of the IPPC to cover all the installations covered by the WID is likely to incur additional abatement and permitting costs for those smaller installations that are not yet covered by IPPC.
h. Current legislation
Waste incinerators are identified in the Stockholm Convention as having the potential for comparatively high formation and release of chemicals listed in Annex C of the convention, to the environment.
14 1 GBP = 1.46410 EUR
VITO and BIO, with Institute for European Environmental Policy and IVM 28

Data gathering and impact assessment for a possible technical review of the IPPC Directive – Part 2
Fact Sheet C.2.Extension of current IPPC activity definition
The legislation applicable to different facilities which incinerate waste materials has experienced significant changes in recent years. Previously, two Directives concerned Municipal Waste Incineration, Directive for new MSW Incineration Plants (89/369/EEC) and existing plants (89/429/EEC) and one concerning Hazardous Waste Incineration (94/67/EC), were of particular significance. These Directives have been ‘merged’ into the Waste Incineration Directive (WID) (2000/76/EC) [EC 2003].
The second most important piece of legislation affecting incineration and co-incineration plants is the IPPC Directive, which regulates installations for the disposal or recovery of hazardous waste, installations for the incineration of municipal waste, and other activities where waste is thermally treated, such as cement kilns and large combustion plants.
The Directive on the Limitation of Emissions of Certain Pollutants into the Air from Large Combustion Plant (2001/80/EC), replacing from 27 November 2002 Directive 88/609/EEC. The new LCP Directive applies more stringent limits for air emissions. The Directive applies to combustion plants with a rated thermal input ≥50 MW, irrespective of the type of fuel used. The definition of “fuel” excludes wastes covered by the incineration Directive but covers combustion plants using biomass waste such as:
vegetable waste from agriculture, forestry and food processing industry; fibrous vegetable waste from virgin pulp production and from production of paper
from pulp, if it is co-incinerated at the place of production and the heat generated is recovered;
cork waste; and wood waste with the exception of wood waste which may contain halogenated
organic compounds or heavy metals as a result of treatment with wood preservatives or coating.
Thus, a large combustion plant burning exclusively fuels derived from other waste materials than the above does not fall under the scope of LCP Directive but under the scope of Incineration Directive 2000/76/EC.
The Directive on Renewable Energy Sources for Electricity Production 2001/77/EC was adopted with the specific purpose of promoting an increase in the contribution of renewable energy sources to electricity production. With regard to waste, the preamble of the Directive states that: ‘the incineration of non-separated municipal waste should not be promoted under a future support system for renewable energy sources, if such promotion were to undermine the (waste) hierarchy.’ However, the Directive supports biomass waste incineration as a form of renewable energy source.
Legislation regarding waste management, notably, the Framework Directive on Waste (75/442/EEC as amended) and the Landfill Directive (1999/31/EC) also influence incineration and co-incineration plants as it requires Member States to move waste away from landfill and into options which are higher in the waste management hierarchy such as incineration and/or recycling.
Interface in the implementation of the IPPC and the WID Directives.
At present, United Kingdom have implemented the WID through the IPPC regime.
In England and Wales, almost all the plants to which WID applies to are regulated by either the Environment Agency or local authorities under the Integrated Pollution Control
VITO and BIO, with Institute for European Environmental Policy and IVM 29

Data gathering and impact assessment for a possible technical review of the IPPC Directive – Part 2
Fact Sheet C.2.Extension of current IPPC activity definition
(IPC) or Pollution Prevention and Control (PPC) (England and Wales) Regulations 2000 (SI 2000 No 1973 - “the PPC Regulations” as amended) which implement the IPPC Directive, which deal with emissions to air, land and water.
Any incinerator new since October 1999 and falling under the ambit of the Integrated Pollution Prevention and Control (IPPC) Directive (96/61/EC) has been regulated under the new PPC regime. This deals with emissions to all three environmental media and imposes additional environmental requirements, notably in respect of energy efficiency and site restoration.
The PPC regime assigns regulation of larger incinerators and co-incinerators - as “Part A(1)” activities - to the Environment Agency, whilst the smaller, “Part A(2)” or “Part B” incinerators are regulated by local authorities. The Environment Agency also regulates all hazardous waste incinerators.
Under the Pollution Prevention and Control, most “existing” “IPPC” incinerators were brought into the PPC regime before December 2005. Co-incineration is limited mostly to cement, lime, and power plants. Of these, “existing” cement and lime plants have been being phased into the PPC regime, but "existing” power plants were not due for this change until 2006 [Defra, 2006].
The UK Government considered that implementing WID for all incinerators through PPC was not placing a significant additional burden upon their operators.
A recent study carried out under the framework of the IPPC review project assesses the use of General Binding Rules (GBR) for the implementation of the IPPC Directive15. GBR are limit values or other conditions (defined in particular in environmental laws, regulations and ordinances) at sector level or wider, that are given with the intention to be used directly to set permit conditions16. They provide direct conditions or minimum standards. GBRs are binding either to the authority or to the operator. According to the available results, countries such as Austria, Belgium, Denmark, France, Germany, the Netherlands, Poland , Slovakia, Slovenia and Sweden have GBRs that cover the waste incineration sector, which are generally the legislation implementing the WID. This means that these countries have a regulation stating ELVs. It can be assumed that these countries apply the regulation to the whole sector and not only to installations above the limit established by the IPPCD.
Summary of key elements about current legislation for the sector useful for this exercise.
Waste incinerators are identified in the Stockholm Convention as having the potential for comparatively high formation and release of chemicals listed in Annex C to the environment. The two most important pieces of legislation currently affecting incineration and co-incineration plants are the Waste Incineration Directive and the IPPCD.
15Project’s website: http://cms.emis.vito.be/16 Article 9(8) of the IPPC Directive states that "without prejudice to the obligation to implement a permit procedurepursuant to this Directive, Member States may prescribe certain requirements for certain categories of installations in general binding rules instead of including them in individual permit conditions, provided that an integrated approach and an equivalent high level of environmental protection as a whole are ensured".
VITO and BIO, with Institute for European Environmental Policy and IVM 30

Data gathering and impact assessment for a possible technical review of the IPPC Directive – Part 2
Fact Sheet C.2.Extension of current IPPC activity definition
Other pieces of legislation regulating this sector include the Directive on the Limitation of Emissions of Certain Pollutants into the Air from Large Combustion Plant (2001/80/EC(which applies to combustion plants with a rated thermal input ≥50 MW), the Directive on Renewable Energy Sources for Electricity Production and legislation regarding waste management, notably, the Framework Directive on Waste (75/442/EEC as amended) and the Landfill Directive (1999/31/EC).
Certain MS such as United Kingdom have implemented WID through IPPC. The UK Government considered that implementing WID for all incinerators through PPC was not placing a significant additional burden upon their operators. Certain countries such as Austria, Belgium, Denmark, France, Germany, the Netherlands, Poland , Slovakia, Slovenia and Sweden have GBRs that cover the waste incineration sector which are generally the legislation implementing the WID, thus stating ELVs. It can be assumed that these regulations apply to the whole sector and not only to installations above the thresholds established in IPPC.
3. Options and pros and cons
Issues to take into account when considering the options:
During the informal joint meeting of the IPPC Experts Group and the Waste Management Committee held on 12 May 2004, the IPPC Directive was recognised by several Member States as an instrument that should be used to fill the existing common standards gap for waste recovery operations. However, a number of concerns were raised by some Member States including the interrelation between the IPPC Directive and other waste directives. Some felt that defining more demanding performance standards for incineration facilities in BREFs than those laid down in the WID could make implementation complex. Others felt that both Directives are fully compatible with the WID setting minimum performance standards and BREFs describing BAT.
Option 1: Business as usual i.e. non-actionPros:
No legal or administrative changes and hence burdens, and no additional requirements for those installations that are not currently covered.
No change in IPPC, no extra IPPC related burden in the MS.Cons:
There are two slightly different permitting regimes for plants that are only covered by WID and those that are both covered by IPPC and WID, which in turn can potentially lead to complex regulatory regimes and adverse impacts on competitiveness among operators across MS.
Possible inconsistency of approaches between MS/regions, leading to impacts on competition among European producers.
Not all plants incinerating or co-incinerating waste are regulated under the IPPC Directive or national/sub-national legislation based on BAT and hence potentially useful (socially advantageous and cost-effective) reductions of emissions from these plants can be missed.
Option 2.1: Lowering the threshold of IPPC for installations for the incineration of municipal waste from 3 to 1 tonne/hour17
VITO and BIO, with Institute for European Environmental Policy and IVM 31

Data gathering and impact assessment for a possible technical review of the IPPC Directive – Part 2
Fact Sheet C.2.Extension of current IPPC activity definition
Pros: According to the available data, most of the installations incinerating MSW are
already covered by the IPPC (the average capacity exceeds the established threshold of 3 tonnes per hour for installations for the incineration of municipal waste). Therefore, the potential costs of expanding the IPPC Directive to cover these installations would affect a limited number of installations, estimated at 15 installations.
BAT for incineration plants are known, so it will be easy to refer to them. For installations new to the IPPC Directive, this option could encourage cost-
effective investment, some of which might not have taken place otherwise. This could lead to environmental benefits because over time, installations
currently not covered under IPPC will have to consider and apply BAT standards, and to improve their operational conditions as BAT evolves.
Inclusion of smaller combustion plants could contribute to levelling the playing field between different size firms and hence contribute to competitiveness objectives.
Cons: Need to amend the national legislation in many MS. Missed opportunity to cover also all plants for the disposal and recovery of
hazardous waste covered by WID. Additional costs for authorities - permits, inspections and enforcement. Additional costs for operators of the small installations that will be affected (adapt
their installations to BAT, more stringent reporting and monitoring requirements).
Option 2.2: Expanding the IPPC to cover all WID installations incinerating hazardous waste by lowering the current threshold (to be determined).
Pros: This could lead to environmental benefits because over time, installations
currently not covered under IPPC will have to consider and apply BAT standards, and to improve their operational conditions as BAT evolves.
Inclusion of smaller combustion plants could contribute to levelling the playing field between different size firms and hence contribute to competitiveness objectives.
It is estimated that approximately 33 plants in new MSs operate below the thresholds limits established in the IPPCD, which represents 23% of the total number of HW incinerators in EU-27. Therefore, expanding the IPPC to cover all HW incinerators will contribute to further control the environmental impacts caused by these small dedicated waste incinerators.
Cons: Need to amend the national legislation in many MS. Missed opportunity to cover also all plants for the disposal of municipal solid
waste covered by WID, which are the most extended type of plant in Europe. Additional costs for authorities - permits, inspections and enforcement. Additional costs for operators of the small installations that will be affected (adapt
17 The available data suggest that small installations for the incineration of municipal waste are usually above this capacity.
VITO and BIO, with Institute for European Environmental Policy and IVM 32

Data gathering and impact assessment for a possible technical review of the IPPC Directive – Part 2
Fact Sheet C.2.Extension of current IPPC activity definition
their installations to BAT, more stringent reporting and monitoring requirements), mainly in certain new Member States.
Option 2.3: Expanding the IPPC to cover all WID installations co-incinerating waste.
Pros: This would lead to a better legislation of the sector, which in turn would
contribute to levelling the playing field between different installations and hence contribute to competitiveness objectives.
This could lead to environmental benefits because over time, installations not covered under IPPC will have to consider and apply BAT standards, and to improve their operational conditions as BAT evolves.
Easier implementation and will prevent installation owners from staying below certain threshold just to keep them excluded from a legislation
Cons: Need to amend the national legislation in many MS. Additional costs for authorities - permits, inspections and enforcement. There are only BAT conclusions for co-incineration in some sectors and therefore
it would be necessary to further investigate abatement technologies and BAT in other sectors using co-incineration (although this is the intention anway as BREFs are reviewed)
Additional costs for operators of the small installations that will be affected (adapt their installations to BAT, more stringent reporting and monitoring requirements).
Option 3: To make both incineration and co-incineration WID plants also subject to IPPC regardless the type of waste used.
Pros: The extension of the IPPC to cover all WID plants could lead to environmental
benefits because over time, the installations not covered under IPPC will have to consider and apply BAT standards, and to improve their operational conditions as BAT evolves.
Some countries, such as the United Kingdom, already have this approach and therefore, it will be easier for them to comply without any potential additional burden. Furthermore, their experience can serve as a basis for the implementation of a homogeneous approach in all MS.
Currently, there are two slightly different permitting regimes for IPPC versus non-IPPC WID plants, which in turn can potentially lead to adverse impacts on competitiveness among operators across MS. The extension of the IPPC to cover all WID plants can contribute to a better legislation of the sector, which in turn would contribute to levelling the playing field between different installations and hence contribute to competitiveness objectives.
Cons: Additional costs of bringing under IPPC installations which are currently only
covered by the WID (e.g. more stringent emission reduction, economic burden associated with the application of Best Available Technologies, etc.)
Additional costs for authorities, notably for permits, inspections and enforcement,
VITO and BIO, with Institute for European Environmental Policy and IVM 33

Data gathering and impact assessment for a possible technical review of the IPPC Directive – Part 2
Fact Sheet C.2.Extension of current IPPC activity definition
specially in new MSs due to the larger number of small HW incinerators below the limits established by the IPPCD.
Need to amend the national legislation in many MS.
VITO and BIO, with Institute for European Environmental Policy and IVM 34

Data gathering and impact assessment for a possible technical review of the IPPC Directive – Part 2
Fact Sheet C.2.Extension of current IPPC activity definition
4. Analysis of options
A qualitative approach is adopted for the analysis of the options proposed in section 3. For each of the issue, the relative advantages and disadvantages of the options are evaluated. The impact assessment matrix shown below the summary of the results of the analysis and the through process behind the rating is explained in the following sub-sections. In each cell a qualitative score of Y/N or ‘+’, ‘0’ or ‘-‘ has been given. A ‘+’ signifies beneficial impact with respect to the criterion in question; ‘-‘ a negative impact; and ‘0’ no impact. Increased magnitude of the impacts will be indicated using the notation ++ or --. In some cases, when there are other external influencing factors, a range is used, for example 0 to – or even + to -.
Option 1A: No Action
Option 2.1: Inclusion of small plants for the incineration of MSW by reducing threshold from 3 to 1t/h
Option 2.2: Inclusion of small plants for the incineration of hazardous waste
Option 2.3: Inclusion of all WID installation co-incinerating waste
Option 3:To include both incineration and co-incineration WID plants under IPPC
General Issues
Legislative changes
N Y Y Y Y
Addressing the problem18 – i.e. controlling the emissions from small incineration and co-incineration plants not covered under IPPC
N Y19 Y18 Y18 Y
Environmental Issue
Air emissions 0 + + + + to ++
18 This question looks at whether the design of the option actually addresses the real problem – in the sense of focus rather than effectiveness. Effectiveness issues come after. Hence it is the intention and targeting of the option that is assessed here and not its effect.
19 These options only cover partially the problem by extending the IPPC to cover small plants only certain subsectors, and not all the WID installations.
VITO and BIO, with Institute for European Environmental Policy and IVM 35

Data gathering and impact assessment for a possible technical review of the IPPC Directive – Part 2
Fact Sheet C.2.Extension of current IPPC activity definition
Economic Issues
Impact on firms: cost
0 0 to - 0 to - 0 to - - --
Impact on firms: competitiveness
0 0 to - 0 to - 0 to - - 0 to - -
Impact on public authorities (budget; resources)
0 - - - --
Social Issues
Confidence of public on environmental control and pollution
- + + + ++
Number of jobs – public authorities
0 0 to + 0 to + 0 to + + to++
Number of jobs – in sector affected
0 - to + - to + - to + - to ++
Other issues: Practicability and Enforceability
Practicability: is it practical to implement?
n/a Y Y Y Y
Clarity and consistency (e.g. with other national and EU legislation)?
n/a Y/N20 Y/N19 Y/N19 Y/N21
Is it enforceable? n/a Y Y Y Y
‘+++’: very beneficial effect; ‘++’: substantial beneficial effect; ‘+’: slight beneficial effect; ‘-‘: negative effect, ‘--‘: substantial negative effect; ‘---‘: very negative effect; ‘0’ no effect; N/A: Not applicable; Y/N: yes/no
All the proposed options (except the Business as usual) are intended to impact most of the aspects. However, the magnitude of this impact may vary from one option to another mostly in the increasing order from option 2.1-2.2 to 4.
20 These options do only affect certain type of installations and not all covered under WID. 21 This change will be in line with the current legislation in certain MS such as UK, which already
implement WID through IPPC.
VITO and BIO, with Institute for European Environmental Policy and IVM 36

Data gathering and impact assessment for a possible technical review of the IPPC Directive – Part 2
Fact Sheet C.2.Extension of current IPPC activity definition
General issues
Problem addressed
As mentioned earlier, at present, many of the plants that are covered by the WI Directive are also covered by the IPPC Directive, but not all of them. In particular, small incineration plants, and to a lesser extent also co-incineration plants, will fall under WID but not IPPC. The major problem to address through this potential amendment is the clarity and simplicity of the existing legislation regulating waste incineration and co-incineration installations. Another problem to address is the effective control of the environmental impacts caused by small dedicated waste incinerators and co-incineration installations. Option 2.1, 2.2 and 2.3 would only affect certain installations incinerating solid municipal waste and hazardous waste, and co-incineration installations respectively and thus many leave a (limited) number of installations out of consideration.
In the case of option 2.1, it has been previously discussed that the number of municipal solid waste incinerators which are only under WID but not IPPC is approximately 5% of the total number. This corresponds to 15 installations in the EU. So going to a lower threshold will not bring an important number of installations under IPPC. In any case, the general trend seems to be the reduction in the number of smaller installations due to stricter compliance requirements.
Regarding option 2.2, according to the available data, most of the installations incinerating hazardous waste in EU-15 are already covered by the IPPC (the average capacity exceeds the established threshold of 10,000 tonnes per day for installations for the incineration of hazardous waste). On the other, the number of small installation in new MSs seems to be elevated (approximately 70% in the Czech Republic, which is the country with the larger number of small installations treating hazardous waste). It has been estimated that the number of small HW installations not covered under the IPPCD might be up to 23% of the total in EU-27.
Nevertheless, it has been observed that these small installations tend to close down due to their poorer ability to comply with stricter legislation in place. Therefore, it will have to be taken into consideration if this trend continues in the future, in particular in new MSs. If so, expanding the IPPC Directive to cover these installations would affect a limited number of installations, thus the benefits could be expected to be limited.
The available information suggests that most co-incineration installations are already covered under IPPC in the cases where the main activity is also covered (e.g. the cement and lime industries or the power sector). Nevertheless, depending on the national classification of an installation as a “co-incineration plant” in accordance with article 3.5 of the WID, there might be certain types of furnaces or boilers of small capacity that are subject to the provisions of the WID but are not covered under IPPC (e.g. carpenter's workshop using treated waste wood for heating purposes or producing hot water). Therefore, the number of co-incineration installations that might be affected might be higher than expected in certain countries such as Austria, where the existence of this type of small co-incinerators has been reported.
Option 3 would affect all the installations covered by the WID, thus the number of installations that will be bring into will be higher that in the case of the previous options.
VITO and BIO, with Institute for European Environmental Policy and IVM 37

Data gathering and impact assessment for a possible technical review of the IPPC Directive – Part 2
Fact Sheet C.2.Extension of current IPPC activity definition
Legislative changes
Except for option 1, all the options will require changes in the legislation and hence the impact of these options will be negative on this aspect. In the case of option 3, there will be no need for changes in the legislation in United Kingdom as this country has already implemented the WID through the IPPC regime.
As indicated in section 2.7, certain countries have GBRs that cover the waste incineration sector, which are generally the legislation implementing the WID. It can be assumed that these countries apply the regulation to the whole sector and not only to installations above the limit established by the IPPCD. Therefore, for these countries, expanding the IPPC Directive to smaller installations will not lead to stricter ELVs, since incinerators are not permitted on a case-by-case basis but through the use of general binding rules.
On the other hand, putting all WID plants under IPPC could be advantageous in terms of legislative simplification if the two directives were merged into one.
Environmental issues
The extension of the IPPC Directive to cover all the installations subject to WID (option 3) would potentially have positive environmental impacts. Installations only covered by WID must meet the minimum WID requirements but are not subject to determination of any stricter requirements based on BAT. As discussed below, BAT-AELs are generally lower that the ELV established in the WID. The other options address only partially the problem and consequently, their environmental positive impacts will be lower.
It is also important to highlight that the IPPC Directive can be considered to be open to a much greater degree of interpretation than the WID, which in turn can lead to a very strict or a much looser application of the legislation. One of the strengths of WID is that it guarantees minimum standards while the IPPCD does not.
In the case of installations incinerating solid municipal waste, it is estimated that small plants only contribute to 0.5% of the total emissions from this type of plants. Therefore the reduction of the environmental impacts associated with the extension to cover small dedicated MSW incinerators (option 2.1) can be expected to be limited. In the case of small hazardous waste incinerators, on the other hand, the associated environmental benefits of expanding the IPPC Directive (option 2.2) can be higher, especially in new MSs, where it has been estimated that 70% of the small HW incinerators are below the thresholds established by the IPPC Directive.
Economic issues
The impact on the installations can be in terms of costs and competitiveness, which are interlinked.
For smaller installations, additional regulatory and abatement costs (especially this last one), may increment the price per tonne of treated waste, which in turn is likely to affect the revenues and competitiveness. Indeed, as it has been previously mentioned, the general trend, is that smaller plants do have to close down due to elevated compliance costs.
VITO and BIO, with Institute for European Environmental Policy and IVM 38

Data gathering and impact assessment for a possible technical review of the IPPC Directive – Part 2
Fact Sheet C.2.Extension of current IPPC activity definition
Moreover, table 14, in section 2.1.g points out that specific investment costs associated to certain abatement technologies rise significantly with smaller throughput. It is possible that a technique now considered part of BAT for the current scope could become so much less cost effective on smaller sized installations and could fail to qualify as BAT for those. Therefore for options 2.1, 2.2, 2.3 and 3 (option to include lower thresholds under IPPC), the BREFs and BATs would have to be reviewed to ensure they correctly address the new scope.
In the case of 2.1, it has been estimated that only 5% of the installations will be affected.
For option 2.2, on the other hand, a significant amount of the small installations in new MSs will be affected (33 installations according to the current estimations). In some cases, certain installations will have to close down due to the increased costs. At the local scale, this might results in diverting waste to landfills.
In the case of option 2.3, it can be expected that most co-incineration plants are already covered by IPPC, so the amount of affected installations will be limited. Nevertheless, this assumption should be taken with caution as there are certain countries (e.g. Austria) where, due to the current interpretation of the article 3.5 of the WID and the current practice, there is a number of small installations subject to the waste incineration regulations that are not under the scope of IPPC.
Further, currently there are slightly different permitting regimes for plants covered under WID and IPPC and those only covered under WID. The inclusion of small installations under IPPC may act as a playing field within Europe by harmonising the national and EU regulatory obligations.
For the regulatory authorities, options 3 may result in increasing workload and related impacts. However, those impacts will not be uniform across Europe. For example in the United Kingdom, which has already implemented WID through IPPC, an increased work load is not expected. Indeed it appears that the main driver for placing all WID plants under the UK legislation implementing the IPPC Directive was to avoid the unnecessary complexity and cost of having a slightly different regulatory regime for the smaller plants.
In principle, no additional workload should be expected in those countries with GBRs covering the whole sector and not only to installations above the limit established by the IPPCD. At least 10 MS are in this case.
Nevertheless, it has been highlighted by certain stakeholders that even though GBRs can help to implement the IPPCD requirements and simplify and shorten permit procedures by avoiding long-lasting considerations and discussions about certain permit conditions in the single issuing procedure, the use of GBRs might not necessary balance the extra burden resulting from the additional requirements established by the IPPCD, especially for small companies with WID installations (e.g. contents (descriptions) in the application for a permit, duty to adapt the installation within a certain timeframe,
VITO and BIO, with Institute for European Environmental Policy and IVM 39

Data gathering and impact assessment for a possible technical review of the IPPC Directive – Part 2
Fact Sheet C.2.Extension of current IPPC activity definition
other requirements linked with the IPPCD (ambient noise directive, public participation, environmental liability), etc) [WKO, 2007].
Social issues
Improved regulation and reduced environmental problem may raise the public confidence in regulatory measures. The impacts on employment can range from positive to negative in the affected installations. The positive impacts may come from the fact that the industry may need additional manpower for environmental management of the sites and for regulatory purposes. However, as it was indicated before, additional administrative burden can have a direct influence on performance and survival of small incinerators, and consequently the associated social issues such as loss of jobs for the people working in these installations may occur. This can be the case for option 2.2, in particular in new MSs as most, and option 2.3.
For option 2.1, as most installations are already covered, creation of jobs can not be expected.
In option 3 increase workload may not result in extra jobs, as the increase can be considered to be small and the majority plants are already under WID.
Other issues
In terms of practicability, option 3 is more practical as it will cover the whole sector. On the other hand, options 2.1 and 2.2 target the two sectors that are most relevant from the point of view of the number of installations not cover under IPPC already, and therefore, they will be more cost effective.
From enforcement point of view, options 3 will be more complicated as it will involve different type of installations and will require more changes in the current provisions of the IPPC Directive.
5. Conclusion
At present, many of the plants that are covered by the WI Directive are also covered by the IPPC Directive, but not all of them. Hence, there are two different permitting regimes for the IPPC versus the non-IPPC WID installation. The WI Directive only sets minimum obligations which are not necessarily sufficient to comply with the IPPC Directive.
These two Directives have much in common, notably in requiring incinerator operators to apply for a permit with conditions to ensure that pollution is prevented, or controlled where that is not possible. Therefore, there might be certain synergies that can be exploited by extending the IPPC to cover all installations under WID.
Regarding incineration, the IPPC Directive covers all facilities incinerating more than 10 tonnes per day of hazardous waste or 3 tonnes per hour of municipal waste. Although several small dedicated waste incinerators do exist, the current evaluation suggests that most incineration and co-incineration plants are already covered under IPPC. For
VITO and BIO, with Institute for European Environmental Policy and IVM 40
Data gathering and impact assessment for a possible technical review of the IPPC Directive – Part 2
Fact Sheet C.2.Extension of current IPPC activity definition
example, only 5 % of the incinerators of municipal waste are not covered under IPPC. However, it is important to consider that approximately 23% of the hazardous waste incinerators in EU-27 have been estimated to be below the threshold limit established by the IPPCD. These installations are located mainly in new MSs.
Nevertheless, because of their poorer ability to comply with existing environmental legislation, most small plants are expected to disappear in the near future.Covering all WID installations by IPPC will especially affect smaller installations, those that are below the thresholds established by the IPPC.
Expanding the IPPC Directive to cover all WID installations is expected to have some positive impacts on the environment, in particular regarding energy efficiency and pollutant emissions. This is mainly due to the fact that non-IPPC WID plants will have their standards improved as BAT evolves. On the other hand, the current analysis shows that the contribution of these small installations to the total environmental impact of the sector is very small.
This change is expected to have negative impact on the permitting burden. Because compliance costs are likely to increase for small installations, it is quite likely that operators of small incinerators will withdraw from the sector in the long term. This could result in a cessation of small scale activities.
Also, many such small incinerators are associated with a company’s business (for example, an incinerator owned by a garage and used for the disposal of used car engine oil). In this case, the loss of a plant may increase waste transport and disposal costs. The waste will be treated in centralised disposal units (i.e. incineration or landfilling).
The possible impact on the competitiveness of this small installation is a factor that has to be taken into consideration. On the other hand, the respective coverage of installations may lead to apparent disparities in the stringency of controls applied for installations covered by both Directives as compared to those under the WI Directive alone. For example, a hazardous waste incinerator that is not covered by IPPC, because it is below the threshold, may need to comply with less strict emission limits than a municipal waste incinerator that is covered by IPPC. Covering all WID installations by IPPC will contribute to create a level playing field for all the installations in the sector regardless their capacity and to harmonise current practice across Europe.
The outcome of the Commission’s separate consultancy study on the implementation of the WID will be key to addressing this potential amendment further.
It should be underlined that this particular fact sheet has not assessed specifically the extension of the IPPC Directive to installations incinerating non-hazardous waste (other than municipal waste) with a capacity exceeding 3 tonnes per hour. Such an amendment would concern in particular installations which incinerate non-hazardous industrial waste. Certain of such dedicated incinerators have large capacities and similar environmental impacts as municipal solid waste incinerators. In addition, municipal waste and industrial waste are often incinerated in the same plants. No precise data could be collected on the number of installations
VITO and BIO, with Institute for European Environmental Policy and IVM 41

Data gathering and impact assessment for a possible technical review of the IPPC Directive – Part 2
Fact Sheet C.2.Extension of current IPPC activity definition
concerned but it can be expected that their number is rather limited.
6. Main references
[CEWEP, 2006] “Country Reports on Waste Management”, Various authors, CEWEP Congress, Vienna 2006
[CEWEP, 2007] Personal communication, Ella Stengler, April 2007
[CORINAIR, 2006] “EMEP/CORINAIR Emission Inventory Guidebook – 2006”, EEA, 2006
[Defra, 2006] “Guidance on Directive 2000/76/EC on the incineration of waste-Edition 3”, Defra, June 2006
[EC, 2001] “Reference document on the best available techniques in theCement and Lime Manufacturing Industries”, European Commission, December 2001
[EC 2003] “Refuse derived fuel, current practice and perspectives”,European Commission
[EC 2006] “Reference document on the best available techniques for waste incineration”, European Commission, August 2006
[ENTEC, 1998] ENTEC “Regulatory and environmental Impact assessment of the proposed waste incineration Directive”, Report N 99019
[EurObserv’ER, 2006] “Solid Biomass Barometer”, EurObserv’ER, December 2006.
[Eurofer, 2007] Comments received from Eurofer, July 2007
[FEM, 2005] “Waste Incineration — A Potential Danger?”, German Federal Environmental Ministry, 2005
[FNADE, 2005] FNADE “Traitement Thermique des déchets-Fact Sheet“, 2005 [IPTS, 1999] “The incineration of waste in Europe: Issues and Perspectives”,
Institute for Prospective Technological Studies, 1999
[Kleis, 2004] Kleis, Heron and Dalager, Søren “100 Years of Waste Incineration in Denmark”, Babcock & Wilcox Vølund and Rambøll, 2004.
[UNEP, 2006] “Guidelines on best available techniques and provisional
guidance on best environmental practices relevant to Article 5 and Annex C of the Stockholm Convention on Persistent Organic Pollutants”, UNEP, 2006
VITO and BIO, with Institute for European Environmental Policy and IVM 42

Data gathering and impact assessment for a possible technical review of the IPPC Directive – Part 2
Fact Sheet C.2.Extension of current IPPC activity definition
[Oekopol, 2007] Information provided by Oekopol, Institute for Environmental Strategies, Germany
[RenoSam, 2006] RenoSam and Ramboll “The most sustainable waste management system in Europe – Waste to Energy in Denmark”, Available online (www.ramboll.dk)
[VITO, 2006] VITO, BIO and IEEP (2006) “Data Gathering and Impact Assessment for a Possible Review of the IPPC Directive, Draft Final Report”, Framework contract No ENV.G.1/FRA/2004/0081
[WKO, 2007] Information/Comments provided by the Austrian Federal Economic Chamber (WKO)
7. Contacts / Acknowledgements
We express our gratitude to the following persons who have provided information on the current practice and important data concerning this potential amendment and also useful comments on our approach of analysis.
Cedric de Meeûs, VEOLIA Environment- Bruxelles
Ella Stengler, CEWEP -Confederation of European Waste-to-Energy Plants
Mike Hale -Eurits - the European Union for the Responsible Incineration and Treatment of Special waste
Knut Sander, Okopol, Germany
Charlotte Bigum Lynaes, FEAD - European Federation of Waste Management and Environmental Services
Isabelle Conche, EUCOPRO – European Association for Co-Processing.
Annette Mejia, ISWA – International Solid Waste Association
Guenther Grassl, WKO - Austrian Federal Economic Chamber
Jean-Pierre Debruxelles, EUROFER – European Confederation of Iron and steel Industries
VITO and BIO, with Institute for European Environmental Policy and IVM 43

Data gathering and impact assessment for a possible technical review of the IPPC Directive – Part 2
Fact Sheet C.2.Extension of current IPPC activity definition
Annex A: Definitions
Article 1(a) of the Waste Framework Directive (WFD.) states that waste is "..any substance or object……which the holder discards or intends or is required to discard." For the purposes of the WID, “waste” has the same meaning as in the WFD. Waste is generally a highly heterogeneous material.
Waste is generated by industrial activities, by the residential and public sector, by sewage treatment and street cleaning, by the health sector, etc. It can be distinguished between hazardous and non-hazardous waste. Non-hazardous waste is produced by households, institutions, and by commercial and light industrial facilities. So-called municipal solid waste (MSW) mainly consists of paper and paperboard, glass, metals, plastics, rubber, leather, textiles, wood, food wastes, yard wastes, and miscellaneous inorganic waste. Hazardous waste comprises mainly waste generated by industrial production processes (e.g. ashes, sludges, and other production waste).
Incineration is a treatment option for a very wide range of wastes. The objective of waste incineration is to reduce its volume and hazard, whilst capturing or destroying potentially harmful substances. Incineration processes can also provide a means to enable recovery of the energy, mineral, and/or chemical content from waste [EC, 2006].
The Waste Incineration Directive (WID) (2000/76/EC) defines incineration plants as “any stationary or mobile technical unit and equipment dedicated to the thermal treatment of wastes with or without recovery of the combustion heat generated. This includes the incineration by oxidation of waste as well as other thermal treatment processes such as pyrolysis, gasification or plasma processes in so far as the substances resulting from the treatment are subsequently incinerated”.
Such definition covers the entire incineration plant including all incineration lines and associated processes (e.g. waste reception, storage, on site pre-treatment facilities, waste-fuel and air-supply systems, boiler, facilities for the treatment of exhaust gases, on-site facilities for treatment or storage of residues and waste water, stack, devices and systems for controlling incineration operations and recording and monitoring incineration conditions).
The WID also defines co-incineration plants as “any stationary or mobile plant whose main purpose is the generation of energy or production of material products and:
- which uses wastes as a regular or additional fuel; or- in which waste is thermally treated for the purpose of disposal
Therefore, co-incineration of waste fuel consists of the combustion of waste, substituting another fuel, in an installation intended for the production of energy or products, and not intended for waste treatment only.
The term ‘Secondary Fuel, Substitute Fuel and Substitute Liquid Fuel (SLF)’ are used in this report for processed industrial wastes which may be homogeneous or mixed to specification. Examples of these fuels include waste tyres, waste oils, spent solvents, sewage sludge, and industrial sludge (e.g. paint sludge and paper sludge). These terms can also refer to non-hazardous packaging or other residues from industrial/trade sources (e.g. plastic, paper and textiles), biomass (e.g. waste wood and sawdust), demolition waste, and shredded combustible residues from scrap cars [EC, 2003].
VITO and BIO, with Institute for European Environmental Policy and IVM 44

Data gathering and impact assessment for a possible technical review of the IPPC Directive – Part 2
Fact Sheet C.2.Extension of current IPPC activity definition
In this context, “waste-to-energy plants” refer to those installations that incinerate or co-incinerate waste with recovery of generated energy. Waste-to-energy schemes turn waste into steam or electricity to heat, cool, light and/or otherwise power homes and industry through the process of combustion.
VITO and BIO, with Institute for European Environmental Policy and IVM 45

Data gathering and impact assessment for a possible technical review of the IPPC Directive – Part 2
Fact Sheet C.2.Extension of current IPPC activity definition
Annex B: Incineration-Current Practice
Municipal Waste Incineration
The primary benefit of municipal solid waste incineration is the destruction of organic (including toxic) materials, the reduction in the volume of the waste and the concentration of pollutants (e.g. heavy metals) into comparable small quantities of ashes thus generating safe sinks. The generation of energy is an important additional benefit. Indeed, municipal solid waste incineration is commonly accompanied by the recovery of energy (waste-to-energy) in the form of steam or the generation of electricity. Incinerators can also be designed to accommodate processed forms of municipal solid waste known as refuse-derived fuels, as well as co-firing with fossil fuels.
Figure B.1 - Example layout of a municipal solid waste incineration plant
Source: [EC 2006]
Municipal solid waste can be incinerated in different types of combustion systems including travelling grate, rotary kilns, and fluidised beds. Fluidised bed technology requires municipal solid waste to be of a certain particle size range – this usually requires some degree of pre-treatment and the selective collection of the waste. Combustion capacities of municipal solid waste incinerators typically range from 90 to 2,700 tons of municipal solid waste per day (modular configurations: 4 to 270 tons per day) [UNEP, 2006]. Hazardous wastes
The Waste Incineration Directive defines hazardous waste as “any solid or liquid waste as defined in Article 1(4) of Council Directive 91/689/EEC of 12 December 1991 on hazardous waste”. This type of waste include acids and alkalis; halogenated and other potentially-toxic compounds; fuels, oils and greases; and used filter materials, animal and food wastes. Industrial waste sources include chemical plant, refineries, light and heavy manufacturing, etc.
VITO and BIO, with Institute for European Environmental Policy and IVM 46

Data gathering and impact assessment for a possible technical review of the IPPC Directive – Part 2
Fact Sheet C.2.Extension of current IPPC activity definition
Similar to the incineration of municipal solid waste, hazardous waste incineration offers the benefits of destruction of organic (including toxic) materials, volume reduction, concentrating pollutants into relatively small quantities of ashes, and energy recovery.
The hazardous waste incineration sector comprises two main sub-sectors [EC, 2006]: Merchant incineration plants, which provide commercial, off-site, waste treatment
services, and are operated by private companies, municipalities or partnerships. Dedicated incineration plant, which are typically located at large industrial
facilities and process waste streams generated at the site, and serve private companies that use the plant for the treatment of their own wastes.
Because of the higher potential hazard of dealing with such wastes and the uncertainty often associated with their composition, special procedures for transportation, handling, storage, monitoring, and control are required. Special handling may also be necessary for any residues after treatment.
The most common combustion technology in hazardous waste incineration is the rotary kiln, but grate incinerators (including co-firing with other wastes) are also sometimes applied to solid wastes, and fluidized bed incinerators to some pre-treated materials. Static furnaces are also widely applied at onsite facilities at chemical plants.
The individual incineration capacity of rotary kilns in the dedicated waste incinerators varies between 30,000 and 100,000 tonnes a year. The mass capacity for an individual design varies considerably with the average calorific value of the waste, with the principal factor being thermal capacity. Sewage sludge
Domestic sewage sludge is disposed of in a number of ways, including land application, surface disposal, incineration, co-disposal with municipal solid waste, and co-incineration. The incineration of sewage sludge is practised in several countries, either alone or through co-incineration in municipal solid waste incinerators or in other combustion plants (e.g. coal-fired power plants and cement kilns). The composition of sewage sludge varies greatly. Typical composition ranges for dewatered communal and industrial sewage sludge are show in the following table.
Table B.1 - Table Average composition of dewatered communal sewage sludge after dewateringComponent Communal sewage sludge Industrial sewage sludge
Dry solids (%) 10 – 45 -Organic material (% of dry solids)
45 – 85 -
Heavy metals mg/kg d.s.) - -Cr 20 – 77 170Cu 200 – 600 1800Pb 100 – 700 40Ni 15 – 50 170Sb 1 – 5 <10Zn 500 – 1500 280As 5 – 20 <10
VITO and BIO, with Institute for European Environmental Policy and IVM 47

Data gathering and impact assessment for a possible technical review of the IPPC Directive – Part 2
Fact Sheet C.2.Extension of current IPPC activity definition
Hg 0.5 – 4.6 1Cd 1 – 5 <1Mo 4 – 20 -Source: [EC 2006]
The effective disposal of sewage sludge through incineration depends on a number of factors, including whether the sewage is mixed with industrial waste streams (which can increase heavy metal loadings), location (coastal locations can result in salt water intrusion), pre-treatment (or the lack thereof), and weather (rainfall dilution) [UNEP, 2006; EC, 2006].
The variability of moisture content, energy value, and possible mixture with other wastes (e.g. industrial waste if sewage systems are interconnected) require special considerations in handling and pre-treatment.
The incineration of sewage sludge usually takes place in rotary kilns, multiple hearth, or fluidised bed incinerators. Co-combustion in grate-firing systems, coal combustion plants, and industrial processes is also applied. Sewage sludge often has high water content and therefore usually requires drying or addition of supplementary fuels to ensure stable and efficient combustion. A typical sewage sludge incinerator may process as much as 80,000 tons of sewage sludge (35% dry solids) per year [UNEP, 2006; EC, 2006].
Clinical waste
Special attention is required when dealing with clinical wastes to manage the specific risks of these wastes (e.g. infectious contamination and needles.), the aesthetic standards (residues of operations, etc.) and their incineration behaviour (very variable calorific value and moisture contents).
Similar to hazardous wastes, the composition of specific clinical wastes varies greatly. Clinical waste may include (to varying degrees) pharmaceutical substances, used medical equipment, infectious agents, sharp materials such as hypodermic needles, etc. Therefore, it usually requires long incineration times to ensure thorough waste burnout and good residue quality.
In some cases, a distinction is made between the incineration routes for pathological (potentially infectious waste) and non-pathological waste. The treatment of pathological waste is sometimes restricted to dedicated incinerators, while non-pathological waste is, in some cases, incinerated with other wastes in non-dedicated incinerators e.g. MSWI.
As for hazardous waste, rotary kilns are the most commonly used thermal treatment.
VITO and BIO, with Institute for European Environmental Policy and IVM 48
Data gathering and impact assessment for a possible technical review of the IPPC Directive – Part 2
Fact Sheet C.2.Extension of current IPPC activity definition
Annex C: Types of secondary fuels co-incinerated in Europea)
Secondary fuel
AT BE DK FI FR DE GR IR IT LU NL PO ES SE UK
Tyres 1 1 1 1 1 1 1 1 (1) 1Solvent 1 1 1 1 1,2 1 1 1Plastics 1 1 1 1,3 1 1 (1)Car residues 1 2Paper/card 1 1 1,3 1 1 (1) (2)Animal waste* b) 1,2 1,2 2 1 1 1,2 (2)Used oils 1 1 (2) 1 1 (2) 1 1,2Sawdust 3 1 3 1Woodb) 2 1 2 2 1 2 1,3 2 2Paper sludge b) 1,3 3 1,2Sewage sludge 1, (2) (2) 1,2 (3) 1Straw b) 3 (2)Textile/carpet 1 1 1Other 2,3 2,3 2 1,2,3 1,2 1Notes:* bone meal, animal fats or animal manure1 cement industry;2 public energy production;3 other industrial sectors (e.g.. brick industry, etc)a) Figures into brackets are planned or unconfirmed utilisationb) Excluded from the scope of the Waste Incineration Directive
VITO and BIO, with Institute for European Environmental Policy and IVM 49

Data gathering and impact assessment for a possible technical review of the IPPC Directive – Part 2
Fact sheet C2-Waste Incineration
Annex D: Co-incineration-Current Practice
Cement industryThe use of secondary fuels is an important option for the cement industry. Depending on the used raw materials and the process technology (wet, dry or semi dry/wet process), the energy demand varies between 2.8 GJ and 5.5 GJ to produce one tonne of clinker. Fossil fuels (e.g. coal, petroleum coke, oil or natural gas) are the predominant fuels used in cement and lime industries. However, low grade fuels such as waste fuels (traditionally waste oils, spent solvent, waste tyres) have been increasingly utilised in the recent years.
The fuels are generally added in the main burner, or with the raw materials, or in thedecarbonisation zone (wet process only) or in the precalciner (dry process only). When added into the burner, solid fuel is crushed prior to its firing into the burner. Pulverisation is necessary to assure a complete burn-out of the residual ash. The flame temperature is very high (between 1800 and 2000°C) and retention time of more than 5 sec at temperature above 1200°C ensuring the total destruction of organics [EC 2003] .
The types of waste most frequently used as fuels in cement industry Europe are [EC, 2001]:
Used tyres Waste oils Sewage sludge Rubber Waste woods Plastics Paper waste Paper sludge Spent solvents
Power plantProduction of electricity from coal requires about 300 kg coal per MWh produced. The use of waste as secondary of substitution fuels is an attractive alternative. Co-firing waste derived fuels in coal-fired power and district heating plants is relatively common in Denmark, Finland, Germany, Netherlands, and Sweden.
Power plants and district heating plants co-combust mainly non-hazardous secondary fuels such as waste wood, straw and dried sewage sludge. Other wastes can be used such as processed MSW, coffee husks, maize cobs, cotton residues, palm oil residues as well as liquid or gaseous waste such as waste oils, waste organic fuels, and biogas. Solid wastes need to be pulverised to a size of 1 mm and impurities removed before the waste is injected with the coal.
The co-firing of biomass waste in coal-fired power stations is likely to increase following the implementation of the EC Directive on Renewable Energy as it can contribute towards renewable target obligations. There are other technologies being developed in energy production sector from biomass waste such as gasification, pyrolysis and anaerobic digestion [EC 2003].
Lime kilns
VITO and BIO, with Institute for European Environmental Policy and IVM 50

Data gathering and impact assessment for a possible technical review of the IPPC Directive – Part 2
Fact sheet C2-Waste Incineration
The production of quicklime (CaO) by burning limestone into a kiln is another high energy demanding process requiring between 900 and 1800 kcal/kg. The temperatures are as high as 1300°C with more than 5 seconds residence time for carbon dioxide to be driven off from limestone. It was reported in 1995 (European Lime Association as reported in [EC 2003]) that in Europe about 1% of fuels consumed by lime industry was derived from waste, compared with 48% of gas, 36% of coal and 15% of heavy fuel.
VITO and BIO, with Institute for European Environmental Policy and IVM 51
Data gathering and impact assessment for a possible technical review of the IPPC Directive – Part 2
Fact sheet C2-Waste Incineration
Annex E: Estimation of production of municipal waste, hazardous waste and sewage sludge in EU-15 as well as the percentage of incineration in each MS
Municipal Solid Waste Hazardous waste Sewage Sludge
Country
Total estimated production (in 106 tonnes) % incinerated
Amount of waste incinerated (in 106 tonnes)
Total estimated production (in 106 tonnes) % incinerated
Amount of waste incinerated (in 106 tonnes)
Total estimated production (in 106 tonnes)
Austria 1,32 35 0,46 0,97 11,34 0,11 0,39Belgium 4,85 35 1,70 2,03 6,89655172 0,14 0,85Denmark 2,77 56 1,55 0,27 37,037037 0,1 0,15Finland 0,98 2 0,02 0,57 17,5438597 0,1 0,14France 48,5 26 12,61 Not available 0,77 0,82
Germany 45 29 13,05 9,17 9,2693566 0,85 2,48Greece 3,2 0 0,00 Not available Not available Not availableIreland 1,8 0 0,00 0,23 13,0434783 0,03 0,39Italy 25,4 8 2,03 Not available Not available Not available
Luxembourg 0,3 48 0,14 0,14 Not available Not availablePortugal 4,6 20 0,92 0,25 Not available 0,24
Spain 17 10 1,70 2 1,5 0,03 Not availableSweden 3,8 38 1,44 0,27 37,037037 0,1
Netherlands 10,2 76 7,75 2,7 10,3703704 0,28 0,69United Kingdom 27,2 6 1,63 2,37 10,1265823 0,24 1,2
Total 196,92 45,01 20,97 2,75 7,35
Source: adapted from [EC 2006]
VITO and BIO, with Institute for European Environmental Policy and IVM 52

Data gathering and impact assessment for a possible technical review of the IPPC Directive – Part 2
Fact sheet C2-Waste Incineration
NOTE: The year of the data source varies for each country from 1996 to 2002, depending on the country.
VITO and BIO, with Institute for European Environmental Policy and IVM 53

Data gathering and impact assessment for a possible technical review of the IPPC Directive – Part 2
Fact sheet C2-Waste Incineration
Annex F: Primary energy production of renewable solid municipal waste in the European Union in 2004 and 2005 (in Mtoe)
Country 2004 2005 Growth (%)France 0.957 0.920 -3.9Italy 0.653 0.751 15.1Denmark 0.686 0.685 -0.1Netherlands 0.623 0.669 7.5Germany 0.624 0.605 3.1United Kingdom 0.463 0.460 0.7Sweden 0.254 0.295 15.9Latvia 0.224 0.224 0.0Spain 0.140 0.188 34.1Belgium 0.173 0.187 8.4Portugal 0.095 0.103 9.4Finland 0.076 0.066 -12.8Austria 0.059 0.057 -3.3Czech Republic 0.060 0.056 -6.3Slovakia 0.029 0.033 15.6Hungary 0.016 0.033 101.2Luxembourg 0.014 0.013 -6.3Poland 0.0003 0.0003 0.0TOTAL 5.144 5.346 3.9Source [EurObserv’ER 2006]
VITO and BIO, with Institute for European Environmental Policy and IVM 54

Data gathering and impact assessment for a possible technical review of the IPPC Directive – Part 2
Fact sheet C2-Waste Incineration
Annex G: Comparative costs of MSW incineration in different MSs
Pre-tax2 costs net of revenues in EUR per tonne waste input
Tax (for plant with energy recovery)
Revenues from energysupply(EUR per kWh)
Costs of ashtreatment (EUR pertonne of ash unlessotherwise specified)
A 326 @ 60 kt/yr159 @150 kt/yr97 @ 300 kt/yr
Electricity: 0.036Heat: 0.018
Bottom ash: 63Flue-gas residues:363
B 72 average EUR 12.7/t(Flanders)
Electricity: 0.025
Not available
DK 30 – 45 EUR 44/t Electricity: 0.05
Bottom ash: 34Flue-gas treatmentresidues: 80
FIN None For gasification,Electricity 0.034Heat 0.017
F 86 - 101 @ 37.5 kt/yr80 - 90 @ 75 kt/yr67 - 80 @ 150 kt/yr
Electricity 0.033 - 0.046Heat: 0.0076 - 0.023
Bottom ash:EUR 13 – 18 pertonne input
D 250 (50 kt/yr and below)1105 (200 kt/yr) 165 @ 600 kt/yr1
Electricity 0.015 – 0.025
Bottom ash:25 - 30Fly ash/air pollutioncontrol residues:100 - 250
EL None Not known Not known
IRL None Not known Not known
I 41.3 – 93(350 kt, depends on revenues for energy andpackaging recovery)
Electricity: 0.14 (old)0.04 (market)0.05 (green cert.)
Bottom ash: 75Fly ash and airpollution controlresidues: 29
L 97 (120 kt) Electricity: 0.025(estimated)
Bottom ash EUR 16/t input waste
VITO and BIO, with Institute for European Environmental Policy and IVM 55

Data gathering and impact assessment for a possible technical review of the IPPC Directive – Part 2
Fact sheet C2-Waste Incineration
Flue-gas residues:EUR 8/t input waste
NL 71 – 110170 – 1341
Electricity: 0.027 - 0.04 (estimated)
P 46 – 76 (est.) No dataE 34 – 56 Electricity:
0.036S 21 – 53 Electricity:
0.03Heat: 0.02
UK 69 @ 100kt/yr47 @ 200kt/yr
Electricity: 0.032
Bottom ash rcycled (net cost to operator)fly ash circa 90
Notes:1. These figures are gate fees, not costs2. Pre-tax cost refers to gross costs without any taxSource: [ EC, 2006]
VITO and BIO, with Institute for European Environmental Policy and IVM 56

Data gathering and impact assessment for a possible technical review of the IPPC Directive – Part 2
Fact sheet C2-Waste Incineration
Annex H: Comparison between emission levels reported from MSWI and HWI and the ELV established in the WID
H.1 - Range of clean gas operation emissions levels reported from some European MSWI plants
Parameter Type ofMeasurement
Daily averages (wherecontinuous measurementused) in mg/m³
Half hour averages(where continuousmeasurement used)in mg/m³
Annualaveragesmg/m³)
C: continuousN: non-cont.
Limits in2000/76/EC
Range of values
Limits in2000/76/EC
Range ofvalues
Range ofvalues
Dust C 10 0.1 – 10 20 <0.05 – 15
0.1 – 4
HCl C 10 0.1 – 10 60 <0.1 – 80 0.1 – 6HF C/N 1 0.1 – 1 4 <0.02 – 1 0.01 – 0.1SO2 C 50 0.5 – 50 200 0.1 – 250 0.2 – 20NOX C 200 30 – 200 400 20 – 450 20 – 180NH3 C n/a <0.1 - 3 0.55 –
3.55N2O n/aVOC (asTOC)
C 10 0.1 – 10 20 0.1 – 25 0.1 – 5
CO C 50 1 – 100 100 1 – 150 2 – 45Hg C/N 0.05 0.0005 –
0.05 n/a 0.0014 –
0.036 0.0002 – 0.05
Cd N n/a 0.0003 – 0.003
n/a
As N n/a <0.0001 – 0.001
n/a
Pb N n/a <0.002 – 0.044
n/a
Cr N n/a 0.0004 – 0.002
n/a
Co N n/a <0.002 n/aNi N n/a 0.0003 –
0.002 n/a
Cd and Tl N 0.05 n/a 0.0002 – 0.03
∑ other metals 1
N 0.5 n/a 0.0002 – 0.05
∑ other metals 2
N n/a 0.01 – 0.1 n/a
VITO and BIO, with Institute for European Environmental Policy and IVM 57

Data gathering and impact assessment for a possible technical review of the IPPC Directive – Part 2
Fact sheet C2-Waste Incineration
Benz(a)pyrene
N n/a n/a <0.001
∑PCB N n/a n/a <0.005
∑PAH N n/a n/a <0.01PCDD/F(ngTEQ/m³)
N 0.1(ngTEQ/m³)
n/a 0.0002 – 0.08(ng TEQ/m³)
NOTES:-In some cases there are no emission limit values in force for NOX. For such installations a typical range of values is 250 - 550 mg/Nm³ (discontinuous measurement).-Where non-continuous measurements are indicated (N) the averaging period does not apply. Samplingperiods are generally in the order of 4 – 8 hours for such measurements.- Data is standardised at 11 % Oxygen, dry gas, 273K and 101.3kPa.1 Other metals 1 = Sb, As, Pb, Cr, Co, Cu, Mn, Ni, V2 Other metals 2 = Sb, Pb, Cr, Cu, Mn, V, Co, Ni, Se and Te
It is important to note that data that are the result of non-continuous (or spot) measurements are also included in the Table. They are indicated (N) in the type of measurement column. Furthermore, where non-continuous measurements appear in an averaging column, the values presented for non-continuous measurements are not collected over the stated averaging period for that column, and should only be interpreted as non-continuous measurements.Source: [EC, 2006]
Table H.2 - Typical range of clean gas emissions to air from hazardous waste incineration plantsParameter Type of
measurementDaily averages (mg/Nm³)
Thirty-minute Averages(mg/Nm³)
Annualaverages(mg/Nm³)
C: cont.N: non-cont.
Limits in2000/76/EU
Typicalrange ofvalues
Limits in2000/76/EU
Typicalrange ofvalues
Typical range ofvalues
Dust C 10 0.1 – 10 20 0.1 – 15 0.1 – 2HCl C 10 0.1 – 10 60 0.1 – 60 0.3 – 5HF C/N 1 0.04 – 1 4 0.1 – 2 0.05 – 1SO2 C 50 0.1 – 50 200 0.1 – 150 0.1 – 30NOX C 200 40 – 200 400 50 – 400 70 – 180TOC C 10 0.1 – 10 20 0.1 – 20 0.01 – 5CO C 50 5 - 50 100 5 – 100 5 – 50Hg C/N 0.05 0.0003 –
0.03 n/a 0.0003- 1 0.0004 –
0.05Cd +Tl N 0.05 0.0005 – n/a 0.0005 –
VITO and BIO, with Institute for European Environmental Policy and IVM 58

Data gathering and impact assessment for a possible technical review of the IPPC Directive – Part 2
Fact sheet C2-Waste Incineration
0.05 0.05∑other heavymetals
N 0.5 0.0013 – 0.5
n/a 0.004 – 0.4
PCDD/PCDF(ng TEQ/m³)
N 0.1 0.002 – 0.1
n/a 0.0003 – 0.08
1. Data is standardised at 11 % Oxygen, dry gas, 273K and 101.3kPa.2. Other metals = Sb, As, Pb, Cr, Co, Cu, Mn, Ni, VSource: [EC, 2006]
VITO and BIO, with Institute for European Environmental Policy and IVM 59

Data gathering and impact assessment for a possible technical review of the IPPC Directive – Part 2
Fact sheet C2-Waste Incineration
Annex I: Air emission limit values for incineration and co-incineration of wasteunder Directive 2000/76/EC
Emission limit values (C proc.) for co-incineration of waste in combustionplants under Directive 2000/76/EC
VITO and BIO, with Institute for European Environmental Policy and IVM 60

Data gathering and impact assessment for a possible technical review of the IPPC Directive – Part 2
Fact sheet C2-Waste Incineration
Annex J: Estimated annual emissions for MSWI and HWI respectively without abatement technologies
Table J.1 - Estimated annual emissions (in tonnes) from the incineration of municipal solid waste in Europe
Source: modified from [CORINAIR, 2006] and [CE, 2006].
VITO and BIO, with Institute for European Environmental Policy and IVM
Compound
Country SO2 NOx NM VOC CO HCl TSP Pb Cd Hg PM10 PM2.5
Austria 785.40 831.60 9.24 323.40 1062.60 8454.60 48.05 1.57 1.29 6329.40 4250.40Belgium 2885.75 3055.50 33.95 1188.25 3904.25 31064.25 176.54 5.77 4.75 23255.75 15617.00Denmark 2637.04 2792.16 31.02 1085.84 3567.76 28386.96 161.32 5.27 4.34 21251.44 14271.04Finland 33.32 35.28 0.39 13.72 45.08 358.68 2.04 0.07 0.05 268.52 180.32France 21437.00 22698.00 252.20 8827.00 29003.00 230763.00 1311.44 42.87 35.31 172757.00 116012.00
Germany 22185.00 23490.00 261.00 9135.00 30015.00 238815.00 1357.20 44.37 36.54 178785.00 120060.00Greece 0.00 0.00 0,00 0,00 0,00 0,00 0,00 0.00 0,00 000 0,00Ireland 0.00 0.00 0,00 0,00 0,00 0,00 0,00 0,00 0,00 0,00 0,00
Italy 3454.40 3657.60 40.64 1422.40 4673.60 37185.60 211.33 6.91 5.69 27838.40 18694.40Luxembourg 244.80 259.20 2.88 100.80 331.20 2635.20 14.98 0.49 0.40 1972.80 1324.80
Portugal 1564.00 1656.00 18.40 644.00 2116.00 16836.00 95.68 3.13 2.58 12604.00 8464.00Spain 2890.00 3060.00 34.00 1190.00 3910.00 31110.00 176.80 5.78 4.76 23290.00 15640.00
Sweden 2454.80 2599.20 28.88 1010.80 3321.20 26425.20 150.18 4.91 4.04 19782.80 13284.80Netherlands 13178.40 13953.60 155.04 5426.40 17829.60 141861.60 806.21 26.36 21.71 106202.40 71318.40
United Kingdom 2774.40 2937.60 32.64 1142.40 3753.60 29865.60 169.73 5.55 4.57 22358.40 15014.40TOTAL 76524.31 81025.74 900.29 31510.01 10353289 823761.69 4681.49 153.05 126.04 616695.91 414131.56
Installations<3/t/h 382,50 405 4,5 157,5 517,5 4117,5 23,4 0,765 0,63 112500 3082,5
61

Data gathering and impact assessment for a possible technical review of the IPPC Directive – Part 2
Fact sheet C2-Waste Incineration
Table J.2 - Estimated annual emissions (in tonnes) from the incineration of industrial wastesCompound
Country SO2 NOx NM VOC PAH CO HCl Pb Cu Cd Mn Zn Co As Cr Ni Hg
Austria 7.7 275 814 0.0022 13.75 11.55 3.85 0.33 0.33 0.044 2.31 0.033 0.0055 0.033 0.011 0.33Belgium 9.8 350 1036 0.0028 17.5 14.7 4.9 0.42 0.42 0.056 2.94 0.042 0.007 0.042 0.014 0.42Denmark 7 250 740 0.002 12.5 10.5 3.5 0.3 0,3 0.04 2.1 0.03 0.005 0.03 0.01 0.3Finland 7 250 740 0.002 12.5 10.5 3.5 0.3 03 0.04 2.1 0.03 0.005 0.03 0.01 0.3France 53.9 1925 5698 0.0154 96.25 80.85 26.95 2.31 2.31 0.308 16.17 0.231 0.0385 0.231 0.077 2.31Germany 59.5 2125 6290 0.017 106.25 89.25 29.75 2.55 2.55 0.34 17.85 0.255 0.0425 0.255 0.085 2.55Greece 0 0 0 0 0 0 0 0 0 0 0 0 0 0 0 0Ireland 2.1 75 222 0.0006 3.75 3.15 1.05 0.09 0.09 0.012 0.63 0.009 0.0015 0.009 0.003 0.09Italy 0 0 0 0 0 0 0 0 0 0 0 0 0 0 0 0Luxembourg 0 0 0 0 0 0 0 0 0 0 0 0 0 0 0 0Portugal 0 0 0 0 0 0 0 0 0 0 0 0 0 0 0 0Spain 2.1 75 222 0.0006 3.75 3.15 1.05 0.09 0.09 0.012 0.63 0.009 0.0015 0.009 0.003 0.09Sweden 7 250 740 0.002 12.5 10.5 3.5 0.3 0.3 0.04 2.1 0.03 0.005 0.03 0.01 0.3Netherlands 19.6 700 2072 0.0056 35 29.4 9.8 0.84 0.84 0.112 5.88 0.084 0.014 0.084 0.028 0.84United Kingdom 16.8 600 1776 0.0048 30 25.2 8.4 0.72 0.72 0.096 5.04 0.072 0.012 0.072 0.024 0.72Total 192.5 6875 20350 0.055 343.75 288.75 96.25 8.25 8.25 1.1 57.75 0.825 0.1375 0.825 0.275 8.25Source: modified from [CORINAIR, 2006] and [EC, 2006].
VITO and BIO, with Institute for European Environmental Policy and IVM 62

Data gathering and impact assessment for a possible technical review of the IPPC Directive – Part 2
Fact sheet C2-Waste Incineration
Annex K: Calculation of environmental impacts for waste incineration
This annex gives detailed explanations about the calculation of environmental impacts (or ‘impact category indicators’) and characterisation factors used in such calculations.
Environmental impacts quantifiedEmissions from waste derived fuel production can result in different environmental impacts. The following table show the contribution of the pollutants quantified in this factsheet to these impacts.
Impact Contributing pollutants among those quantified in this factsheet MSW Industrial waste
Global warming CO2 CO2Human toxicity Cd, HCl, Pb, Hg, NOx,
PM2.5, PM10, SO2As, Cd, Cr, Co, Cu, HCl, Pb, Hg, Ni, NOx, PAH, SO2, Zn
Fresh water aquatic ecotoxicity Cd, Pb, Hg As, Cd, Co, Cu, Pb, Hg, Ni, PAH, Zn
Freshwater sedimental ecotoxicity Cd, Pb, Hg As, Cd, Co, Cu, Pb, Hg, Ni, PAH, Zn
Terrestrial ecotoxicity Cd, Pb, Hg As, Cd, Co, Cu, Pb, Hg, Ni, PAH, Zn
Photochemical oxidation CO, NOx, NMVOC CO, NOx, NMVOCAcidification NOx, SO2 NOx, SO2
Eutrophication NOx NOx
Global Warming
Global Warming is defined here as the impact of human missions on the radiative forcing of the atmosphere. This may in turn have adverse impacts on ecosystem health, human health and material welfare. Most of these emissions enhance radiative forcing, causing the temperature at the earth’s surface to rise. This is popularly referred to as the ‘greenhouse effect’. The areas of protection are human health, the natural environment and the man-made environment.
impact category climate changeLCI results emission of greenhouse gas to the air (in kg)characterisation model the model developed by the Intergovernmental Panel on Climate
Change (IPCC) defining the global warming potential of different greenhouse gases
category indicator infrared radiative forcing (W/m²)characterisation factor global warming potential for a 100-year time horizon (GWP100) for
each greenhouse gas emission to the air (in kg carbon dioxide equivalent/kg emission)
unit of indicator result kg (carbon dioxide equivalent)
Human toxicity
VITO and BIO, with Institute for European Environmental Policy and IVM 63

Data gathering and impact assessment for a possible technical review of the IPPC Directive – Part 2
Fact sheet C2-Waste Incineration
This impact category covers the impacts on human health of toxic substances present in the environment. The health risks of exposure in the workplace are also sometimes included in LCA. These latter risks are often included in a wider impact category encompassing more than exposure to toxic substances (e.g. accident at work). In this Guide, no further consideration is given to the impacts of exposure to toxic substances in the work place. The area of protection for this impact category is human health. Notice that the discussion on characterisation of toxic-related impact categories is far from settled.
impact category human toxicityLCI results emissions of toxic substances to air, water and soil (kg)characterisation model USES 2.0 model developed at RIVM, describing fate, exposure and
effects of toxic substances, adapted to LCAcategory indicator acceptable daily intake / predicted daily intakecharacterisation factor human toxicity potential for each emission of a toxic substance to air,
water and/or soil (in kg 1,4-dichlorobenzene equivalent/kg emission)unit of indicator result kg (1,4-dichlorobenzene equivalent)
Ecotoxicity
This impact category covers the impact of toxic substances on aquatic, terrestrial and sediment ecosystems. The area of protection is the natural environment. Notice that discussions on characterisation of ecotoxicity-related impacts are far from settled.
Fresh water aquatic ecotoxicity
impact category fresh water aquatic ecotoxicityLCI results emissions of toxic substances to air, water and soil (kg)characterisation model USES 2.0 model developed at RIVM, describing fate, exposure and
effects of toxic substances, adapted to LCAcategory indicator predicted environmental concentration/predicted no-effect
concentrationcharacterisation factor fresh water aquatic ecotoxicity potential for each emission of a toxic
substance to air, water and/or soil (in kg 1,4-dichlorobenzene equivalent/kg emission)
unit of indicator result kg (1,4-dichlorobenzene equivalent)
Terrestrial ecotoxicity
impact category terrestrial ecotoxicityLCI results emissions of toxic substances to air, water and soil (kg)characterisation model USES 2.0 model developed at RIVM, describing fate, exposure and
effects of toxic substances, adapted to LCAcategory indicator predicted environmental concentration/predicted no-effect
concentrationcharacterisation factor terrestrial ecotoxicity potential for each emission of a toxic substance
to air, water and/or soil (in kg 1,4-dichlorobenzene equivalent/kg emission)
VITO and BIO, with Institute for European Environmental Policy and IVM 64

Data gathering and impact assessment for a possible technical review of the IPPC Directive – Part 2
Fact sheet C2-Waste Incineration
unit of indicator result kg (1,4-dichlorobenzene equivalent)
Fresh water sedimental ecotoxicity
impact category fresh water sedimental ecotoxicityLCI results emissions of toxic substances to air, water and soil (kg)characterisation model USES 2.0 model developed at RIVM, describing fate, exposure and
effects of toxic substances, adapted to LCAcategory indicator predicted environmental concentration/predicted no-effect
concentrationcharacterisation factor fresh water sedimental ecotoxicity potential for each emission of a
toxic substance to air, water and/or soil (in kg 1,4-dichlorobenzene equivalent/kg emission)
unit of indicator result kg (1,4-dichlorobenzene equivalent)
Photochemical oxidationPhotochemical pollution is formed from emissions of nitrogen oxides (NOx) and of volatile organic compounds (VOCs) and carbon monoxide (CO) in the presence of sunlight. Emissions of NO x are responsible for much of the ozone formation occurring in rural areas. In more densely populated regions, in particular close to cities, ozone formation is enhanced by VOC emissions. VOCs are mainly released from road traffic and the use of products containing organic solvents. The freshly emitted pollutants mix with other pollutants, including ozone, present in background air, and a complicated process of chemical reactions and continuous dilution takes place.
Exposure to ozone induces effects on health and the environment,causing respiratory difficulties in sensitive people and possible damage to vegetation and ecosystems22.
impact category photo-oxidant formationLCI results emissions of substances (NOx, VOC, CO) to air (kg)characterisation model UNECE trajectory modelcategory indicator tropospheric ozone formationcharacterisation factor photochemical ozone creation potential for each emission of NOx,
VOC or CO to the air (in kg ethylene equivalent/kg emission)unit of indicator result kg (ethylene equivalent)
Acidification
In order to describe the acidifying effect of substances, their acid formation potential (ability to form H+ ions) is calculated and set against a reference substance, SO2.
22 EEA(1998) - Tropospheric Ozone in EU - The consolidated report
VITO and BIO, with Institute for European Environmental Policy and IVM 65

Data gathering and impact assessment for a possible technical review of the IPPC Directive – Part 2
Fact sheet C2-Waste Incineration
impact category acidificationLCI results emissions of acidifying substances to the air (kg)characterisation model RAINS10 model, developed at IIASA, describing the fate and
deposition of acidifying substances, adapted to LCAcategory indicator deposition/acidification critical loadcharacterisation factor acidification potential for each acidifying emission to the air (in kg
SO2 equivalent/kg emission)unit of indicator result kg (SO2 equivalent)
Eutrophication
Additional input of plant nutrients into water can bring about excessive growth of water weeds (phytobenthon), free-floating plant organisms (phytoplankton) and higher plant forms (macrophytes). This does not only represent a change in the stock of a species, but also in the balance between species. Due to the increased generation of biomass and the consequently heavier sedimentation of dead organic material, the oxygen dissolved in deep water is consumed faster, through aerobic decomposition. This can lead to serious damage in the biological populations inhabiting the sediment. In addition to this, direct toxic effects on higher organisms, including humans must be taken into account when certain species of algae appear in mass.
While phosphorus determines the degree of eutrophic activity in the majority of cases in the limbic area, in marine and terrestrial ecosystems nitrogen is most often the decisive factor.
impact category eutrophicationLCI results emissions of nutrients to air, water and soil (kg)characterisation model the stoichiometric procedure, which identifies the equivalence
between N and P for both terrestrial and aquatic system.category indicator deposition/N/P equivalent in biomasscharacterisation factor eutrophication potential for each eutrophying emission to air, water
and soil (in kg PO4 equivalent/kg emission)unit of indicator result kg (PO4 equivalent)
Impact indicators unit and characterisation factorsAs an example, let’s consider CO2 and CH4: when released in air, both contribute to global warming but, over a time span of 100 years, one gram of CH4 released in air contributes 23 times more than one gram of CO2. Thus a “characterisation factor” of 23 can be used to estimate the relative contribution of CH4 to global warming compare to CO2 with a characterisation factor of 1. The characterisation factors used in the following are the characterisation factors developed by CML (Institute of Environmental Science, University of Leiden, NL), as commonly used by LCA experts.
For this purpose, one common unit has been defined for each environmental impact as shown in the following table.Impact UnitGlobal warming Mt CO2 eqHuman toxicity Mt 1,4-DB* eqFresh water aquatic ecotoxicity Mt 1,4-DB* eq
VITO and BIO, with Institute for European Environmental Policy and IVM 66

Data gathering and impact assessment for a possible technical review of the IPPC Directive – Part 2
Fact sheet C2-Waste Incineration
Freshwater sedimental ecotoxicity Mt 1,4-DB* eqTerrestrial ecotoxicity Mt 1,4-DB* eqPhotochemical oxidation Mt C2H4 eqAcidification Mt SO2 eqEutrophication Mt PO4 eq*DB: dichlorobenzene
Thus, continuing with global warming, all emissions contributing to global warming will be expressed in CO2 equivalent, and the same applies for the other indicators.Finally, the global impact indicator will be computed with the following formula:
where c: impact categorys: substance emittedIRc: indicator result for impact category cCFcs: characterisation factor that connect intervention s with impact category cms: mass of substance s emitted.
Characterisation factors used in this factsheet are listed below.
Global warming
Human toxicity
Fresh water
aquatic ecotoxici
ty
Freshwater
sedimental
ecotoxicity
Terrestrial
ecotoxicity
Photo-chemical oxidation
Acidifi-cation
Eutrophi-cation
Air emissions
kg CO2 eq
kg 1,4-DB eq
kg 1,4-DB eq
kg 1,4-DB eq
kg 1,4-DB eq
kg C2H4 eq
kg SO2 eq
kg PO4 eq
1 kg As 348000.00
49.50 126.65 1610
1 kg Cd 145000.00
289.00 741.95 81.2 0.13
1 kg CO 0.0271 kg CO2 11 kg Cr 647.001 kg Co 17500.00 639.00 1057.92 1091 kg Cu 4300.00 222.00 555.14 6.991 kg PCDD1 kg HCl 0.501 kg Pb 467.00 2.40 6.15 15.71 kg Mn1 kg Hg 6010.00 317.00 812.11 283001 kg Ni 35000.00 629.00 1609.48 1161 kg NOx 1.20 0.95 0.5 0.13
VITO and BIO, with Institute for European Environmental Policy and IVM 67

Data gathering and impact assessment for a possible technical review of the IPPC Directive – Part 2
Fact sheet C2-Waste Incineration
1 kg NMVOC
0.21
1 kg PAH 572000.00
172.00 556.40 1.02
1 kg PM2.5
0.82
1 kg PM10
0.82
1 kg SO2 0.10 1.21 kg Zn 104.00 17.80 45.59 12
Quantified environmental impacts Environmental impacts caused by preparation of waste derived fuel are quantified following the methodology described here above and are summarised in the following table:
Impact Unit Environmental impactMSW Industrial waste
Global warming kt CO2 eq 18 680 1 141Human toxicity kt 1,4-DB eq 26 137 1 445Fresh water aquatic ecotoxicity
kt 1,4-DB eq 95 9
Freshwater sedimental ecotoxicity
kt 1,4-DB eq 245 22
Terrestrial ecotoxicity kt 1,4-DB eq 3 653 237Photochemical oxidation kt C2H4 eq 78 11Acidification kt SO2 eq 132 4Eutrophication kt PO4 eq 11 1
Scale of magnitude: comparison with the EU-25 annual activityThe environmental impact indicators quantified here above use different measurement units (reminded in 1st column in the table below). To illustrate their relative scale of magnitude, a common unit is used: European per capita contribution to a specific impact. The idea is, for each impact, to assess the number of European citizens who generate an impact equivalent to waste incineration (3 rd
and 5th columns). For that, the impacts generated by one European citizen are used as reference data (2nd column)23. The 4th and 6th columns give, for each impact, the proportion that waste incineration represent compared to total EU activity impacts.This method allows attributing relative importance to the different environmental impact indicators quantified.
Unit Average impacts of
MSW treatment Waste oils treatmentImpacts Number of Impacts Number of
23 European equivalent is the total Eu25 activity for one year divided by the European population (population in 2004: 458 973 000 – Source: Eurostat)
VITO and BIO, with Institute for European Environmental Policy and IVM 68

Data gathering and impact assessment for a possible technical review of the IPPC Directive – Part 2
Fact sheet C2-Waste Incineration
one European
European citizen
European citizen
a b b/a c c/aGlobal warming kt CO2 eq 9 18 680 2 076 1 141 127
Photochemical oxidation kt C2H4 eq 1.50E-05
78 5 200 952 11 720 935
Acidification kt SO2 eq 4.50E-05 132 2 940 934
4 81 522
Eutrophication kt PO4 eq 7.00E-06 11 1 504 764
1 127 679
Remark: the same study cannot be applied to toxicity impacts (human toxicity, freshwater toxicity, etc.) because the IPP Study doesn’t quantify particulate matter emissions.
VITO and BIO, with Institute for European Environmental Policy and IVM 69

Data gathering and impact assessment for a possible technical review of the IPPC Directive – Part 2
Fact sheet C2-Waste Incineration
Annex L: Best Available Techniques for Incineration
The BAT conclusions drawn in this chapter are taken from the European BAT Reference Document “BAT for Waste Incineration”.
BAT for Site Selection
For waste incineration, the local factors to be taken into account may, amongst others, generally include:
o local environmental drivers e.g. background environmental quality may influence the required local performance in respect of releases from the installation, or availability of certain resources
o the particular nature of the waste(s) that arise locally and the impact of the waste management infrastructure upon the type and nature of waste arriving at the installation
o the cost and technical possibility of implementing a particular technique in relation to its potential advantages – this is of particular relevance when considering the performance of existing installations
o the availability, degree of utilisation and price of options for the recovery / disposal of residues produced at the installation
o the availability of users and price received for recovered energyo local economic / market / political factors that may influence the tolerability of the higher gate
fees that may accompany the addition of certain technological options
Bat for Waste input and control
o the maintenance of the site in a generally tidy and clean state,o to establish and maintain quality controls over the waste input, according to the types of waste
that may be received at the installation. This includes: - establishing process input limitations and identifying key risks, and
- communication with waste suppliers to improve incoming waste quality control, and
- controlling waste feed quality on the incinerator site, and
- checking sampling and testing incoming wastes, and
- detectors for radioactive materials.
Bat for Combustion techniques
Optimal burn conditions involve:
Mixing of fuel and air to minimize the existence of long-lived, fuel-rich pockets of combustion products;
VITO and BIO, with Institute for European Environmental Policy and IVM 70

Data gathering and impact assessment for a possible technical review of the IPPC Directive – Part 2
Fact sheet C2-Waste Incineration
Attainment of sufficiently high temperatures in the presence of oxygen for the destruction of hydrocarbon species;
Prevention of quench zones or low-temperature pathways that will allow partially reacted fuel to exit the combustion chamber.
Proper management of time, temperature and turbulence (the “3 Ts”), as well as oxygen (air flow), by means of incinerator design and operation will help to ensure the above conditions. The recommended residence time of waste in the primary furnace is 2 seconds. Temperatures at or above 850 °C (for waste with a high chlorine content: above 1.100 °C) are required for complete combustion in most technologies. Turbulence, through the mixing of fuel and air, helps prevent cold spots in the burn chamber and the build-up of carbon, which can reduce combustion efficiency. Oxygen levels in the final combustion zone must be maintained above those necessary for complete oxidation.
General combustion techniques
1. Ensure design of furnace is appropriately matched to characteristics of the waste to be processed.
2. Maintain temperatures in the gas phase combustion zones in the optimal range for completing oxidation of the waste (for example, 850º–950º C in grated municipal solid waste incinerators, 1,000º–1,200°C when chlorine content of waste is high).
3. Provide for sufficient residence time (for example, 2 seconds) and turbulent mixing in the combustion chamber(s) to complete incineration.
4. Preheat primary and secondary air to assist combustion.
5. Use continuous rather than batch processing wherever possible to minimize start-up and shutdown releases.
6. Establish systems to monitor critical combustion parameters, including grate speed and temperature, pressure drop and levels of CO, CO2 and O2.
7. Provide for control interventions to adjust waste feed, grate speed, and temperature, volume and distribution of primary and secondary air.
8. Install automatic auxiliary burners to maintain optimal temperatures in the combustion chamber(s).
9. Use air from bunker and storage facilities as combustion air.
10. Install system which automatically stops waste feeding when optimum temperature is not reached.
Municipal solid waste incineration techniques
1. Mass burn (moving grate) incinerators are well demonstrated in the combustion of heterogeneous municipal solid waste and have a long operational history.
2. Water-cooled grated incinerators have the added advantages of better combustion control and the ability to process municipal solid waste with higher heat content.
VITO and BIO, with Institute for European Environmental Policy and IVM 71

Data gathering and impact assessment for a possible technical review of the IPPC Directive – Part 2
Fact sheet C2-Waste Incineration
3. Rotary kilns with grates can accept heterogeneous municipal solid waste but a lower throughput than the mass burn or moving grate furnaces.
4. Static grated furnaces with transport systems (for example, rams) have fewer moving parts but waste may require more pretreatment (i.e., shredding, separation).
5. Modular designs with secondary combustion chambers are well demonstrated for smaller applications. Depending on size, some of these units may require batch operation.
6. Fluidized bed furnaces and spreader/stoker furnaces are well demonstrated for finely divided, consistent wastes such as refuse-derived fuel.
Hazardous waste incineration techniques
1. Rotary kilns are well demonstrated for the incineration of hazardous waste and can accept liquids and pastes as well as solids.
2. Water-cooled kilns can be operated at higher temperatures and allow acceptance of wastes with higher energy values.
3. Care should be taken to avoid formation of chemicals listed in Annex C in waste heat recovery boilers. Such boilers should be avoided unless facilities are prepared to include PCDD/PCDF control (for example, activated carbon injection/adsorption).
4. Waste consistency (and combustion) can be improved by shredding drums and other packaged hazardous wastes.
5. A feed equalization system (for example, screw conveyors that can crush and provide a constant amount of solid hazardous waste to the furnace) will help ensure a continuous, controlled feed to the kiln and maintenance of uniform combustion conditions.
Sewage sludge incineration techniques
1. Fluidized bed incinerators are well demonstrated for thermal treatment of sewage sludge.
2. Circulating fluid bed furnaces allow greater fuel flexibility than bubbling beds, but require cyclones to conserve bed material.
3. Care must be exercised with bubbling bed units to avoid clogging.
4. The use of heat recovered from the process to aid sludge drying will reduce the need for auxiliary fuel.
5. Supply technologies are important in the co-incineration of sewage sludge in municipal solid waste incinerators. Demonstrated techniques include: dried sludge blown in as dust; drained sludge supplied through sprinklers and distributed and mixed on the grate; and drained or dried sludge mixed with municipal solid waste and fed together (European Commission 2005).
VITO and BIO, with Institute for European Environmental Policy and IVM 72

Data gathering and impact assessment for a possible technical review of the IPPC Directive – Part 2
Fact sheet C2-Waste Incineration
Bat for Flue gas treatment
The type and order of treatment processes applied to the flue gases once they leave the incineration chamber is important, both for optimal operation of the devices and for the overall cost-effectiveness of the installation. Waste incineration parameters that affect the selection of techniques include: waste type, composition, and variability; type of combustion process; flue gas flow and temperature; and the need for, and availability of, waste-water treatment. Choices must also consider whether flue gas components (for example, air pollution control device residues, fly ash) are to remain separate following collection or are to be remixed, since this will affect residue volume and recycling opportunities. The following treatment techniques have direct or indirect impacts on preventing the formation and minimizing the release of chemicals listed in Annex C. Best available techniques involve applying the most suitable combination of flue gas cleaning systems.
Dust (particulate matter) removal techniques
1. Dust removal from the flue gases is essential for all incinerator operations.
2. Electrostatic precipitators and fabric filters have demonstrated effectiveness as capture techniques for particulate matter in incinerator flue gases.
3. Cyclones and multicyclones are less efficient in dust removal and should only be used in a pre-dedusting step to remove coarser particles from the flue gases and reduce dust loads on downstream treatment devices. Preseparation of coarse particles will decrease the amount of fly ash contaminated with high loads of persistent organic pollutants.
4. The collection efficiency of electrostatic precipitators is reduced as electrical resistivity of the dust increases. This may be a consideration in situations where waste composition varies rapidly (for example, hazardous waste incinerators).
5. Electrostatic precipitators and fabric filters should be operated below 200º C to minimize formation of PCDD/PCDF.
6. Wet electrostatic precipitators can capture very small particle sizes (< 1 mg/m3) but require effluent treatment and are usually employed following dedusting.
7. Fabric filters (bag filters) are widely applied in waste incineration and have the added advantage, when coupled with semi-dry sorbent injection (spray drying), of providing additional filtration and reactive surface on the filter cake.
8. Pressure drop across fabric filters and flue gas temperature (if a scrubbing system is used upstream) should be monitored to ensure filter cake is in place and bags are not leaking or being wetted. A bag leak detection system using a triboelectric detector represents one option for monitoring fabric filter performance.
9. Fabric filters are subject to water damage and corrosion and gas streams must be maintained above the dew point (130º–140º C) to prevent these effects. Some filter materials are more resistant to damage.
VITO and BIO, with Institute for European Environmental Policy and IVM 73

Data gathering and impact assessment for a possible technical review of the IPPC Directive – Part 2
Fact sheet C2-Waste Incineration
Acid gas removal techniques
1. Wet scrubbers have the highest removal efficiencies for soluble acid gases among the demonstrated techniques.
2. Pre-dedusting of the gas stream may be necessary to prevent clogging of the scrubber, unless scrubber capacity is sufficiently large.
3. The use of carbon-impregnated materials, activated carbon, or coke in scrubber packing materials can achieve a 70% reduction in PCDD/PCDF across the scrubber but this may not be reflected in overall releases.
4. Spray dryers (semi-wet scrubbing) also provide high removal efficiencies and have the advantage of not requiring subsequent effluent treatment. In addition to the alkaline reagents added for acid gas removal, activated carbon injection is also effective in removing PCDD/PCDF as well as mercury. Spray dry scrubbing systems also typically achieve 93% SO2 and 98% HCl control.
5. Spray dryers, as noted above, are often deployed upstream of fabric filters. The filters provide for capture of the reagents and reaction products as well as offering an additional reactive surface on the filter cake.
6. Inlet temperature to the fabric filter in such combinations is important. Temperatures above 130º–140º C are normally required to prevent condensation and corrosion of the bags.
7. Dry scrubbing systems cannot reach the efficiency of wet or semi-wet (spray dry) scrubbers without significantly increasing the amount of reagent/sorbent. Increased reagent use adds to the volume of fly ash.
Flue gas polishing techniques
1. Additional dust removal may be appropriate before cleaned flue gases are sent to the stack. Techniques for the polishing of flue gas include fabric filters, wet electrostatic precipitators and venturi scrubbers.
2. Double filtration (filters in series) can routinely achieve collection efficiencies for dust at or below 1 mg/m3.
3. The additional benefits of these techniques may be small, and the cost-effectiveness disproportionate, if effective upstream techniques are already being applied.
4. Flue gas polishing may have greatest utility at large installations and in further cleaning of gas streams prior to selective catalytic reduction.
Nitrogen oxides (NOx) removal techniques using a catalyst
1. Although the primary role of selective catalytic reduction is to reduce NO x emissions, this technique can also destroy gas phase such as PCDD/PCDF with an efficiency of 98–99.5%
2. Flue gases may have to be reheated to the 250º–400º C required for proper operation of the catalyst.
VITO and BIO, with Institute for European Environmental Policy and IVM 74

Data gathering and impact assessment for a possible technical review of the IPPC Directive – Part 2
Fact sheet C2-Waste Incineration
3. Performance of selective catalytic reduction systems improves with upstream flue gas polishing. These systems are installed after dedusting and acid gas removal.
4. The significant cost (capital and energy) of selective catalytic reduction is more easily borne by large facilities with higher gas flow rates and economies of scale.
Residue and solid waste management techniques
Wastes and residues from incineration include various types of ash (for example, bottom ash, boiler ash, fly ash), and residues from other flue gas treatment processes (such as gypsum from wet scrubbers), including liquid effluents in the case of wet scrubbing systems.
Dry and semi-wet scrubbers generally produce greater amounts of solid waste compared to wet scrubbers. Furthermore this waste can contain fly ash (if it is not separated efficiently), heavy metals (esp. mercury) and unreacted sorbent.
Because constituents of concern may vary considerably, maintaining the separation of residues for treatment, management and disposal is in general appropriate.
o Bottom and boiler ash treatment techniques
Bottom ash from incinerators designed and operated according to BAT tends to have a very low content of chemicals listed in Annex C, in the same order of magnitude as background concentrations in urban soils (i.e., < 0.001–0.01 ng PCDD/PCDF/g ash). Boiler ash levels tend to be higher (0.02–0.5 ng PCDD/PCDF/g ash) but both well below the average concentrations found in fly ash.
Because of the differences in pollutant concentration, the mixing of bottom ash with fly ash will contaminate the former and is forbidden in many countries to avoid that limit values for certain types of landfills are only met by dilution. Separate collection and storage of these residues provides operators with more options for disposal.
Bottom ash (or slag from fluidized bed incinerators) is disposed of in landfills in many countries but may be reused in construction and road-building material following pre-treatment. Prior to such use, however, an assessment of content and leachability should be conducted and upper levels of persistent organic pollutants, heavy metals and other parameters have to be defined.
Leachability of chemicals listed in Annex C is known to increase with increasing pH and humic (presence of organic matter) conditions. This would suggest that disposal in lined and dedicated landfills is preferable to mixed waste facilities.
o Fly ash and other flue gas treatment residue techniques
Unlike bottom ash, air pollution control device residuals, including fly ash and scrubber sludges, contain relatively high concentrations of heavy metals, organic pollutants (including PCDD/PCDF), chlorides and sulphides.
Whenever bottom ash is to be further used (for example, as construction material) mixing with other flue gas treatment residues is not a best available technique.
Fly ash is disposed of in dedicated landfills in many countries. However, if limit values (e.g. for the heavy metal content or for the leaching behaviour) for these landfills are not met fly ash has to be treated before disposal or sent to underground disposal. Treatment techniques for fly ash and flue gas treatment residues include:
VITO and BIO, with Institute for European Environmental Policy and IVM 75
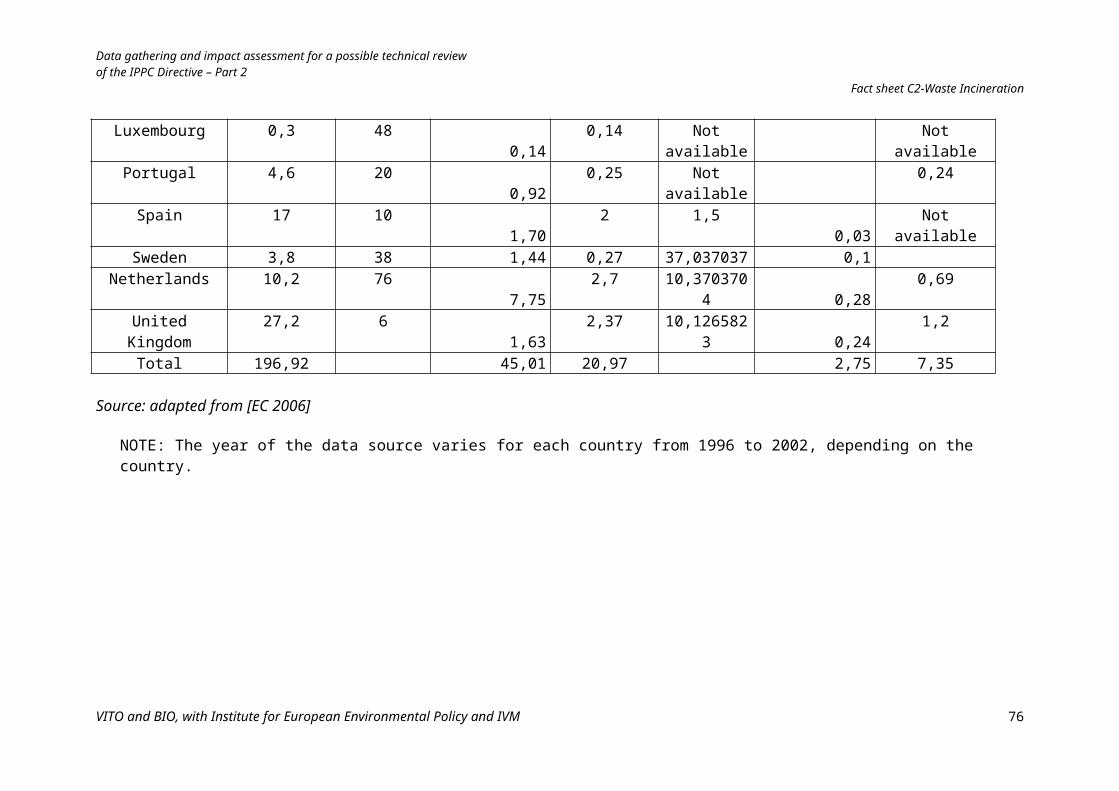
Data gathering and impact assessment for a possible technical review of the IPPC Directive – Part 2
Fact sheet C2-Waste Incineration
Cement solidification. Residues are mixed with mineral and hydraulic binders and additives to reduce leaching potential. Solidified ashes and flue gas treatment residues are landfilled;
Vitrification. Ashes and residues are heated in electrical melting to immobilize pollutants of concern. Organics, including PCDD/PCDF, are typically destroyed in the process;
Catalytic treatment of fabric filter dusts under conditions of low temperatures and lack of oxygen;
The application of plasma or similar high-temperature technologies.
It has to be mentioned that energy demand and costs for these treatment techniques may be high.
Bat for effluent treatment techniques
Process waste water in incineration arises mainly from the use of wet scrubbing technologies. The need for and treatment of waste water can be alleviated by the use of dry and semi-wet systems.One waste-water-free technique involves the neutralization and subsequent treatment of the scrubber effluent to produce sedimentation. The remaining waste water is evaporated and the sludge can be landfilled (dedicated) or further processed to recover gypsum and calcium chloride.Recirculation of process water also helps to reduce the volume for eventual treatment. Use of boiler drain water as scrubber feed may also reduce the total volume of process water and subsequent treatment capacity.Depending on the design of the incinerator, some effluent streams can be fed back through the process and any surviving pollutants concentrated in the solid rather than liquid residues.
VITO and BIO, with Institute for European Environmental Policy and IVM 76