· web viewe4035samples of environmental and social management plans (esmp) for sub-projects...
TRANSCRIPT

SAMPLES OF ENVIRONMENTAL AND SOCIAL MANAGEMENT PLANS (ESMP) FOR SUB-PROJECTS IMPLEMENTED UNDER THE AGRICULTURE SECTOR DEVELOPMENT PROJECT (ASDP)
I. CENTRAL ZONE
1. Kwamadebe Irrigation Scheme (Kondoa District Council)
No.
Identified Impact Enhancement/Mitigation Measures
Performance Indicator
Responsibility
Time frame Cost Estimate
A. Construction Phase1. Soil and ground water
pollutionMaintain fuel storage facilities and prevent accidental spillage, provide facilities for disposal of waste oils.
No. of monitoring tests done
Contractor, Kondoa District Council, RBWO
During the entire construction phase
-
2. Surface water pollution Contractor, Kondoa District Council, RBWO
During the entire construction phase
-
3. Increase in immigrants Use as much local labour as possible
Number of immigrants employed
Contractor/Kondoa District Council
During the entire construction phase
-
4. Disturbance to flora and fauna
Minimize land disturbance Number of acres of land disturbed
Contractor During the entire construction phase
-
B. Operation and
1
E4035

Maintenance Phase5. Increased incidence of
water related diseasesSiting of households away from irrigated areas, and better water management , disease control programmes.
Number of water borne diseases reported
Irrigators’ association, Kondoa District Council
During the entire O & M phase
-
6. Siltation at the intake Catchment conservation; training on soil and water conservation; good cultivation practices; regular flushing of silt loads
Number of farmers trained
Number of acres with erosion control measures
Kondoa District Council, Irrigators’ Organization
During the entire project life span
-
7. Water logging Proper farm levelling; proper water management
Number of acres waterlogged
Contractor & Irrigators Organization
Whenever need arises
-
8. Water pollution Control use of agro-chemicals and restricting their use near water courses; training of irrigators in use of agrochemicals; training on the use of IPM technologies
Number of farmers trained
Irrigators’ organization
During the entire O & M phase
-
9. Riverbank destabilization Enforcing bylaws; creation of a buffer zone.
Reduced cultivation along riverbank
Adherence to bylaws
Irrigators’ Organization’ Kondoa District Council
During the entire project life span
-
10. Conflicts among water users
Provision of livestock watering points
Number of cattle troughs
Contractor & Kondoa
During the entire O & M phase
-
2

Equitable allocation of water
Reduced number of water conflicts
District Council
1.A Environmental and Social Monitoring Plan
No Environmental Component to be
Monitored
Method of Monitoring and Sampling Area
Frequency
Verifiable indicator
Responsibility
1. Soil and ground water pollution
Periodic inspection Monthly Number of inspections
BWO/Extension Officers
2. Surface water pollution Periodic inspection Monthly Number of inspections
BWO/Extension Officers
3. Increase in immigrants Periodic inspection Quarterly Number of immigrants employed
Kondoa District Council
4. Disturbance to flora and fauna
Site visits Weekly Number of visits Contractor, Extension Officers
5. Increased incidence of water related diseases
Follow up in Health Facilities
Monthly Number of cases recorded
Kondoa District Council, Health Officers
6. Siltation at the intake Periodic Inspection Monthly Level of silt load Irrigators’ Organization7. Water logging Periodic Inspection Weekly Number of areas
affectedIrrigators’ Organization, Extension Officers
8. Water pollution Water analysis Monthly Number of water samples analyzed
BWO, Kondoa District Council
9. Riverbank destabilization Periodic Inspection Quarterly Riverbank area encroached
Irrigators’ Organization, Extension Officers
10. Conflicts among water Meetings, visits and Monthly Number of cases Irrigators’ Organization;
3

users interviews recorded Extension Officers
II. KILIMANJARO ZONE
2. Soko Irrigation Scheme (Moshi Rural District, Kilimanjaro)
NO
IDENTIFIED IMPACT
ENHANCEMENT/MITIGATION MEASURES
PERFORMANCE INDICATOR
RESPONSIBILITY
TIME FRAME
COST ESTIMATE
1. Increase of water borne diseases
Create awareness on water borne diseases to the Community
Prevention of water borne diseases
Use of by laws to protect water sources.
Number of water borne diseases reported in the health centre
Farmers, DFT/WFTField Extension OfficersMedical officers and legal officer
July 2012 – June 2015
8 Mill.
2. Incidences of bilharziasis
Training on control of bilharziasis
Improved drainage system Use of preventive medicines General cleaning of furrows
every season
Cleanliness of the furrow /Scheme every season
Number of bilharziasis cases
reported Number of farmers
trained
DED, Farmers, DFT, Extension Officers
July 2012 – June 2015
8 Mill.
3. Occurrence of soil erosion and Loss of soil fertility
Training farmers on soil and water conservation
Good farming practices e.g. mulching, use of cover crops, terracing and contour farming Use of different soil erosion
Number of farmers trained on soil erosion control measures
Number of hectares with erosion
Farmers, DFT/WFT, Extension Officers
July 2012 – June 2015
9 Mill.
4

NO
IDENTIFIED IMPACT
ENHANCEMENT/MITIGATION MEASURES
PERFORMANCE INDICATOR
RESPONSIBILITY
TIME FRAME
COST ESTIMATE
control measures control measures4. Conflicts
among water users
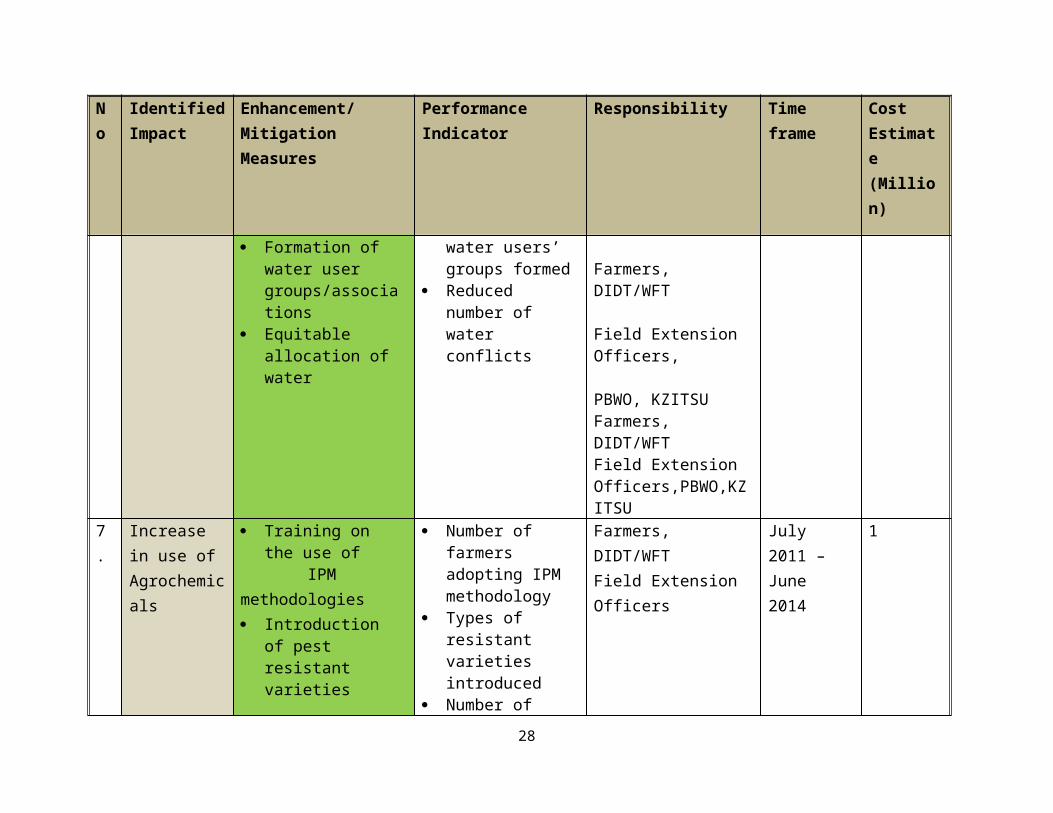
Formation of water user groups/associations in the catchments
Equitable allocation of water
Number of water users’ groups formed in the catchments
Reduced number of water conflicts
Farmers, DFT/WFT and Extension Officers
July 2012 – June 2015
5 Mill.
5. Increase in use of Agrochemicals
Training on the use of IPM methodologies
Number of farmers trained on IPM methodology
Number of farmers adopting IPM methodology
Farmers, DFT/WFTand Field Extension Officers
July 2012 – June 2015
3 Mill.
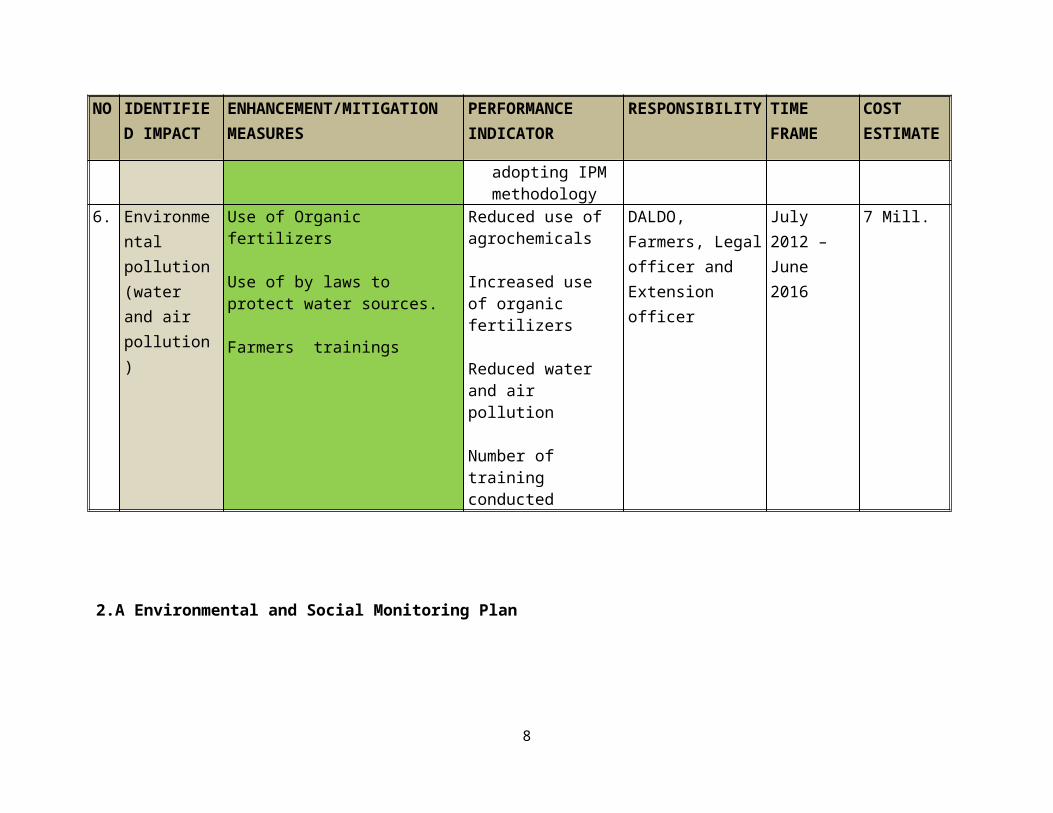
6. Environmental pollution (water and air pollution)
Use of Organic fertilizers
Use of by laws to protect water sources.
Farmers trainings
Reduced use of agrochemicals
Increased use of organic fertilizers
Reduced water and air pollution
Number of training conducted
DALDO, Farmers, Legal officer and Extension officer
July 2012 – June 2016
7 Mill.
2.A Environmental and Social Monitoring Plan
5

No Environmental Component to be Monitored
Method of Monitoring and Sampling Area
Frequency Verifiable indicator Responsibility
1. Increase of water borne diseases
Follow up in Health Centers
Quarterly Number of cases reported and recorded
Extension Officers , Farmers, Health Officers
2. Incidences of bilharziasis Follow up in Health Facilities
Monthly Number of cases recorded
Farmers, DFT/WFT, Extension Officers Farmers and Health Officers
3. Occurrence of soil erosion Periodic inspection Annually Number of inspections
Farmers, Extension Officers, Project Committee
4. Conflicts among water users Meetings, Visits and interviews
Monthly Number of cases reported
DFT/WFT ,Extension Officers ,VEOs, Project Committee and PBWO
5. Increase in use of Agrochemicals
Soil analysis, Interviews Annually Number of Soil samples analyzed
Farmers, DFT/WFT Extension Officers and Project Committee
6. Environmental pollution (water and air pollution)
Follow up in protection of water source
Annually Number of cases recorded
Farmers, DFT/WFT Extension Officers, Project Committee and Health Officers
3. Kimashuku Irrigation Scheme (HAI District Council)
6

No
Identified Impact
Enhancement/Mitigation Measures
Performance Indicator Responsibility Time frame COST ESTMATES
1. Increase in incidences of insects and pests
Training on Proper use of pesticides
Use of IPM methodologies Introduction of pest resistant varieties
Number of farmers trained and practicing the technology
Number of farmers adopting IPM methodology
Farmers, DFT/WFT
Field Extension Officers
July 2012 – June 2015
3,800,000/=
2. Increase of water borne diseases
Create awareness on water borne diseases to the Community
Prevention of water borne diseases
Number of water borne diseases reported
Farmers, DFT/WFT
Field Extension Officers
July 2012 – June 2015
2,500,000/=
3. Occurrence of soil erosion
Training on soil and` water conservation
Training on water management
Use of soil erosion control measures
Number of farmers trained
Number of farmers trained
Number of acres with erosion control measures
Farmers, DFT/WFT
Field Extension Officers
July 2012 – June 2015
3,500,000/=
4. Increase in cases of Malaria
Create awareness on the disease to the Community
Reduce water pondage
Number of malaria cases reported
Farmers, DFT/WFT
Field Extension Officers
July 2012 – June 2015
3,500,000/=
5. Increase in use of
Training on the use of Number of farmers adopting IPM
Farmers, July 2012 – 3,700,000/=
7
No
Identified Impact
Enhancement/Mitigation Measures
Performance Indicator Responsibility Time frame COST ESTMATES
Agrochemicals IPM methodologies
Introduction of pest resistant varieties
methodology Types of resistant
varieties introduced Number of acreage
planted resistant varieties
DFT/WFT
Field Extension Officers
June 2015
6. Conflicts among water users
Formation of water user association and irrigators Organization
Equitable allocation of water
Number of water users’ groups formed
Reduced number of water conflicts
Farmers, DFT/WFT
Field Extension Officers PBWO, KZITSU
July 2012 – June 2015
5,700,000/=
7 Reduced downstream water flows
Adherence to water permits directive
Volume of water abstracted
Farmers, DFT/WFT
Field Extension Officers, PBWO
July 2012 – June 2015
4,500,000/=
8. Population influx resulting into increased cases of HIV
Awareness creation on HIV/AIDS
Number of new HIV/AIDS Cases reported
Farmers, DFT/WFT
Field Extension Officers
July 2012 – June 2015
2,500,000/=
3.A Environmental and Social Monitoring Plan
8

9

No Environmental Component to be Monitored
Method of Monitoring and Sampling Area
Frequency Verifiable indicator Responsibility
1. Increase in incidences of insects and pests
Periodic inspection Weekly Number of inspections
DFT/WFT and Extension Officers, Project Committee
2. Increase of water borne diseases
Follow up in Health Facilities
Monthly Number of cases recorded
DFT/WFT and Extension Officers, Project Committee, Health Officers
3. Occurrence of soil erosion Periodic inspection Annually Number of inspections
DFT/WFT and Extension Officers, Project Committee,
4. Increase in cases of Malaria Follow up in Health Facilities
Monthly Number of cases recorded
DFT/WFT and Extension Officers ,Project Committee, Health Officers
5. Increase in use of Agrochemicals
Soil analysis, ,Interviews Annually Number of Soil samples analyzed
DFT/WFT and Extension Officers, Project Committee
6. Conflicts among water users Meetings, Visits and interviews
Monthly Number of cases recorded
DFT/WFT, Extension Officers, VEOs, Project Committee, PBWO, KZITSU
7. Reduced downstream water flows
Measurement of flows Annually Volume of water abstracted
DFT/WFT and Extension Officers, Project Committee, PBWO, KZITSU
8. Population influx resulting into increased cases of HIV
Follow up in Health Facilities, Interviews
Annually Number of cases recorded
DFT/WFT and Extension Officers, Project
10

4. MTAMBO IRRIGATION SCHEME (Same District Council)
No
Identified Impact
Enhancement/Mitigation Measures
Performance Indicator Responsibility Time frame COST ESTIMATES
1. Increase in soil salinity
Training on water management
Provision of drainage system
Monitoring of soil and
Water Use of cultural
practices (Use of farm yard manure/gypsum)
Number of farmers trained
Length of drains provided
Frequency of monitoring
Number of farmers using cultural practices
KZITSU/DIDT/WFT, Farmers, IO
Field Extension Officers
July 2011 – June 2014
-
2. Increase in incidences of insects pests
Training on Proper use of pesticides
Use of IPM methodologies Introduction of pest resistant varieties
Number of farmers trained and practicing the technology
Number of farmers adopting IPM methodology
Types of resistant varieties introduced
Number of acreage planted resistant varieties
Farmers, DIDT/WFT
Field Extension Officers
July 2011 – June 2014
-
3. Incidences of General cleaning of Cleanliness of the Farmers, DIDT/WFT July 2011 – -
11

No
Identified Impact
Enhancement/Mitigation Measures
Performance Indicator Responsibility Time frame COST ESTIMATES
bilharziasis furrows Biological control –
introduction of free range ducks
Use of preventive medicines
Training on control of bilharziasis
Improved drainage system
furrow /Scheme Number of farmers
keeping free range ducks
Number of bilharziasis cases
Number of farmers trained
Reduced Number of bilharziasis cases
Field Extension Officers
June 2014
4. Increase of water borne diseases
Create awareness on water borne diseases to the Community
Prevention of water borne diseases
Number of water borne diseases reported
Farmers, DFT/WFT
Field Extension Officers
July 2011 – June 2014
-
5. Occurrence of soil erosion
Training on soil and` water conservation
Training on water management
Use of soil erosion control measures
Number of farmers trained
Number of farmers trained
Number of acres with erosion control measures
KZITSU/DIDT/WFT, Farmers, IO, PBWO
Field Extension Officers
July 2011 – June 2014
-
6. Increase in Create awareness on Number of malaria Farmers, DIDT/WFT July 2011 – -
12

No
Identified Impact
Enhancement/Mitigation Measures
Performance Indicator Responsibility Time frame COST ESTIMATES
cases of Malaria
water borne diseases to the Community
Prevention of water borne diseases
cases reported
Field Extension Officers
June 2014
7. Conflicts among water users
Formation of water user groups/associations
Equitable allocation of water
Number of water users’ groups formed
Reduced number of water conflicts
KZITSU/DIDT/WFT, Farmers, IO, PBWO
Field Extension Officers
July 2011 – June 2014
-
8. Increase in use of Agrochemicals
Training on the use of IPM methodologies
Introduction of pest resistant varieties
Number of farmers adopting IPM methodology
Types of resistant varieties introduced
Number of acreage planted resistant varieties
Farmers, DIDT/WFT
Field Extension Officers
July 2011 – June 2014
-
9. Effects of chemicals to free grazing cattle
Training on the use of chemicals with low toxicity and IPM methodologies
Participatory land use planning to demarcate boundaries for farmers and livestock
Number of farmers adopting the methodologies
Reduced incidences of chemical effects to animals
Number of cattle troughs constructed
Farmers, DIDT/WFT
Field Extension Officers
Farmers, DIDT/WFT
July 2011 – June 2014
13

No
Identified Impact
Enhancement/Mitigation Measures
Performance Indicator Responsibility Time frame COST ESTIMATES
keepers Construction of cattle
troughs to facilitate domestic animals with watering points
Reduced number of cattles affected
Field Extension Officers
10 Reduced downstream water flows
Adherence to water permits directive
Volume of water abstracted
Farmers, DFT/WFT
Field Extension Officers, PBWO
July 2011 – June 2014
-
11.
Population influx resulting into increased cases of HIV
Awareness creation on HIV/AIDS
Number of new HIV/AIDS Cases reported
Farmers, DFT/WFT
Field Extension Officers
July 2011 – June 2014
-
14

4.A ENVIRONMENTAL AND SOCIAL MONITORING PLAN
No
Environmental Component to be Monitored
Method of Monitoring and Sampling Area
Frequency
Verifiable indicator
Responsibility
1. Increase in soil salinity Soil analysis, InterviewsPeriodic inspection
Quarterly Number of Soil samples analyzed Number of new soil salinity cases recorded
KZITSU/DIDT/WFT, Farmers, IO, PBWOField Extension OfficersProject Committee
2. Increase in incidences of insects pests
Periodic inspection Weekly Number of inspections
DIDT/WFT, IO, and Extension Officers, Project Committee,
3. Incidences of bilharziasis Follow up in Health Facilities
Monthly Number of cases recorded
DIDT/WFT, IO and Extension Officers, Project Committee, Health Officers
4.Increase of water borne diseases
Follow up in Health Facilities
Monthly Number of cases recorded
DIDT/WFT, IO, and Extension Officers, Project Committee, Health Officers
5. Occurrence of soil erosion Periodic inspection Annually Number of inspections
KZITSU/DIDT/WFT, Farmers,IO, PBWOField Extension OfficersProject Committee
6. Increase in cases of Malaria Follow up in Health Facilities
Monthly Number of cases recorded
DIDT/WFT, IO, and Extension Officers, Project Committee, Health Officers
7. Conflicts among water users Meetings, Visits and interviews
Monthly Number of cases recorded
KZITSU/DIDT/WFT, Farmers,IO, PBWO, Field Extension Officers, VEOs, Project Committee, PBWO
8. Increase in use of Soil analysis, Interviews Annually Number of Soil DIDT/WFT, IO and Extension
15

No
Environmental Component to be Monitored
Method of Monitoring and Sampling Area
Frequency
Verifiable indicator
Responsibility
Agrochemicals samples analyzed Officers, Project Committee,9. Effects of chemicals to free
grazing cattleInterviews of livestock keepers, Inspections
Monthly Number of cases recorded, Number of inspections.
DIDT/WFT, IO, and Extension Officers, Project Committee,
10.
Reduced downstream water flows
Measurement of flows Annually Volume of water abstracted
KZITSU/DIDT/WFT, Farmers,IO,PBWOField Extension OfficersProject Committee,
11.
Population influx resulting into increased cases of HIV
Follow up in Health Facilities, Interviews
Annually Number of cases recorded
DIDT/WFT,IO, and Extension Officers , Project Committee, Health Officers
5. Nsanya Irrigation Scheme (HAI District Council)
No
Identified Impact
Enhancement/Mitigation Measures
Performance Indicator Responsibility Time frame Cost Estimate (Million)
1 Reduced downstream water flows
Adherence to water permits directive
Construction of bypass spillway
Volume of water abstracted
Farmers, DIDT/WFT, Project CommitteeField Extension Officers, PBWO, KZITSU
July 2011 – June 2014
1
2. Occurrence of soil erosion and salinity
Lining of canal Training on soil and`
water conservation
Length of lined canal
Number of farmers
Farmers, KZITSU/ DIDT/WFTField Extension Officers
July 2011 – June 2014
1
16

No
Identified Impact
Enhancement/Mitigation Measures
Performance Indicator Responsibility Time frame Cost Estimate (Million)
Training on water management
Use of soil erosion control measures
trained Number of farmers
trained Number of acres
with erosion control measures
Farmers, DIDT/WFT, Project CommitteeField Extension OfficersFarmers, DIDT/WFT, Project Committee
3. Increase in incidences of insects pests
Training on Proper use of pesticides
Use of IPM methodologies Introduction of pest resistant varieties
Number of farmers trained and practicing the technology
Number of farmers adopting IPM methodology
Types of resistant varieties introduced
Number of acreage planted resistant varieties
Farmers, DIDT/WFT, Project CommitteeField Extension Officers
July 2011 – June 2014
1
4. Increase of water borne diseases
Create awareness on water borne diseases to the Community
Prevention of water borne diseases
Number of water borne diseases reported
Farmers, DIDT/WFTField Extension Officers
July 2011 – June 2014
1
5. Increase in cases of Malaria
Create awareness on water borne diseases to the Community
Prevention of water borne diseases
Number of malaria cases reported
Farmers, DIDT/WFTField Extension Officers
July 2011 – June 2014
1
17

No
Identified Impact
Enhancement/Mitigation Measures
Performance Indicator Responsibility Time frame Cost Estimate (Million)
6. Conflicts among water users
Construction of gated Intake weir and canal lining
Formation of water user groups/associations
Equitable allocation of water
Length of the canal and a functioning Intake weir
Number of water users’ groups formed
Reduced number of water conflicts
Farmers, DIDT/WFT
KZITSU, Project Committee
Farmers, DIDT/WFT
Field Extension Officers,
PBWO, KZITSUFarmers, DIDT/WFTField Extension Officers,PBWO,KZITSU
July 2011 – June 2014
1
7. Increase in use of Agrochemicals
Training on the use of IPM methodologies Introduction of pest
resistant varieties
Number of farmers adopting IPM methodology
Types of resistant varieties introduced
Number of acreage planted resistant varieties
Farmers, DIDT/WFTField Extension Officers
July 2011 – June 2014
1
8. Population influx resulting into increased cases of HIV
Awareness creation on HIV/AIDS
Number of new HIV/AIDS Cases reported
Farmers, DIDT/WFTField Extension Officers
July 2011 – June 2014
1
18

19

5.A Environmental and Social Monitoring Plan
20

No Environmental Component to be Monitored
Method of Monitoring and Sampling Area
Frequency Verifiable indicator Responsibility
1. Increase in incidences of insects and pests
Periodic inspection Weekly Number of inspections
DIDT/WFT and Extension Officers, Project Committee
2.Increase of water borne diseases
Follow up in Health Facilities
Monthly Number of cases recorded
DIDT/WFT and Extension Officers, Project Committee, Health Officers
3. Increase in soil salinity and soil erosion
Soil analysis, ,Interviews
Periodic inspection
Quarterly Number of Soil samples analyzedNumber of inspections
DIDT/WFT and Extension Officers, Project Committee, KZTSU
4. Increase in cases of Malaria Follow up in Health Facilities
Monthly Number of cases recorded
DIDT/WFT and Extension Officers, Project Committee, Health Officers
5. Conflicts among water users Meetings, Visits and interviews
Monthly Number of cases recorded
DIDT/WFT, Extension Officers VEOs, Project Committee, PBWO,KZITSU
6. Increase in use of Agrochemicals
Soil analysis, ,Interviews Annually Number of Soil samples analyzed
DIDT/WFT and Extension Officers ,Project Committee
7. Reduced downstream water flows
Measurement of flows Annually Volume of water abstracted
DIDT/WFT and Extension Officers ,Project Committee, PBWO,KZITSU
8. Population influx resulting Follow up in Health Annually Number of cases DIDT/WFT and Extension
21

6. Kikafu Chini Irrigation Scheme (HAI District Council)
No
Identified Impact
Enhancement/Mitigation Measures
Performance Indicator Responsibility Time frame Cost Estimate (Million)
1. Increase in incidences of pests
Training on Proper use of pesticides
Use of IPM methodologies Introduction of pest resistant varieties
Number of farmers trained and practicing the technology
Number of farmers adopting IPM methodology
Types of resistant varieties introduced
Number of acreage planted resistant varieties
Farmers, DFT/WFT
Field Extension Officers
July 2011 – June 2014
1
2. Incidences of bilharziasis
General cleaning of furrows
Biological control – introduction of free range ducks
Use of preventive medicines
Training on control of bilharziasis
Improved drainage system
Cleanliness of the furrow /Scheme
Number of farmers keeping free range ducks
Number of bilharziasis cases
Number of farmers trained
Reduced Number of bilharziasis cases
Farmers, DFT/WFT
Field Extension Officers
July 2011 – June 2014
1
3. Increase of water borne diseases
Create awareness on water borne diseases to the Community
Prevention of water
Number of water borne diseases reported
Farmers, DFT/WFT
Field Extension
July 2011 – June 2014
1
22

No
Identified Impact
Enhancement/Mitigation Measures
Performance Indicator Responsibility Time frame Cost Estimate (Million)
borne diseases Officers
4. Occurrence of soil erosion
Training on soil and` water conservation
Training on water management
Use of soil erosion control measures
Number of farmers trained
Reduced numbers of gullies trained
Number of acres with erosion control measures
Farmers, DFT/WFT
Field Extension Officers
July 2011 June 2014
1
5. Increase in cases of Malaria
Create awareness on water borne diseases to the Community
Prevention of water borne diseases
Number of malaria cases reported
Farmers, DFT/WFT
Field Extension Officers
July 2011 June 2014
1
6. Conflicts among water users
Formation of water user groups/associations
Equitable allocation of water
Number of water users’ groups formed
Reduced number of water conflicts
Farmers, DFT/WFT
Field Extension Officers
July 2011 June 2014
1
7. Increase in use of Agrochemicals
Training on the use of IPM methodologies
Introduction of pest resistant varieties
Number of farmers adopting IPM methodology
Types of resistant varieties introduced
Number of acreage planted resistant
Farmers, DFT/WFT
Field Extension Officers
July 2011 June 2014
1
23

No
Identified Impact
Enhancement/Mitigation Measures
Performance Indicator Responsibility Time frame Cost Estimate (Million)
varieties8. Reduced
downstream water flows
Adherence to water permits directive
Volume of water abstracted
Farmers, DFT/WFT
Field Extension Officers, PBWO
July 2011 – June 2014
1
9. Population influx resulting into increased cases of HIV
Awareness creation on HIV/AIDS
Number of new HIV/AIDS Cases reported
Farmers, DFT/WFT
Field Extension Officers
July 2011 – June 2014
1
6.A Environmental and Social Monitoring Plan
No Environmental Component to be Monitored
Method of Monitoring and Sampling Area
Frequency Verifiable indicator Responsibility
1. Increase in incidences of insects and pests
Periodic inspection Weekly Number of inspections
DFT/WFT and Extension Officers, Project Committee
2. Incidences of bilharziasis Follow up in Health Facilities
Monthly Number of cases recorded
DFT/WFT and Extension Officers, Project Committee, Health Officers
24

3.Increase of water borne diseases
Follow up in Health Facilities
Monthly Number of cases recorded
DFT/WFT and Extension Officers, Project Committee, Health Officers
4. Increase in soil salinity Soil analysis, ,Interviews Quarterly Number of Soil samples analyzed
DFT/WFT and Extension Officers, Project Committee
5. Occurrence of soil erosion Periodic inspection Annually Number of inspections
DFT/WFT and Extension Officers, Project Committee
6. Increase in cases of Malaria Follow up in Health Facilities
Monthly Number of cases recorded
DFT/WFT and Extension Officers, Project Committee, Health Officers
7. Conflicts among water users Meetings, Visits and interviews
Monthly Number of cases recorded
DFT/WFT, Extension Officers ,VEOs, Project Committee, PBWO
8. Increase in use of Agrochemicals
Soil analysis, ,Interviews Annually Number of Soil samples analyzed
DFT/WFT and Extension Officers, Project Committee
9. Reduced downstream water flows
Measurement of flows Annually Volume of water abstracted
DFT/WFT and Extension Officers, Project Committee
10. Population influx resulting into increased cases of HIV
Follow up in Health Facilities, Interviews
Annually Number of cases recorded
DFT/WFT and Extension Officers, Project Committee, Health Officers
25

7. Kimwangamao Irrigation Scheme (MOSHI District Council)
No Identified Impact Enhancement/Mitigation Measures
Performance Indicator
Responsibility Time frame Cost Estimate
1. Increase in incidences of pests
Training on Proper use of pesticides
Use of IPM methodologies Introduction of pest resistant varieties
Number of farmers trained and practicing the technology
Number of farmers adopting IPM methodology
Types of resistant varieties introduced
Number of acreage planted resistant varieties
Farmers, DFT/WFTField Extension Officers
July 2012 June 2015
7 mil
2. Loss of biodiversity
Planting trees/vegetation along the canalRetaining natural flow of water in the original drainageTo ensure implementation of existing environmental/forest laws
Village training
Presence of vegetation cover and trees along the canal
Continuous flow of water in the natural sources
Reduced illegal activities along water sources
DED, DALDO, DLaNRO Project committees Villagers,
July 2012 June 2015
8 mil
3. Environmental pollution (water and air pollution)
Adoption of IPM e.g. crop rotationUse of Organic fertilizers
Reduced use of agrochemicalsIncreased use of
DED, DALDOFarmers, project committees
July 2012 June 2015
7 mil
26

No Identified Impact Enhancement/Mitigation Measures
Performance Indicator
Responsibility Time frame Cost Estimate
Use of by laws to protect water sourcesVillage trainings
organic fertilizersReduced water and air pollution
4. Soil erosion and Loss of soil fertility
Good farming practices e.g. mulching, use of cover crops, terracing and contour farming, Village trainings
Reduced soil erosion DED, DALDOFarmers, project committees
July 2012 June 2015
6 mil
5. Increased area of cultivation
Training farmers on good farming practices and proper land use. Increase in use of modern technology in agriculture
Increase in productivity and income, increased in yield per unit area
DED, DALDo, Community, project committees
July 2012 June 2015
6.mil
6. Conflicts among water users
Formation of water user groups/associations
Equitable allocation of water
Number of water users’ groups formed
Reduced number of water conflicts
Farmers, DFT/WFTField Extension Officers
July 2012 – June 2015
6 mil
7. Increase in use of Agrochemicals
Training on the use of IPM methodologies Introduction of pest
resistant varieties
Number of farmers adopting IPM methodology
Types of resistant varieties introduced
Number of acreage planted resistant varieties
Farmers, DFT/WFTField Extension Officers
July 2012 – June 2015
6 mil
8. Reduced downstream water
Adherence to water permits directive
Volume of water abstracted
Farmers, DFT/WFT
July 2012 – June 2015
20 il
27
No Identified Impact Enhancement/Mitigation Measures
Performance Indicator
Responsibility Time frame Cost Estimate
flows Field Extension Officers, PBWO
9. Population influx resulting into increased cases of HIV
Awareness creation on HIV/AIDS
Number of new HIV/AIDS Cases reported
Farmers, DFT/WFTField Extension Officers
July 2012 – June 2015
7 mil
28

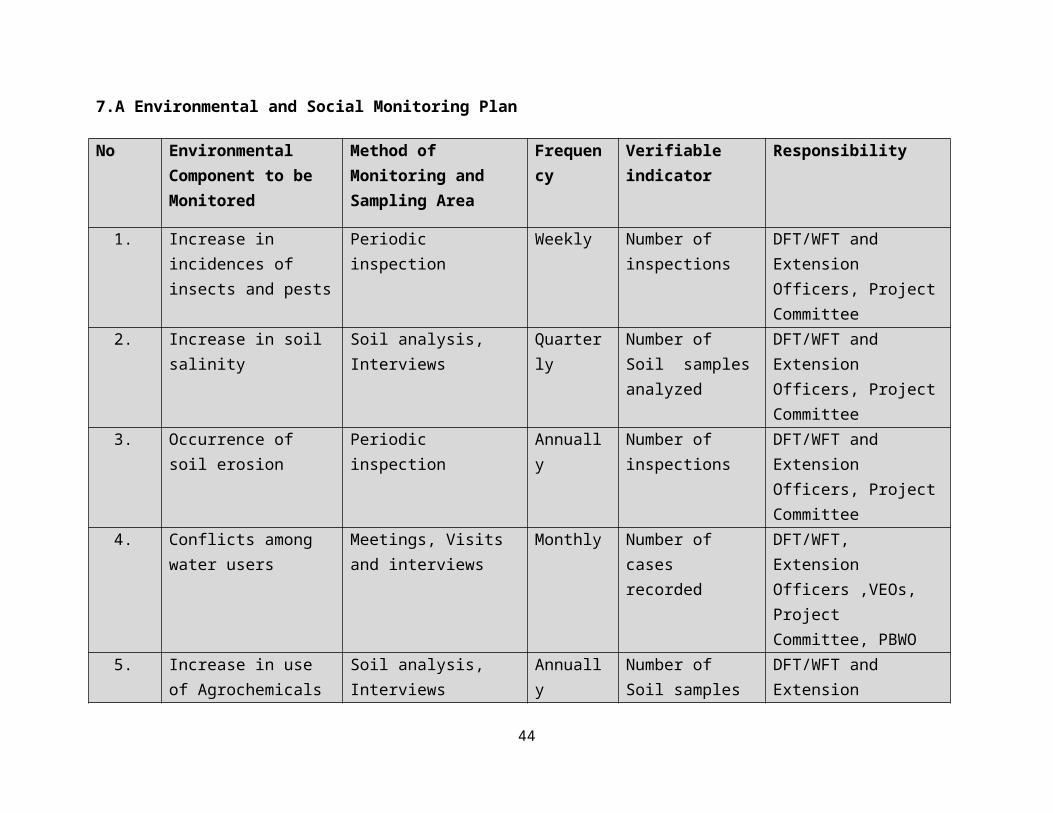
7.A Environmental and Social Monitoring Plan
No Environmental Component to be Monitored
Method of Monitoring and Sampling Area
Frequency Verifiable indicator
Responsibility
1. Increase in incidences of insects and pests
Periodic inspection Weekly Number of inspections
DFT/WFT and Extension Officers, Project Committee
2. Increase in soil salinity Soil analysis, Interviews Quarterly Number of Soil samples analyzed
DFT/WFT and Extension Officers, Project Committee
3. Occurrence of soil erosion
Periodic inspection Annually Number of inspections
DFT/WFT and Extension Officers, Project Committee
4. Conflicts among water users
Meetings, Visits and interviews
Monthly Number of cases recorded
DFT/WFT, Extension Officers ,VEOs, Project Committee, PBWO
5. Increase in use of Agrochemicals
Soil analysis, Interviews Annually Number of Soil samples analyzed
DFT/WFT and Extension Officers, Project Committee
6. Reduced downstream water flows
Measurement of flows Annually Volume of water abstracted
DFT/WFT and Extension Officers, Project Committee
7. Population influx resulting into increased cases of HIV
Follow up in Health Facilities, Interviews
Annually Number of cases recorded
DFT/WFT and Extension Officers, Project Committee, Health Officers
8. Vegetation Measuring vegetation cover along water sources
Every after Vegetation Cover DED, DLaNRO,
29

and the canal six months community9. Soil and water Soil and water PH and salt
analysis from the downstream water, and soil from the farm land
Every after six months
Soil and water salt content, PH
DED, DALDO, community
10. Farmers livelihood Increase in production of crops. Measuring the per Capital income in the project area
Each production season
Formers income, living standard.
DED, DALDO District Social Welfare Officer, Community
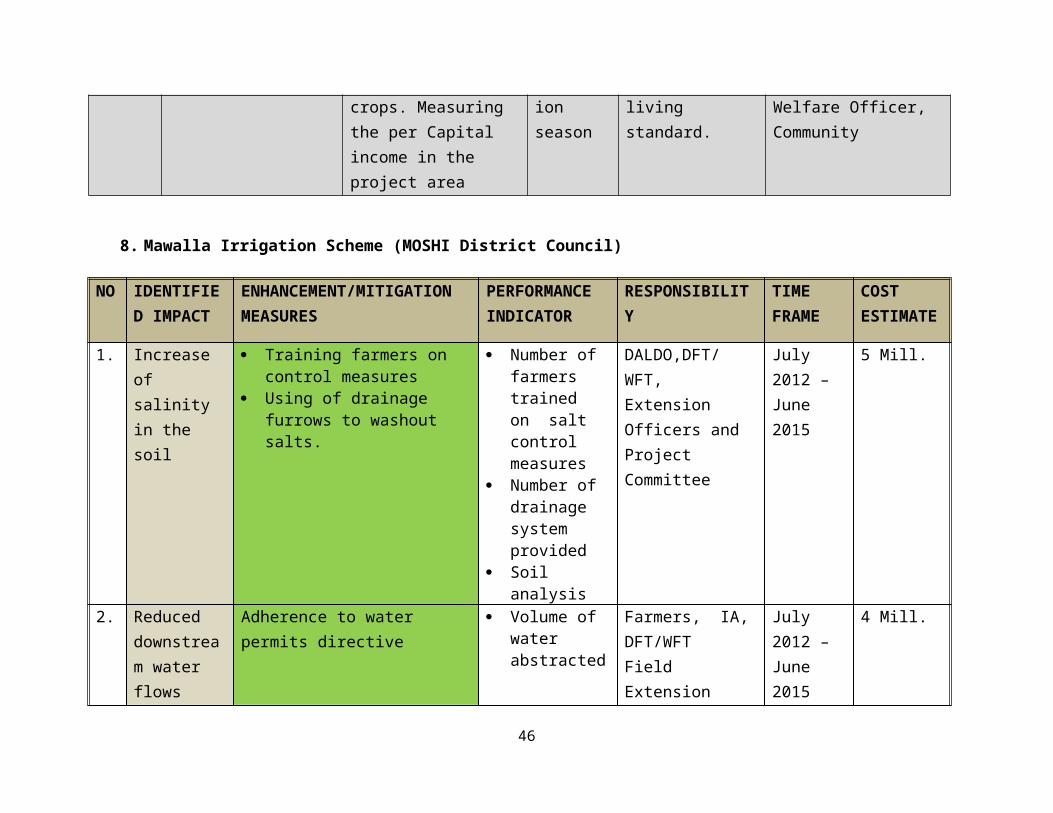
8. Mawalla Irrigation Scheme (MOSHI District Council)
NO
IDENTIFIED IMPACT
ENHANCEMENT/MITIGATION MEASURES
PERFORMANCE INDICATOR
RESPONSIBILITY
TIME FRAME
COST ESTIMATE
1. Increase of salinity in the soil
Training farmers on control measures
Using of drainage furrows to washout salts.
Number of farmers trained on salt control measures
Number of drainage system provided
Soil analysis
DALDO,DFT/WFT, Extension Officers and Project Committee
July 2012 – June 2015
5 Mill.
2. Reduced downstream water flows
Adherence to water permits directive
Volume of water abstracted
Farmers, IA, DFT/WFTField Extension Officers and PBWO
July 2012 – June 2015
4 Mill.
30

NO
IDENTIFIED IMPACT
ENHANCEMENT/MITIGATION MEASURES
PERFORMANCE INDICATOR
RESPONSIBILITY
TIME FRAME
COST ESTIMATE
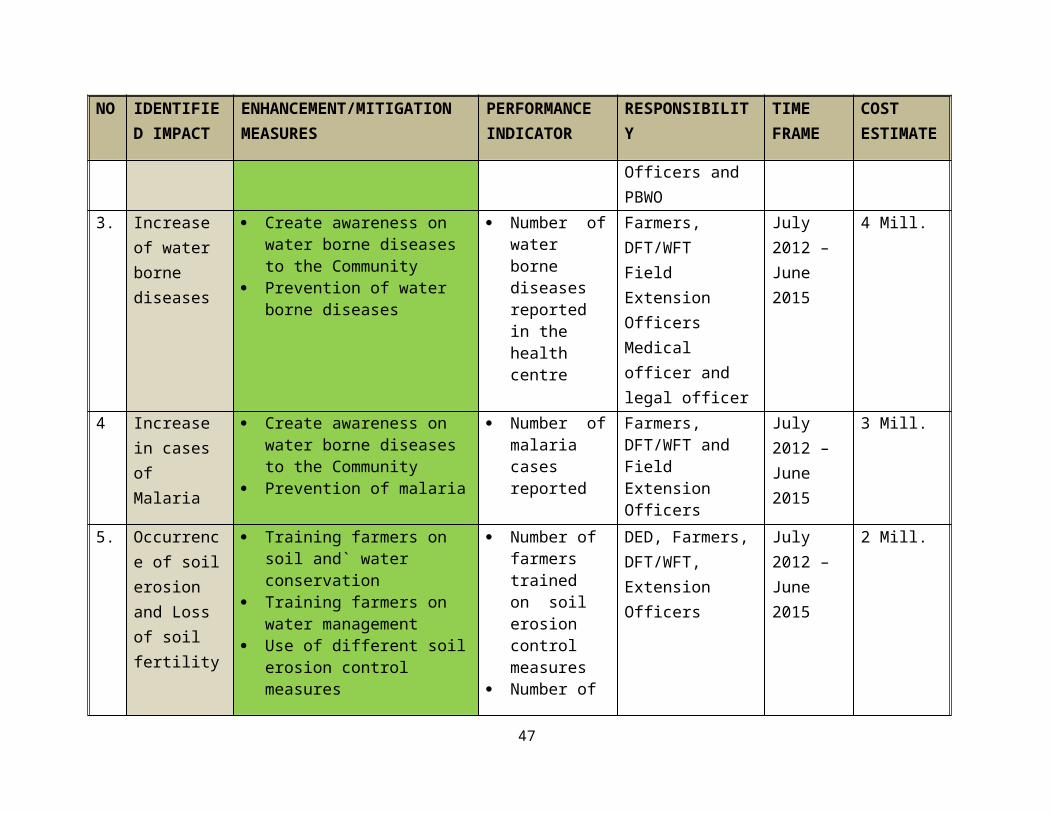
3. Increase of water borne diseases
Create awareness on water borne diseases to the Community
Prevention of water borne diseases
Number of water borne diseases reported in the health centre
Farmers, DFT/WFTField Extension OfficersMedical officer and legal officer
July 2012 – June 2015
4 Mill.
4 Increase in cases of Malaria
Create awareness on water borne diseases to the Community
Prevention of malaria
Number of malaria cases reported
Farmers, DFT/WFT andField Extension Officers
July 2012 – June 2015
3 Mill.
5. Occurrence of soil erosion and Loss of soil fertility
Training farmers on soil and` water conservation
Training farmers on water management
Use of different soil erosion control measures
Number of farmers trained on soil erosion control measures
Number of hectares with erosion control measures
DED, Farmers, DFT/WFT, Extension Officers
July 2012 – June 2015
2 Mill.
6. Conflicts among water users
Formation of water user groups/associations in the catchments
Equitable allocation of water between stakeholders
Number of water users’ groups formed in the catchments
Reduced number of water conflicts
Farmers, DFT/WFT
Extension Officers for the scheme
July 2012 – June 2015
6 Mill.
7. Environmenta Use of Organic fertilizers Reduced use of DALDO, Farmers, July 2012 4 Mill.
31

NO
IDENTIFIED IMPACT
ENHANCEMENT/MITIGATION MEASURES
PERFORMANCE INDICATOR
RESPONSIBILITY
TIME FRAME
COST ESTIMATE
l pollution (water and air pollution)
Use of by laws to protect water sources
Farmers trainings
agrochemicals.
Increased use of organic fertilizers
Reduced water and air pollution
Number of training conducted
Legal officer, Extension officer
– June 2016
8.A Environmental and Social Monitoring Plan
32

NO
ENVIRONMENTAL COMPONENT TO BE MONITORED
METHOD OF MONITORING AND SAMPLING AREA
FREQUENCY
VERIFIABLE INDICATOR
RESPONSIBILITY
1. Increase in soil salinity Soil analysis, Interviews Quarterly Number of Soil samples analyzed
Farmers, DFT, Extension Officers and Project Committee
2. Reduced downstream water flows
Measurement of flows Annually Volume of water abstracted
DFT/WFT, Extension Officers, Irrigators Association, PBWO and Farmers
3. Increase in cases of Malaria Follow up in Health Centers
Monthly Number of cases reported and recorded
DFT/WFT, Extension Officers, Project Committee and Health Officers
4. Increase of water borne diseases
Follow up in Health Centers
Monthly Number of cases recorded
DFT/WFT , Extension Officers, Project Committee and Health Officers
5. Occurrence of soil erosion Periodic inspection Annually Number of inspections
DFT/WFT and Extension Officers, Project Committee and farmers
6. Conflicts among water users Meetings, Visits and interviews
Monthly Number of cases reported and recorded
DFT/WFT ,Extension Officers ,VEOs, Project Committee and PBWO
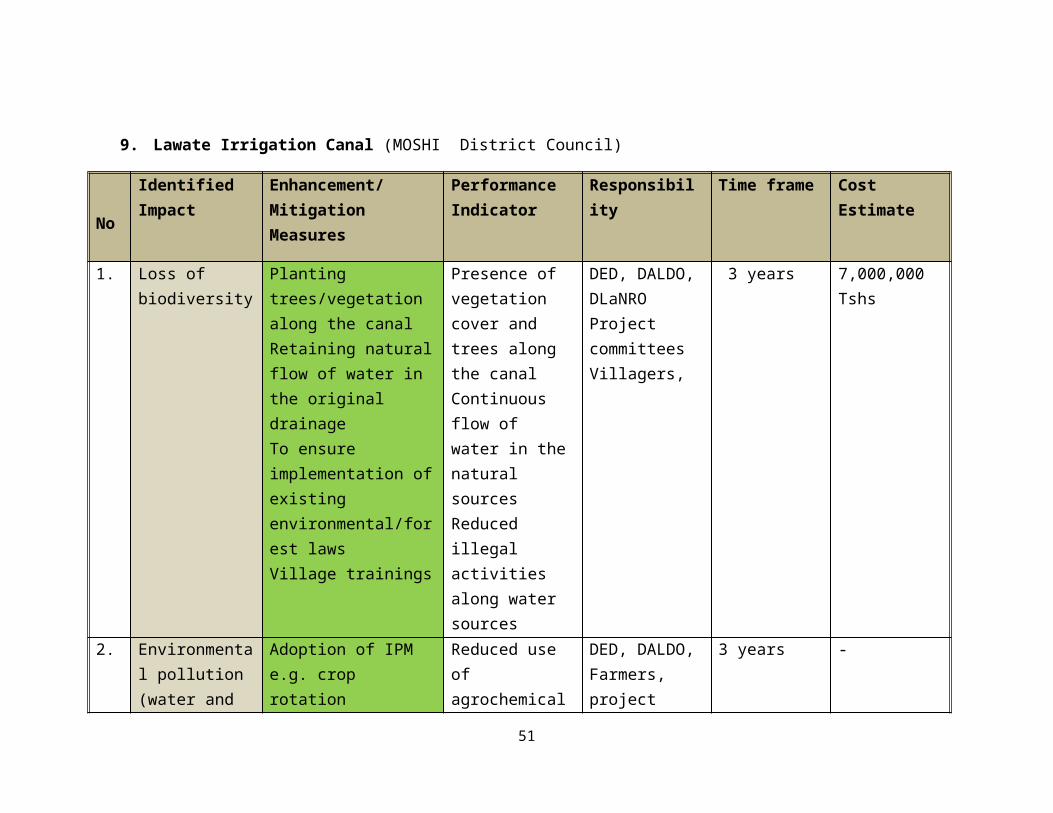
9. Lawate Irrigation Canal (MOSHI District Council)
33

No
Identified Impact
Enhancement/Mitigation Measures
Performance Indicator
Responsibility Time frame Cost Estimate
1. Loss of biodiversity
Planting trees/vegetation along the canalRetaining natural flow of water in the original drainageTo ensure implementation of existing environmental/forest laws Village trainings
Presence of vegetation cover and trees along the canalContinuous flow of water in the natural sourcesReduced illegal activities along water sources
DED, DALDO, DLaNRO Project committees Villagers,
3 years 7,000,000 Tshs
2. Environmental pollution (water and air pollution)
Adoption of IPM e.g. crop rotationUse of Organic fertilizersUse of by laws to protect water sources.Village trainings
Reduced use of agrochemicalsIncreased use of organic fertilizersReduced water and air pollution
DED, DALDO,Farmers, project committees
3 years -
3 Soil erosion and Loss of soil fertility
Good farming practices e.g. mulching, use of cover crops, terracing and contour farming, Village trainings
Reduced soil erosion
DED, DALDO,Farmers, project committees
3 years -
4 Water bone diseases.
Village trainings on water sanitationUse of by laws to protect water sources.
Reduced in transmission of water bone diseases.
DED, District Social Welfare Officers, project committees ,
3 years -
34
No
Identified Impact
Enhancement/Mitigation Measures
Performance Indicator
Responsibility Time frame Cost Estimate
villagers5 Water use
conflicts.Use of water rightsWater use plan
Reduced water use conflicts
DED, District legal officer, project committees, villagers
3 years -
6 Increased area of cultivation
Training farmers on good farming practices and proper land use. Increase in use of modern technology in agriculture
Increase in productivity and income, increased in yield per unit area
DED, DALDo, Community, project committees
3 years -
9.A Environmental and Social Monitoring Plan
35

No Environmental Component to be Monitored
Method of Monitoring and Sampling Area
Frequency Verifiable indicator Responsibility
1. Vegetation Measuring vegetation cover along water sources and the canal
Every after six months
Vegetation Cover DED, DLaNRO, community
2. Soil and water Soil and water PH and salt analysis from the downstream water, and soil from the farm land
Every after six months
Soil and water salt content, PH
DED, DALDO, community
3 Farmers livelihood Increase in production of crops. Measuring the per Capital income in the project area
Each production season
Formers income, living standard.
DED, DALDO District Social Welfare Officer, Community
10. Watesha Irrigation Scheme (MOSHI District Council)
No
Identified Impact
Enhancement/Mitigation Measures
Performance Indicator Responsibility Time frame Cost Estimate
11. Increase in incidences of pests
Training on Proper use of pesticides
Use of IPM methodologies Introduction of pest resistant varieties
Number of farmers trained and practicing the technology
Number of farmers adopting IPM methodology
Farmers, DFT/WFT
Field Extension Officers
July 2012 – June 2015
5 mil
36

No
Identified Impact
Enhancement/Mitigation Measures
Performance Indicator Responsibility Time frame Cost Estimate
Types of resistant varieties introduced
Number of acreage planted resistant varieties
12. Loss of biodiversity
Planting trees/vegetation along the canal,
Retaining natural flow of water in the original drainage.
To ensure implementation of existing environmental/forest laws
Village training
Presence of vegetation cover and trees along the canal
Continuous flow of water in the natural sources
Reduced illegal activities along water sources
DED, DALDO, DLaNRO Project committees Villagers
July 2012 – June 2015
4 mil
13. Environmental pollution (water and air pollution)
Adoption of IPM eg crop rotation
Use of Organic fertilizers
Use of by laws to protect water sources
Reduced use of agrochemicals.
Increased use of organic fertilizers
Reduced water and air pollution
DED, DALDO,
Farmers, project committees
July 2012 – June 2015
4 mil
37

No
Identified Impact
Enhancement/Mitigation Measures
Performance Indicator Responsibility Time frame Cost Estimate
Village trainings
14. Increased irrigated area.
Training on water use management
Number of farmers trained on water use management technology
DED, DALDO, Farmers, Project committees
July 2012 – June 2015
5 mil
15. Soil erosion and Loss of soil fertility
Good farming practices e.g. mulching, use of cover crops, terracing and contour farming, Village trainings
Reduced soil erosion DED, DALDO,
Farmers, project committees
July 2012 – June 2015
4 mil
16. Conflicts among water users
Formation of water user groups/associations
Equitable allocation of water
Number of water users’ groups formed
Reduced number of water conflicts
Farmers, DFT/WFT
Field Extension Officers
July 2012 – June 2015
5 mil
17. Increase in use of Agrochemicals
Training on the use of
IPM methodologies
Introduction of pest resistant varieties
Number of farmers adopting IPM methodology
Types of resistant varieties introduced
Number of acreage planted resistant varieties
Farmers, DFT/WFT
Field Extension Officers
July 2012 – June 2015
4 mil
18. Reduced downstream
Adherence to water permits directive
Volume of water abstracted
Farmers, DFT/WFT July 2012 – 2 mil
38

No
Identified Impact
Enhancement/Mitigation Measures
Performance Indicator Responsibility Time frame Cost Estimate
water flows Field Extension Officers, PBWO
June 2015
39

10.A Environmental and Social Monitoring Plan
No Environmental Component to be Monitored
Method of Monitoring and Sampling Area
Frequency Verifiable indicator Responsibility
1. Increase in incidences of insects and pests
Periodic inspection Weekly Number of inspections
DFT/WFT and Extension Officers, Project Committee
2. Occurrence of soil erosion
Periodic inspection Annually Number of inspections
DFT/WFT and Extension Officers ,Project Committee
3. Conflicts among water users
Meetings, Visits and interviews
Monthly Number of cases recorded
DFT/WFT, Extension Officers ,VEOs, Project Committee, PBWO
4. Increase in use of Agrochemicals
Soil analysis, Interviews Annually Number of Soil samples analyzed
DFT/WFT and Extension Officers, Project Committee
5. Reduced downstream water flows
Measurement of flows Annually Volume of water abstracted
DFT/WFT and Extension Officers ,Project Committee
6. Vegetation Measuring vegetation cover along water sources and the canal
Every after six months
Vegetation Cover DED, DLaNRO, community
7. Farmers livelihood Increase in production of crops. Measuring the per Capital income in the project area
Each production season
Formers income, living standard.
DED, DALDO District Social Welfare Officer, Community
40

11. Kirya Irrigation Scheme (Mwanga District, Kilimanjaro)
NO
CHALLENGE INTERVENTION RESPONSIBLE TIME FRAME COST (TSHS)
1 Dilapidated scheme infrastructure (Main gate)
Construction of new Main Gate at ‘Kambi ya Swala’
Rehabilitation of old Main Gate
Farmers,
District Authority
New Main Gate February to June 2012
Rehabilitation – February 2012
30,000,000
8,000,000
2 Land and crop damage by livestock
Enforcement of bylaws Farmers to provide full support Livestock not to be allowed in the
scheme
Farmers and Pastoralists From now (continuous)
_
3 Increase in soil sodicity in maize farms
Rehabilitation of canals for water removal from the scheme
Use of manure and crop residues Farm leveling
Farmers,
District Authority
From now (continuous)
September to November 2012
_
4 Misuse of pesticides to control crop pests
Education to farmers/trainings Control companies/dealers which
sell ineffective pesticides
TPRI, Farmers,
District Authority
MAFC
Continuous _
5 Water weed in the irrigation canals
Cleaning of canals Farmers Continuous _
6 Deforestation Enforcement of bylaws Tree planting
Farmers, District Authority, River Pangani Basin
All the time during rainy season
_
41

Authority
7 Poor application and inadequate supply of fertilizers
Education to farmers/training District Authority eyes on Agro-
Dealers
District Authority
Villagers
From now (continuous)
_
8 Inadequate supply of safe and clean water
To develop project proposals on availability of clean and safe water
Follow-up of previous plans on water availability
Ministry of Water
District Authority
Villagers
From now _
9 Lack of adequate field/infield roads and crossings in the scheme
Village and Scheme Authority to meet and identify areas suitable for road construction
Rehabilitation of existing roads
Village Authority
Villagers
From now _
10 Lack of toilets in the scheme
Building of toilets Health and environmental
committees to meet with scheme leaders to identify number of toilets needed and areas suitable for their construction
Health and Environmental CommitteesVillagers
From now _
42

12. Lemkuna Irrigation Scheme (Simanjiro District, Manyara)
NO
CHALLENGE INTERVENTION RESPONSIBLE TIME FRAME
COST (TSHS)
1 Dilapidated irrigation infrastructure by livestock and farmers
Enforcement and review of existing bylaws
Village Land Use Planning Use of crop residues for livestock
feed Crop calendar to be followed To have adequate water points for
livestock
UWALE, Village Authority, Farmers, Pastoralists, ENAPA, District Authority
February 2012 and continuous
100,000
2 Siltation in the scheme Catch Drain
Planting of grasses and trees in the river/drain/canal banks
De-silting the catch drain To construct water falls
UWALE, Farmers, Pastoralists, District Authority
July 2012 and continuous
2,991,150
3 Deforestation on the river banks
To prohibit cutting of trees along the river bank
Planting of trees To prohibit any social activities to
be done around the river banks
District Authority, Lemkuna Village Authority, River Pangani Basin Authority, WUA
15 February 2012 and continuous
-
4 Loss of water in unlined irrigation canals
Lining of irrigation canals District Authority, UWALE, MAFC, Other stakeholders
July 2012 and continuous
5,054,450
5 Lack of toilets in the scheme
Education to farmers on the importance of toilets in the scheme
Construction of toilets in the areas to be identified
UWALE, Ward Health Department, District Authority, Scheme farmers
March 2012 and continuous
-
6 Poor road Rehabilitation of road infrastructure UWALE, District From January 3,692,500
43
infrastructure in the scheme
by upgrading them Authority, MAFC 2013
7 Lack of crossings in some areas of the scheme
Construction of crossings for livestock/humans
MAFC, District Authority, UWALE
From January 2013
-
8 Flooding in the scheme
Rehabilitation of the Flood Dyke MAFC, District Authority, UWALE
From January 2013
-
9 Water logging in the scheme
To de-silt the Main Drain MAFC, District Authority, UWALE
From January 2013
2,942,250
10 Inadequate supply of water in some areas of the scheme
To clean main, tertiary and sub tertiary canals as well as water outlet canals
UWALE February 2012
4,000,000
44

13. Musa Mwinjaka Irrigation Scheme
45
No Environmental Component to be Monitored
Method of Monitoring and Sampling Area
Frequency Verifiable indicator Responsibility
1. Increase in incidences of insects and pests
Periodic inspection Weekly Number of inspections
DIDT/WFT and Extension Officers, Project Committee
2.
Increase of water borne diseases
Follow up in Health Facilities
Monthly Number of cases recorded
DIDT/WFT and Extension Officers, Project Committee, Health Officers
3. Increase in soil salinity and soil erosion
Soil analysis, ,Interviews
Periodic inspection
Quarterly Number of Soil samples analyzed
Number of inspections
DIDT/WFT and Extension Officers, Project Committee, KZTSU
4. Increase in cases of Malaria Follow up in Health Facilities
Monthly Number of cases recorded
DIDT/WFT and Extension Officers, Project Committee, Health Officers
5. Conflicts among water users Meetings, Visits and interviews
Monthly Number of cases recorded
DIDT/WFT, Extension Officers VEOs, Project Committee, PBWO, KZITSU
6. Increase in use of Agrochemicals
Soil analysis, ,Interviews Annually Number of Soil samples analyzed
DIDT/WFT and Extension Officers, Project Committee
7. Reduced downstream water Measurement of flows Annually Volume of water DIDT/WFT and Extension 46
47

6 MOROGORO ZONE
14. MVUMI Irrigation Scheme (Kilosa District Council)S/N ISSUE IMPACT MITIGATION
MEASURERESPONSIBILITHY TIME
FRAMECOST
1 Degradation of water catchment area
Soil erosion -Planting trees and cover crops-Provide training to farmers on good agronomic practices
Environmental management committee
Continuous -
2 Stagnant water/unlined canals leading to vegetation growth
Increase incidence of water-borne diseases
Lining of irrigation canals
Awareness raising and training
Improve health facility
By-laws and enforcement
CHAUMVU District WUA
Continuous -
3 Cattle grazing in the scheme
-enforcement of by laws-Provision of safe watering points/structures for livestock
Continuous -
4 Increased use of agrochemicals
-Pollution of water-Soil contamination-Health impact
-Awareness training on safe use and handling of pesticides-Promote and adopt IPM to pest control
Extension officers continuous -
5 Degradation of water catchment areas
-Reduction of water for irrigation
-Awareness raising-Enforcement of by laws
Environmental management committee
continuous -
6 Lack of latrines in the scheme
-Pollution-Waterborne diseases
-Construct latrines Heath committee As soon as possible
-
48

7 Access road to the scheme
-Increase production cost
-Construct access road to the scheme
District council As soon as possible
-
8 Water use conflict
-loss of harmony in the village-Impact on crop production
-Participatory water use planning and management between different users-Enhance dialogues between different parties
-Infrastructure committee-WUA
Continuous -
9 Influx of people - HIV and other STDs
-Awareness raising-Make HIV common agenda in all meetings
Health committee continuous -
14.A ENVIRONMENTAL MONITORING PLAN
S/N ENVIRONMENTAL ISSUE PARAMETER TO BE MONOTORED
FREQUENCY RESPONSIBILITY
1 Depletion of water in the river Flow of water Three times per year Infrastructure committee
2 Pollution of water due to washing and bathing
Change of color and odour
continuous Infrastructure committeeWUA
3 Stagnation of water in irrigation canals
Flow of water Continuous Infrastructure committeeWUA
4 Access road to the scheme Presence of road to the scheme
once CHAUMVU
5 Lack of latrines Presence of latrines in the scheme
once Health committee
6 Spreading of HIV and other STD New cases of infection Twice per year Health committee, NGOs, District council
7 Conflicts of water uses No of cases Once every three months
CHAUMVU, Police records
49

15. LUMUNA Irrigation Scheme (Kilosa District Council)
S/NISSUE IMPACT MITIGATION MEASURES RESPONSIBILITY TIME
FRAMECOST
1. Degradation – water catchment area due to agricultural activities
Siltation of water intake, river and irrigation canals.
Reduction in irrigation water quality
By-laws and there effective enforcement
Awareness raising on water catchment areas management
Participatory land and water use planning
CHAULU District Council WUA
Continuous -
2. Stagnant water/unlined canals leading to vegetation growth
Increase incidence of water-borne diseases
Lining of irrigation canals
Awareness raising and training
Improve health facility By-laws and
enforcement
District Council CHAULU
-
3 Lack of water point for livestock
Infrastructure damage
Pollution of water
Provide water point for livestock
By -laws and enforcement
CHAULU -
4 Increase in agrochemical use
Water contamination
Soil contamination
Poor water quality for downstream users
Health risks from use of agrochemicals
Training on agrochemicals handling and safety measures
Provide water for domestic and livestock water supply
Training on Integrated Pest Management (IPM) approaches
Enforcement of by- laws
Extension officers-
5 Influx of Increase of HIV Awareness raising NGOs,District -
50
people and STDs
Improve health facility Make HIV common
agenda in all meetings
council,CHAULU
6. Water use conflicts
Impact on production
Participatory water use planning and management between different users
Enhance dialogues between different parties
WUA -
15.A LUMUNA ENVIRONMENTAL MONITORING PLAN
S/N ENVIRONMENTAL ISSUE PARAMETER TO BE MONITORED
FREQUENCY RESPONSIBILITY
1 Decrease of water for irrigation Water flow Once per month CHAULU,WUA2 Siltation of water intake, river and
irrigation canalsIncrease of silt Rainy season CHAULU,WUA
3 Water pollution -Change of water colour, odour-No of people washing
Continuous CHAULU
4 Increase of incidence of waterborne diseases
Data of new cases at heath centers
Continuous CHAULU, Health committee, Village authority
5 Spreading of HIV and other STD Data of new cases at health centre
continuous CHAULU, Health committee, Village authority
6 Water use conflicts
16. MWEGA Irrigation Scheme (Kilosa District Council)
51

S/N
ISSUE IMPACT MITIGATION MEASURES RESPONSIBILITY TIME FRAME
COST
1. Degradation – water catchment area due to agricultural activities
Siltation of river, water intake and canals
Reduction in irrigation water quality
By-laws and there effective enforcement
Awareness raising on water catchment areas management
Participatory land and water use planning ,
District council, CHAUMWE,WUA
Continuous
-
2. Siltation of water intake, river and irrigation canals
Reduction in irrigation water
By-laws and there effective enforcement
Awareness raising on water catchment areas management
District council, CHAUMWE,WUA
Continuous
-
4. unlined canals
Loss of irrigation water
Increased incidence of waterborne diseases
Lining of canals CHAUMWE,Zonal irrigation Office,Village government
As soon as possible
-
5. Lack of water point for livestock
Infrastructure destruction
pollution
By-laws and their effective enforcement
CHAUMWE continuous -
6. Frequent breakdown of TAZAMA pipeline
Water pollution Surveillance and proper maintenance of the pipeline
TAZAMA,CHAUMWE AND Village authority
Continuous -
7. Increased use of agrochemicals
Water contamination
Soil contamination
Health risks
Training on agrochemicals handling and safety measures
Training on Integrated Pest Management (IPM)
Extension officers, CHAUMWE
Continuous
-
52

from use of agrochemicals
approaches Enforcement of by- laws
8. HIV Impact on production Awareness raising and make HIV common agenda in all meetings
Improve health facility
District council, NGOs, health committee
continuous -
16.A MWEGA MONITORING PLAN
S/N ENVIRONMENTAL AND SOCIAL COMPONENT
PARAMETER TO BE MONITORED
FREQUENCY RESPONSIBILITY
1. Decrease of water for irrigation Flow of water Three times per year CHAUMWE2. Siltation of water intake Increase of silt continuous3. Siltation of irrigation canals Increase of silt Continuous CHAUMWE4. Water pollution due to bathing
and washing in irrigation canalsChange of water color and odor
Continuous CHAUMWE
5. Increase of incidence of waterborne diseases
new cases of waterborne diseases at heath centers
continuous Health committee
6. Spreading of HIV and other STDs Data from the health center
Quarterly Health Committee
53

17. KWALA Irrigation Scheme (KIBAHA District Council)
No
Identified Impact
Enhancement/Mitigation Measures
Performance Indicator Responsibility Time frame Cost Estimate
1. Water shortage for irrigation domestic use and Livestock watering
Provide adequate design of conveyance infrastructure
Provide livestock watering points
Improve domestic water supply systems (Tap/shallow wells)
Improve infield water management
Strengthen water user groups
Number of Structures in
Number of farmers trained on irrigation water management
Number of Livestock watering Points
Farmers, DFT/WFT
Field Extension Officers
July 2011 – June 2014
7 mil
2. Deforestation Develop afforestation and tree planting programme
Develop and implement Soil conservation programme
Conduct public awareness on combating deforestation
Conduct public awareness on combating deforestation
Number of awareness campaigns/meetings
Number of tree nurseries established
Number of trees planted
Farmers, DFT/WFT
Field Extension Officers
July 2011 – June 2014
5 mil
54

No
Identified Impact
Enhancement/Mitigation Measures
Performance Indicator Responsibility Time frame Cost Estimate
3. Soil erosion/ Land degradation
Proper design and layout of the canals or avoiding too steep gradient
Control deforestation and overgrazing (awareness)
Bush clearing Land leveling
Develop and implement soil conservation programmes
Develop and implement afforestation programme in the catchment
Number of awareness campaigns/meetings
Number of Villagers trained
Number of conservation/Afforastation programs developed and implemented
Number of acres with erosion control measures
Farmers, DFT/WFT
Field Extension Officers
July 2011 – June 2014
8 mil
4. Water pollution Training on the use of IPM methodologies Control the application
of excessive chemicals and fertilizers (awareness)
Control the discharge of agrochemicals into other water bodies
Number of farmers adopting IPM methodology
Measured amount of Agrochemicals discharged in the water bodies
Farmers, DFT/WFT
Field Extension Officers
July 2011 – June 2014
3 mill
5. Water borne/related
Proper design of conveyance infrastructure,
Number of Water borne/related diseases
Farmers, July 2012 – 2mil
55

No
Identified Impact
Enhancement/Mitigation Measures
Performance Indicator Responsibility Time frame Cost Estimate
diseases and other diseases
which includes: Lining canals to
discourage disease vectors
Avoidance of stagnant or slow moving waters
Filling or draining off borrow pit along the irrigation canal
Disease treatment Health education and
awareness particularly on HIV
and other disease cases reported
Number of people trained on Health education and awareness
DFT/WFT
Field Extension Officers
June 2014
6. High population of livestock
Control overgrazing and destockingAwareness creation
Number of awareness campaigns/meetings
Number of stock destocked
Farmers, DFT/WFT
Field Extension Officers
July 2012 – June 2014
5 mill
7. Poor road infrastructure
The road infrastructure should be regularly rehabilitated and maintained
Kilometers of road rehabilitated
Farmers, DFT/WFT
Field Extension Officers
July 2012 – June 2014
4 mill
8. Degradation of arable land
Develop soil conservation programme and apply organic manure and inorganic fertilizers
Number of farmers adopting IPM methodology
Number of
Farmers, DFT/WFT
July 2012 – June 2014
5 mill
56

No
Identified Impact
Enhancement/Mitigation Measures
Performance Indicator Responsibility Time frame Cost Estimate
conservation programs developed and implemented
Field Extension Officers
9. Livestock keepers/farmers conflicts
Develop and implement Land use plan
Demarcate/construction of crossings for human and livestock
Construction of drinking trough for Livestock watering
Land use map Number of cattle
troughs in place
Farmers, DFT/WFT
Field Extension Officers
July 2012 – June 2014
8 mil
10. Flooding the villages located in the flood plan
The community settled in the flooding area should be shifted into the highlands
Number of people ressetled from the flood plains
Farmers, DFT/WFT
Field Extension Officers
July 2012 – June 2014
10 mil
57

17.A Environmental and Social Monitoring Plan
No Environmental Component to be Monitored
Method of Monitoring and Sampling Area
Frequency Verifiable indicator Responsibility
1. Water shortage for irrigation domestic use and Livestock watering.
Periodic inspection andMeasurement of volume of water supplied
Annually Number of inspections and Volume of water supplied
DFT/WFT and Extension Officers, Project Committee
2. Deforestation Periodic inspection Monthly Number of inspections
DFT/WFT and Extension Officers, Project Committee
3. Soil erosion/ Land degradation
Periodic inspection Annually Number of inspections
DFT/WFT and Extension Officers, Project Committee
4. Water pollution Water analysis Monthly Number of water samples analyzed
DFT/WFT and Extension Officers, Project Committee, Health Officers
5. Water borne/related diseases and other diseases
Follow up in Health Facilities
Monthly Number of cases recorded
DFT/WFT and Extension Officers, Project Committee, Health Officers
6. High population of livestock
Inspection, Meetings, Visits and interviews
Monthly Number of cases recorded
DFT/WFT, Extension Officers,VEOs, Project Committee, WRBWO
7. Poor road infrastructure Inspection Annually Number of inspections
DFT/WFT and Extension Officers, Project Committee
58

8. Degradation of arable land DFT/WFT and Extension Officers, Project Committee
9. Livestock keepers/farmers conflicts
Meetings, Visits and interviews
Monthly Number of cases recorded
DFT/WFT and Extension Officers, Project Committee, Livestock keepers Representatives/Association
10. Flooding the villages located in the flood plan
Periodic inspection Annually Number of cases recorded
DFT/WFT and Extension Officers, Project Committee
18. RUDEWA Irrigation Scheme (KILOSA District Council)
No
Identified Impact
Enhancement/Mitigation Measures
Performance Indicator Responsibility Time frame Cost Estimate
1. Increase in incidences of pests
Training on Proper use of pesticides
Use of IPM methodologies Introduction of pest resistant varieties
Number of farmers trained and practicing the technology
Number of farmers adopting IPM methodology
Types of resistant varieties introduced
Number of acreage planted resistant varieties
Farmers, DFT/WFT
Field Extension Officers
July 2011 – June 2014
5 mil
2. Increase of water borne diseases
Create awareness on water borne diseases to the Community
Number of water borne diseases reported
Farmers, DFT/WFT
July 2011 – June 2014
5 mil
59

No
Identified Impact
Enhancement/Mitigation Measures
Performance Indicator Responsibility Time frame Cost Estimate
Prevention of water borne diseases
Field Extension Officers
3. Occurrence of soil erosion
Training on soil and` water conservation
Training on water management
Use of soil erosion control measures
Number of farmers trained
Reduced numbers of gullies trained
Number of acres with erosion control measures
Farmers, DFT/WFT
Field Extension Officers
July 2011 – June 2014
3 mil
4. Incidences of bilharziasis
General cleaning of furrows
Biological control – introduction of free range ducks
Use of preventive medicines
Training on control of bilharziasis
Improved drainage system
Cleanliness of the furrow /Scheme
Number of farmers keeping free range ducks
Number of bilharziasis cases
Number of farmers trained
Reduced Number of bilharziasis cases
Farmers, DFT/WFT
Field Extension Officers
July 2011 – June 2014
3 mill
5. Increase in cases of Malaria
Create awareness on water borne diseases to the Community
Prevention of water borne diseases
Number of malaria cases reported
Farmers, DFT/WFTField Extension Officers
July 2011 – June 2014
2mil
60

No
Identified Impact
Enhancement/Mitigation Measures
Performance Indicator Responsibility Time frame Cost Estimate
6. Conflicts among water users
Formation of water user groups/associations
Equitable allocation of water
Number of water users’ groups formed
Reduced number of water conflicts
Farmers, DFT/WFTField Extension Officers
July 2011 – June 2014
2 mill
7. Increase in use of Agrochemicals
Training on the use of IPM methodologies
Introduction of pest resistant varieties
Number of farmers adopting IPM methodology
Types of resistant varieties introduced
Number of acreage planted resistant varieties
Farmers, DFT/WFT
Field Extension Officers
July 2011 – June 2014
4 mill
8. Reduced downstream water flows
Adherence to water permits directive
Volume of water abstracted
Farmers, DFT/WFT
Field Extension Officers, PBWO
July 2011 – June 2014
2 mill
9. Population influx resulting into increased cases of HIV
Awareness creation on HIV/AIDS
Number of new HIV/AIDS Cases reported
Farmers, DFT/WFT
Field Extension Officers
July 2011 – June 2014
2.8 mil
18.A Environmental and Social Monitoring Plan
No Environmental Component to be Monitored
Method of Monitoring and Sampling Area
Frequency Verifiable indicator Responsibility
61

1. Increase in incidences of insects and pests
Periodic inspection Weekly Number of inspections
DFT/WFT and Extension Officers, Project Committee
2.
Increase of water borne diseases
Follow up in Health Facilities
Monthly Number of cases recorded
DFT/WFT and Extension Officers, Project Committee, Health Officers
3. Occurrence of soil erosion Periodic inspection Annually Number of inspections
DFT/WFT and Extension Officers, Project Committee
4. Incidences of bilharziasis Follow up in Health Facilities
Monthly Number of cases recorded
DFT/WFT and Extension Officers, Project Committee, Health Officers
5. Increase in cases of Malaria Follow up in Health Facilities
Monthly Number of cases recorded
DFT/WFT and Extension Officers, Project Committee, Health Officers
6. Conflicts among water users Meetings, Visits and interviews
Monthly Number of cases recorded
DFT/WFT ,Extension Officers,VEOs, Project Committee, PBWO
7. Increase in use of Agrochemicals
Soil analysis, ,Interviews Annually Number of Soil samples analyzed
DFT/WFT and Extension Officers, Project Committee
62
8. Reduced downstream water flows
Measurement of flows Annually Volume of water abstracted
DFT/WFT and Extension Officers, Project Committee
9. Population influx resulting into increased cases of HIV
Follow up in Health Facilities, Interviews
Annually Number of cases recorded
DFT/WFT and Extension Officers, Project Committee, Health Officers
9. Population influx resulting into increased cases of HIV
Follow up in Health Facilities, Interviews
Annually Number of cases recorded
DFT/WFT and Extension Officers, Project Committee, Health Officers
63

19. EUGA Irrigation Scheme (ULANGA District Council)
No
Identified Impact
Enhancement/Mitigation Measures
Performance Indicator
Responsibility Time frame Cost Estimate
1. Increase in Nutrients and sediment load
Training on the use of IPM methodologies
Introduction of pest resistant varieties
Conservation of the catchment and river banks
Number of farmers adopting IPM methodology
Types of resistant varieties introduced
Number of acreage planted resistant varieties
Number of acreage conserved
Farmers, DFT/WFT
Field Extension Officers
July 2012 – June 2014
6 milt
2. Upstream migration of spawning fish and overall fishery potential
Minimize reduction in peak flows
Construct fish radder on Weirs to allow for movement upstream
Measured peak flows
Type and Number of fish radder constructed
Farmers, DFT/WFT
Field Extension Officers
July 2012 – June 2014
2 mil
3. Soil stability and biodiversity in the Phragmites community
Minimize reduction in peak flows and stabilization of river banks
Measured peak flows
Number of farmers trained
Numbers of gullies reformed
Farmers, DFT/WFT
Field Extension Officers
July 2012 – June 2014
5 mil
64

No
Identified Impact
Enhancement/Mitigation Measures
Performance Indicator
Responsibility Time frame Cost Estimate
5. Seasonal migration of large mammals
Maintain the environmental flow in the river so that it can contribute to make the floodplain green during the dry season.
Measured peak flows
Number of farmers trained in irrigation water management
Number of large mammals migrating
Farmers, DFT/WFT
Field Extension Officers
July 2012 – June 2014
3 mill
6. Occurrence of water logging and secondary soil salinity due to poor drainage in the farms
Construction of drainage facilities to make sure that the excess water is drained back to the river.
Acreage under water logging
Acreage under secondary soil salinity
Farmers, DFT/WFT
Field Extension Officers
July 2012 – June 2014
6 mil
7. Occurrence and severity of bush fires
Introduce a good management plan to control bush fire within the irrigation scheme and the neighboring villages.
Number of occurrence of bush fire
Acreage under bush fire
Farmers, DFT/WFT
Field Extension Officers
July 2012 – June 2014
5 mill
8. Water Use conflicts among irrigation farmers, and
Assist irrigators association to acquire water use permit from the respective authorities
Enforcement of laws and
Water use permit in hand
Equitable allocation of water
Farmers, DFT/WFT
Field Extension
July 2012 – June 2014
4 mill
65

No
Identified Impact
Enhancement/Mitigation Measures
Performance Indicator
Responsibility Time frame Cost Estimate
among farmers and Livestock keepers
by-laws at village level Establishment of
scheme boundaries and restricting 6animal raring inside the boundaries
Include cattle troughs in the areas adjacent to the scheme boundaries
Number of cattle troughs constructed
Officers
9 Rodents, Insect pests, Birds , vermin and crop diseases
Development and use of cropping calendar and cropping pattern
Training on the use of IPM methodologies
Introduction of pest resistant varieties
Cleanliness of the farms to remove animal habitats
Number of farmers adopting IPM methodology
Developed and executed 6cropping calendar
Farmers, DFT/WFT
Field Extension Officers, PBWO
July 2012 – June 2014
2 mill
10. Population influx resulting into increased cases of HIV
Awareness creation on HIV/AIDS
Number of new HIV/AIDS Cases reported
Farmers, DFT/WFT
Field Extension Officers
July 2012 – June 2014
4 mil
66

19.A Environmental and Social Monitoring Plan
67

No Environmental Component to be Monitored
Method of Monitoring and Sampling Area
Frequency Verifiable indicator
Responsibility
1. Increase in Nutrients and sediment load
Periodic inspection/water analysis
Monthly Periodic inspection DFT/WFT and Extension Officers, Project Committee
2. Upstream migration of spawning fish and overall fishery potential
Periodic inspection Measurement of flows
Monthly Periodic inspectionFlows
DFT/WFT and Extension Officers, Project Committee, Health Officers
3.Soil stability and biodiversity in the Phragmites community
Periodic inspectionMeasurement of flows
Monthly Periodic inspection DFT/WFT and Extension Officers, Project Committee, Health Officers
4. Seasonal migration of large mammals
Periodic inspection, Interviews
Quarterly Number of cases recorded
DFT/WFT and Extension Officers, Project Committee
5. Occurrence of water logging and secondary soil salinity due to poor drainage in the farms,
Soil analysis, Interviews Annually Number of inspections
DFT/WFT and Extension Officers, Project Committee
6. Occurrence and severity of bush fires
Periodic inspection, Interviews
Monthly Number of cases recorded
DFT/WFT and Extension Officers, Project Committee, Health Officers
7. Water Use conflicts among irrigation farmers, and among farmers and Livestock keepers
Meetings, Visits and interviews
Monthly Number of cases recorded
DFT/WFT ,Extension Officers,VEOs, Project Committee, PBWO
8. Rodents, Insect pests, Birds, vermin and crop diseases
Periodic inspection, Interviews
Annually Number of Soil samples analyzed
DFT/WFT and Extension Officers, Project Committee
9. Population influx resulting Follow up in Health Annually Number of cases DFT/WFT and Extension
68

IV MBEYA ZONE
20. IKUMBILO CHITETE Irrigation Scheme (ILEJE District Council)
No Identified Impact
Enhancement/Mitigation Measures
Performance Indicator Responsibility Time frame Cost Estimate (Tsh)
1. Increase in incidences of pests
Training on Proper use of pesticides
Use of IPM methodologies Introduction of pest resistant varieties
Number of farmers trained and practicing the technology
Number of farmers adopting IPM methodology
Types of resistant varieties introduced
Number of acreage planted resistant varieties
Farmers, DFT/WFT
Field Extension Officers
July 2010– June 2013
5,000,000
2. Incidences of bilharziasis
General cleaning of furrows
Biological control – introduction of free range ducks
Use of preventive medicines
Training on control of bilharziasis
Improved drainage system
Cleanliness of the furrow /Scheme
Number of farmers keeping free range ducks
Number of bilharziasis cases
Number of farmers trained
Reduced Number of bilharziasis cases
Farmers, DFT/WFT
Field Extension Officers
July 2010– June 2013
3,000,000
3. Increase of water Create awareness on Number of water Farmers, July 2010– 2,000,000
69

No Identified Impact
Enhancement/Mitigation Measures
Performance Indicator Responsibility Time frame Cost Estimate (Tsh)
borne diseases water borne diseases to the Community
Prevention of water borne diseases
borne diseases reported
DFT/WFT
Field Extension Officers
June 2013
5. Occurrence of soil erosion
Training on soil and` water conservation
Training on water management
Use of soil erosion control measures
Number of farmers trained
Reduced numbers of gullies trained
Number of acres with erosion control measures
Farmers, DFT/WFT
Field Extension Officers
July 2010– June 2013
4,000,000
6. Increase in cases of Malaria
Create awareness on water borne diseases to the Community
Prevention of water borne diseases
Number of malaria cases reported
Farmers, DFT/WFT
Field Extension Officers
July 2010– June 2013
2,000,000
7. Conflicts among water users
Formation of water user groups/associations
Equitable allocation of water
Number of water users’ groups formed
Reduced number of water conflicts
Farmers, DFT/WFT
Field Extension Officers
July 2010– June 2013
-
8. Increase in use of Agrochemicals
Training on the use of IPM methodologies
Introduction of pest
Number of farmers adopting IPM methodology
Types of resistant
Farmers, DFT/WFT
Field Extension
July 2010– June 2013
3,000,000
70

No Identified Impact
Enhancement/Mitigation Measures
Performance Indicator Responsibility Time frame Cost Estimate (Tsh)
resistant varieties varieties introduced Number of acreage
planted resistant varieties
Officers
9 Reduced downstream water flows
Adherence to water permits directive
Volume of water abstracted
Farmers, DFT/WFT
Field Extension Officers, NBWO
July 2010– June 2013
2,000,00
10. Population influx resulting into increased cases of HIV
Awareness creation on HIV/AIDS
Number of new HIV/AIDS Cases reported
Farmers, DFT/WFT
Field Extension Officers
July 2010– June 2013
4,000,000
11 Deforestation Conduct awareness campaigns on the importance of trees to agriculture
Carry out tree planting programme
Training of tree nursery
Number of farmers participating in campaigns
Number of trees planted
Number of tree nurseries established
Farmers, DFT/WFT
Field Extension Officers
July 2010– June 2013
6,000,000
20.A Environmental and Social Monitoring Plan
No Environmental Component to be Monitored
Method of Monitoring and Sampling Area
Frequency Verifiable indicator Responsibility
71

1. Increase in incidences of insects and pests
Periodic inspection Weekly Number of inspections
DFT/WFT and Extension Officers, Project Committee
2. Incidences of bilharziasis Follow up in Health Facilities
Monthly Number of cases recorded
DFT/WFT and Extension Officers, Project Committee, Health Officers
3.
Increase of water borne diseases
Follow up in Health Facilities
Monthly Number of cases recorded
DFT/WFT and Extension Officers, Project Committee, Health Officers
4. Increase in soil salinity Soil analysis, ,Interviews Quarterly Number of Soil samples analyzed
DFT/WFT and Extension Officers, Project Committee
5. Occurrence of soil erosion Periodic inspection Annually Number of inspections
DFT/WFT and Extension Officers, Project Committee
6. Increase in cases of Malaria Follow up in Health Facilities
Monthly Number of cases recorded
DFT/WFT and Extension Officers, Project Committee, Health Officers
7. Conflicts among water users Meetings, Visits and interviews
Monthly Number of cases recorded
DFT/WFT, Extension Officers,VEOs, Project Committee, NBWO
72

8. Increase in use of Agrochemicals
Soil analysis, ,Interviews Annually Number of Soil samples analyzed
DFT/WFT and Extension Officers, Project Committee
9. Reduced downstream water flows
Measurement of flows Annually Volume of water abstracted
DFT/WFT and Extension Officers, Project Committee
10. Population influx resulting into increased cases of HIV
Follow up in Health Facilities, Interviews
Annually Number of cases recorded
DFT/WFT and Extension Officers, Project Committee, Health Officers
11 Deforestation Periodic inspection Annually Number of inspections
DFT/WFT and Extension Officers, Project Committee
21. KAREMA Irrigation Scheme (MPANDA District Council)
No Identified Impact
Enhancement/Mitigation Measures
Performance Indicator Responsibility Time frame Cost Estimate (Tsh)
1. Increase in incidences of pests
Training on Proper use of pesticides
Use of IPM methodologies Introduction of pest
Number of farmers trained and practicing the technology
Number of farmers adopting IPM
Farmers, DFT/WFT
Field Extension
July 2011 – June 2014
5,000,000
73
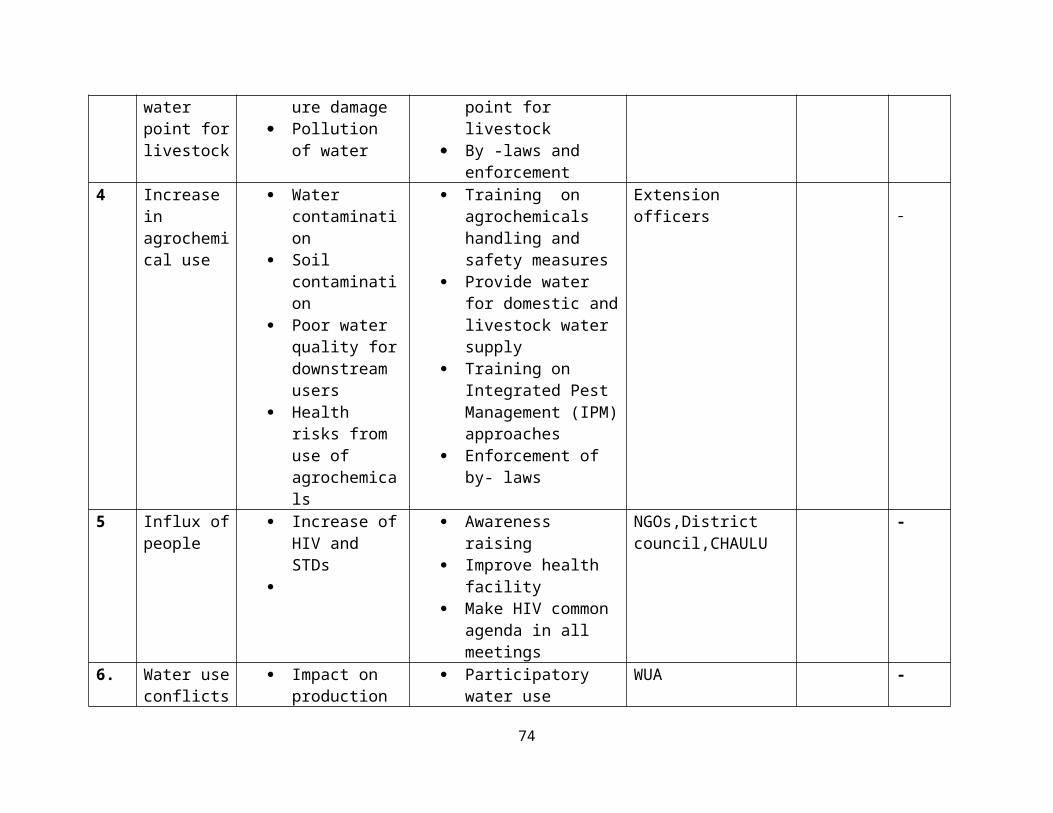
No Identified Impact
Enhancement/Mitigation Measures
Performance Indicator Responsibility Time frame Cost Estimate (Tsh)
resistant varieties methodology Types of resistant
varieties introduced Number of acreage
planted resistant varieties
Officers
2. Incidences of bilharziasis
General cleaning of furrows
Biological control – introduction of free range ducks
Use of preventive medicines
Training on control of bilharziasis
Improved drainage system
Cleanliness of the furrow /Scheme
Number of farmers keeping free range ducks
Number of bilharziasis cases
Number of farmers trained
Reduced Number of bilharziasis cases
Farmers, DFT/WFT
Field Extension Officers
July 2011 – June 2014
2,000,000
3. Increase of water borne diseases
Create awareness on water borne diseases to the Community
Prevention of water borne diseases
Number of water borne diseases reported
Farmers, DFT/WFT
Field Extension Officers
July 2011 – June 2014
5,000,000
4. Occurrence of soil erosion
Training on soil and` water conservation
Training on water management
Use of soil erosion control measures
Number of farmers trained
Reduced numbers of gullies trained
Number of acres with erosion control measures
Farmers, DFT/WFT
Field Extension Officers
July 2011 – June 2014
8,000,000
74

No Identified Impact
Enhancement/Mitigation Measures
Performance Indicator Responsibility Time frame Cost Estimate (Tsh)
5. Increase in cases of Malaria
Create awareness on water borne diseases to the Community
Prevention of water borne diseases
Number of malaria cases reported
Farmers, DFT/WFT
Field Extension Officers
July 2011 – June 2014
3,000,000
7. Conflicts among water users
Formation of water user groups/associations
Equitable allocation of water
Number of water users’ groups formed
Reduced number of water conflicts
Farmers, DFT/WFT
Field Extension Officers
July 2011 – June 2014
3,000,000
8. Increase in use of Agrochemicals
Training on the use of IPM methodologies
Introduction of pest resistant varieties
Number of farmers adopting IPM methodology
Types of resistant varieties introduced
Number of acreage planted resistant varieties
Farmers, DFT/WFT
Field Extension Officers
July 2011 – June 2014
3,000,000
9 Reduced downstream water flows
Adherence to water permits directive
Volume of water abstracted
Farmers, DFT/WFT
Field Extension Officers, LTBWO
July 2011 – June 2014
2,000,000
10. Population Awareness creation Number of new Farmers, July 2011 – 5,000,000
75

No Identified Impact
Enhancement/Mitigation Measures
Performance Indicator Responsibility Time frame Cost Estimate (Tsh)
influx resulting into increased cases of HIV
on HIV/AIDS HIV/AIDS Cases reported
DFT/WFT
Field Extension Officers
June 2014
11 Frequent floods Construction of flood control bunds
Constructed flood bunds
Design engineers
MB-ZIU, Mpanda District Council
Contactor
July 2011 – June 2014
Included into the cost of construction
76

21.A Environmental and Social Monitoring Plan
No Environmental Component to be Monitored
Method of Monitoring and Sampling Area
Frequency Verifiable indicator Responsibility
1. Increase in incidences of insects and pests
Periodic inspection Weekly Number of inspections
DFT/WFT and Extension Officers, Project Committee
2. Incidences of bilharziasis Follow up in Health Facilities
Monthly Number of cases recorded
DFT/WFT and Extension Officers, Project Committee, Health Officers
3.
Increase of water borne diseases
Follow up in Health Facilities
Monthly Number of cases recorded
DFT/WFT and Extension Officers, Project Committee, Health Officers
4. Increase in soil salinity Soil analysis, Interviews Quarterly Number of Soil samples analyzed
DFT/WFT and Extension Officers, Project Committee
5. Occurrence of soil erosion Periodic inspection Annually Number of inspections
DFT/WFT and Extension Officers, Project Committee
6. Increase in cases of Malaria Follow up in Health Facilities
Monthly Number of cases recorded
DFT/WFT and Extension Officers, Project Committee, Health Officers
77

7. Conflicts among water users Meetings, Visits and interviews
Monthly Number of cases recorded
DFT/WFT ,Extension Officers,VEOs, Project Committee, LTBWO
8. Increase in use of Agrochemicals
Soil analysis, ,Interviews Annually Number of Soil samples analyzed
DFT/WFT and Extension Officers, Project Committee
9. Reduced downstream water flows
Measurement of flows Annually Volume of water abstracted
DFT/WFT and Extension Officers, Project Committee
10. Population influx resulting into increased cases of HIV
Follow up in Health Facilities, Interviews
Annually Number of cases recorded
DFT/WFT and Extension Officers, Project Committee, Health Officers
78

22. KASYABONE/KISEGESE Irrigation Scheme (RUNGWE District Council)
No Identified Impact
Enhancement/Mitigation Measures
Performance Indicator Responsibility Time frame Cost Estimate
1. Increase in incidences of pests
Training on Proper use of pesticides
Use of IPM methodologies Introduction of pest resistant varieties
Number of farmers trained and practicing the technology
Number of farmers adopting IPM methodology
Types of resistant varieties introduced
Number of acreage planted resistant varieties
Farmers, DFT/WFT
Field Extension Officers
July 2011 – June 2014
2,000,000
2. Incidences of bilharziasis
General cleaning of furrows
Biological control – introduction of free range ducks
Use of preventive medicines
Training on control of bilharziasis
Improved drainage system
Cleanliness of the furrow /Scheme
Number of farmers keeping free range ducks
Number of bilharziasis cases
Number of farmers trained
Reduced Number of bilharziasis cases
Farmers, DFT/WFT
Field Extension Officers
July 2011 – June 2014
3,000,000
3. Increase of water borne diseases
Create awareness on water borne diseases to the Community
Prevention of water borne diseases
Number of water borne diseases reported
Farmers, DFT/WFT
Field Extension Officers
July 2011 – June 2014
3,000,000
79

No Identified Impact
Enhancement/Mitigation Measures
Performance Indicator Responsibility Time frame Cost Estimate
4. Occurrence of soil erosion
Training on soil and` water conservation
Training on water management
Use of soil erosion control measures
Number of farmers trained
Reduced numbers of gullies trained
Number of acres with erosion control measures
Farmers, DFT/WFT
Field Extension Officers
July 2011 – June 2014
5,000,000
5. Increase in cases of Malaria
Create awareness on water borne diseases to the Community
Prevention of water borne diseases
Number of malaria cases reported
Farmers, DFT/WFT
Field Extension Officers
July 2011 – June 2014
1,000,000
6. Conflicts among water users
Formation of water user groups/associations
Equitable allocation of water
Number of water users’ groups formed
Reduced number of water conflicts
Farmers, DFT/WFT
Field Extension Officers
July 2011 – June 2014
3,000,000
7. Increase in use of Agrochemicals
Training on the use of IPM methodologies
Introduction of pest resistant varieties
Number of farmers adopting IPM methodology
Types of resistant varieties introduced
Number of acreage planted resistant varieties
Farmers, DFT/WFT
Field Extension Officers
July 2011 – June 2014
5,000,000
8. Reduced downstream
Adherence to water permits directive
Volume of water abstracted
Farmers, July 2011 – 2,000,000
80

No Identified Impact
Enhancement/Mitigation Measures
Performance Indicator Responsibility Time frame Cost Estimate
water flows DFT/WFT
Field Extension Officers, NBWO
June 2014
9. Population influx resulting into increased cases of HIV
Awareness creation on HIV/AIDS
Number of new HIV/AIDS Cases reported
Farmers, DFT/WFT
Field Extension Officers
July 2011 – June 2014
5,000,000
22.A Environmental and Social Monitoring Plan
No Environmental Component to be Monitored
Method of Monitoring and Sampling Area
Frequency Verifiable indicator Responsibility
1. Increase in incidences of insects and pests
Periodic inspection Weekly Number of inspections
DFT/WFT and Extension Officers, Project Committee
2. Incidences of bilharziasis Follow up in Health Facilities
Monthly Number of cases recorded
DFT/WFT and Extension Officers, Project Committee, Health Officers
3.Increase of water borne diseases
Follow up in Health Facilities
Monthly Number of cases recorded
DFT/WFT and Extension Officers, Project Committee, Health
81

Officers4. Increase in soil salinity Soil analysis, ,Interviews Quarterly Number of Soil
samples analyzedDFT/WFT and Extension Officers, Project Committee
5. Occurrence of soil erosion Periodic inspection Annually Number of inspections
DFT/WFT and Extension Officers, Project Committee
6. Increase in cases of Malaria Follow up in Health Facilities
Monthly Number of cases recorded
DFT/WFT and Extension Officers, Project Committee, Health Officers
7. Conflicts among water users Meetings, Visits and interviews
Monthly Number of cases recorded
DFT/WFT, Extension Officers, VEOs, Project Committee, NBWO
8. Increase in use of Agrochemicals
Soil analysis, ,Interviews Annually Number of Soil samples analyzed
DFT/WFT and Extension Officers, Project Committee
9. Reduced downstream water flows
Measurement of flows Annually Volume of water abstracted
DFT/WFT and Extension Officers, Project Committee
10. Population influx resulting into increased cases of HIV
Follow up in Health Facilities, Interviews
Annually Number of cases recorded
DFT/WFT and Extension Officers, Project Committee, Health Officers
V. MWANZA ZONE
23. Kasoli Irrigation Scheme (Bariadi District Council)
82

NO
IDENTIFIED IMPACT
ENHANCEMENT/MITIGATION MEASURES
PERFORMANCE INDICATOR
RESPONSIBILITY
TIME FRAME
COST ESTIMATE
1. Increase of water borne diseases
Create awareness on water borne diseases to the Community
Prevention of water borne diseases
Use of by laws to protect water sources
Number of water borne diseases reported in the health centre
Farmers, DFT/WFTField Extension OfficersMedical officers and legal officer
July 2012 – June 2015
5 Mill.
2. Incidences of bilharziasis
Training on control of bilharziasis
Improved drainage system Use of preventive medicines General cleaning of furrows
every season
Cleanliness of the furrow /Scheme every season
Number of bilharziasis cases
reported Number of
farmers trained
DED, Farmers, DFT, Extension Officers
July 2012 – June 2015
3 Mill.
3. Occurrence of soil erosion and Loss of soil fertility
Training farmers on soil and` water conservation
Good farming practices e.g. mulching, use of cover crops, terracing and contour farming Use of different soil erosion control measures
Number of farmers trained on soil erosion control measures
Number of hectares with erosion control measures
Farmers, DFT/WFT, Extension Officers
July 2012 – June 2015
4 Mill.
4. Conflicts among water
Formation of water user groups/associations in the catchments
Number of water users’ groups formed
Farmers, DFT/WFT andExtension Officers
July 2012 – June 2015
2 Mill.
83

NO
IDENTIFIED IMPACT
ENHANCEMENT/MITIGATION MEASURES
PERFORMANCE INDICATOR
RESPONSIBILITY
TIME FRAME
COST ESTIMATE
users Equitable allocation of water in the catchments
Reduced number of water conflicts
5. Increase in use of Agrochemicals
Training on the use of IPM methodologies
Number of farmers trained on IPM methodology
Number of farmers adopting IPM methodology
Farmers, DFT/WFT
and Field Extension Officers
July 2012 – June 2015
3 Mill.
6. Environmental pollution (water and air pollution)
Use of Organic fertilizersUse of by laws to protect water sourcesFarmers trainings
Reduced use of agrochemicals.Increased use of organic fertilizersReduced water and air pollutionNumber of training conducted
DALDO, Farmers, Legal officer and Extension officer
July 2012 – June 2016
2 Mill.
84

23.A Environmental and Social Monitoring Plan
No Environmental Component to be Monitored
Method of Monitoring and Sampling Area
Frequency Verifiable indicator Responsibility
1. Increase of water borne diseases
Follow up in Health Centers
Quarterly Number of cases reported and recorded
Extension Officers, Farmers, Health Officers
2. Incidences of bilharziasis Follow up in Health Facilities
Monthly Number of cases recorded
Farmers, DFT/WFT, Extension Officers, Farmers and Health Officers
3. Occurrence of soil erosion Periodic inspection Annually Number of inspections
Farmers, Extension Officers, Project Committee
4. Conflicts among water users Meetings, Visits and interviews
Monthly Number of cases reported
DFT/WFT, Extension Officers, VEOs, Project Committee and PBWO
5. Increase in use of Agrochemicals
Soil analysis, ,Interviews Annually Number of Soil samples analyzed
Farmers, DFT/WFT Extension Officers and Project Committee
6. Environmental pollution (water and air pollution)
Follow up in protection of water source
Annually Number of cases recorded
Farmers, DFT/WFT Extension Officers, Project Committee and Health Officers
85

24. Ikungulyambeshi Irrigation Scheme (Bariadi District Council)
NO
IDENTIFIED IMPACT
ENHANCEMENT/MITIGATION MEASURES
PERFORMANCE INDICATOR
RESPONSIBILITY
TIME FRAME
COST ESTIMATE
1. Increase of salinity in the soil
Training farmers on control measures
Using of drainage furrows to washout salts.
Number of farmers trained on salt control measures
Number of drainage system provided
Soil analysis
DALDO,DFT/WFT, Extension Officers and Project Committee
July 2012 – June 2015
5 Mill.
2. Reduced downstream water flows
Adherence to water permits directive
Volume of water abstracted
Farmers, IA, DFT/WFT
Field Extension Officers and PBWO
July 2012 – June 2015
2 Mill.
3. Increase of water borne diseases
Create awareness on water borne diseases to the Community
Prevention of water borne diseases
Number of water borne diseases reported in the health centre
Farmers, DFT/WFT
Field Extension Officers
Medical officer and legal officer
July 2012 – June 2015
3 Mill.
4. Increase in cases of
Create awareness on water borne diseases to the
Number of malaria cases
Farmers, DFT/WFT and
July 2012 – June
3 Mill.
86

NO
IDENTIFIED IMPACT
ENHANCEMENT/MITIGATION MEASURES
PERFORMANCE INDICATOR
RESPONSIBILITY
TIME FRAME
COST ESTIMATE
Malaria Community Prevention of malaria
reported Field Extension Officers
2015
5. Occurrence of soil erosion and Loss of soil fertility
Training farmers on soil and` water conservation
Training farmers on water management
Use of different soil erosion control measures
Number of farmers trained on soil erosion control measures
Number of hectares with erosion control measures
DED, Farmers, DFT/WFT, Extension Officers
July 2012 – June 2015
6 Mill.
6. Conflicts among water users
Formation of water user groups/associations in the catchments
Equitable allocation of water between stakeholders
Number of water users’ groups formed in the catchments
Reduced number of water conflicts
Farmers, DFT/WFT
Extension Officers for the scheme
July 2012 – June 2015
3 Mill.
7. Environmental pollution (water and air pollution)
Use of Organic fertilizers
Use of by laws to protect water sources.
Farmers trainings
Reduced use of agrochemicals
Increased use of organic fertilizers
Reduced water and air pollution
DALDO, Farmers, Legal officer, Extension officer
July 2012 – June 2016
1 Mill.
87

NO
IDENTIFIED IMPACT
ENHANCEMENT/MITIGATION MEASURES
PERFORMANCE INDICATOR
RESPONSIBILITY
TIME FRAME
COST ESTIMATE
Number of training conducted
24.A Environmental and Social Monitoring Plan
88

NO ENVIRONMENTAL COMPONENT TO BE MONITORED
METHOD OF MONITORING AND SAMPLING AREA
FREQUENCY
VERIFIABLE INDICATOR
RESPONSIBILITY
1. Increase in soil salinity Soil analysis, Interviews Quarterly Number of Soil samples analyzed
Farmers, DFT, Extension Officers and Project Committee
2. Reduced downstream water flows
Measurement of flows Annually Volume of water abstracted
DFT/WFT, Extension Officers, Irrigators Association, PBWO and Farmers
3. Increase in cases of Malaria Follow up in Health Centers
Monthly Number of cases reported and recorded
DFT/WFT, Extension Officers, Project Committee and Health Officers
4. Increase of water borne diseases
Follow up in Health Centers
Monthly Number of cases recorded
DFT/WFT, Extension Officers, Project Committee and Health Officers
5. Occurrence of soil erosion Periodic inspection Annually Number of inspections
DFT/WFT and Extension Officers, Project Committee, and farmers
6. Conflicts among water users Meetings, Visits and interviews
Monthly Number of cases reported and recorded
DFT/WFT, Extension Officers, VEOs, Project Committee and PBWO
25. Kyota Irrigation Scheme (Muleba District Council)
89

NO IDENTIFIED IMPACT
ENHANCEMENT/MITIGATION MEASURES
PERFORMANCE INDICATOR
RESPONSIBILITY
TIME FRAME
COST ESTIMATE
1. Increase of water borne diseases
Create awareness on water borne diseases to the Community
Prevention of water borne diseases
Use of by laws to protect water sources.
Number of water borne diseases reported in the health centre
Farmers, DFT/WFT
Field Extension Officers
Medical officers and legal officer
July 2012 – June 2015
4 Mill.
2. Incidences of bilharziasis
Training on control of bilharziasis
Improved drainage system Use of preventive medicines General cleaning of furrows
every season
Cleanliness of the furrow /Scheme every season
Number of bilharziasis cases
reported Number of
farmers trained
DED, Farmers, DFT, Extension Officers
July 2012 – June 2015
3 Mill.
3. Occurrence of soil erosion and Loss of soil fertility
Training farmers on soil and` water conservation
Good farming practices eg mulching, use of cover crops, terracing and contour farming Use of different soil erosion control measures
Number of farmers trained on soil erosion control measures
Number of hectares with erosion control measures
Farmers, DFT/WFT, Extension Officers
July 2012 – June 2015
4 Mill.
4. Conflicts among water
Formation of water user groups/associations in the
Number of water users’
Farmers, DFT/WFT and
July 2012 – 5 Mill.
90

NO IDENTIFIED IMPACT
ENHANCEMENT/MITIGATION MEASURES
PERFORMANCE INDICATOR
RESPONSIBILITY
TIME FRAME
COST ESTIMATE
users catchments Equitable allocation of water
groups formed in the catchments
Reduced number of water conflicts
Extension Officers June 2015
5. Increase in use of Agrochemicals
Training on the use of IPM methodologies
Number of farmers trained on IPM methodology
Number of farmers adopting IPM methodology
Farmers, DFT/WFT
and Field Extension Officers
July 2012 – June 2015
3 Mill.
6. Environmental pollution (water and Soil pollution)
Use of Organic fertilizers
Use of by laws to protect water sources.
Farmers trainings
Reduced use of agrochemicals.
Increased use of organic fertilizers
Reduced water and air pollution
Number of training conducted
DALDO, Farmers, Legal officer and Extension officer.
July 2012 – June 2016
2 Mill.
25.A Environmental and Social Monitoring Plan
91

No Environmental Component to be Monitored
Method of Monitoring and Sampling Area
Frequency Verifiable indicator Responsibility
1. Increase of water borne diseases
Follow up in Health Centers
Quarterly Number of cases reported and recorded
Extension Officers, Farmers, Health Officers
2. Incidences of bilharziasis Follow up in Health Facilities
Monthly Number of cases recorded
Farmers, DFT/WFT, Extension Officers, Farmers and Health Officers
3. Occurrence of soil erosion Periodic inspection Annually Number of inspections
Farmers, Extension Officers, Project Committee
4. Conflicts among water users Meetings, Visits and interviews
Monthly Number of cases reported
DFT/WFT ,Extension Officers ,VEOs, Project Committee and PBWO
5. Increase in use of Agrochemicals
Soil analysis, ,Interviews Annually Number of Soil samples analyzed
Farmers, DFT/WFT Extension Officers and Project Committee
6. Environmental pollution (water and air pollution)
Follow up in protection of water source
Annually Number of cases recorded
Farmers, DFT/WFT Extension Officers, Project Committee and Health Officers
26. Buligi Irrigation Scheme (Muleba District Council)
92

NO
IDENTIFIED IMPACT
ENHANCEMENT/MITIGATION MEASURES
PERFORMANCE INDICATOR
RESPONSIBILITY
TIME FRAME
COST ESTIMATE
1. Increase of salinity in the soil
Training farmers on control measures
Using of drainage furrows to washout salts
Number of farmers trained on salt control measures
Number of drainage system provided
Soil analysis
DALDO,DFT/WFT, Extension Officers and Project Committee
July 2012 – June 2015
2 Mill.
2. Reduced downstream water flows
Adherence to water permits directive
Volume of water abstracted
Farmers, IA, DFT/WFT
Field Extension Officers and PBWO
July 2012 – June 2015
1 Mill.
3. Increase of water borne diseases
Create awareness on water borne diseases to the Community
Prevention of water borne diseases
Number of water borne diseases reported in the health centre
Farmers, DFT/WFT
Field Extension Officers
Medical officer and legal officer
July 2012 – June 2015
3 Mill.
4 Increase in cases of Malaria
Create awareness on water borne diseases to the Community
Prevention of malaria
Number of malaria cases reported
Farmers, DFT/WFT andField Extension Officers
July 2012 – June 2015
3 Mill.
93

NO
IDENTIFIED IMPACT
ENHANCEMENT/MITIGATION MEASURES
PERFORMANCE INDICATOR
RESPONSIBILITY
TIME FRAME
COST ESTIMATE
5. Occurrence of soil erosion and Loss of soil fertility
Training farmers on soil and` water conservation
Training farmers on water management
Use of different soil erosion control measures
Number of farmers trained on soil erosion control measures
Number of hectares with erosion control measures
DED, Farmers, DFT/WFT, Extension Officers
July 2012 – June 2015
7 Mill.
6. Conflicts among water users
Formation of water user groups/associations in the catchments
Equitable allocation of water between stakeholders
Number of water users’ groups formed in the catchments
Reduced number of water conflicts
Farmers, DFT/WFT
Extension Officers for the scheme
July 2012 – June 2015
4 Mill.
7. Environmental pollution (water and air pollution)
Use of Organic fertilizers
Use of by laws to protect water sources
Farmers trainings
Reduced use of agrochemicals.
Increased use of organic fertilizers
Reduced water and air pollution
DALDO, Farmers, Legal officer, Extension officer
July 2012 – June 2016
7 Mill.
94

NO
IDENTIFIED IMPACT
ENHANCEMENT/MITIGATION MEASURES
PERFORMANCE INDICATOR
RESPONSIBILITY
TIME FRAME
COST ESTIMATE
Number of training conducted
26.A Environmental and Social Monitoring Plan
95

NO ENVIRONMENTAL COMPONENT TO BE MONITORED
METHOD OF MONITORING AND SAMPLING AREA
FREQUENCY VERIFIABLE INDICATOR
RESPONSIBILITY
1. Increase in soil salinity Soil analysis, Interviews Quarterly Number of Soil samples analyzed
Farmers, DFT, Extension Officers and Project Committee
2. Reduced downstream water flows
Measurement of flows Annually Volume of water abstracted
DFT/WFT, Extension Officers, Irrigators Association, PBWO and Farmers
3. Increase in cases of Malaria Follow up in Health Centers
Monthly Number of cases reported and recorded
DFT/WFT, Extension Officers, Project Committee and Health Officers
4. Increase of water borne diseases
Follow up in Health Centers
Monthly Number of cases recorded
DFT/WFT, Extension Officers, Project Committee and Health Officers
5. Occurrence of soil erosion Periodic inspection Annually Number of inspections
DFT/WFT and Extension Officers, Project Committee, and farmers
6. Conflicts among water users Meetings, Visits and interviews
Monthly Number of cases reported and recorded
DFT/WFT, Extension Officers, VEOs, Project Committee and PBWO
VI. MTWARA ZONE
96

27. Kitere Irrigation Scheme (Mtwara Rural District Council)
No
Identified Impact
Enhancement/Mitigation Measures
Performance Indicator Responsibility Time frame Cost Estimate
1. Increase of salinity in the soil
Training farmers on control measures
Using of drainage furrows to washout salts
Number of farmers trained on salt control measures
Number of drainage system provided
Soil analysis
DALDO,DFT/WFT, Extension Officers and Project Committee
July 2012 – June 2015
3 Mill.
2. Reduced downstream water flows
Adherence to water permits directive
Volume of water abstracted
Farmers, IA, DFT/WFTField Extension Officers and PBWO
July 2012 – June 2015
2 Mill.
3. Increase of water borne diseases
Create awareness on water borne diseases to the Community
Prevention of water borne diseases
Number of water borne diseases reported in the health centre
Farmers, DFT/WFTField Extension OfficersMedical officer and legal officer
July 2012 – June 2015
1 Mill.
4. Increase in cases of Malaria
Create awareness on water borne diseases to the Community
Prevention of malaria
Number of malaria cases reported
Farmers, DFT/WFT andField Extension Officers
July 2012 – June 2015
2 Mill.
5. Occurrence of soil erosion and Loss of soil fertility
Training farmers on soil and` water conservation
Training farmers on
Number of farmers trained on soil erosion control measures
DED, Farmers, DFT/WFT, Extension Officers
July 2012 – June 2015
2 Mill.
97

No
Identified Impact
Enhancement/Mitigation Measures
Performance Indicator Responsibility Time frame Cost Estimate
water management Use of different soil
erosion control measures
Number of hectares with erosion control measures
6. Conflicts among water users
Formation of water user groups/associations in the catchments
Equitable allocation of water between stakeholders
Number of water users’ groups formed in the catchments
Reduced number of water conflicts
Farmers, DFT/WFT
Extension Officers for the scheme
July 2012 – June 2015
3 Mill.
7. Environmental pollution (water and air pollution)
Use of Organic fertilizers
Use of by laws to protect water sources
Farmers trainings
Reduced use of agrochemicals.
Increased use of organic fertilizers
Reduced water and air pollution
Number of training conducted
DALDO, Farmers, Legal officer, Extension officer
July 2012 – June 2016
1 Mill.
27.A Environmental and Social Monitoring Plan
98

No Environmental Component to be Monitored
Method of Monitoring and Sampling Area
Frequency Verifiable indicator Responsibility
1. Increase in incidences of insects and pests
Periodic inspection Weekly Number of inspections
DFT/WFT and Extension Officers, Project Committee
2.Increase of water borne diseases
Follow up in Health Facilities
Monthly Number of cases recorded
DFT/WFT and Extension Officers, Project Committee, Health Officers
3. Increase in soil salinity and soil erosion
Soil analysis, Interviews
Periodic inspection
Quarterly Number of Soil samples analyzedNumber of inspections
DFT/WFT and Extension Officers, Project Committee, MZIU
4. Increase in cases of Malaria Follow up in Health Facilities
Monthly Number of cases recorded
DFT/WFT and Extension Officers, Project Committee, Health Officers
5. Conflicts among water users Meetings, Visits and interviews
Monthly Number of cases recorded
DFT/WFT, Extension Officers VEOs, Project Committee, RBWO, MZIU
6. Increase in use of Agrochemicals
Soil analysis, Interviews Annually Number of Soil samples analyzed
DFT/WFT and Extension Officers, Project Committee
7. Reduced downstream water flows
Measurement of flows Annually Volume of water abstracted
DFT/WFT and Extension Officers, Project Committee, RBWO,MZIU
8. Population influx resulting into increased cases of HIV
Follow up in Health Facilities, Interviews
Annually Number of cases recorded
DFT/WFT and Extension Officers, Project
99

28. Lundo Irrigation Scheme (Mtwara Rural District Council)
No
Identified Impact
Enhancement/Mitigation Measures
Performance Indicator Responsibility Time frame Cost Estimate
1. Increase of salinity in the soil
Training farmers on control measures
Using of drainage furrows to washout salts
Number of farmers trained on salt control measures
Number of drainage system provided
Soil analysis
DALDO,DFT/WFT, Extension Officers and Project Committee
July 2012 – June 2015
5 mill.
2. Reduced downstream water flows
Adherence to water use permits
Volume of water abstracted
Farmers, IA, DFT/WFT
Field Extension Officers and PBWO
July 2012 – June 2015
1 mill.
3. Increase of water borne diseases
Create awareness on water borne diseases to the Community
Prevention of water borne diseases
Number of water borne diseases reported in the health centre
Farmers, DFT/WFT
Field Extension Officers
Medical officer and legal officer
July 2012 – June 2015
2 Mill.
4 Increase in cases of Malaria
Create awareness on water borne diseases
Number of malaria cases reported
Farmers, DFT/WFT and
July 2012 – 2 Mill.
100

No
Identified Impact
Enhancement/Mitigation Measures
Performance Indicator Responsibility Time frame Cost Estimate
to the Community Prevention of malaria
Field Extension Officers
June 2015
5. Occurrence of soil erosion and Loss of soil fertility
Training farmers on soil and` water conservation
Training farmers on water management
Use of different soil erosion control measures
Number of farmers trained on soil erosion control measures
Number of hectares with erosion control measures
DED, Farmers, DFT/WFT, Extension Officers
July 2012 – June 2015
2 Mill.
6. Conflicts among water users
Formation of water user groups/associations in the catchments
Equitable allocation of water between stakeholders
Number of water users’ groups formed in the catchments
Reduced number of water conflicts
Farmers, DFT/WFT
Extension Officers for the scheme
July 2012 – June 2015
5 Mill.
7. Environmental pollution (water and air pollution)
Use of Organic fertilizers
Use of by laws to protect water sources
Farmers trainings
Reduced use of agrochemicals.
Increased use of organic fertilizers
Reduced water and air pollution
DALDO, Farmers, Legal officer, Extension officer
July 2012 – June 2016
1 mill.
101

No
Identified Impact
Enhancement/Mitigation Measures
Performance Indicator Responsibility Time frame Cost Estimate
Number of training conducted
28.A Environmental and Social Monitoring Plan
102

No Environmental Component to be Monitored
Method of Monitoring and Sampling Area
Frequency Verifiable indicator Responsibility
1. Increase in incidences of insects and pests
Periodic inspection Weekly Number of inspections
DIDT/WFT and Extension Officers, Project Committee
2.
Increase of water borne diseases
Follow up in Health Facilities
Monthly Number of cases recorded
DIDT/WFT and Extension Officers, Project Committee, Health Officers
3. Increase in soil salinity and soil erosion
Soil analysis, ,Interviews
Periodic inspection
Quarterly Number of Soil samples analyzed
Number of inspections
DIDT/WFT and Extension Officers, Project Committee, MZIU
4. Increase in cases of Malaria Follow up in Health Facilities
Monthly Number of cases recorded
DIDT/WFT and Extension Officers, Project Committee, Health Officers
5. Conflicts among water users Meetings, Visits and interviews
Monthly Number of cases recorded
DIDT/WFT, Extension Officers VEOs, Project Committee, RBWO,MZIU
6. Increase in use of Agrochemicals
Soil analysis, ,Interviews Annually Number of Soil samples analyzed
DIDT/WFT and Extension Officers, Project Committee
7. Reduced downstream water Measurement of flows Annually Volume of water DIDT/WFT and Extension 103

29. Misyaje Irrigation Scheme (Tunduru District Council)
No Identified Impact
Enhancement/Mitigation Measures
Performance Indicator Responsibility Time frame
Cost Estimate
1. Increase of water borne diseases
- Create awareness on water borne diseases to the Community
- Prevention of water borne diseases
Number of water borne diseases reported
Irrigators, DFT/WFTField Extension Officers
July 2011 to June 2013
2,000,000
2. Increase in incidences of pests
- Training on Proper use of pesticides
- Use of IPM methodologies Introduction of pest resistant varieties
Number of farmers trained and practicing the technology
Number of farmers adopting IPM methodology
Types of resistant varieties introduced
Number of acreage planted resistant varieties
Farmers, DFT/WFT
Field Extension Officers
July 2011 to June 2013
1,500,000
3. Occurrence of soil erosion
- Training on soil and` water conservation
- Training on water management
- Use of soil erosion control measures
Number of farmers trained
Reduced numbers of gullies
Number of acres with erosion control measures
Farmers, DFT/WFT
Field Extension Officers
July 2011 – June 2014
4. Increase in use of Agrochemicals
- Training on the use of - IPM methodologies - Introduction of pest
Number of farmers adopting IPM methodology
Farmers, DFT/WFT
July 2011 – June 2014
2,000,000
104

No Identified Impact
Enhancement/Mitigation Measures
Performance Indicator Responsibility Time frame
Cost Estimate
resistant varieties Types of resistant varieties introduced
Number of acreage planted resistant varieties
Field Extension Officers
5. Population influx resulting into increased cases of HIV
- Awareness creation on HIV/AIDS
Number of new HIV/AIDS Cases reported
Farmers, DFT/WFT
Field Extension Officers
July 2011 – June 2013
3,000,000
6. Reduced downstream water flows
- Adherence to water permits directive
Number of conflicts cases reduce Volume of water abstracted
Farmers, DFT/WFT
Field Extension Officers, BWO
July 2011 – June 2013
29.A Environmental and Social Monitoring Plan
105

No Environmental Component to be Monitored
Method of Monitoring and Sampling Area
Frequency Verifiable indicator
Responsibility
1 Increase of water borne diseases
Follow up in Health Facilities
Monthly Number of cases recorded
DFT/WFT and Extension Officers, IO Leaders, Health Officers
2 Increase in incidences of pests
Periodic inspection Weekly Number of inspections
DFT/WFT and Extension Officers, IO Committee
3 Occurrence of soil erosion Periodic inspection Annually Number of inspections
DFT/WFT and Extension Officers, IO Committee
4 Increase in use of Agrochemicals
Soil analysis, ,Interviews Annually Number of Soil samples analyzed
DFT/WFT and Extension Officers, Project Committee
5 Population influx resulting into increased cases of HIV
Follow up in Health Facilities, Interviews
Annually Number of cases recorded
DFT/WFT and Extension Officers, IO Committee, Health Officers
6 Reduced downstream water flows
Measurement of flows Annually Volume of water abstracted
DFT/WFT and Extension Officers, IO Committee
30. Subira Irrigarion Scheme (Songea Municipality)
Potential Environmental Impact
Possible Main cause Proposed Mitigation Measure
Physical
Changes in downstream aquatic environment
Absence of environmental flows that are needed for maintaining the downstream ecosystem.
Designs should ensure that the normal environmental flows are maintained for the ecosystem downstream
Construction phase
106

Physical/BiologicalLand degradation Bush clearing to give way for the
construction of various irrigation structures
Minimum vegetation clearing should be allowed and areas greatly affected should be re-vegetated to revert them to near natural condition
Soil compaction Construction equipment and machinery Soil compaction should be kept at a minimum to avoid turning soils into marginal lands
Effect on quantity and quality of river flow
Construction equipment and machinery Oils and lubricants from equipment and machinery should not be allowed to enter the river system
Social/Economic
Effect on other downstream water users
Construction activities Need to ensure availability of water for downstream users during construction phase
Temporally settlement in the catchment area close to the fields.
longer walking distance to the fields Avoid encroachment in the catchment area. People should not establish permanent settlement near the fields
Operation phase Physical/Biological
Catchments degradation Increase in human activities in the catchments area
Restricting human activities eg. Temporally settlement in the catchments area
Erosion of earth irrigation canals Improper design and construction of irrigation canals
Designs should ensure that irrigation canals are stable and lining of weak points vulnerable to erosion
Poor accessibility in the study area during the rainy season
Presence of depressions and gulley sport improvement of the access road and cross bridges
Effect on irrigation field soil quality and water quality for downstream users
Mishandling and improper use of agrochemicals
Proper handling and proper application rates of agrochemicals.
Use of natural fertilizers where feasible
107

Social/Economic
Effect on household economies Improved irrigation activities Enhance proper irrigation farming
Water use conflicts between up-stream and down-stream users
Increase in demand for water among various user groups
Adequate water management practices and participatory conflict resolution measures between users
Effect on public health Presence of a breeding ground (water surface) for disease causing vectors such as mosquitoes (including borrow pits)
Health and sanitation education to the community; regular cleaning of canals; avoidance of unnecessary stagnant water contact and wise use of borrow pits
108

VII. TABORA ZONE
31. Mwamapuli Irrigation Scheme (IGUNGA District Council)
No
Identified Impact
Enhancement/Mitigation Measures
Performance Indicator Responsibility Time frame COST ESTMATES
1. Increase in incidences of insects and pests
Training on Proper use of pesticides
Use of IPM methodologies Introduction of pest resistant varieties
Number of farmers trained and practicing the technology
Number of farmers adopting IPM methodology
Farmers, DFT/WFT
Field Extension Officers
July 2012 – June 2014
3,700,000/=
2. Increase of water borne diseases
Create awareness on water borne diseases to the Community
Prevention of water borne diseases
Number of water borne diseases reported
Farmers, DFT/WFT
Field Extension Officers
July 2012 – June 2014
2,000,000/=
3. Occurrence of soil erosion
Training on soil and` water conservation
Training on water management
Use of soil erosion control measures
Number of farmers trained
Number of farmers trained
Number of acres with erosion control measures
Farmers, DFT/WFT
Field Extension Officers
July 2012 – June 2014
2,000,000/=
4. Increase in cases of Malaria
Create awareness on the disease to the Community
Reduce water pondage
Number of malaria cases reported
Farmers, DFT/WFT
Field Extension Officers
July 2012 – June 2014
3,000,000/=
109

No
Identified Impact
Enhancement/Mitigation Measures
Performance Indicator Responsibility Time frame COST ESTMATES
5. Increase in use of Agrochemicals
Training on the use of IPM methodologies
Introduction of pest resistant varieties
Number of farmers adopting IPM methodology
Types of resistant varieties introduced
Number of acreage planted resistant varieties
Farmers, DFT/WFT
Field Extension Officers
July 2012 – June 2014
3,550,000/=
6. Conflicts among water users
Formation of water user association and irrigators Organization
Equitable allocation of water
Number of water users’ groups formed
Reduced number of water conflicts
Farmers, DFT/WFT
Field Extension Officers, PBWO, TZITSU
July 2012 – June 2014
2,000,000/=
7 Reduced downstream water flows
Adherence to water permits directive
Volume of water abstracted
Farmers, DFT/WFT
Field Extension Officers, PBWO
July 2012 – June 2014
3,000,000/=
8. Population influx resulting into increased cases of HIV
Awareness creation on HIV/AIDS
Number of new HIV/AIDS Cases reported
Farmers, DFT/WFT
Field Extension Officers
July 2012 – June 2014
2,000,000/=
110

31.A Environmental and Social Monitoring Plan
111

No Environmental Component to be Monitored
Method of Monitoring and Sampling Area
Frequency Verifiable indicator Responsibility
1. Increase in incidences of insects and pests
Periodic inspection Weekly Number of inspections
DFT/WFT and Extension Officers, Project Committee
2. Increase of water borne diseases
Follow up in Health Facilities
Monthly Number of cases recorded
DFT/WFT and Extension Officers, Project Committee, Health Officers
3. Occurrence of soil erosion Periodic inspection Annually Number of inspections
DFT/WFT and Extension Officers, Project Committee
4. Increase in cases of Malaria Follow up in Health Facilities
Monthly Number of cases recorded
DFT/WFT and Extension Officers, Project Committee, Health Officers
5. Increase in use of Agrochemicals
Soil analysis, ,Interviews Annually Number of Soil samples analyzed
DFT/WFT and Extension Officers, Project Committee
6. Conflicts among water users Meetings, Visits and interviews
Monthly Number of cases recorded
DFT/WFT, Extension Officers, VEOs, Project Committee, PBWO,TZITSU
7. Reduced downstream water flows
Measurement of flows Annually Volume of water abstracted
DFT/WFT and Extension Officers, Project Committee, PBWO, TZITSU
8. Population influx resulting into increased cases of HIV
Follow up in Health Facilities, Interviews
Annually Number of cases recorded
DFT/WFT and Extension Officers, Project
112

32. Basanza Irrigation Scheme (UVINZA District Council)
No
Identified Impact
Enhancement/Mitigation Measures
Performance Indicator Responsibility Time frame COST ESTMATES
1. Increase in incidences of insects and pests
Training on Proper use of pesticides
Use of IPM methodologies Introduction of pest resistant varieties
Number of farmers trained and practicing the technology
Number of farmers adopting IPM methodology
Farmers, DFT/WFT
Field Extension Officers
July 2012 – June 2014
1,400,000/=
2. Increase of water borne diseases
Create awareness on water borne diseases to the Community
Prevention of water borne diseases
Number of water borne diseases reported
Farmers, DFT/WFT
Field Extension Officers
July 2012 – June 2014
2,000,000/=
3. Occurrence of soil erosion
Training on soil and` water conservation
Training on water management
Use of soil erosion control measures
Number of farmers trained
Number of farmers trained
Number of acres with erosion control measures
Farmers, DFT/WFT
Field Extension Officers
July 2012 – June 2014
7,000,000/=
4. Increase in cases of Malaria
Create awareness on the disease to the Community
Reduce water pondage
Number of malaria cases reported
Farmers, DFT/WFT
Field Extension Officers
July 2012 – June 2014
3,000,000/=
113

No
Identified Impact
Enhancement/Mitigation Measures
Performance Indicator Responsibility Time frame COST ESTMATES
5. Increase in use of Agrochemicals
Training on the use of IPM methodologies
Introduction of pest resistant varieties
Number of farmers adopting IPM methodology
Types of resistant varieties introduced
Number of acreage planted resistant varieties
Farmers, DFT/WFT
Field Extension Officers
July 2012 – June 2014
4,100,000/=
6. Conflicts among water users
Formation of water user association and irrigators Organization
Equitable allocation of water
Number of water users’ groups formed
Reduced number of water conflicts
Farmers, DFT/WFT
Field Extension Officers PBWO, TZITSU
July 2012 – June 2014
2,550,000/=
7 Reduced downstream water flows
Adherence to water permits directive
Volume of water abstracted
Farmers, DFT/WFT
Field Extension Officers, PBWO
July 2012 – June 2014
3,000,000/=
8. Population influx resulting into increased cases of HIV
Awareness creation on HIV/AIDS
Number of new HIV/AIDS Cases reported
Farmers, DFT/WFT
Field Extension Officers
July 2012 – June 2014
2,000,000/=
114

32.A Environmental and Social Monitoring Plan
115

No Environmental Component to be Monitored
Method of Monitoring and Sampling Area
Frequency Verifiable indicator Responsibility
1. Increase in incidences of insects and pests
Periodic inspection Weekly Number of inspections
DFT/WFT and Extension Officers, Project Committee
2. Increase of water borne diseases
Follow up in Health Facilities
Monthly Number of cases recorded
DFT/WFT and Extension Officers, Project Committee, Health Officers
3. Occurrence of soil erosion Periodic inspection Annually Number of inspections
DFT/WFT and Extension Officers, Project Committee
4. Increase in cases of Malaria Follow up in Health Facilities
Monthly Number of cases recorded
DFT/WFT and Extension Officers, Project Committee, Health Officers
5. Increase in use of Agrochemicals
Soil analysis, ,Interviews Annually Number of Soil samples analyzed
DFT/WFT and Extension Officers, Project Committee
6. Conflicts among water users Meetings, Visits and interviews
Monthly Number of cases recorded
DFT/WFT ,Extension Officers, VEOs, Project Committee, PBWO, TZITSU
7. Reduced downstream water flows
Measurement of flows Annually Volume of water abstracted
DFT/WFT and Extension Officers, Project Committee, PBWO, TZITSU
8. Population influx resulting into increased cases of HIV
Follow up in Health Facilities, Interviews
Annually Number of cases recorded
DFT/WFT and Extension Officers, Project
116

33. Makomelo Irrigation Scheme (IGUNGA District Council)
No
Identified Impact
Enhancement/Mitigation Measures
Performance Indicator Responsibility Time frame COST ESTMATES
1. Increase in incidences of insects and pests
Training on Proper use of pesticides
Use of IPM methodologies Introduction of pest resistant varieties
Number of farmers trained and practicing the technology
Number of farmers adopting IPM methodology
Farmers, DFT/WFTField Extension Officers
July 2012 – June 2014
1,700,000/=
2. Increase of water borne diseases
Create awareness on water borne diseases to the Community
Prevention of water borne diseases
Number of water borne diseases reported
Farmers, DFT/WFTField Extension Officers
July 2012 – June 2014
100,000/=
3. Occurrence of soil erosion
Training on soil and` water conservation
Training on water management
Use of soil erosion control measures
Number of farmers trained
Number of farmers trained
Number of acres with erosion control measures
Farmers, DFT/WFTField Extension Officers
July 2012 – June 2014
900,000/=
4. Increase in Create awareness on the disease to the
Number of malaria cases reported
Farmers, July 2012 – 1,000,000/=
117

No
Identified Impact
Enhancement/Mitigation Measures
Performance Indicator Responsibility Time frame COST ESTMATES
cases of Malaria Community Reduce water
pondage
DFT/WFTField Extension Officers
June 2014
5. Increase in use of Agrochemicals
Training on the use of IPM methodologies Introduction of pest
resistant varieties
Number of farmers adopting IPM methodology
Types of resistant varieties introduced
Number of acreage planted resistant varieties
Farmers, DFT/WFTField Extension Officers
July 2012 – June 2014
5,550,000/=
6. Conflicts among water users
Formation of water user association and irrigators Organization
Equitable allocation of water
Number of water users’ groups formed
Reduced number of water conflicts
Farmers, DFT/WFTField Extension Officers, PBWO, TZITSU
July 2012 – June 2014
4,000,000/=
7 Reduced downstream water flows
Adherence to water permits directive
Volume of water abstracted
Farmers, DFT/WFTField Extension Officers, PBWO
July 2012 – June 2014
4,000,000/=
8. Population influx resulting into increased cases of HIV
Awareness creation on HIV/AIDS
Number of new HIV/AIDS Cases reported
Farmers, DFT/WFTField Extension Officers
July 2012 – June 2014
2,000,000/=
118
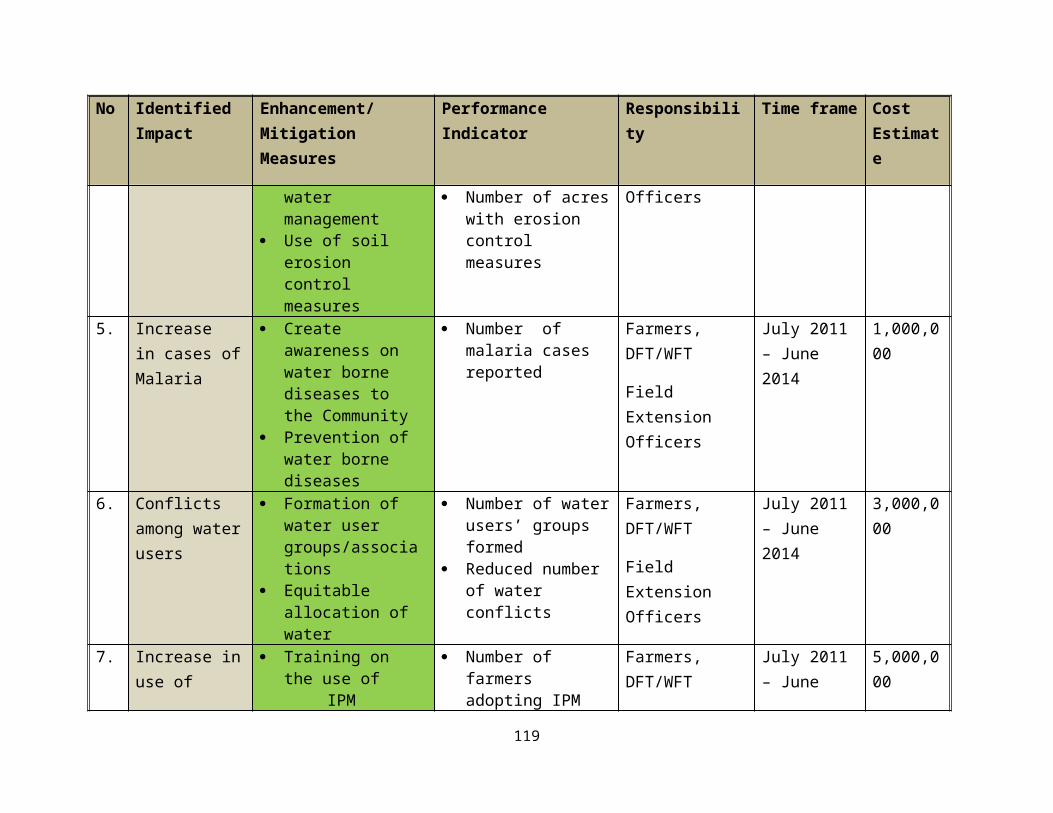
119

33.A Environmental and Social Monitoring Plan
120

No Environmental Component to be Monitored
Method of Monitoring and Sampling Area
Frequency Verifiable indicator Responsibility
1. Increase in incidences of insects and pests
Periodic inspection Weekly Number of inspections
DFT/WFT and Extension Officers, Project Committee
2. Increase of water borne diseases
Follow up in Health Facilities
Monthly Number of cases recorded
DFT/WFT and Extension Officers, Project Committee, Health Officers
3. Occurrence of soil erosion Periodic inspection Annually Number of inspections
DFT/WFT and Extension Officers, Project Committee
4. Increase in cases of Malaria Follow up in Health Facilities
Monthly Number of cases recorded
DFT/WFT and Extension Officers, Project Committee, Health Officers
5. Increase in use of Agrochemicals
Soil analysis, ,Interviews Annually Number of Soil samples analyzed
DFT/WFT and Extension Officers, Project Committee,
6. Conflicts among water users Meetings, Visits and interviews
Monthly Number of cases recorded
DFT/WFT ,Extension Officers, VEOs, Project Committee, PBWO, TZITSU
7. Reduced downstream water flows
Measurement of flows Annually Volume of water abstracted
DFT/WFT and Extension Officers, Project
121

122

34. Choma cha Nkola Irrigation Scheme (IGUNGA District Council
No
Identified Impact
Enhancement/Mitigation Measures
Performance Indicator Responsibility Time frame COST ESTMATES
1. Increase in incidences of insects and pests
Training on Proper use of pesticides
Use of IPM methodologies Introduction of pest resistant varieties
Number of farmers trained and practicing the technology
Number of farmers adopting IPM methodology
Farmers, DFT/WFT
Field Extension Officers
July 2012 – June 2014
1,700,000/=
2. Increase of water borne diseases
Create awareness on water borne diseases to the Community
Prevention of water borne diseases
Number of water borne diseases reported
Farmers, DFT/WFT
Field Extension Officers
July 2012 – June 2014
1,000,000/=
3. Occurrence of soil erosion
Training on soil and` water conservation
Training on water management
Use of soil erosion control measures
Number of farmers trained
Number of farmers trained
Number of acres with erosion control measures
Farmers, DFT/WFT
Field Extension Officers
July 2012 – June 2014
900,000/=
4. Increase in cases of Malaria
Create awareness on the disease to the Community
Reduce water pondage
Number of malaria cases reported
Farmers, DFT/WFT
Field Extension Officers
July 2012 – June 2014
2,000,000/=
123

No
Identified Impact
Enhancement/Mitigation Measures
Performance Indicator Responsibility Time frame COST ESTMATES
5. Increase in use of Agrochemicals
Training on the use of IPM methodologies
Introduction of pest resistant varieties
Number of farmers adopting IPM methodology
Types of resistant varieties introduced
Number of acreage planted resistant varieties
Farmers, DFT/WFT
Field Extension Officers
July 2012 – June 2014
5,550,000/=
6. Conflicts among water users
Formation of water user association and irrigators Organization
Equitable allocation of water
Number of water users’ groups formed
Reduced number of water conflicts
Farmers, DFT/WFT
Field Extension Officers PBWO,TZITSU
July 2012 – June 2014
4,000,000/=
7 Reduced downstream water flows
Adherence to water permits directive
Volume of water abstracted
Farmers, DFT/WFT
Field Extension Officers, PBWO
July 2012 – June 2014
4,000,000/=
8. Population influx resulting into increased cases of HIV
Awareness creation on HIV/AIDS
Number of new HIV/AIDS Cases reported
Farmers, DFT/WFT
Field Extension Officers
July 2012 – June 2014
2,000,000/=
124

34.A Environmental and Social Monitoring Plan
125

No Environmental Component to be Monitored
Method of Monitoring and Sampling Area
Frequency Verifiable indicator Responsibility
1. Increase in incidences of insects and pests
Periodic inspection Weekly Number of inspections
DFT/WFT and Extension Officers, Project Committee
2. Increase of water borne diseases
Follow up in Health Facilities
Monthly Number of cases recorded
DFT/WFT and Extension Officers, Project Committee, Health Officers
3. Occurrence of soil erosion Periodic inspection Annually Number of inspections
DFT/WFT and Extension Officers, Project Committee
4. Increase in cases of Malaria Follow up in Health Facilities
Monthly Number of cases recorded
DFT/WFT and Extension Officers, Project Committee, Health Officers
5. Increase in use of Agrochemicals
Soil analysis, ,Interviews Annually Number of Soil samples analyzed
DFT/WFT and Extension Officers, Project Committee
6. Conflicts among water users Meetings, Visits and interviews
Monthly Number of cases recorded
DFT/WFT, Extension Officers, VEOs, Project Committee, PBWO, TZITSU
7. Reduced downstream water flows
Measurement of flows Annually Volume of water abstracted
DFT/WFT and Extension Officers, Project Committee, PBWO, TZITSU
8. Population influx resulting Follow up in Health Annually Number of cases DFT/WFT and Extension
126

35. Igigwa irrigation Scheme (SIKONGE District Council)
No
Identified Impact
Enhancement/Mitigation Measures
Performance Indicator Responsibility Time frame COST ESTMATES
1. Increase in incidences of insects and pests
Training on Proper use of pesticides
Use of IPM methodologies Introduction of pest resistant varieties
Number of farmers trained and practicing the technology
Number of farmers adopting IPM methodology
Farmers, DFT/WFTField Extension Officers
July 2012 – June 2014
3,500,000/=
2. Increase of water borne diseases
Create awareness on water borne diseases to the Community
Prevention of water borne diseases
Number of water borne diseases reported
Farmers, DFT/WFTField Extension Officers
July 2012 – June 2014
2,000,000/=
3. Occurrence of soil erosion
Training on soil and` water conservation
Training on water management
Use of soil erosion control measures
Number of farmers trained
Number of farmers trained
Number of acres with erosion control measures
Farmers, DFT/WFTField Extension Officers
July 2012 – June 2014
7,000,000/=
4. Increase in cases of Malaria
Create awareness on the disease to the Community
Reduce water pondage
Number of malaria cases reported
Farmers, DFT/WFT
Field Extension Officers
July 2012 – June 2014
3,000,000/=
5. Increase in use Training on the use of Number of farmers Farmers, July 2012 – 5,000,000/=
127

No
Identified Impact
Enhancement/Mitigation Measures
Performance Indicator Responsibility Time frame COST ESTMATES
of Agrochemicals IPM methodologies
Introduction of pest resistant varieties
adopting IPM methodology
Types of resistant varieties introduced
Number of acreage planted resistant varieties
DFT/WFT
Field Extension Officers
June 2014
6. Conflicts among water users
Formation of water user association and irrigators Organization
Equitable allocation of water
Number of water users’ groups formed
Reduced number of water conflicts
Farmers, DFT/WFTField Extension Officers, PBWO, TZITSU
July 2012 – June 2014
4,000,000/=
7. Reduced downstream water flows
Adherence to water permits directive
Volume of water abstracted
Farmers, DFT/WFT
Field Extension Officers, PBWO
July 2012 – June 2014
4,000,000/=
8. Population influx resulting into increased cases of HIV
Awareness creation on HIV/AIDS
Number of new HIV/AIDS Cases reported
Farmers, DFT/WFT
Field Extension Officers
July 2012 – June 2014
2,000,000/=
35.A Environmental and Social Monitoring Plan
128

129

No Environmental Component to be Monitored
Method of Monitoring and Sampling Area
Frequency Verifiable indicator Responsibility
1. Increase in incidences of insects and pests
Periodic inspection Weekly Number of inspections
DFT/WFT and Extension Officers, Project Committee
2. Increase of water borne diseases
Follow up in Health Facilities
Monthly Number of cases recorded
DFT/WFT and Extension Officers, Project Committee, Health Officers
3. Occurrence of soil erosion Periodic inspection Annually Number of inspections
DFT/WFT and Extension Officers, Project Committee
4. Increase in cases of Malaria Follow up in Health Facilities
Monthly Number of cases recorded
DFT/WFT and Extension Officers, Project Committee, Health Officers
5. Increase in use of Agrochemicals
Soil analysis, ,Interviews Annually Number of Soil samples analyzed
DFT/WFT and Extension Officers, Project Committee
6. Conflicts among water users Meetings, Visits and interviews
Monthly Number of cases recorded
DFT/WFT ,Extension Officers, VEOs, Project Committee, PBWO, TZITSU
7. Reduced downstream water flows
Measurement of flows Annually Volume of water abstracted
DFT/WFT and Extension Officers, Project Committee, PBWO, TZITSU
8. Population influx resulting into increased cases of HIV
Follow up in Health Facilities, Interviews
Annually Number of cases recorded
DFT/WFT and Extension Officers, Project
130

36. Igurubi Irrigation Scheme (IGUNGA District Council)
No
Identified Impact
Enhancement/Mitigation Measures
Performance Indicator Responsibility Time frame COST ESTMATES
1. Increase in incidences of insects and pests
Training on Proper use of pesticides
Use of IPM methodologies Introduction of pest resistant varieties
Number of farmers trained and practicing the technology
Number of farmers adopting IPM methodology
Farmers, DFT/WFT
Field Extension Officers
July 2012 – June 2014
3,700,000/=
2. Increase of water borne diseases
Create awareness on water borne diseases to the Community
Prevention of water borne diseases
Number of water borne diseases reported
Farmers, DFT/WFT
Field Extension Officers
July 2012 – June 2014
3,000,000/=
3. Occurrence of soil erosion
Training on soil and` water conservation
Training on water management
Number of farmers trained
Number of farmers trained
Farmers, DFT/WFT
Field Extension
July 2012 – June 2014
2,000,000/=
131

No
Identified Impact
Enhancement/Mitigation Measures
Performance Indicator Responsibility Time frame COST ESTMATES
Use of soil erosion control measures
Number of acres with erosion control measures
Officers
4. Increase in cases of Malaria
Create awareness on the disease to the Community
Reduce water pondage
Number of malaria cases reported
Farmers, DFT/WFT
Field Extension Officers
July 2012 – June 2014
3,000,000/=
5. Increase in use of Agrochemicals
Training on the use of IPM methodologies
Introduction of pest resistant varieties
Number of farmers adopting IPM methodology
Types of resistant varieties introduced
Number of acreage planted resistant varieties
Farmers, DFT/WFT
Field Extension Officers
July 2012 – June 2014
5,550,000/=
6. Conflicts among water users
Formation of water user association and irrigators Organization
Equitable allocation of water
Number of water users’ groups formed
Reduced number of water conflicts
Farmers, DFT/WFT
Field Extension Officers, PBWO, TZITSU
July 2012 – June 2014
2,000,000/=
132

No
Identified Impact
Enhancement/Mitigation Measures
Performance Indicator Responsibility Time frame COST ESTMATES
7 Reduced downstream water flows
Adherence to water permits directive
Volume of water abstracted
Farmers, DFT/WFT
Field Extension Officers, PBWO
July 2012 – June 2014
4,000,000/=
8. Population influx resulting into increased cases of HIV
Awareness creation on HIV/AIDS
Number of new HIV/AIDS Cases reported
Farmers, DFT/WFT
Field Extension Officers
July 2012 – June 2014
2,000,000/=
36.A Environmental and Social Monitoring Plan
133

No Environmental Component to be Monitored
Method of Monitoring and Sampling Area
Frequency Verifiable indicator Responsibility
1. Increase in incidences of insects and pests
Periodic inspection Weekly Number of inspections
DFT/WFT and Extension Officers, Project Committee
2. Increase of water borne diseases
Follow up in Health Facilities
Monthly Number of cases recorded
DFT/WFT and Extension Officers, Project Committee, Health Officers
3. Occurrence of soil erosion Periodic inspection Annually Number of inspections
DFT/WFT and Extension Officers, Project Committee
4. Increase in cases of Malaria Follow up in Health Facilities
Monthly Number of cases recorded
DFT/WFT and Extension Officers, Project Committee, Health Officers
5. Increase in use of Agrochemicals
Soil analysis, ,Interviews Annually Number of Soil samples analyzed
DFT/WFT and Extension Officers, Project Committee
6. Conflicts among water users Meetings, Visits and interviews
Monthly Number of cases recorded
DFT/WFT, Extension Officers, VEOs, Project Committee, PBWO, TZITSU
7. Reduced downstream water flows
Measurement of flows Annually Volume of water abstracted
DFT/WFT and Extension Officers, Project Committee, PBWO, TZITSU
8. Population influx resulting into increased cases of HIV
Follow up in Health Facilities, Interviews
Annually Number of cases recorded
DFT/WFT and Extension Officers, Project
134

37. Inala Irrigation Scheme (TABORA MUNICIPAL District Council
No Identified Impact
Enhancement/Mitigation Measures
Performance Indicator Responsibility Time frame COST ESTMATES
1. Increase in incidences of insects and pests
Training on Proper use of pesticides
Use of IPM methodologies Introduction of pest resistant varieties
Number of farmers trained and practicing the technology
Number of farmers adopting IPM methodology
Farmers, DFT/WFTField Extension Officers
July 2012 – June 2014
7,000,000/=
2. Increase of water borne diseases
Create awareness on water borne diseases to the Community
Prevention of water borne diseases
Number of water borne diseases reported
Farmers, DFT/WFTField Extension Officers
July 2012 – June 2014
2,000,000/=
3. Occurrence of soil erosion
Training on soil and` water conservation
Training on water management
Use of soil erosion control measures
Number of farmers trained
Number of farmers trained
Number of acres with erosion control measures
Farmers, DFT/WFTField Extension Officers
July 2012 – June 2014
5,000,000/=
4. Increase in cases of Malaria
Create awareness on the disease to the Community
Reduce water pondage
Number of malaria cases reported
Farmers, DFT/WFTField Extension Officers
July 2012 – June 2014
3,000,000/=
5. Increase in use of
Training on the use of IPM methodologies
Number of farmers adopting IPM
Farmers, DFT/WFT
July 2012 – June 2014
6,800,000/=
135

No Identified Impact
Enhancement/Mitigation Measures
Performance Indicator Responsibility Time frame COST ESTMATES
Agrochemicals Introduction of pest resistant varieties
methodology Types of resistant
varieties introduced Number of acreage
planted resistant varieties
Field Extension Officers
6. Conflicts among water users
Formation of water user association and irrigators Organization
Equitable allocation of water
Number of water users’ groups formed
Reduced number of water conflicts
Farmers, DFT/WFTField Extension Officers, PBWO, TZITSU
July 2012 – June 2014
3,000,000/=
7 Reduced downstream water flows
Adherence to water permits directive
Volume of water abstracted
Farmers, DFT/WFTField Extension Officers, PBWO
July 2012 – June 2014
4,000,000/=
8. Population influx resulting into increased cases of HIV
Awareness creation on HIV/AIDS
Number of new HIV/AIDS Cases reported
Farmers, DFT/WFTField Extension Officers
July 2012 – June 2014
2,000,000/=
37.A Environmental and Social Monitoring Plan
136

No Environmental Component to be Monitored
Method of Monitoring and Sampling Area
Frequency Verifiable indicator Responsibility
1. Increase in incidences of insects and pests
Periodic inspection Weekly Number of inspections
DFT/WFT and Extension Officers, Project Committee
2. Increase of water borne diseases
Follow up in Health Facilities
Monthly Number of cases recorded
DFT/WFT and Extension Officers, Project Committee, Health Officers
3. Occurrence of soil erosion Periodic inspection Annually Number of inspections
DFT/WFT and Extension Officers, Project Committee
4. Increase in cases of Malaria Follow up in Health Facilities
Monthly Number of cases recorded
DFT/WFT and Extension Officers, Project Committee, Health Officers
5. Increase in use of Agrochemicals
Soil analysis, ,Interviews Annually Number of Soil samples analyzed
DFT/WFT and Extension Officers, Project Committee
6. Conflicts among water users Meetings, Visits and interviews
Monthly Number of cases recorded
DFT/WFT ,Extension Officers, VEOs, Project Committee, PBWO, TZITSU
38. Itumbiko Irrigation Scheme (KAKONKO District Council)
137
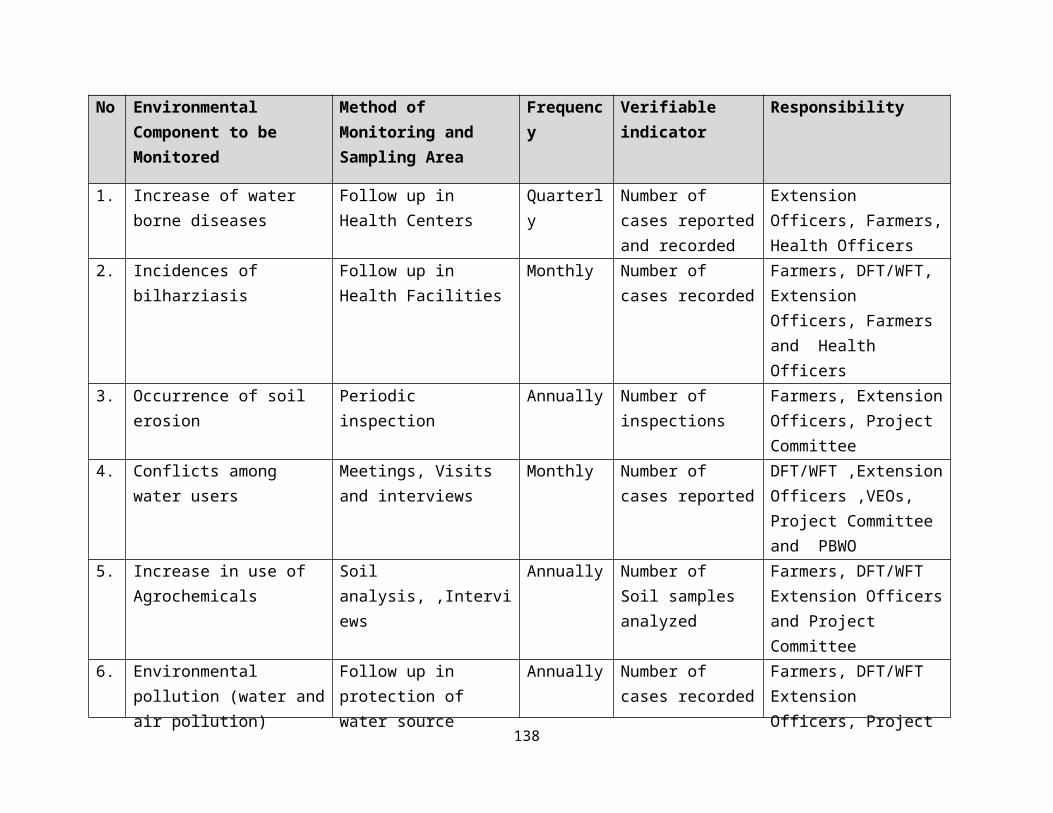
No Identified Impact
Enhancement/Mitigation Measures
Performance Indicator Responsibility Time frame COST ESTMATES
1. Increase in incidences of insects and pests
Training on Proper use of pesticides
Use of IPM methodologies Introduction of pest resistant varieties
Number of farmers trained and practicing the technology
Number of farmers adopting IPM methodology
Farmers, DFT/WFTField Extension Officers
July 2012 – June 2014
3,500,000/=
2. Increase of water borne diseases
Create awareness on water borne diseases to the Community
Prevention of water borne diseases
Number of water borne diseases reported
Farmers, DFT/WFTField Extension Officers
July 2012 – June 2014
2,000,000/=
3. Occurrence of soil erosion
Training on soil and` water conservation
Training on water management
Use of soil erosion control measures
Number of farmers trained
Number of farmers trained
Number of acres with erosion control measures
Farmers, DFT/WFTField Extension Officers
July 2012 – June 2014
1,000,000/=
4. Increase in cases of Malaria
Create awareness on the disease to the Community
Reduce water pondage
Number of malaria cases reported
Farmers, DFT/WFTField Extension Officers
July 2012 – June 2014
3,000,000/=
5. Increase in use of Agrochemicals
Training on the use of IPM methodologies Introduction of pest
resistant varieties
Number of farmers adopting IPM methodology
Types of resistant varieties introduced
Number of acreage planted resistant
Farmers, DFT/WFTField Extension Officers
July 2012 – June 2014
5,000,000/=
138

No Identified Impact
Enhancement/Mitigation Measures
Performance Indicator Responsibility Time frame COST ESTMATES
varieties6. Conflicts among
water users Formation of water
user association and irrigators Organization
Equitable allocation of water
Number of water users’ groups formed
Reduced number of water conflicts
Farmers, DFT/WFTField Extension Officers PBWO, TZITSU
July 2012 – June 2014
4,000,000/=
7 Reduced downstream water flows
Adherence to water permits directive
Volume of water abstracted
Farmers, DFT/WFTField Extension Officers, PBWO
July 2012 – June 2014
4,000,000/=
8. Population influx resulting into increased cases of HIV
Awareness creation on HIV/AIDS
Number of new HIV/AIDS Cases reported
Farmers, DFT/WFTField Extension Officers
July 2012 – June 2014
2,000,000/=
38.A Environmental and Social Monitoring Plan
139

No Environmental Component to be Monitored
Method of Monitoring and Sampling Area
Frequency Verifiable indicator Responsibility
1. Increase in incidences of insects and pests
Periodic inspection Weekly Number of inspections
DFT/WFT and Extension Officers, Project Committee
2. Increase of water borne diseases
Follow up in Health Facilities
Monthly Number of cases recorded
DFT/WFT and Extension Officers, Project Committee, Health Officers
3. Occurrence of soil erosion Periodic inspection Annually Number of inspections
DFT/WFT and Extension Officers, Project Committee
4. Increase in cases of Malaria Follow up in Health Facilities
Monthly Number of cases recorded
DFT/WFT and Extension Officers, Project Committee, Health Officers
5. Increase in use of Agrochemicals
Soil analysis, ,Interviews Annually Number of Soil samples analyzed
DFT/WFT and Extension Officers, Project Committee
6. Conflicts among water users Meetings, Visits and interviews
Monthly Number of cases recorded
DFT/WFT, Extension Officers, VEOs, Project Committee, PBWO, TZITSU
7. Reduced downstream water flows
Measurement of flows Annually Volume of water abstracted
DFT/WFT and Extension Officers, Project Committee, PBWO, TZITSU
8. Population influx resulting into increased cases of HIV
Follow up in Health Facilities, Interviews
Annually Number of cases recorded
DFT/WFT and Extension Officers, Project
140

39. Kahama Nhalanga Irrigation Scheme (NZEGA District Council)
No
Identified Impact
Enhancement/Mitigation Measures
Performance Indicator Responsibility Time frame COST ESTMATES
1. Increase in incidences of insects and pests
Training on Proper use of pesticides
Use of IPM methodologies Introduction of pest resistant varieties
Number of farmers trained and practicing the technology
Number of farmers adopting IPM methodology
Farmers, DFT/WFT
Field Extension Officers
July 2012 – June 2014
5,700,000/=
2. Increase of water borne diseases
Create awareness on water borne diseases to the Community
Prevention of water borne diseases
Number of water borne diseases reported
Farmers, DFT/WFT
Field Extension Officers
July 2012 – June 2014
2,000,000/=
3. Occurrence of soil erosion
Training on soil and` water conservation
Training on water management
Use of soil erosion control measures
Number of farmers trained
Number of farmers trained
Number of acres with erosion control measures
Farmers, DFT/WFT
Field Extension Officers
July 2012 – June 2014
3,000,000/=
4. Increase in cases of Malaria
Create awareness on the disease to the Community
Reduce water pondage
Number of malaria cases reported
Farmers, DFT/WFT
Field Extension
July 2012 – June 2014
3,000,000/=
141

No
Identified Impact
Enhancement/Mitigation Measures
Performance Indicator Responsibility Time frame COST ESTMATES
Officers
5. Increase in use of Agrochemicals
Training on the use of IPM methodologies
Introduction of pest resistant varieties
Number of farmers adopting IPM methodology
Types of resistant varieties introduced
Number of acreage planted resistant varieties
Farmers, DFT/WFT
Field Extension Officers
July 2012 – June 2014
5,550,000/=
6. Conflicts among water users
Formation of water user association and irrigators Organization
Equitable allocation of water
Number of water users’ groups formed
Reduced number of water conflicts
Farmers, DFT/WFT
Field Extension Officers PBWO, TZITSU
July 2012 – June 2014
4,000,000/=
7 Reduced downstream water flows
Adherence to water permits directive
Volume of water abstracted
Farmers, DFT/WFT
Field Extension Officers, PBWO
July 2012 – June 2014
4,000,000/=
8. Population influx resulting into increased cases of HIV
Awareness creation on HIV/AIDS
Number of new HIV/AIDS Cases reported
Farmers, DFT/WFT
Field Extension Officers
July 2012 – June 2014
2,000,000/=
142

39.A Environmental and Social Monitoring Plan
143

No Environmental Component to be Monitored
Method of Monitoring and Sampling Area
Frequency Verifiable indicator Responsibility
1. Increase in incidences of insects and pests
Periodic inspection Weekly Number of inspections
DFT/WFT and Extension Officers, Project Committee
2. Increase of water borne diseases
Follow up in Health Facilities
Monthly Number of cases recorded
DFT/WFT and Extension Officers, Project Committee, Health Officers
3. Occurrence of soil erosion Periodic inspection Annually Number of inspections
DFT/WFT and Extension Officers, Project Committee
4. Increase in cases of Malaria Follow up in Health Facilities
Monthly Number of cases recorded
DFT/WFT and Extension Officers, Project Committee, Health Officers
5. Increase in use of Agrochemicals
Soil analysis, ,Interviews Annually Number of Soil samples analyzed
DFT/WFT and Extension Officers, Project Committee
6. Conflicts among water users Meetings, Visits and interviews
Monthly Number of cases recorded
DFT/WFT, Extension Officers, VEOs, Project Committee, PBWO, TZITSU
7. Reduced downstream water flows
Measurement of flows Annually Volume of water abstracted
DFT/WFT and Extension Officers, Project Committee, PBWO, TZITSU
8. Population influx resulting into increased cases of HIV
Follow up in Health Facilities, Interviews
Annually Number of cases recorded
DFT/WFT and Extension Officers, Project
144

Makomelo Irrigation Scheme (IGUNGA District Council)
No Identified Impact
Enhancement/Mitigation Measures
Performance Indicator Responsibility Time frame COST ESTMATES
1. Increase in incidences of insects and pests
Training on Proper use of pesticides
Use of IPM methodologies Introduction of pest resistant varieties
Number of farmers trained and practicing the technology
Number of farmers adopting IPM methodology
Farmers, DFT/WFT
Field Extension Officers
July 2012 – June 2014
700,000/=
2. Increase of water borne diseases
Create awareness on water borne diseases to the Community
Prevention of water borne diseases
Number of water borne diseases reported
Farmers, DFT/WFT
Field Extension Officers
July 2012 – June 2014
2,000,000/=
3. Occurrence of soil erosion
Training on soil and` water conservation
Training on water management
Use of soil erosion control measures
Number of farmers trained
Number of farmers trained
Number of acres with erosion control measures
Farmers, DFT/WFT
Field Extension Officers
July 2012 – June 2014
3,000,000/=
4. Increase in Create awareness on Number of malaria Farmers, July 2012 – 3,000,000/=
145

No Identified Impact
Enhancement/Mitigation Measures
Performance Indicator Responsibility Time frame COST ESTMATES
cases of Malaria the disease to the Community
Reduce water pondage
cases reported DFT/WFT
Field Extension Officers
June 2014
5. Increase in use of Agrochemicals
Training on the use of IPM methodologies Introduction of pest
resistant varieties
Number of farmers adopting IPM methodology
Types of resistant varieties introduced
Number of acreage planted resistant varieties
Farmers, DFT/WFTField Extension Officers
July 2012 – June 2014
4,000,000/=
6. Conflicts among water users
Formation of water user association and irrigators Organization
Equitable allocation of water
Number of water users’ groups formed
Reduced number of water conflicts
Farmers, DFT/WFTField Extension Officers, PBWO, TZITSU
July 2012 – June 2014
4,000,000/=
7 Reduced downstream water flows
Adherence to water permits directive
Volume of water abstracted
Farmers, DFT/WFTField Extension Officers, PBWO
July 2012 – June 2014
5,000,000/=
8. Population influx resulting into increased cases of HIV
Awareness creation on HIV/AIDS
Number of new HIV/AIDS Cases reported
Farmers, DFT/WFTField Extension Officers
July 2012 – June 2014
2,000,000/=
146

147
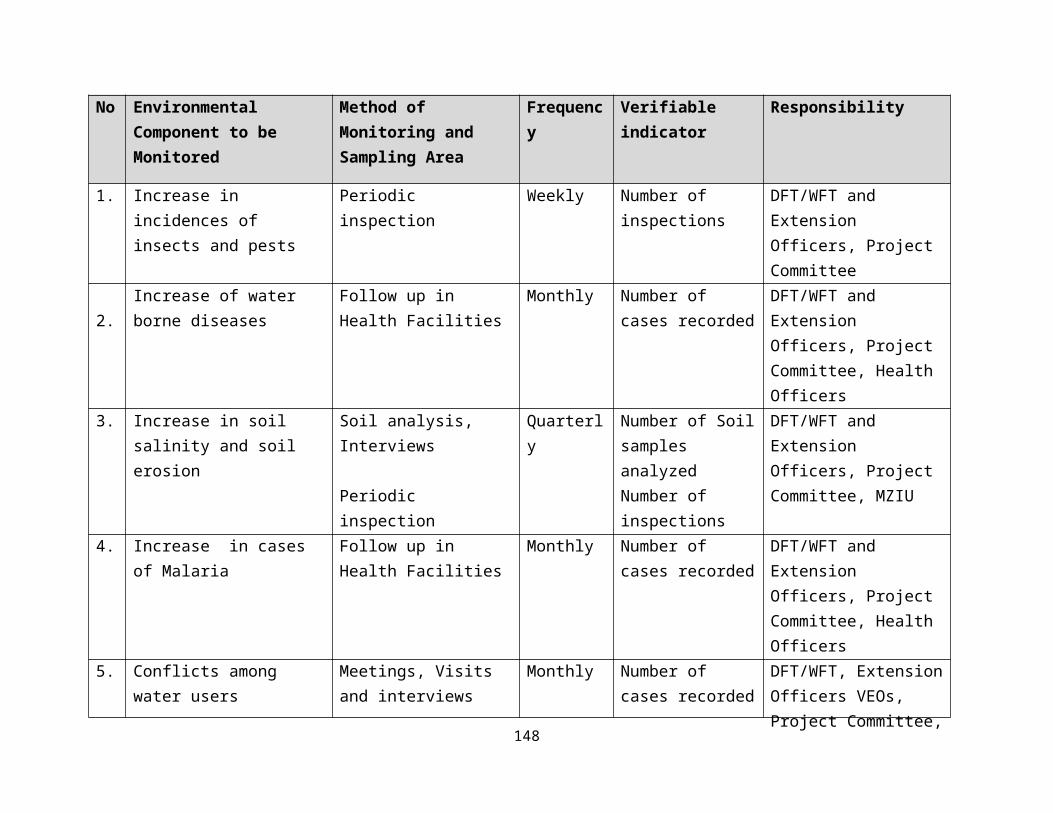
40.A Environmental and Social Monitoring Plan
148

No Environmental Component to be Monitored
Method of Monitoring and Sampling Area
Frequency Verifiable indicator Responsibility
1. Increase in incidences of insects and pests
Periodic inspection Weekly Number of inspections
DFT/WFT and Extension Officers, Project Committee
2. Increase of water borne diseases
Follow up in Health Facilities
Monthly Number of cases recorded
DFT/WFT and Extension Officers, Project Committee, Health Officers
3. Occurrence of soil erosion Periodic inspection Annually Number of inspections
DFT/WFT and Extension Officers, Project Committee
4. Increase in cases of Malaria Follow up in Health Facilities
Monthly Number of cases recorded
DFT/WFT and Extension Officers, Project Committee, Health Officers
5. Increase in use of Agrochemicals
Soil analysis, ,Interviews Annually Number of Soil samples analyzed
DFT/WFT and Extension Officers, Project Committee
6. Conflicts among water users Meetings, Visits and interviews
Monthly Number of cases recorded
DFT/WFT, Extension Officers ,VEOs, Project Committee, PBWO, TZITSU
7. Reduced downstream water flows
Measurement of flows Annually Volume of water abstracted
DFT/WFT and Extension Officers, Project Committee, PBWO, TZITSU
8. Population influx resulting into increased cases of HIV
Follow up in Health Facilities, Interviews
Annually Number of cases recorded
DFT/WFT and Extension Officers, Project
149

40. Katengera Irrigation Scheme (KAKONKO District Council)
No Identified Impact
Enhancement/Mitigation Measures
Performance Indicator Responsibility Time frame COST ESTMATES
1. Increase in incidences of insects and pests
Training on Proper use of pesticides
Use of IPM methodologies Introduction of pest resistant varieties
Number of farmers trained and practicing the technology
Number of farmers adopting IPM methodology
Farmers, DFT/WFTField Extension Officers
July 2012 – June 2014
8,500,000/=
2. Increase of water borne diseases
Create awareness on water borne diseases to the Community
Prevention of water borne diseases
Number of water borne diseases reported
Farmers, DFT/WFTField Extension Officers
July 2012 – June 2014
2,000,000/=
3. Occurrence of soil erosion
Training on soil and` water conservation
Training on water management
Use of soil erosion control measures
Number of farmers trained
Number of farmers trained
Number of acres with erosion control measures
Farmers, DFT/WFTField Extension Officers
July 2012 – June 2014
5,000,000/=
4. Increase in cases of Malaria
Create awareness on the disease to the Community
Reduce water pondage
Number of malaria cases reported
Farmers, DFT/WFTField Extension Officers
July 2012 – June 2014
3,000,000/=
5. Increase in use Training on the use of Number of farmers adopting IPM
Farmers, July 2012 – 3,000,000/=
150

No Identified Impact
Enhancement/Mitigation Measures
Performance Indicator Responsibility Time frame COST ESTMATES
of Agrochemicals
IPM methodologies Introduction of pest
resistant varieties
methodology Types of resistant
varieties introduced Number of acreage
planted resistant varieties
DFT/WFTField Extension Officers
June 2014
6. Conflicts among water users
Formation of water user association and irrigators Organization
Equitable allocation of water
Number of water users’ groups formed
Reduced number of water conflicts
Farmers, DFT/WFTField Extension Officers, PBWO, TZITSU
July 2012 – June 2014
4,000,000/=
7 Reduced downstream water flows
Adherence to water permits directive
Volume of water abstracted
Farmers, DFT/WFTField Extension Officers, PBWO
July 2012 – June 2014
4,000,000/=
8. Population influx resulting into increased cases of HIV
Awareness creation on HIV/AIDS
Number of new HIV/AIDS Cases reported
Farmers, DFT/WFTField Extension Officers
July 2012 – June 2014
2,000,000/=
41A. Environmental and Social Monitoring Plan
151

No Environmental Component to be Monitored
Method of Monitoring and Sampling Area
Frequency Verifiable indicator Responsibility
1. Increase in incidences of insects and pests
Periodic inspection Weekly Number of inspections
DFT/WFT and Extension Officers, Project Committee
2. Increase of water borne diseases
Follow up in Health Facilities
Monthly Number of cases recorded
DFT/WFT and Extension Officers, Project Committee, Health Officers
3. Occurrence of soil erosion Periodic inspection Annually Number of inspections
DFT/WFT and Extension Officers, Project Committee
4. Increase in cases of Malaria Follow up in Health Facilities
Monthly Number of cases recorded
DFT/WFT and Extension Officers, Project Committee, Health Officers
5. Increase in use of Agrochemicals
Soil analysis, ,Interviews Annually Number of Soil samples analyzed
DFT/WFT and Extension Officers, Project Committee
6. Conflicts among water users Meetings, Visits and interviews
Monthly Number of cases recorded
DFT/WFT ,Extension Officers, VEOs, Project Committee, PBWO, TZITSU
7. Reduced downstream water flows
Measurement of flows Annually Volume of water abstracted
DFT/WFT and Extension Officers, Project Committee, PBWO, TZITSU
8. Population influx resulting into increased cases of HIV
Follow up in Health Facilities, Interviews
Annually Number of cases recorded
DFT/WFT and Extension Officers, Project
152

153

41. Kigina Irrigation Scheme (KIBONDO District Council)
No Identified Impact Enhancement/Mitigation Measures
Performance Indicator Responsibility Time frame COST ESTMATES
1. Increase in incidences of insects and pests
Training on Proper use of pesticides
Use of IPM methodologies Introduction of pest resistant varieties
Number of farmers trained and practicing the technology
Number of farmers adopting IPM methodology
Farmers, DFT/WFTField Extension Officers
July 2012 – June 2014
4,500,000/=
2. Increase of water borne diseases
Create awareness on water borne diseases to the Community
Prevention of water borne diseases
Number of water borne diseases reported
Farmers, DFT/WFTField Extension Officers
July 2012 – June 2014
2,000,000/=
3. Occurrence of soil erosion
Training on soil and` water conservation
Training on water management
Use of soil erosion control measures
Number of farmers trained
Number of farmers trained
Number of acres with erosion control measures
Farmers, DFT/WFTField Extension Officers
July 2012 – June 2014
6,000,000/=
4. Increase in cases of Malaria
Create awareness on the disease to the Community
Reduce water pondage
Number of malaria cases reported
Farmers, DFT/WFTField Extension Officers
July 2012 – June 2014
3,000,000/=
5. Increase in use of Agrochemicals
Training on the use of
IPM methodologies
Number of farmers adopting IPM methodology
Types of resistant
Farmers, DFT/WFTField Extension Officers
July 2012 – June 2014
8,000,000/=
154

No Identified Impact Enhancement/Mitigation Measures
Performance Indicator Responsibility Time frame COST ESTMATES
Introduction of pest resistant varieties
varieties introduced Number of acreage
planted resistant varieties
6. Conflicts among water users
Formation of water user association and irrigators Organization
Equitable allocation of water
Number of water users’ groups formed
Reduced number of water conflicts
Farmers, DFT/WFTField Extension Officers, PBWO, TZITSU
July 2012 – June 2014
4,000,000/=
7 Reduced downstream water flows
Adherence to water permits directive
Volume of water abstracted
Farmers, DFT/WFTField Extension Officers, PBWO
July 2012 – June 2014
4,000,000/=
8. Population influx resulting into increased cases of HIV
Awareness creation on HIV/AIDS
Number of new HIV/AIDS Cases reported
Farmers, DFT/WFTField Extension Officers
July 2012 – June 2014
2,000,000/=
155

42.A Environmental and Social Monitoring Plan
156

No Environmental Component to be Monitored
Method of Monitoring and Sampling Area
Frequency Verifiable indicator Responsibility
1. Increase in incidences of insects and pests
Periodic inspection Weekly Number of inspections
DFT/WFT and Extension Officers, Project Committee
2. Increase of water borne diseases
Follow up in Health Facilities
Monthly Number of cases recorded
DFT/WFT and Extension Officers, Project Committee, Health Officers
3. Occurrence of soil erosion Periodic inspection Annually Number of inspections
DFT/WFT and Extension Officers, Project Committee
4. Increase in cases of Malaria Follow up in Health Facilities
Monthly Number of cases recorded
DFT/WFT and Extension Officers, Project Committee, Health Officers
5. Increase in use of Agrochemicals
Soil analysis, ,Interviews Annually Number of Soil samples analyzed
DFT/WFT and Extension Officers, Project Committee
6. Conflicts among water users Meetings, Visits and interviews
Monthly Number of cases recorded
DFT/WFT ,Extension Officers, VEOs, Project Committee, PBWO, TZITSU
7. Reduced downstream water flows
Measurement of flows Annually Volume of water abstracted
DFT/WFT and Extension Officers, Project Committee, PBWO, TZITSU
8. Population influx resulting into increased cases of HIV
Follow up in Health Facilities, Interviews
Annually Number of cases recorded
DFT/WFT and Extension Officers, Project
157

42. Luiche Irrigation Scheme (KIGOMA/UJIJI District Council)
No
Identified Impact
Enhancement/Mitigation Measures
Performance Indicator Responsibility Time frame COST ESTMATES
1. Increase in incidences of insects and pests
Training on Proper use of pesticides
Use of IPM methodologies Introduction of pest resistant varieties
Number of farmers trained and practicing the technology
Number of farmers adopting IPM methodology
Farmers, DFT/WFTField Extension Officers
July 2012 – June 2014
3,400,000/=
2. Increase of water borne diseases
Create awareness on water borne diseases to the Community
Prevention of water borne diseases
Number of water borne diseases reported
Farmers, DFT/WFTField Extension Officers
July 2012 – June 2014
2,000,000/=
3. Occurrence of soil erosion
Training on soil and` water conservation
Training on water management
Use of soil erosion control measures
Number of farmers trained
Number of farmers trained
Number of acres with erosion control measures
Farmers, DFT/WFTField Extension Officers
July 2012 – June 2014
5,000,000/=
4. Increase in cases of Malaria
Create awareness on the disease to the Community
Reduce water pondage
Number of malaria cases reported
Farmers, DFT/WFTField Extension Officers
July 2012 – June 2014
3,000,000/=
158

No
Identified Impact
Enhancement/Mitigation Measures
Performance Indicator Responsibility Time frame COST ESTMATES
5. Increase in use of Agrochemicals
Training on the use of IPM methodologies Introduction of pest
resistant varieties
Number of farmers adopting IPM methodology
Types of resistant varieties introduced
Number of acreage planted resistant varieties
Farmers, DFT/WFTField Extension Officers
July 2012 – June 2014
4,100,000/=
6. Conflicts among water users
Formation of water user association and irrigators Organization
Equitable allocation of water
Number of water users’ groups formed
Reduced number of water conflicts
Farmers, DFT/WFTField Extension Officers, PBWO, TZITSU
July 2012 – June 2014
3,700,000/=
7 Reduced downstream water flows
Adherence to water permits directive
Volume of water abstracted
Farmers, DFT/WFTField Extension Officers, PBWO
July 2012 – June 2014
4,000,000/=
8. Population influx resulting into increased cases of HIV
Awareness creation on HIV/AIDS
Number of new HIV/AIDS Cases reported
Farmers, DFT/WFTField Extension Officers
July 2012 – June 2014
2,000,000/=
43.A Environmental and Social Monitoring Plan
159

No Environmental Component to be Monitored
Method of Monitoring and Sampling Area
Frequency Verifiable indicator Responsibility
1. Increase in incidences of insects and pests
Periodic inspection Weekly Number of inspections
DFT/WFT and Extension Officers, Project Committee
2. Increase of water borne diseases
Follow up in Health Facilities
Monthly Number of cases recorded
DFT/WFT and Extension Officers, Project Committee, Health Officers
3. Occurrence of soil erosion Periodic inspection Annually Number of inspections
DFT/WFT and Extension Officers, Project Committee
4. Increase in cases of Malaria Follow up in Health Facilities
Monthly Number of cases recorded
DFT/WFT and Extension Officers, Project Committee, Health Officers
5. Increase in use of Agrochemicals
Soil analysis, ,Interviews Annually Number of Soil samples analyzed
DFT/WFT and Extension Officers, Project Committee
6. Conflicts among water users Meetings, Visits and interviews
Monthly Number of cases recorded
DFT/WFT ,Extension Officers, VEOs, Project Committee, PBWO, TZITSU
7. Reduced downstream water flows
Measurement of flows Annually Volume of water abstracted
DFT/WFT and Extension Officers, Project Committee, PBWO, TZITSU
8. Population influx resulting into increased cases of HIV
Follow up in Health Facilities, Interviews
Annually Number of cases recorded
DFT/WFT and Extension Officers, Project
160

161

43. Lumpungu Irrigation Scheme (KIBONDO District Council)
No
Identified Impact
Enhancement/Mitigation Measures
Performance Indicator Responsibility Time frame COST ESTMATES
1. Increase in incidences of insects and pests
Training on Proper use of pesticides
Use of IPM methodologies Introduction of pest resistant varieties
Number of farmers trained and practicing the technology
Number of farmers adopting IPM methodology
Farmers, DFT/WFTField Extension Officers
July 2012 – June 2014
8,5000,000/=
2. Increase of water borne diseases
Create awareness on water borne diseases to the Community
Prevention of water borne diseases
Number of water borne diseases reported
Farmers, DFT/WFTField Extension Officers
July 2012 – June 2014
2,000,000/=
3. Occurrence of soil erosion
Training on soil and` water conservation
Training on water management
Use of soil erosion control measures
Number of farmers trained
Number of farmers trained
Number of acres with erosion control measures
Farmers, DFT/WFTField Extension Officers
July 2012 – June 2014
1,000,000/=
4. Increase in cases of Malaria
Create awareness on the disease to the Community
Reduce water pondage
Number of malaria cases reported
Farmers, DFT/WFTField Extension Officers
July 2012 – June 2014
3,000,000/=
5. Increase in use Training on the use of Number of farmers Farmers, July 2012 – 6,000,000/=
162

No
Identified Impact
Enhancement/Mitigation Measures
Performance Indicator Responsibility Time frame COST ESTMATES
of Agrochemicals
IPM methodologies Introduction of pest
resistant varieties
adopting IPM methodology
Types of resistant varieties introduced
Number of acreage planted resistant varieties
DFT/WFTField Extension Officers
June 2014
6. Conflicts among water users
Formation of water user association and irrigators Organization
Equitable allocation of water
Number of water users’ groups formed
Reduced number of water conflicts
Farmers, DFT/WFTField Extension Officers PBWO,TZITSU
July 2012 – June 2014
4,000,000/=
7 Reduced downstream water flows
Adherence to water permits directive
Volume of water abstracted
Farmers, DFT/WFTField Extension Officers, PBWO
July 2012 – June 2014
2,000,000/=
8. Population influx resulting into increased cases of HIV
Awareness creation on HIV/AIDS
Number of new HIV/AIDS Cases reported
Farmers, DFT/WFTField Extension Officers
July 2012 – June 2014
2,000,000/=
163

44.A Environmental and Social Monitoring Plan
164

No Environmental Component to be Monitored
Method of Monitoring and Sampling Area
Frequency Verifiable indicator Responsibility
1. Increase in incidences of insects and pests
Periodic inspection Weekly Number of inspections
DFT/WFT and Extension Officers, Project Committee
2. Increase of water borne diseases
Follow up in Health Facilities
Monthly Number of cases recorded
DFT/WFT and Extension Officers, Project Committee, Health Officers
3. Occurrence of soil erosion Periodic inspection Annually Number of inspections
DFT/WFT and Extension Officers, Project Committee
4. Increase in cases of Malaria Follow up in Health Facilities
Monthly Number of cases recorded
DFT/WFT and Extension Officers, Project Committee, Health Officers
5. Increase in use of Agrochemicals
Soil analysis, Interviews Annually Number of Soil samples analyzed
DFT/WFT and Extension Officers, Project Committee
6. Conflicts among water users Meetings, Visits and interviews
Monthly Number of cases recorded
DFT/WFT, Extension Officers, VEOs, Project Committee, BWO,TZITSU
7. Reduced downstream water flows
Measurement of flows Annually Volume of water abstracted
DFT/WFT and Extension Officers, Project Committee, PBWO,TZITSU
8. Population influx resulting into increased cases of HIV
Follow up in Health Facilities, Interviews
Annually Number of cases recorded
DFT/WFT and Extension Officers, Project
165

44. Lusu/Ifumba Irrigation Scheme (NZEGA District Council)
No Identified Impact
Enhancement/Mitigation Measures
Performance Indicator Responsibility Time frame COST ESTMATES
1. Increase in incidences of insects and pests
Training on Proper use of pesticides
Use of IPM methodologies Introduction of pest resistant varieties
Number of farmers trained and practicing the technology
Number of farmers adopting IPM methodology
Farmers, DFT/WFT
Field Extension Officers
July 2012 – June 2014
4,600,000/=
2. Increase of water borne diseases
Create awareness on water borne diseases to the Community
Prevention of water borne diseases
Number of water borne diseases reported
Farmers, DFT/WFT
Field Extension Officers
July 2012 – June 2014
2,000,000/=
3. Occurrence of soil erosion
Training on soil and` water conservation
Training on water management
Use of soil erosion control measures
Number of farmers trained
Number of farmers trained
Number of acres with erosion control measures
Farmers, DFT/WFT
Field Extension Officers
July 2012 – June 2014
3,000,000/=
4. Increase in cases of Malaria
Create awareness on the disease to the Community
Reduce water
Number of malaria cases reported
Farmers, DFT/WFT
July 2012 – June 2014
3,000,000/=
166

No Identified Impact
Enhancement/Mitigation Measures
Performance Indicator Responsibility Time frame COST ESTMATES
pondage Field Extension Officers
5. Increase in use of Agrochemicals
Training on the use of IPM methodologies
Introduction of pest resistant varieties
Number of farmers adopting IPM methodology
Types of resistant varieties introduced
Number of acreage planted resistant varieties
Farmers, DFT/WFT
Field Extension Officers
July 2012 – June 2014
5,400,000/=
6. Conflicts among water users
Formation of water user association and irrigators Organization
Equitable allocation of water
Number of water users’ groups formed
Reduced number of water conflicts
Farmers, DFT/WFT
Field Extension Officers PBWO, TZITSU
July 2012 – June 2014
4,000,000/=
7 Reduced downstream water flows
Adherence to water permits directive
Volume of water abstracted
Farmers, DFT/WFT
Field Extension Officers, PBWO
July 2012 – June 2014
3,000,000/=
8. Population influx resulting into increased cases of HIV
Awareness creation on HIV/AIDS
Number of new HIV/AIDS Cases reported
Farmers, DFT/WFT
Field Extension Officers
July 2012 – June 2014
2,000,000/=
167

45.A Environmental and Social Monitoring Plan
168
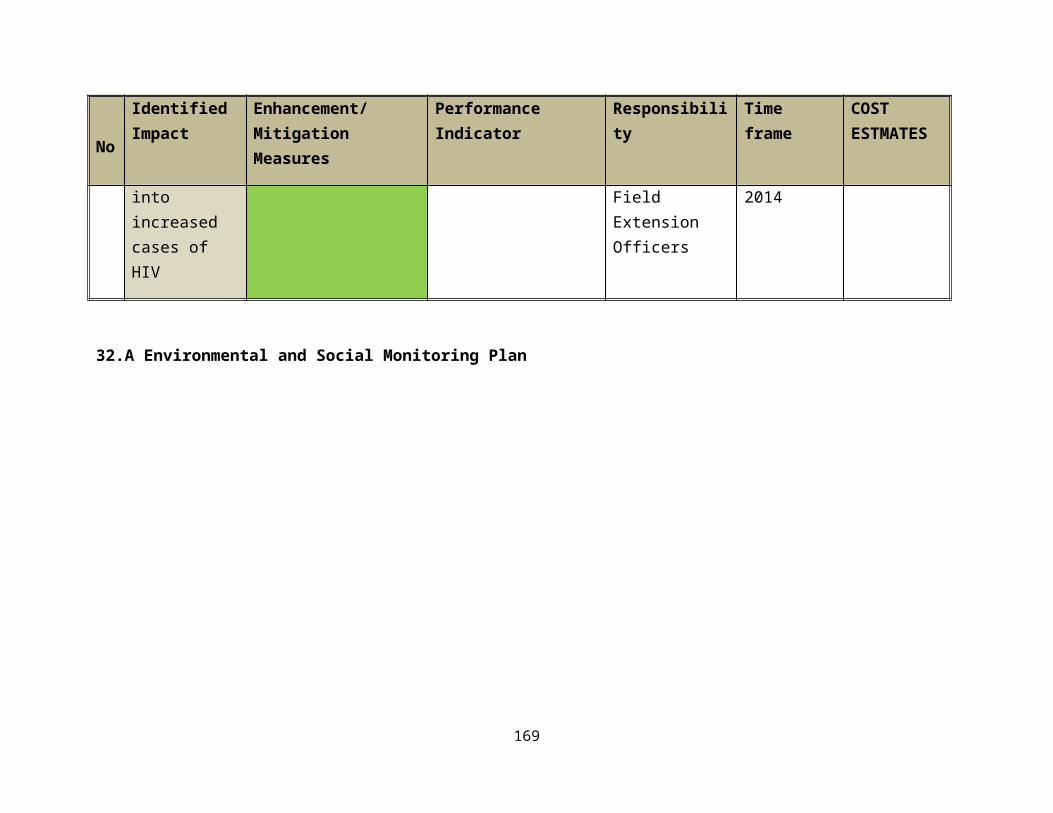
No Environmental Component to be Monitored
Method of Monitoring and Sampling Area
Frequency Verifiable indicator Responsibility
1. Increase in incidences of insects and pests
Periodic inspection Weekly Number of inspections
DFT/WFT and Extension Officers, Project Committee
2. Increase of water borne diseases
Follow up in Health Facilities
Monthly Number of cases recorded
DFT/WFT and Extension Officers, Project Committee, Health Officers
3. Occurrence of soil erosion Periodic inspection Annually Number of inspections
DFT/WFT and Extension Officers, Project Committee
4. Increase in cases of Malaria Follow up in Health Facilities
Monthly Number of cases recorded
DFT/WFT and Extension Officers, Project Committee, Health Officers
5. Increase in use of Agrochemicals
Soil analysis, ,Interviews Annually Number of Soil samples analyzed
DFT/WFT and Extension Officers, Project Committee,
6. Conflicts among water users Meetings, Visits and interviews
Monthly Number of cases recorded
DFT/WFT ,Extension Officers, VEOs, Project Committee, PBWO, TZITSU
7. Reduced downstream water flows
Measurement of flows Annually Volume of water abstracted
DFT/WFT and Extension Officers, Project Committee, PBWO, TZITSU
8. Population influx resulting into increased cases of HIV
Follow up in Health Facilities, Interviews
Annually Number of cases recorded
DFT/WFT and Extension Officers, Project
169
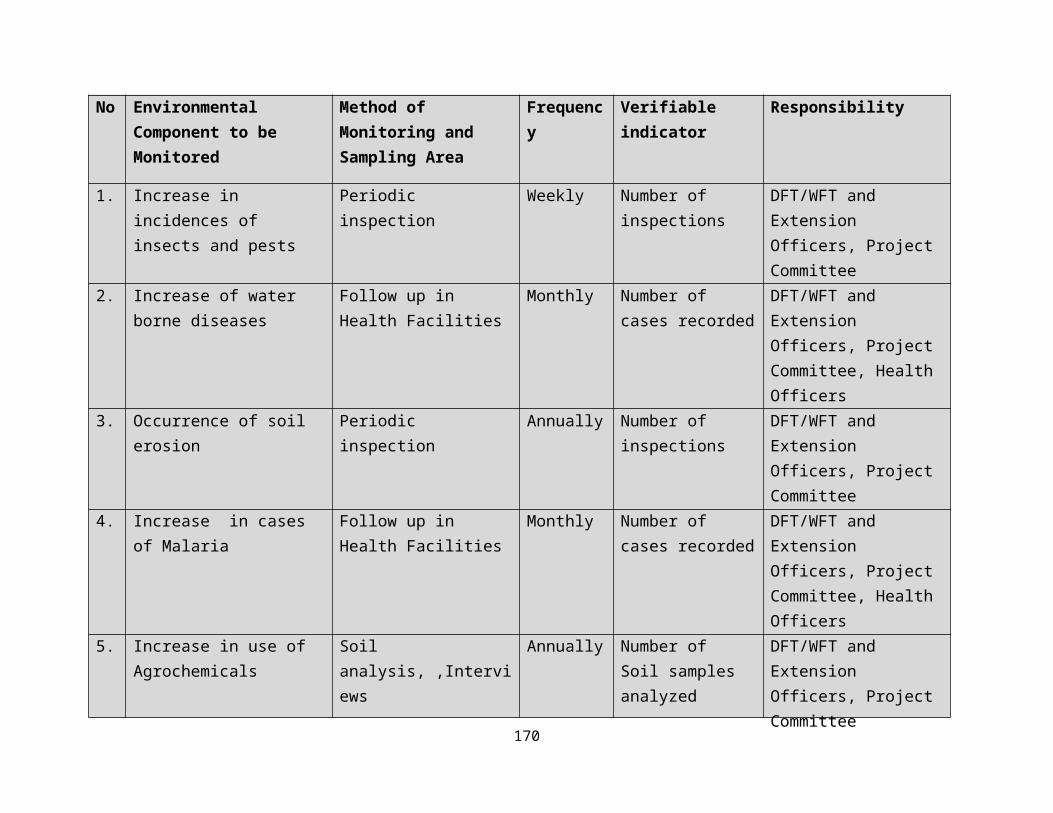
170

45. Kasuga Dam (KAKONKO District Council)
No Identified Impact
Enhancement/Mitigation Measures
Performance Indicator Responsibility Time frame COST ESTMATES
1. Increase in incidences of insects and pests
Training on Proper use of pesticides
Use of IPM methodologies Introduction of pest resistant varieties
Number of farmers trained and practicing the technology
Number of farmers adopting IPM methodology
Farmers, DFT/WFTField Extension Officers
July 2012 – June 2014
3,5000,000/=
2. Increase of water borne diseases
Create awareness on water borne diseases to the Community
Prevention of water borne diseases
Number of water borne diseases reported
Farmers, DFT/WFTField Extension Officers
July 2012 – June 2014
2,000,000/=
3. Occurrence of soil erosion
Training on soil and` water conservation
Training on water management
Use of soil erosion control measures
Number of farmers trained
Number of farmers trained
Number of acres with erosion control measures
Farmers, DFT/WFTField Extension Officers
July 2012 – June 2014
7,000,000/=
4. Increase in cases of Malaria
Create awareness on the disease to the Community
Reduce water pondage
Number of malaria cases reported
Farmers, DFT/WFTField Extension Officers
July 2012 – June 2014 ,,
3,000,000/=
5. Increase in use of Agrochemicals
Training on the use of IPM methodologies Introduction of pest
resistant varieties
Number of farmers adopting IPM methodology
Types of resistant
Farmers, DFT/WFTField Extension
July 2012 – June 2014
5,000,000/=
171

No Identified Impact
Enhancement/Mitigation Measures
Performance Indicator Responsibility Time frame COST ESTMATES
varieties introduced Number of acreage
planted resistant varieties
Officers
6. Conflicts among water users
Formation of water user association and irrigators Organization
Equitable allocation of water
Number of water users’ groups formed
Reduced number of water conflicts
Farmers, DFT/WFTField Extension Officers PBWO,TZITSU
July 2012 – June 2014
4,000,000/=
7 Reduced downstream water flows
Adherence to water permits directive
Volume of water abstracted
Farmers, DFT/WFTField Extension Officers, PBWO
July 2012 – June 2014
4,000,000/=
8. Population influx resulting into increased cases of HIV
Awareness creation on HIV/AIDS
Number of new HIV/AIDS Cases reported
Farmers, DFT/WFTField Extension Officers
July 2012 – June 2014
2,000,000/=
172

46.A Environmental and Social Monitoring Plan
173
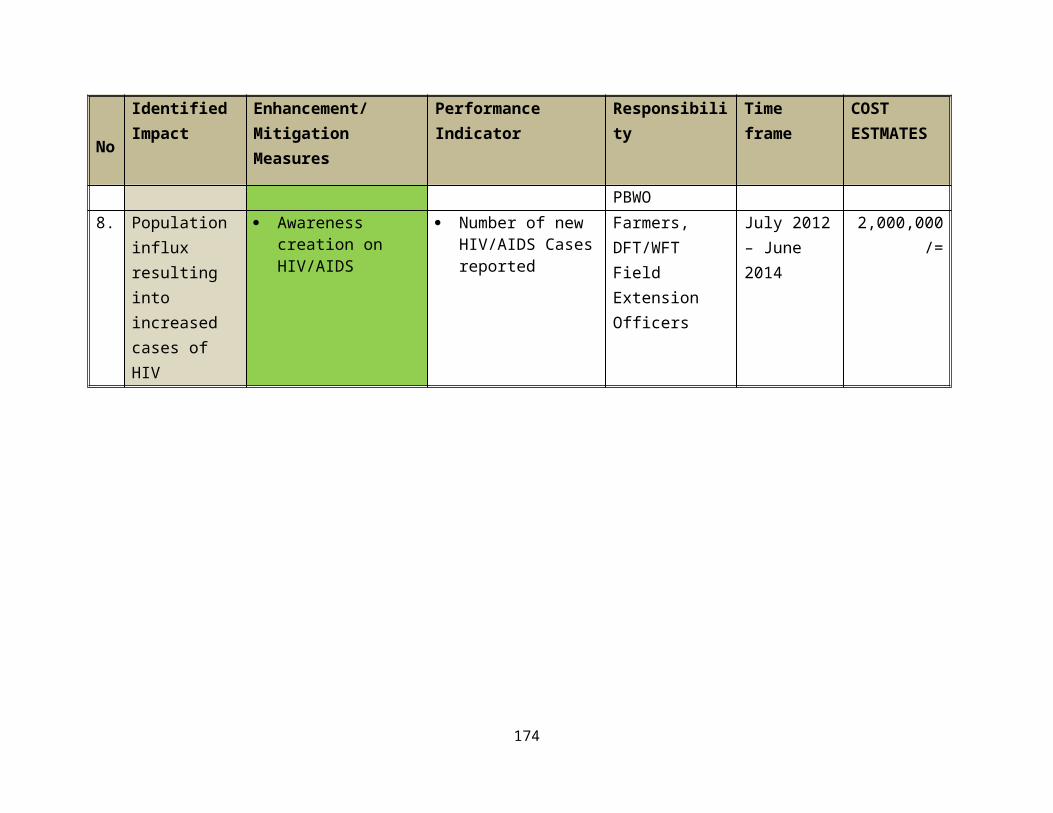
No Environmental Component to be Monitored
Method of Monitoring and Sampling Area
Frequency Verifiable indicator Responsibility
1. Increase in incidences of insects and pests
Periodic inspection Weekly Number of inspections
DFT/WFT and Extension Officers, Project Committee
2. Increase of water borne diseases
Follow up in Health Facilities
Monthly Number of cases recorded
DFT/WFT and Extension Officers, Project Committee, Health Officers
3. Occurrence of soil erosion Periodic inspection Annually Number of inspections
DFT/WFT and Extension Officers, Project Committee
4. Increase in cases of Malaria Follow up in Health Facilities
Monthly Number of cases recorded
DFT/WFT and Extension Officers, Project Committee, Health Officers
5. Increase in use of Agrochemicals
Soil analysis, Interviews Annually Number of Soil samples analyzed
DFT/WFT and Extension Officers, Project Committee
6. Conflicts among water users Meetings, Visits and interviews
Monthly Number of cases recorded
DFT/WFT, Extension Officers, VEOs, Project Committee, PBWO, TZITSU
7. Reduced downstream water flows
Measurement of flows Annually Volume of water abstracted
DFT/WFT and Extension Officers, Project Committee, PBWO, TZITSU
8. Population influx resulting into increased cases of HIV
Follow up in Health Facilities, Interviews
Annually Number of cases recorded
DFT/WFT and Extension Officers, Project
174

46. Mgambazi Irrigation Scheme (UVINZA District Council)
No Identified Impact
Enhancement/Mitigation Measures
Performance Indicator Responsibility Time frame COST ESTMATES
1. Increase in incidences of insects and pests
Training on Proper use of pesticides
Use of IPM methodologies Introduction of pest resistant varieties
Number of farmers trained and practicing the technology
Number of farmers adopting IPM methodology
Farmers, DFT/WFT
Field Extension Officers
July 2012 – June 2014
7,400,000/=
2. Increase of water borne diseases
Create awareness on water borne diseases to the Community
Prevention of water borne diseases
Number of water borne diseases reported
Farmers, DFT/WFT
Field Extension Officers
July 2012 – June 2014
2,500,000/=
3. Occurrence of soil erosion
Training on soil and` water conservation
Training on water management
Use of soil erosion control measures
Number of farmers trained
Number of farmers trained
Number of acres with erosion control measures
Farmers, DFT/WFT
Field Extension Officers
July 2012 – June 2014
6,000,000/=
4. Increase in cases of Malaria
Create awareness on the disease to the Community
Reduce water pondage
Number of malaria cases reported
Farmers, DFT/WFT
Field Extension Officers
July 2012 – June 2014
3,500,000/=
175

No Identified Impact
Enhancement/Mitigation Measures
Performance Indicator Responsibility Time frame COST ESTMATES
5. Increase in use of Agrochemicals
Training on the use of IPM methodologies
Introduction of pest resistant varieties
Number of farmers adopting IPM methodology
Types of resistant varieties introduced
Number of acreage planted resistant varieties
Farmers, DFT/WFT
Field Extension Officers
July 2012 – June 2014
3,100,000/=
6. Conflicts among water users
Formation of water user association and irrigators Organization
Equitable allocation of water
Number of water users’ groups formed
Reduced number of water conflicts
Farmers, DFT/WFT
Field Extension Officers, PBWO, TZITSU
July 2012 – June 2014
2,700,000/=
7 Reduced downstream water flows
Adherence to water permits directive
Volume of water abstracted
Farmers, DFT/WFT
Field Extension Officers, PBWO
July 2012 – June 2014
1,500,000/=
8. Population influx resulting into increased cases of HIV
Awareness creation on HIV/AIDS
Number of new HIV/AIDS Cases reported
Farmers, DFT/WFT
Field Extension Officers
July 2012 – June 2014
2,500,000/=
176

47.A Environmental and Social Monitoring Plan
177

No Environmental Component to be Monitored
Method of Monitoring and Sampling Area
Frequency Verifiable indicator Responsibility
1. Increase in incidences of insects and pests
Periodic inspection Weekly Number of inspections
DFT/WFT and Extension Officers, Project Committee
2. Increase of water borne diseases
Follow up in Health Facilities
Monthly Number of cases recorded
DFT/WFT and Extension Officers, Project Committee, Health Officers
3. Occurrence of soil erosion Periodic inspection Annually Number of inspections
DFT/WFT and Extension Officers, Project Committee
4. Increase in cases of Malaria Follow up in Health Facilities
Monthly Number of cases recorded
DFT/WFT and Extension Officers, Project Committee, Health Officers
5. Increase in use of Agrochemicals
Soil analysis, ,Interviews Annually Number of Soil samples analyzed
DFT/WFT and Extension Officers, Project Committee
6. Conflicts among water users Meetings, Visits and interviews
Monthly Number of cases recorded
DFT/WFT ,Extension Officers, VEOs, Project Committee, PBWO, TZITSU
7. Reduced downstream water flows
Measurement of flows Annually Volume of water abstracted
DFT/WFT and Extension Officers, Project Committee, PBWO, TZITSU
8. Population influx resulting into increased cases of HIV
Follow up in Health Facilities, Interviews
Annually Number of cases recorded
DFT/WFT and Extension Officers, Project
178
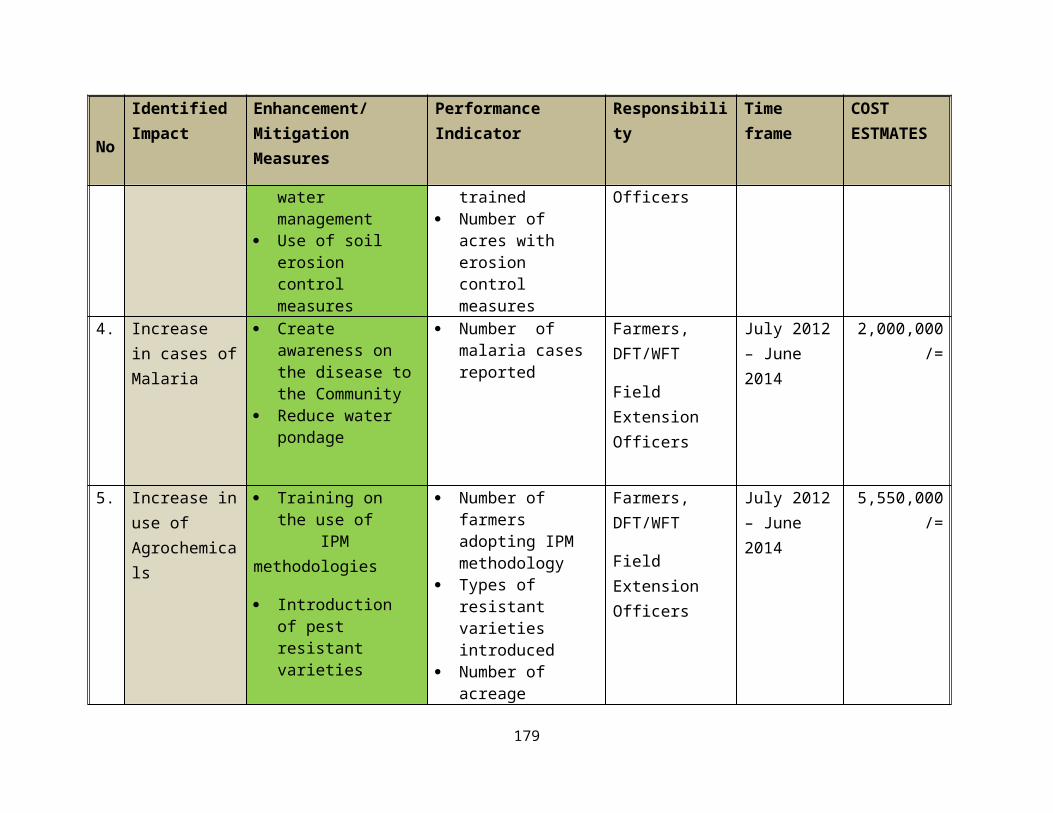
179
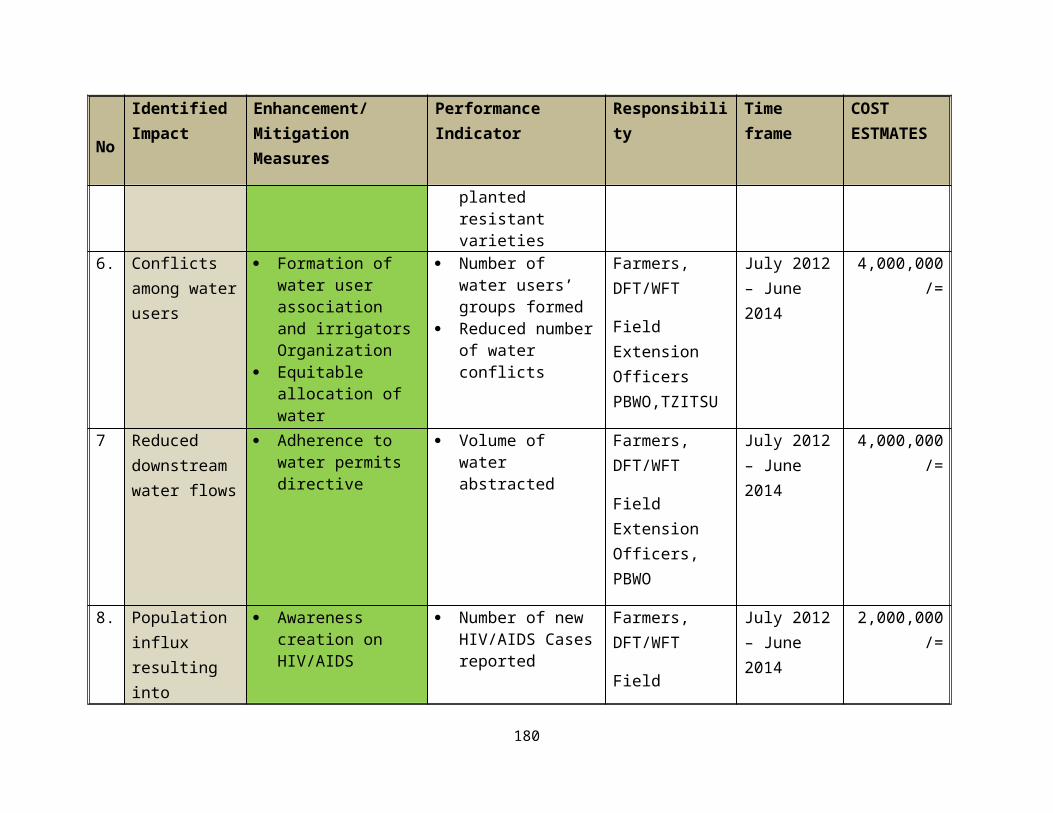
47. Mgondogondo Irrigation Scheme (KIBONDO District Council)
No
Identified Impact
Enhancement/Mitigation Measures
Performance Indicator Responsibility Time frame COST ESTMATES
1. Increase in incidences of insects and pests
Training on Proper use of pesticides
Use of IPM methodologies Introduction of pest resistant varieties
Number of farmers trained and practicing the technology
Number of farmers adopting IPM methodology
Farmers, DFT/WFT
Field Extension Officers
July 2012 – June 2014
3,500,000/=
2. Increase of water borne diseases
Create awareness on water borne diseases to the Community
Prevention of water borne diseases
Number of water borne diseases reported
Farmers, DFT/WFT
Field Extension Officers
July 2012 – June 2014
2,000,000/=
3. Occurrence of soil erosion
Training on soil and` water conservation
Training on water management
Use of soil erosion control measures
Number of farmers trained
Number of farmers trained
Number of acres with erosion control measures
Farmers, DFT/WFT
Field Extension Officers
July 2012 – June 2014
3,500,000/=
4. Increase in cases of Malaria
Create awareness on the disease to the Community
Reduce water pondage
Number of malaria cases reported
Farmers, DFT/WFT
Field Extension Officers
July 2012 – June 2014
2,000,000/=
180

No
Identified Impact
Enhancement/Mitigation Measures
Performance Indicator Responsibility Time frame COST ESTMATES
5. Increase in use of Agrochemicals
Training on the use of IPM methodologies
Introduction of pest resistant varieties
Number of farmers adopting IPM methodology
Types of resistant varieties introduced
Number of acreage planted resistant varieties
Farmers, DFT/WFT
Field Extension Officers
July 2012 – June 2014
5,000,000/=
6. Conflicts among water users
Formation of water user association and irrigators Organization
Equitable allocation of water
Number of water users’ groups formed
Reduced number of water conflicts
Farmers, DFT/WFT
Field Extension Officers, PBWO, TZITSU
July 2012 – June 2014
2,000,000/=
7 Reduced downstream water flows
Adherence to water permits directive
Volume of water abstracted
Farmers, DFT/WFT
Field Extension Officers, PBWO
July 2012 – June 2014
3,000,000/=
8. Population influx resulting into increased cases of HIV
Awareness creation on HIV/AIDS
Number of new HIV/AIDS Cases reported
Farmers, DFT/WFT
Field Extension Officers
July 2012 – June 2014
2,000,000/=
181

48.A Environmental and Social Monitoring Plan
182

No Environmental Component to be Monitored
Method of Monitoring and Sampling Area
Frequency Verifiable indicator Responsibility
1. Increase in incidences of insects and pests
Periodic inspection Weekly Number of inspections
DFT/WFT and Extension Officers, Project Committee
2. Increase of water borne diseases
Follow up in Health Facilities
Monthly Number of cases recorded
DFT/WFT and Extension Officers, Project Committee, Health Officers
3. Occurrence of soil erosion Periodic inspection Annually Number of inspections
DFT/WFT and Extension Officers, Project Committee
4. Increase in cases of Malaria Follow up in Health Facilities
Monthly Number of cases recorded
DFT/WFT and Extension Officers, Project Committee, Health Officers
5. Increase in use of Agrochemicals
Soil analysis, Interviews Annually Number of Soil samples analyzed
DFT/WFT and Extension Officers, Project Committee
6. Conflicts among water users Meetings, Visits and interviews
Monthly Number of cases recorded
DFT/WFT ,Extension Officers, VEOs, Project Committee, PBWO, TZITSU
7. Reduced downstream water flows
Measurement of flows Annually Volume of water abstracted
DFT/WFT and Extension Officers, Project Committee, PBWO, TZITSU
8. Population influx resulting into increased cases of HIV
Follow up in Health Facilities, Interviews
Annually Number of cases recorded
DFT/WFT and Extension Officers, Project
183

48. Mkuti Irrigation Scheme (KIGOMA RURAL District Council)
No
Identified Impact
Enhancement/Mitigation Measures
Performance Indicator Responsibility Time frame COST ESTMATES
1. Increase in incidences of insects and pests
Training on Proper use of pesticides
Use of IPM methodologies Introduction of pest resistant varieties
Number of farmers trained and practicing the technology
Number of farmers adopting IPM methodology
Farmers, DFT/WFT
Field Extension Officers
July 2012 – June 2014
4,400,000/=
2. Increase of water borne diseases
Create awareness on water borne diseases to the Community
Prevention of water borne diseases
Number of water borne diseases reported
Farmers, DFT/WFT
Field Extension Officers
July 2012 – June 2014
2,000,000/=
3. Occurrence of soil erosion
Training on soil and` water conservation
Training on water management
Use of soil erosion control measures
Number of farmers trained
Number of farmers trained
Number of acres with erosion control measures
Farmers, DFT/WFT
Field Extension Officers
July 2012 – June 2014
6,000,000/=
4. Increase in cases of Malaria
Create awareness on the disease to the Community
Reduce water pondage
Number of malaria cases reported
Farmers, DFT/WFT
Field Extension
July 2012 – June 2014
3,000,000/=
184

No
Identified Impact
Enhancement/Mitigation Measures
Performance Indicator Responsibility Time frame COST ESTMATES
Officers
5. Increase in use of Agrochemicals
Training on the use of IPM methodologies
Introduction of pest resistant varieties
Number of farmers adopting IPM methodology
Types of resistant varieties introduced
Number of acreage planted resistant varieties
Farmers, DFT/WFT
Field Extension Officers
July 2012 – June 2014
3,100,000/=
6. Conflicts among water users
Formation of water user association and irrigators Organization
Equitable allocation of water
Number of water users’ groups formed
Reduced number of water conflicts
Farmers, DFT/WFT
Field Extension Officers, PBWO, ZITSU
July 2012 – June 2014
2,000,000/=
7 Reduced downstream water flows
Adherence to water permits directive
Volume of water abstracted
Farmers, DFT/WFT
Field Extension Officers, PBWO
July 2012 – June 2014
3,000,000/=
8. Population influx resulting into increased cases of HIV
Awareness creation on HIV/AIDS
Number of new HIV/AIDS Cases reported
Farmers, DFT/WFT
Field Extension Officers
July 2012 – June 2014
2,000,000/=
185

49.A Environmental and Social Monitoring Plan
186

No Environmental Component to be Monitored
Method of Monitoring and Sampling Area
Frequency Verifiable indicator Responsibility
1. Increase in incidences of insects and pests
Periodic inspection Weekly Number of inspections
DFT/WFT and Extension Officers, Project Committee
2. Increase of water borne diseases
Follow up in Health Facilities
Monthly Number of cases recorded
DFT/WFT and Extension Officers, Project Committee, Health Officers
3. Occurrence of soil erosion Periodic inspection Annually Number of inspections
DFT/WFT and Extension Officers, Project Committee
4. Increase in cases of Malaria Follow up in Health Facilities
Monthly Number of cases recorded
DFT/WFT and Extension Officers, Project Committee, Health Officers
5. Increase in use of Agrochemicals
Soil analysis, Interviews Annually Number of Soil samples analyzed
DFT/WFT and Extension Officers, Project Committee,
6. Conflicts among water users Meetings, Visits and interviews
Monthly Number of cases recorded
DFT/WFT, Extension Officers, VEOs, Project Committee, PBWO, TZITSU
7. Reduced downstream water flows
Measurement of flows Annually Volume of water abstracted
DFT/WFT and Extension Officers, Project Committee, PBWO, TZITSU
8. Population influx resulting into increased cases of HIV
Follow up in Health Facilities, Interviews
Annually Number of cases recorded
DFT/WFT and Extension Officers, Project
187

188
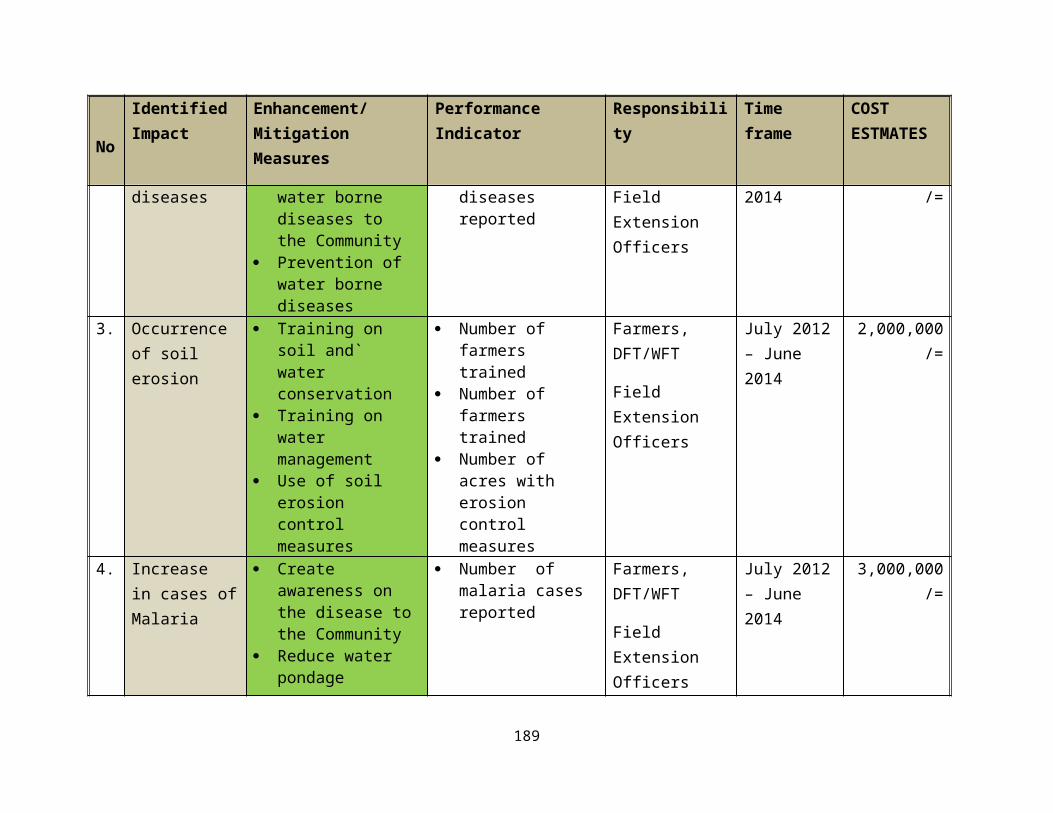
49. Msambara Irrigation Scheme (KASULU District Council)
No Identified Impact
Enhancement/Mitigation Measures
Performance Indicator Responsibility Time frame COST ESTMATES
1. Increase in incidences of insects and pests
Training on Proper use of pesticides
Use of IPM methodologies Introduction of pest resistant varieties
Number of farmers trained and practicing the technology
Number of farmers adopting IPM methodology
Farmers, DFT/WFTField Extension Officers
July 2012 – June 2014
6,000,000/=
2. Increase of water borne diseases
Create awareness on water borne diseases to the Community
Prevention of water borne diseases
Number of water borne diseases reported
Farmers, DFT/WFTField Extension Officers
July 2012 – June 2014
2,000,000/=
3. Occurrence of soil erosion
Training on soil and` water conservation
Training on water management
Use of soil erosion control measures
Number of farmers trained
Number of farmers trained
Number of acres with erosion control measures
Farmers, DFT/WFTField Extension Officers
July 2012 – June 2014
5,000,000/=
4. Increase in cases of Malaria
Create awareness on the disease to the Community
Reduce water pondage
Number of malaria cases reported
Farmers, DFT/WFTField Extension Officers
July 2012 – June 2014
3,000,000/=
5. Increase in use of Agrochemicals
Training on the use of IPM methodologies Introduction of pest
resistant varieties
Number of farmers adopting IPM methodology
Types of resistant
Farmers, DFT/WFTField Extension
July 2012 – June 2014
4,500,000/=
189
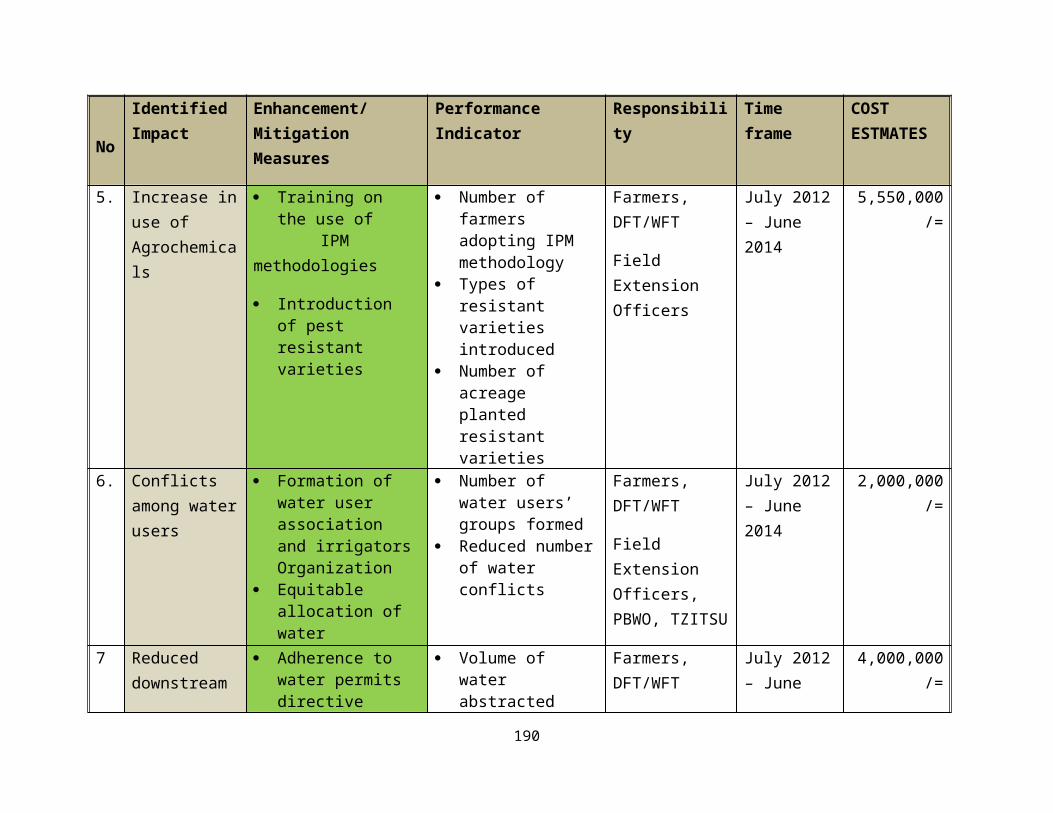
No Identified Impact
Enhancement/Mitigation Measures
Performance Indicator Responsibility Time frame COST ESTMATES
varieties introduced Number of acreage
planted resistant varieties
Officers
6. Conflicts among water users
Formation of water user association and irrigators Organization
Equitable allocation of water
Number of water users’ groups formed
Reduced number of water conflicts
Farmers, DFT/WFTField Extension Officers, PBWO, TZITSU
July 2012 – June 2014
1,000,000/=
7 Reduced downstream water flows
Adherence to water permits directive
Volume of water abstracted
Farmers, DFT/WFTField Extension Officers, PBWO
July 2012 – June 2014
3,000,000/=
8. Population influx resulting into increased cases of HIV
Awareness creation on HIV/AIDS
Number of new HIV/AIDS Cases reported
Farmers, DFT/WFTField Extension Officers
July 2012 – June 2014
2,000,000/=
190

50.A Environmental and Social Monitoring Plan
191

No Environmental Component to be Monitored
Method of Monitoring and Sampling Area
Frequency Verifiable indicator Responsibility
1. Increase in incidences of insects and pests
Periodic inspection Weekly Number of inspections
DFT/WFT and Extension Officers, Project Committee
2. Increase of water borne diseases
Follow up in Health Facilities
Monthly Number of cases recorded
DFT/WFT and Extension Officers, Project Committee, Health Officers
3. Occurrence of soil erosion Periodic inspection Annually Number of inspections
DFT/WFT and Extension Officers, Project Committee
4. Increase in cases of Malaria Follow up in Health Facilities
Monthly Number of cases recorded
DFT/WFT and Extension Officers, Project Committee, Health Officers
5. Increase in use of Agrochemicals
Soil analysis, Interviews Annually Number of Soil samples analyzed
DFT/WFT and Extension Officers, Project Committee
6. Conflicts among water users Meetings, Visits and interviews
Monthly Number of cases recorded
DFT/WFT ,Extension Officers, VEOs, Project Committee, PBWO, TZITSU
7. Reduced downstream water flows
Measurement of flows Annually Volume of water abstracted
DFT/WFT and Extension Officers, Project Committee, PBWO, TZITSU
8. Population influx resulting into increased cases of HIV
Follow up in Health Facilities, Interviews
Annually Number of cases recorded
DFT/WFT and Extension Officers, Project
192

50. Muhwazi Irrigation Scheme (KAKONKO District Council)
No Identified Impact
Enhancement/Mitigation Measures
Performance Indicator Responsibility Time frame COST ESTMATES
1. Increase in incidences of insects and pests
Training on Proper use of pesticides
Use of IPM methodologies Introduction of pest resistant varieties
Number of farmers trained and practicing the technology
Number of farmers adopting IPM methodology
Farmers, DFT/WFT
Field Extension Officers
July 2012 – June 2014
7,400,000/=
2. Increase of water borne diseases
Create awareness on water borne diseases to the Community
Prevention of water borne diseases
Number of water borne diseases reported
Farmers, DFT/WFT
Field Extension Officers
July 2012 – June 2014
2,500,000/=
3. Occurrence of soil erosion
Training on soil and` water conservation
Training on water management
Use of soil erosion control measures
Number of farmers trained
Number of farmers trained
Number of acres with erosion control measures
Farmers, DFT/WFT
Field Extension Officers
July 2012 – June 2014
5,000,000/=
4. Increase in cases of Malaria
Create awareness on the disease to the Community
Reduce water pondage
Number of malaria cases reported
Farmers, DFT/WFT
Field Extension Officers
July 2012 – June 2014
3,500,000/=
193

No Identified Impact
Enhancement/Mitigation Measures
Performance Indicator Responsibility Time frame COST ESTMATES
5. Increase in use of Agrochemicals
Training on the use of IPM methodologies
Introduction of pest resistant varieties
Number of farmers adopting IPM methodology
Types of resistant varieties introduced
Number of acreage planted resistant varieties
Farmers, DFT/WFT
Field Extension Officers
July 2012 – June 2014
5,100,000/=
6. Conflicts among water users
Formation of water user association and irrigators Organization
Equitable allocation of water
Number of water users’ groups formed
Reduced number of water conflicts
Farmers, DFT/WFT
Field Extension Officers, PBWO, TZITSU
July 2012 – June 2014
3,700,000/=
7 Reduced downstream water flows
Adherence to water permits directive
Volume of water abstracted
Farmers, DFT/WFT
Field Extension Officers, PBWO
July 2012 – June 2014
2,500,000/=
8. Population influx resulting into increased cases of HIV
Awareness creation on HIV/AIDS
Number of new HIV/AIDS Cases reported
Farmers, DFT/WFT
Field Extension Officers
July 2012 – June 2014
2,500,000/=
194

51.A Environmental and Social Monitoring Plan
195

No Environmental Component to be Monitored
Method of Monitoring and Sampling Area
Frequency Verifiable indicator Responsibility
1. Increase in incidences of insects and pests
Periodic inspection Weekly Number of inspections
DFT/WFT and Extension Officers, Project Committee
2. Increase of water borne diseases
Follow up in Health Facilities
Monthly Number of cases recorded
DFT/WFT and Extension Officers, Project Committee, Health Officers
3. Occurrence of soil erosion Periodic inspection Annually Number of inspections
DFT/WFT and Extension Officers, Project Committee,
4. Increase in cases of Malaria Follow up in Health Facilities
Monthly Number of cases recorded
DFT/WFT and Extension Officers, Project Committee, Health Officers
5. Increase in use of Agrochemicals
Soil analysis, Interviews Annually Number of Soil samples analyzed
DFT/WFT and Extension Officers, Project Committee
6. Conflicts among water users Meetings, Visits and interviews
Monthly Number of cases recorded
DFT/WFT ,Extension Officers, VEOs, Project Committee, PBWO, TZITSU
7. Reduced downstream water flows
Measurement of flows Annually Volume of water abstracted
DFT/WFT and Extension Officers, Project Committee, PBWO, TZITSU
8. Population influx resulting into increased cases of HIV
Follow up in Health Facilities, Interviews
Annually Number of cases recorded
DFT/WFT and Extension Officers, Project
196

197

51. Mwiruzi Irrigation Scheme (KAKONKO District Council)
No
Identified Impact
Enhancement/Mitigation Measures
Performance Indicator Responsibility Time frame COST ESTMATES
1. Increase in incidences of insects and pests
Training on Proper use of pesticides
Use of IPM methodologies Introduction of pest resistant varieties
Number of farmers trained and practicing the technology
Number of farmers adopting IPM methodology
Farmers, DFT/WFTField Extension Officers
July 2012 – June 2014
4,500,000/=
2. Increase of water borne diseases
Create awareness on water borne diseases to the Community
Prevention of water borne diseases
Number of water borne diseases reported
Farmers, DFT/WFTField Extension Officers
July 2012 – June 2014
2,000,000/=
3. Occurrence of soil erosion
Training on soil and` water conservation
Training on water management
Use of soil erosion control measures
Number of farmers trained
Number of farmers trained
Number of acres with erosion control measures
Farmers, DFT/WFTField Extension Officers
July 2012 – June 2014
2,000,000/=
4. Increase in cases of Malaria
Create awareness on the disease to the Community
Reduce water pondage
Number of malaria cases reported
Farmers, DFT/WFTField Extension Officers
July 2012 – June 2014
3,500,000/=
5. Increase in use of Agrochemicals
Training on the use of IPM methodologies Introduction of pest
Number of farmers adopting IPM methodology
Farmers, DFT/WFTField Extension
July 2012 – June 2014
4,000,000/=
198

No
Identified Impact
Enhancement/Mitigation Measures
Performance Indicator Responsibility Time frame COST ESTMATES
resistant varieties Types of resistant varieties introduced
Number of acreage planted resistant varieties
Officers
6. Conflicts among water users
Formation of water user association and irrigators Organization
Equitable allocation of water
Number of water users’ groups formed
Reduced number of water conflicts
Farmers, DFT/WFTField Extension Officers PBWO, TZITSU
July 2012 – June 2014
4,000,000/=
7 Reduced downstream water flows
Adherence to water permits directive
Volume of water abstracted
Farmers, DFT/WFTField Extension Officers, PBWO
July 2012 – June 2014
3,000,000/=
8. Population influx resulting into increased cases of HIV
Awareness creation on HIV/AIDS
Number of new HIV/AIDS Cases reported
Farmers, DFT/WFTField Extension Officers
July 2012 – June 2014
2,000,000/=
199

52.A Environmental and Social Monitoring Plan
200

No Environmental Component to be Monitored
Method of Monitoring and Sampling Area
Frequency Verifiable indicator Responsibility
1. Increase in incidences of insects and pests
Periodic inspection Weekly Number of inspections
DFT/WFT and Extension Officers, Project Committee,
2. Increase of water borne diseases
Follow up in Health Facilities
Monthly Number of cases recorded
DFT/WFT and Extension Officers, Project Committee, Health Officers
3. Occurrence of soil erosion Periodic inspection Annually Number of inspections
DFT/WFT and Extension Officers, Project Committee
4. Increase in cases of Malaria Follow up in Health Facilities
Monthly Number of cases recorded
DFT/WFT and Extension Officers, Project Committee, Health Officers
5. Increase in use of Agrochemicals
Soil analysis, Interviews Annually Number of Soil samples analyzed
DFT/WFT and Extension Officers, Project Committee
6. Conflicts among water users Meetings, Visits and interviews
Monthly Number of cases recorded
DFT/WFT, Extension Officers, VEOs, Project Committee, PBWO, TZITSU
7. Reduced downstream water flows
Measurement of flows Annually Volume of water abstracted
DFT/WFT and Extension Officers, Project Committee, PBWO, TZITSU
8. Population influx resulting into increased cases of HIV
Follow up in Health Facilities, Interviews
Annually Number of cases recorded
DFT/WFT and Extension Officers, Project
201

52. Konkwa Irrigation Scheme (UVINZA District Council)
No Identified Impact
Enhancement/Mitigation Measures
Performance Indicator Responsibility Time frame COST ESTMATES
1. Increase in incidences of insects and pests
Training on Proper use of pesticides
Use of IPM methodologies Introduction of pest resistant varieties
Number of farmers trained and practicing the technology
Number of farmers adopting IPM methodology
Farmers, DFT/WFT
Field Extension Officers
July 2012 – June 2014
7,400,000/=
2. Increase of water borne diseases
Create awareness on water borne diseases to the Community
Prevention of water borne diseases
Number of water borne diseases reported
Farmers, DFT/WFT
Field Extension Officers
July 2012 – June 2014
2,000,000/=
3. Occurrence of soil erosion
Training on soil and` water conservation
Training on water management
Use of soil erosion control measures
Number of farmers trained
Number of farmers trained
Number of acres with erosion control measures
Farmers, DFT/WFT
Field Extension Officers
July 2012 – June 2014
1,000,000/=
4. Increase in cases of Malaria
Create awareness on the disease to the Community
Reduce water pondage
Number of malaria cases reported
Farmers, DFT/WFT
Field Extension
July 2012 – June 2014
3,000,000/=
202

No Identified Impact
Enhancement/Mitigation Measures
Performance Indicator Responsibility Time frame COST ESTMATES
Officers
5. Increase in use of Agrochemicals
Training on the use of
IPM methodologies
Introduction of pest resistant varieties
Number of farmers adopting IPM methodology
Types of resistant varieties introduced
Number of acreage planted resistant varieties
Farmers, DFT/WFT
Field Extension Officers
July 2012 – June 2014
1,100,000/=
6. Conflicts among water users
Formation of water user association and irrigators Organization
Equitable allocation of water
Number of water users’ groups formed
Reduced number of water conflicts
Farmers, DFT/WFT
Field Extension Officers PBWO,TZITSU
July 2012 – June 2014
4,000,000/=
7 Reduced downstream water flows
Adherence to water permits directive
Volume of water abstracted
Farmers, DFT/WFT
Field Extension Officers, PBWO
July 2012 – June 2014
3,000,000/=
8. Population influx resulting into increased cases of HIV
Awareness creation on HIV/AIDS
Number of new HIV/AIDS Cases reported
Farmers, DFT/WFT
Field Extension Officers
July 2012 – June 2014
2,000,000/=
203

204

53.A Environmental and Social Monitoring Plan
205
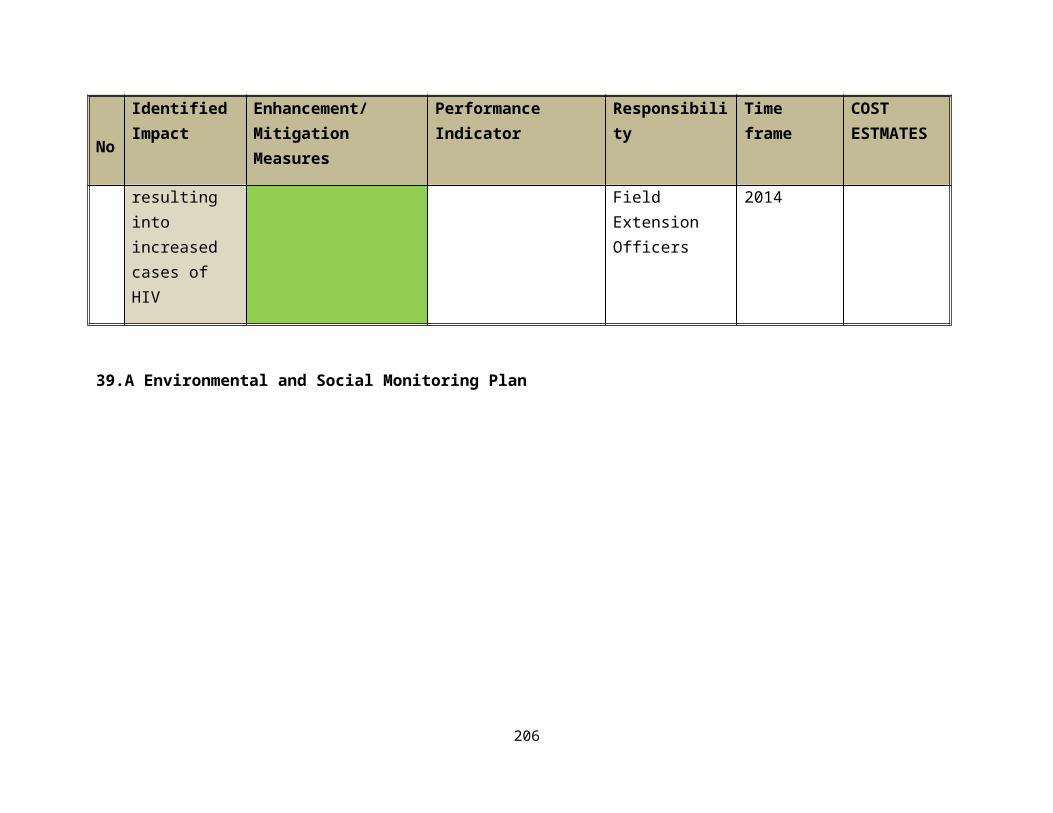
No Environmental Component to be Monitored
Method of Monitoring and Sampling Area
Frequency Verifiable indicator Responsibility
1. Increase in incidences of insects and pests
Periodic inspection Weekly Number of inspections
DFT/WFT and Extension Officers, Project Committee
2. Increase of water borne diseases
Follow up in Health Facilities
Monthly Number of cases recorded
DFT/WFT and Extension Officers, Project Committee, Health Officers
3. Occurrence of soil erosion Periodic inspection Annually Number of inspections
DFT/WFT and Extension Officers, Project Committee
4. Increase in cases of Malaria Follow up in Health Facilities
Monthly Number of cases recorded
DFT/WFT and Extension Officers, Project Committee, Health Officers
5. Increase in use of Agrochemicals
Soil analysis, Interviews Annually Number of Soil samples analyzed
DFT/WFT and Extension Officers, Project Committee,
6. Conflicts among water users Meetings, Visits and interviews
Monthly Number of cases recorded
DFT/WFT ,Extension Officers, VEOs, Project Committee, PBWO,TZITSU
7. Reduced downstream water flows
Measurement of flows Annually Volume of water abstracted
DFT/WFT and Extension Officers, Project Committee, PBWO,TZITSU
8. Population influx resulting into increased cases of HIV
Follow up in Health Facilities, Interviews
Annually Number of cases recorded
DFT/WFT and Extension Officers, Project
206

53. Nyendara Irrigation Scheme (KIBONDO District Council)
No Identified Impact
Enhancement/Mitigation Measures
Performance Indicator Responsibility Time frame COST ESTMATES
1. Increase in incidences of insects and pests
Training on Proper use of pesticides
Use of IPM methodologies Introduction of pest resistant varieties
Number of farmers trained and practicing the technology
Number of farmers adopting IPM methodology
Farmers, DFT/WFTField Extension Officers
July 2012 – June 2014
5,500,000/=
2. Increase of water borne diseases
Create awareness on water borne diseases to the Community
Prevention of water borne diseases
Number of water borne diseases reported
Farmers, DFT/WFTField Extension Officers
July 2012 – June 2014
2,000,000/=
3. Occurrence of soil erosion
Training on soil and` water conservation
Training on water management
Use of soil erosion control measures
Number of farmers trained
Number of farmers trained
Number of acres with erosion control measures
Farmers, DFT/WFTField Extension Officers
July 2012 – June 2014
3,000,000/=
4. Increase in cases of Malaria
Create awareness on the disease to the Community
Reduce water pondage
Number of malaria cases reported
Farmers, DFT/WFTField Extension Officers
July 2012 – June 2014
3,000,000/=
5. Increase in use of Agrochemicals
Training on the use of IPM methodologies Introduction of pest
Number of farmers adopting IPM methodology
Farmers, DFT/WFTField Extension
July 2012 – June 2014
2,000,000/=
207

No Identified Impact
Enhancement/Mitigation Measures
Performance Indicator Responsibility Time frame COST ESTMATES
resistant varieties Types of resistant varieties introduced
Number of acreage planted resistant varieties
Officers
6. Conflicts among water users
Formation of water user association and irrigators Organization
Equitable allocation of water
Number of water users’ groups formed
Reduced number of water conflicts
Farmers, DFT/WFTField Extension Officers PBWO,TZITSU
July 2012 – June 2014
3,000,000/=
7 Reduced downstream water flows
Adherence to water permits directive
Volume of water abstracted
Farmers, DFT/WFTField Extension Officers, PBWO
July 2012 – June 2014
4,000,000/=
8. Population influx resulting into increased cases of HIV
Awareness creation on HIV/AIDS
Number of new HIV/AIDS Cases reported
Farmers, DFT/WFTField Extension Officers
July 2012 – June 2014
2,000,000/=
54.A Environmental and Social Monitoring Plan
208

No Environmental Component to be Monitored
Method of Monitoring and Sampling Area
Frequency Verifiable indicator Responsibility
1. Increase in incidences of insects and pests
Periodic inspection Weekly Number of inspections
DFT/WFT and Extension Officers, Project Committee
2. Increase of water borne diseases
Follow up in Health Facilities
Monthly Number of cases recorded
DFT/WFT and Extension Officers, Project Committee, Health Officers
3. Occurrence of soil erosion Periodic inspection Annually Number of inspections
DFT/WFT and Extension Officers, Project Committee
4. Increase in cases of Malaria Follow up in Health Facilities
Monthly Number of cases recorded
DFT/WFT and Extension Officers, Project Committee, Health Officers
5. Increase in use of Agrochemicals
Soil analysis, Interviews Annually Number of Soil samples analyzed
DFT/WFT and Extension Officers, Project Committee
6. Conflicts among water users Meetings, Visits and interviews
Monthly Number of cases recorded
DFT/WFT, Extension Officers, VEOs, Project Committee, PBWO,TZITSU
7. Reduced downstream water flows
Measurement of flows Annually Volume of water abstracted
DFT/WFT and Extension Officers, Project Committee, PBWO,TZITSU
8. Population influx resulting into increased cases of HIV
Follow up in Health Facilities, Interviews
Annually Number of cases recorded
DFT/WFT and Extension Officers, Project
209

56. Ruhwiti Irrigation Scheme (KIBONDO District Council)
No Identified Impact
Enhancement/Mitigation Measures
Performance Indicator Responsibility Time frame COST ESTMATES
1. Increase in incidences of insects and pests
Training on Proper use of pesticides
Use of IPM methodologies Introduction of pest resistant varieties
Number of farmers trained and practicing the technology
Number of farmers adopting IPM methodology
Farmers, DFT/WFT
Field Extension Officers
July 2012 – June 2014
8,500,000/=
2. Increase of water borne diseases
Create awareness on water borne diseases to the Community
Prevention of water borne diseases
Number of water borne diseases reported
Farmers, DFT/WFT
Field Extension Officers
July 2012 – June 2014
2,000,000/=
3. Occurrence of soil erosion
Training on soil and` water conservation
Training on water management
Use of soil erosion control measures
Number of farmers trained
Number of farmers trained
Number of acres with erosion control measures
Farmers, DFT/WFT
Field Extension Officers
July 2012 – June 2014
2,000,000/=
4. Increase in cases of Malaria
Create awareness on the disease to the Community
Reduce water pondage
Number of malaria cases reported
Farmers, DFT/WFT
Field Extension Officers
July 2012 – June 2014
1,000,000/=
210

No Identified Impact
Enhancement/Mitigation Measures
Performance Indicator Responsibility Time frame COST ESTMATES
5. Increase in use of Agrochemicals
Training on the use of IPM methodologies
Introduction of pest resistant varieties
Number of farmers adopting IPM methodology
Types of resistant varieties introduced
Number of acreage planted resistant varieties
Farmers, DFT/WFT
Field Extension Officers
July 2012 – June 2014
3,000,000/=
6. Conflicts among water users
Formation of water user association and irrigators Organization
Equitable allocation of water
Number of water users’ groups formed
Reduced number of water conflicts
Farmers, DFT/WFT
Field Extension Officers PBWO,TZITSU
July 2012 – June 2014
4,000,000/=
7 Reduced downstream water flows
Adherence to water permits directive
Volume of water abstracted
Farmers, DFT/WFT
Field Extension Officers, PBWO
July 2012 – June 2014
4,000,000/=
8. Population influx resulting into increased cases of HIV
Awareness creation on HIV/AIDS
Number of new HIV/AIDS Cases reported
Farmers, DFT/WFT
Field Extension Officers
July 2012 – June 2014
2,000,000/=
211

212

56.A Environmental and Social Monitoring Plan
213

No Environmental Component to be Monitored
Method of Monitoring and Sampling Area
Frequency Verifiable indicator Responsibility
1. Increase in incidences of insects and pests
Periodic inspection Weekly Number of inspections
DFT/WFT and Extension Officers, Project Committee
2. Increase of water borne diseases
Follow up in Health Facilities
Monthly Number of cases recorded
DFT/WFT and Extension Officers, Project Committee, Health Officers
3. Occurrence of soil erosion Periodic inspection Annually Number of inspections
DFT/WFT and Extension Officers, Project Committee
4. Increase in cases of Malaria Follow up in Health Facilities
Monthly Number of cases recorded
DFT/WFT and Extension Officers, Project Committee, Health Officers
5. Increase in use of Agrochemicals
Soil analysis, ,Interviews Annually Number of Soil samples analyzed
DFT/WFT and Extension Officers, Project Committee
6. Conflicts among water users Meetings, Visits and interviews
Monthly Number of cases recorded
DFT/WFT, Extension Officers, VEOs, Project Committee, PBWO,TZITSU
7. Reduced downstream water flows
Measurement of flows Annually Volume of water abstracted
DFT/WFT and Extension Officers, Project Committee, PBWO,TZITSU
8. Population influx resulting into increased cases of HIV
Follow up in Health Facilities, Interviews
Annually Number of cases recorded
DFT/WFT and Extension Officers, Project
214

57. Shitage Irrigation Scheme (UYUI District Council)
No Identified Impact
Enhancement/Mitigation Measures
Performance Indicator Responsibility Time frame COST ESTMATES
1. Increase in incidences of insects and pests
Training on Proper use of pesticides
Use of IPM methodologies Introduction of pest resistant varieties
Number of farmers trained and practicing the technology
Number of farmers adopting IPM methodology
Farmers, DFT/WFT
Field Extension Officers
July 2012 – June 2014
7,600,000/=
2. Increase of water borne diseases
Create awareness on water borne diseases to the Community
Prevention of water borne diseases
Number of water borne diseases reported
Farmers, DFT/WFT
Field Extension Officers
July 2012 – June 2014
2,000,000/=
3. Occurrence of soil erosion
Training on soil and` water conservation
Training on water management
Use of soil erosion control measures
Number of farmers trained
Number of farmers trained
Number of acres with erosion control measures
Farmers, DFT/WFT
Field Extension Officers
July 2012 – June 2014
4,000,000/=
4. Increase in cases of Malaria
Create awareness on the disease to the Community
Reduce water pondage
Number of malaria cases reported
Farmers, DFT/WFT
Field Extension Officers
July 2012 – June 2014
3,000,000/=
215

No Identified Impact
Enhancement/Mitigation Measures
Performance Indicator Responsibility Time frame COST ESTMATES
5. Increase in use of Agrochemicals
Training on the use of IPM methodologies
Introduction of pest resistant varieties
Number of farmers adopting IPM methodology
Types of resistant varieties introduced
Number of acreage planted resistant varieties
Farmers, DFT/WFT
Field Extension Officers
July 2012 – June 2014
5,400,000/=
6. Conflicts among water users
Formation of water user association and irrigators Organization
Equitable allocation of water
Number of water users’ groups formed
Reduced number of water conflicts
Farmers, DFT/WFT
Field Extension Officers PBWO,TZITSU
July 2012 – June 2014
4,000,000/=
7 Reduced downstream water flows
Adherence to water permits directive
Volume of water abstracted
Farmers, DFT/WFT
Field Extension Officers, PBWO
July 2012 – June 2014
3,000,000/=
8. Population influx resulting into increased cases of HIV
Awareness creation on HIV/AIDS
Number of new HIV/AIDS Cases reported
Farmers, DFT/WFT
Field Extension Officers
July 2012 – June 2014
2,000,000/=
216

57.A Environmental and Social Monitoring Plan
217

No Environmental Component to be Monitored
Method of Monitoring and Sampling Area
Frequency Verifiable indicator Responsibility
1. Increase in incidences of insects and pests
Periodic inspection Weekly Number of inspections
DFT/WFT and Extension Officers, Project Committee
2. Increase of water borne diseases
Follow up in Health Facilities
Monthly Number of cases recorded
DFT/WFT and Extension Officers, Project Committee, Health Officers
3. Occurrence of soil erosion Periodic inspection Annually Number of inspections
DFT/WFT and Extension Officers, Project Committee,
4. Increase in cases of Malaria Follow up in Health Facilities
Monthly Number of cases recorded
DFT/WFT and Extension Officers, Project Committee, Health Officers
5. Increase in use of Agrochemicals
Soil analysis, ,Interviews Annually Number of Soil samples analyzed
DFT/WFT and Extension Officers, Project Committee,
6. Conflicts among water users Meetings, Visits and interviews
Monthly Number of cases recorded
DFT/WFT ,Extension Officers, VEOs, Project Committee, PBWO,TZITSU
7. Reduced downstream water flows
Measurement of flows Annually Volume of water abstracted
DFT/WFT and Extension Officers, Project
218

219

58. Titye Irrigation Scheme (KASULU District Council)
No Identified Impact
Enhancement/Mitigation Measures
Performance Indicator Responsibility Time frame COST ESTMATES
1. Increase in incidences of insects and pests
Training on Proper use of pesticides
Use of IPM methodologies Introduction of pest resistant varieties
Number of farmers trained and practicing the technology
Number of farmers adopting IPM methodology
Farmers, DFT/WFT
Field Extension Officers
July 2012 – June 2014
6,000,000/=
2. Increase of water borne diseases
Create awareness on water borne diseases to the Community
Prevention of water borne diseases
Number of water borne diseases reported
Farmers, DFT/WFT
Field Extension Officers
July 2012 – June 2014
2,000,000/=
3. Occurrence of soil erosion
Training on soil and` water conservation
Training on water management
Use of soil erosion control measures
Number of farmers trained
Number of farmers trained
Number of acres with erosion control measures
Farmers, DFT/WFT
Field Extension Officers
July 2012 – June 2014
7,000,000/=
4. Increase in cases of Malaria
Create awareness on the disease to the Community
Reduce water pondage
Number of malaria cases reported
Farmers, DFT/WFT
Field Extension Officers
July 2012 – June 2014
3,000,000/=
5. Increase in use Training on the use of Number of farmers Farmers, July 2012 – 7,000,000/=
220

No Identified Impact
Enhancement/Mitigation Measures
Performance Indicator Responsibility Time frame COST ESTMATES
of Agrochemicals
IPM methodologies
Introduction of pest resistant varieties
adopting IPM methodology
Types of resistant varieties introduced
Number of acreage planted resistant varieties
DFT/WFT
Field Extension Officers
June 2014
6. Conflicts among water users
Formation of water user association and irrigators Organization
Equitable allocation of water
Number of water users’ groups formed
Reduced number of water conflicts
Farmers, DFT/WFT
Field Extension Officers PBWO,TZITSU
July 2012 – June 2014
3,000,000/=
7 Reduced downstream water flows
Adherence to water permits directive
Volume of water abstracted
Farmers, DFT/WFT
Field Extension Officers, PBWO
July 2012 – June 2015
4,000,000/=
8. Population influx resulting into increased cases of HIV
Awareness creation on HIV/AIDS
Number of new HIV/AIDS Cases reported
Farmers, DFT/WFT
Field Extension Officers
July 2012 – June 2015
2,000,000/=
221

A Environmental and Social Monitoring Plan
222

No Environmental Component to be Monitored
Method of Monitoring and Sampling Area
Frequency Verifiable indicator Responsibility
1. Increase in incidences of insects and pests
Periodic inspection Weekly Number of inspections
DFT/WFT and Extension Officers, Project Committee
2. Increase of water borne diseases
Follow up in Health Facilities
Monthly Number of cases recorded
DFT/WFT and Extension Officers, Project Committee, Health Officers
3. Occurrence of soil erosion Periodic inspection Annually Number of inspections
DFT/WFT and Extension Officers, Project Committee
4. Increase in cases of Malaria Follow up in Health Facilities
Monthly Number of cases recorded
DFT/WFT and Extension Officers, Project Committee, Health Officers
5. Increase in use of Agrochemicals
Soil analysis, ,Interviews Annually Number of Soil samples analyzed
DFT/WFT and Extension Officers, Project Committee
6. Conflicts among water users Meetings, Visits and interviews
Monthly Number of cases recorded
DFT/WFT ,Extension Officers, VEOs, Project Committee, PBWO,TZITSU
7. Reduced downstream water flows
Measurement of flows Annually Volume of water abstracted
DFT/WFT and Extension Officers, Project Committee, PBWO,TZITSU
8. Population influx resulting into increased cases of HIV
Follow up in Health Facilities, Interviews
Annually Number of cases recorded
DFT/WFT and Extension Officers, Project
223

59. Ulindwanoni Dam (URAMBO District Council)
No Identified Impact
Enhancement/Mitigation Measures
Performance Indicator Responsibility Time frame COST ESTMATES
1. Increase in incidences of insects and pests
Training on Proper use of pesticides
Use of IPM methodologies Introduction of pest resistant varieties
Number of farmers trained and practicing the technology
Number of farmers adopting IPM methodology
Farmers, DFT/WFT
Field Extension Officers
July 2012 – June 2014
4,500,000/=
2. Increase of water borne diseases
Create awareness on water borne diseases to the Community
Prevention of water borne diseases
Number of water borne diseases reported
Farmers, DFT/WFT
Field Extension Officers
July 2012 – June 2014
2,000,000/=
3. Occurrence of soil erosion
Training on soil and` water conservation
Training on water management
Use of soil erosion control measures
Number of farmers trained
Number of farmers trained
Number of acres with erosion control measures
Farmers, DFT/WFT
Field Extension Officers
July 2012 – June 2014
4,000,000/=
4. Increase in cases of Malaria
Create awareness on the disease to the Community
Reduce water pondage
Number of malaria cases reported
Farmers, DFT/WFT
Field Extension Officers
July 2012 – June 2014
3,000,000/=
224

No Identified Impact
Enhancement/Mitigation Measures
Performance Indicator Responsibility Time frame COST ESTMATES
5. Increase in use of Agrochemicals
Training on the use of IPM methodologies
Introduction of pest resistant varieties
Number of farmers adopting IPM methodology
Types of resistant varieties introduced
Number of acreage planted resistant varieties
Farmers, DFT/WFT
Field Extension Officers
July 2012 – June 2014
5,000,000/=
6. Conflicts among water users
Formation of water user association and irrigators Organization
Equitable allocation of water
Number of water users’ groups formed
Reduced number of water conflicts
Farmers, DFT/WFT
Field Extension Officers PBWO,TZITSU
July 2012 – June 2014
4,000,000/=
7 Reduced downstream water flows
Adherence to water permits directive
Volume of water abstracted
Farmers, DFT/WFT
Field Extension Officers, PBWO
July 2012 – June 2014
4,000,000/=
8. Population influx resulting into increased cases of HIV
Awareness creation on HIV/AIDS
Number of new HIV/AIDS Cases reported
Farmers, DFT/WFT
Field Extension Officers
July 2012 – June 2014
2,000,000/=
225

59.A Environmental and Social Monitoring Plan
226

No Environmental Component to be Monitored
Method of Monitoring and Sampling Area
Frequency Verifiable indicator Responsibility
1. Increase in incidences of insects and pests
Periodic inspection Weekly Number of inspections
DFT/WFT and Extension Officers, Project Committee
2. Increase of water borne diseases
Follow up in Health Facilities
Monthly Number of cases recorded
DFT/WFT and Extension Officers, Project Committee, Health Officers
3. Occurrence of soil erosion Periodic inspection Annually Number of inspections
DFT/WFT and Extension Officers, Project Committee,
4. Increase in cases of Malaria Follow up in Health Facilities
Monthly Number of cases recorded
DFT/WFT and Extension Officers, Project Committee, Health Officers
5. Increase in use of Agrochemicals
Soil analysis, ,Interviews Annually Number of Soil samples analyzed
DFT/WFT and Extension Officers, Project Committee
6. Conflicts among water users Meetings, Visits and interviews
Monthly Number of cases recorded
DFT/WFT, Extension Officers, VEOs, Project Committee, PBWO,TZITSU
7. Reduced downstream water flows
Measurement of flows Annually Volume of water abstracted
DFT/WFT and Extension Officers, Project Committee, PBWO,TZITSU
8. Population influx resulting into increased cases of HIV
Follow up in Health Facilities, Interviews
Annually Number of cases recorded
DFT/WFT and Extension Officers, Project
227

228
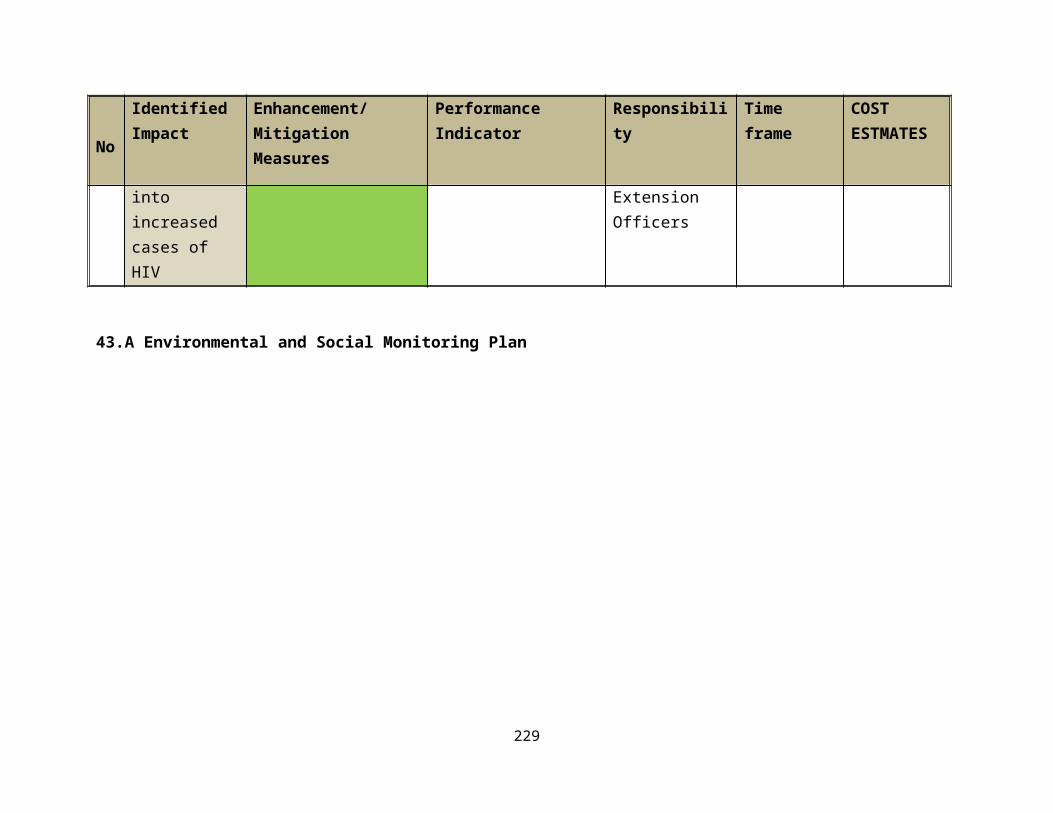
60. Ulyanyama Irrigation Scheme. (SIKONGE District Council)
No Identified Impact
Enhancement/Mitigation Measures
Performance Indicator Responsibility Time frame COST ESTMATES
1. Increase in incidences of insects and pests
Training on Proper use of pesticides
Use of IPM methodologies Introduction of pest resistant varieties
Number of farmers trained and practicing the technology
Number of farmers adopting IPM methodology
Farmers, DFT/WFT
Field Extension Officers
July 2012 – June 2014
7,500,000/=
2. Increase of water borne diseases
Create awareness on water borne diseases to the Community
Prevention of water borne diseases
Number of water borne diseases reported
Farmers, DFT/WFT
Field Extension Officers
July 2012 – June 2014
2,000,000/=
3. Occurrence of soil erosion
Training on soil and` water conservation
Training on water management
Use of soil erosion control measures
Number of farmers trained
Number of farmers trained
Number of acres with erosion control measures
Farmers, DFT/WFT
Field Extension Officers
July 2012 – June 2014
3,000,000/=
4. Increase in cases of Malaria
Create awareness on the disease to the Community
Reduce water pondage
Number of malaria cases reported
Farmers, DFT/WFT
Field Extension Officers
July 2012 – June 2014
3,000,000/=
5. Increase in use Training on the use of Number of farmers Farmers, July 2012 – 4,000,000/=
229

No Identified Impact
Enhancement/Mitigation Measures
Performance Indicator Responsibility Time frame COST ESTMATES
of Agrochemicals
IPM methodologies
Introduction of pest resistant varieties
adopting IPM methodology
Types of resistant varieties introduced
Number of acreage planted resistant varieties
DFT/WFT
Field Extension Officers
June 2014
6. Conflicts among water users
Formation of water user association and irrigators Organization
Equitable allocation of water
Number of water users’ groups formed
Reduced number of water conflicts
Farmers, DFT/WFT
Field Extension Officers PBWO,TZITSU
July 2012 – June 2014
2,000,000/=
7 Reduced downstream water flows
Adherence to water permits directive
Volume of water abstracted
Farmers, DFT/WFT
Field Extension Officers, PBWO
July 2012 – June 2014
4,000,000/=
8. Population influx resulting into increased cases of HIV
Awareness creation on HIV/AIDS
Number of new HIV/AIDS Cases reported
Farmers, DFT/WFT
Field Extension Officers
July 2012 – June 2014
2,000,000/=
230

60.A Environmental and Social Monitoring Plan
231

No Environmental Component to be Monitored
Method of Monitoring and Sampling Area
Frequency Verifiable indicator Responsibility
1. Increase in incidences of insects and pests
Periodic inspection Weekly Number of inspections
DFT/WFT and Extension Officers, Project Committee
2. Increase of water borne diseases
Follow up in Health Facilities
Monthly Number of cases recorded
DFT/WFT and Extension Officers, Project Committee, Health Officers
3. Occurrence of soil erosion Periodic inspection Annually Number of inspections
DFT/WFT and Extension Officers, Project Committee,
4. Increase in cases of Malaria Follow up in Health Facilities
Monthly Number of cases recorded
DFT/WFT and Extension Officers, Project Committee, Health Officers
5. Increase in use of Agrochemicals
Soil analysis, Interviews Annually Number of Soil samples analyzed
DFT/WFT and Extension Officers, Project Committee
6. Conflicts among water users Meetings, Visits and interviews
Monthly Number of cases recorded
DFT/WFT ,Extension Officers, VEOs, Project Committee, PBWO,TZITSU
7. Reduced downstream water flows
Measurement of flows Annually Volume of water abstracted
DFT/WFT and Extension Officers, Project Committee, PBWO,TZITSU
8. Population influx resulting Follow up in Health Annually Number of cases DFT/WFT and Extension 232

61. Ussoke Mlimani Irrigation Scheme (URAMBO District Council)
No
Identified Impact Enhancement/Mitigation Measures
Performance Indicator Responsibility Time frame COST ESTMATES
1. Increase in incidences of insects and pests
Training on Proper use of pesticides
Use of IPM methodologies Introduction of pest resistant varieties
Number of farmers trained and practicing the technology
Number of farmers adopting IPM methodology
Farmers, DFT/WFT
Field Extension Officers
July 2012 – June 2014
3,500,000/=
2. Increase of water borne diseases
Create awareness on water borne diseases to the Community
Prevention of water borne diseases
Number of water borne diseases reported
Farmers, DFT/WFT
Field Extension Officers
July 2012 – June 2014
2,000,000/=
3. Occurrence of soil erosion
Training on soil and` water conservation
Training on water management
Use of soil erosion control measures
Number of farmers trained
Number of farmers trained
Number of acres with erosion control measures
Farmers, DFT/WFT
Field Extension Officers
July 2012 – June 2014
4,000,000/=
4. Increase in cases of Malaria
Create awareness on the disease to the Community
Reduce water pondage
Number of malaria cases reported
Farmers, DFT/WFT
Field Extension Officers
July 2012 – June 2014
3,000,000/=
233

No
Identified Impact Enhancement/Mitigation Measures
Performance Indicator Responsibility Time frame COST ESTMATES
5. Increase in use of Agrochemicals
Training on the use of
IPM methodologies
Introduction of pest resistant varieties
Number of farmers adopting IPM methodology
Types of resistant varieties introduced
Number of acreage planted resistant varieties
Farmers, DFT/WFT
Field Extension Officers
July 2012 – June 2014
6,000,000/=
6. Conflicts among water users
Formation of water user association and irrigators Organization
Equitable allocation of water
Number of water users’ groups formed
Reduced number of water conflicts
Farmers, DFT/WFT
Field Extension Officers PBWO,TZITSU
July 2012 – June 2014
4,000,000/=
7 Reduced downstream water flows
Adherence to water permits directive
Volume of water abstracted
Farmers, DFT/WFT
Field Extension Officers, PBWO
July 2012 – June 2014
4,000,000/=
8. Population influx resulting into increased cases of HIV
Awareness creation on HIV/AIDS
Number of new HIV/AIDS Cases reported
Farmers, DFT/WFT
Field Extension Officers
July 2012 – June 2014
2,000,000/=
61.A Environmental and Social Monitoring Plan
234

235

No Environmental Component to be Monitored
Method of Monitoring and Sampling Area
Frequency Verifiable indicator Responsibility
1. Increase in incidences of insects and pests
Periodic inspection Weekly Number of inspections
DFT/WFT and Extension Officers, Project Committee
2. Increase of water borne diseases
Follow up in Health Facilities
Monthly Number of cases recorded
DFT/WFT and Extension Officers, Project Committee, Health Officers
3. Occurrence of soil erosion Periodic inspection Annually Number of inspections
DFT/WFT and Extension Officers, Project Committee
4. Increase in cases of Malaria Follow up in Health Facilities
Monthly Number of cases recorded
DFT/WFT and Extension Officers, Project Committee, Health Officers
5. Increase in use of Agrochemicals
Soil analysis, ,Interviews Annually Number of Soil samples analyzed
DFT/WFT and Extension Officers, Project Committee
6. Conflicts among water users Meetings, Visits and interviews
Monthly Number of cases recorded
DFT/WFT, Extension Officers, VEOs, Project Committee, PBWO,TZITSU
7. Reduced downstream water flows
Measurement of flows Annually Volume of water abstracted
DFT/WFT and Extension Officers, Project Committee, PBWO,
236

237