projectclimateinfo.pk/frontend/web/attachments/data-type/indc... · web viewfor brick production...
TRANSCRIPT

Technical support document
INDC Pakistan – Analysis of emissions reductions in energy demand sectors
T. Kober, D. Faber, O. Usmani, N. Harms, L. CameronAmsterdam, 23 July 2015

Background

1. Industry
1.1 Emissions reductionsThe energy-related emissions of the industry sector in the baseline increase from around 40 MtCO2e in 2013 to 60 MtCO2e in 2020 and further to 120 MtCO2e in 2030. Improving the energy efficiency of industrial applications allows to reduce emissions by 6.5 MtCO2e in 2020 and 30 MtCO2e (Figure 1). Given the cement and brick sectors’ importance in the baseline emissions development, both sectors combined contribute with almost 80% to the industry’s total emissions reduction in 2030. In the cement industry, this emission reduction can be realised through the conversion of old energy intensive kilns to best available technology (BAT) standard and the shift from inefficient cement processes (wet and single-stage dry processes) to modern multi-stage dry cement processes. For brick production the conversion from clamp kilns and bull trench kilns to so-called zig-zag kiln technology offers substantial emissions reduction potential (6 MtCO2e by 2030) at low-cost. In addition to the cement and brick industry further 7 MtCO2e can be avoided by 2030 resulting of improved technologies in other industry sectors, such as textile (2.8 MtCO2e), fertilizer production (1.4 MtCO2e) and iron and steel (0.9 MtCO2e).
0
20
40
60
80
100
120
2010 2015 2020 2025 2030
GHG
Emiss
ions
MtC
O2e
Pulp and PaperSugarIron and SteelFertilizerBrickOther IndustriesTextilesCement
Baseline emissions
Sector emissions reductions:
Figure 1: Effects of energy efficiency improvements on Pakistan’s emissions development in the industry sector
Table 1 provides the overview of the emissions reductions across the industry sub-sectors for the year 2030, displaying the contribution of the respective fuel savings. Emission reduction from coal use apply primarily to the cement and brick industry, whereas in the textile, fertilizer and iron & steel industry reduced consumption of natural gas is the main driver for emissions mitigation. Important measures to increase energy efficiency in the latter sectors are enhancements of the thermodynamic systems including reduction of heat losses, improved boiler systems, waste heat recovery and better process integration.
3

Table 1: Emissions reductions resulting from energy efficiency improvements in the industry sector by fuel in 2030 (values in MtCO2e and in brackets as relative shares w.r.t. baseline emissions)
Motor Spirit
Kero- sene
HSD LDO Fur- nace Oil
Lubes & Greases
Natural Gas
Coal Total
Cement 0.0 0.0 0.0 0.0 0.0 0.0 0.0 17.5 17.5
(0%) (0%) (0%) (0%) (0%) (0%) (0%) (47%) (44%)
Textiles 0.0 0.0 0.0 0.0 0.0 0.0 2.8 0.0 2.8
(0%) (0%) (0%) (0%) (0%) (0%) (22%) (0%) (21%)
Other Industries 0.0 0.0 0.1 0.0 0.0 0.0 0.9 0.0 1.0
(3%) (0%) (4%) (0%) (0%) (0%) (4%) (0%) (3%)
Brick 0.0 0.0 0.0 0.0 0.0 0.0 0.0 5.7 5.7
(0%) (0%) (0%) (0%) (0%) (0%) (0%) (34%) (34%)
Fertilizer 0.0 0.0 0.0 0.0 0.0 0.0 1.4 0.0 1.4
(0%) (0%) (0%) (0%) (0%) (0%) (40%) (0%) (40%)
Iron and Steel 0.0 0.0 0.0 0.0 0.0 0.0 0.9 0.0 0.9
(0%) (0%) (0%) (0%) (0%) (0%) (19%) (0%) (17%)
Sugar 0.0 0.0 0.0 0.0 0.0 0.0 0.0 0.0 0.0
(0%) (0%) (0%) (0%) (0%) (0%) (0%) (0%) (0%)
Pulp and Paper 0.0 0.0 0.0 0.0 0.0 0.0 0.6 0.0 0.6
(7%) (0%) (7%) (0%) (0%) (0%) (7%) (0%) (7%)
Total 0.0 0.0 0.1 0.0 0.0 0.0 6.5 23.2 29.8
(3%) (0%) (3%) (0%) (0%) (0%) (13%) (43%) (25%)
In the following sections we highlight the main energy efficiency improvement measures for the industry sub-sectors and their resulting fuel savings. We also present our main assumptions and data sources behind the calculation.
1.2 Cement industryThe cement industry in Pakistan is the largest industrial sector with regards to energy use, accounting in 2012 for 25% of all energy used in the industrial sector and 67% of total industrial coal use. Coal accounts for 92% of energy consumption in the sector while oil and gas cover the remaining energy requirements. Energy improvements in the cement sector as addressed here, mainly refer to options that reduce coal as it is by far the most frequently used fuel as well as the fuel with the highest associated emission intensity.
Based on historic figures, cement production in Pakistan can be clustered into the three main types of kilns used for cement production. With regards to energy consumption, the three different kinds of kilns differ substantially (Table 2). Since in wet kilns raw materials are entered into the kiln with a high water content, a significant amount of fuel is used to evaporate this water. In a single-stage preheating dry kiln, raw materials are pre-heated in order to start the calcinating process at a more energy efficient temperatures. In multi-stage preheating dry kilns, raw material preheating is performed in several stages (where early stages of the pre-heating can use lower temperature heat, and later stages use the higher temperature heat) allowing for even higher energy efficiency.
4

Table 2: Pakistan's cement production capacity per kiln type in 2008 1
Kiln type No of plants Total capacity (Mt/year)
Energy Intensity (GJ/t clinker)2
Wet 5 5.48 5.0 - 6.0Single-stage dry 10 7.34 4.2 - 5.0Multi-stage dry 14 23.81 3.1 - 4.2Total 29 37.09 N/A
To reduce emissions in the cement industry we consider two measures: 1) introducing BAT standard to all cement plants, and 2) converting the energy-inefficient wet and single stage dry kilns to multi stage dry kilns. Both measures together allow to reduce coal consumption and hence emissions of the cement production by 44% compared to the baseline in 2030 (Figure 2). In our assessment we assume that both measures are conducted gradually starting in 2015 and being completed in 2030.
0
50
100
150
200
250
300
350
400
2013 2016 2019 2022 2025 2028
Coal
use
in th
e Pa
kist
ania
n ce
men
t sec
tor
(PJ)
Reduction from baseline by converting different kilntypes to BATFurther reduction through full conversion to BATmulti-stage dry processRemaining energy use
Figure 2: Effects of energy efficiency improvements on coal use in the cement sector
The first measure, the transition to BAT for each of the three plant types, entails improving and retrofitting existing cement plants so that energy efficiency in these plants resembles energy efficiency of today’s best practice cement plants. This translates into specific coal consumptions per tonne of cement of 4.2 GJ for wet kilns, 3.5 GJ for single-stage dry kilns and 2.4 GJ for multi-stage dry kilns in 2030. Specific technology improvements comprise, for instance3:
Installation of wash mills with closed circuit classifier (for wet kilns only) Kiln shell heat loss reduction Process control and management systems Kiln combustion system improvements Improved raw-materials preparation.
The economic assessment of different energy efficiency improvements reveals that a numerous low-cost measures with payback time less than one year exist, such as kiln combustion system improvements, kiln shell heat loss reduction and the introduction of energy management and control systems. These improvements result in fuel savings up
1 Asian Development Bank, 2009, "ADB TA 7060-PAK: Pakistan Sustainable Energy Efficiency Development Program".
2 EU-China Energy and Environment Programme, 2009, “Cement - A reference guide for the industry”
3 E. Worrell, K. Kermeli, C. Galitsky, 2013, “Energy Efficiency Improvement and Cost Saving Opportunities for Cement Making”
5

to about 0.5 GJ per tonne of cement and can partly be conducted during regular maintenance and renovation cycles. More substantial energy efficiency improvements of up to 1.1 GJ per tonne of cement can be achieved if cement plants are equipped with preheater and precalciner technology. However, the payback time for this kind of process modification is with more than 10 years much longer than for the before mentioned small-scale improvements. 4
The second measure, the conversion of the entire cement production to multi stage dry kilns, results in an overall coal-energy intensity of the cement production of 2.4 GJ per tonne of cement in 2030, and would allow to reduce coal consumption by 50 PJ in 2030 in addition to the reductions provided by the first measure. Table 3 displays the energy efficiency improvements for conversion of wet cement kilns to semi wet and dry kilns according to Worrel et al. (2013), which shows that in particular the conversion to the dry cement process with precalciner offers highest potential to reduce coal consumption with a payback period of around 7 years. The table also shows that converting from wet to dry cement kilns would increase electricity consumption of clinker production slightly. We assume that this increase can be at least compensated with electricity savings for improved raw material preparation and grinding where saving measures can achieve up to 25 kWh per tonne of cement.
Table 3: Energy efficiency improvements for conversion clinker production from wet cement kilns to semi wet and dry kiln types (Worrel et al. 2013)
Kiln type Specific Fuel Savings(Mbtu/ton cement)
Specific ElectricitySavings(kWh/ton cement)
Estimated PaybackPeriod(years)
Conversion to Semi Dry‐ Process Kiln
0.93‐1.30 4.7‐ ‐ 6.5‐ >10 (1)
Conversion to Semi Wet‐ Process Kiln
0.60‐0.90 3.7‐ 1 3‐
Conversion to Dry precalciner Kiln
1.70‐2.70 8.4‐ >7 (1)
1.3 Brick industryThe clay-brick manufacturing sector in Pakistan, accounting for roughly 1.5% of GDP5, is a relatively unregulated and undocumented industry sector.6 The typical production process in Pakistan involves the manual moulding of bricks, which are then generally baked in either a clamp kiln (5% share of total brick production) or a bull trench kiln (BTK) (95% share of total brick production). Compared to other kiln types (e.g. vertical shaft brick kilns (VSBK)), both kiln types are known for their low capital investments, and low energy efficiencies. Attempts have been made to introduce more energy efficient kiln types, such as VSBK. These attempts were not successful due to relatively high required capital requirements and the limitation in production flexibility7 and a negative social perception of the VSBK. 8,9
4 E. Worrell, K. Kermeli, C. Galitsky, 2013, “Energy Efficiency Improvement and Cost Saving Opportunities for Cement Making”
5 SDPI, 2009, “Social Analysis of Brick Production Units in Pakistan.”
6 SAARC Energy Centre, 2012, "Evaluating Energy Convervation Potential of Brick Kilns in SAARC Countries"
7 BTKs can produce a variety of brick products, whereas VSBKs can only produce solid and perforated bricks.
8 UNEP, 2012, “Vertical Shaft Brick Kilns Fact Sheet.”
9 SDPI, 2009, “Social Analysis of Brick Production Units in Pakistan.”
6

Our analysis of GHG mitigation options for brick production refers to the shift of existing kilns to modern applications with reduced energy consumption (Figure 3). The first measure involves converting Pakistan’s BTK and clamp kilns to so-called zig-zag kilns (ZZK). The BTK and ZZK share a lot of similarities with regards to kiln layout, and as such converting to ZZKs only requires limited kiln modification10. Due to the limited amount of modification needed for the conversion, capital requirements are relatively low making the ZZK a kiln type well suited for the Pakistani brick industry. As a secondary energy efficiency improvement, efforts can be made to convert these ZZKs to ZZKs with BAT standard, which includes adding a fan to increase drought throughout the kiln and improving isolation in the firing section of the kiln. In order to illustrate additional mitigation potential we three further measures which assume the partial conversion Pakistan’s brick kilns to manual VSBKs (mitigation measure 3) and Vietnamese VSBKs (mitigation measures 4 and 5).
0
20
40
60
80
100
120
140
160
180
200
2013 2016 2019 2022 2025 2028
Coal
use
in t
he P
akist
ania
n br
ick
indu
stry
(PJ)
Conversion to ZZKConversion to BAT ZKKConversion to 80% BAT ZZK - 20% BAT manual VSBKConversion to 80% BAT ZZK - 20% Vietnamese VSBKConversion to 50% BAT ZZK - 50% Vietnamese VSBKRemaining energy use
Figure 3: Effects of energy efficiency improvements on coal use in the brick industry
Figure 3 shows that almost 60 PJ (43%) can be saved in 2030 if BTK are converted into ZZK with BAT. Over the course of the transition towards full implementation of ZKKs this amount to an cumulative energy demand reduction of roughly 347 PJ, assuming the transition starts in 2016 and is completed by 2030. Using the kiln conversion and construction investments required displayed in Table 4 coupled with the assumption that the Pakistan brick industry initially consisted of 10000 kilns in 2012, cost implications for measure 1 and 2 show that total investment costs amount to roughly $ 1.6 billion over a 15 year period. This in turn will lead to an investment cost of roughly 4.6 $/GJ saved over the 2016-2030 period. This investment does not account for money saved through fuel savings, so ultimately the cost of savings might be substantially lower.
Comparing measures 1 and 2 with measures 3 to 5, we observe that energy demand reduction potential is lower when moving from ZZKs to VSBKs compared to demand reduction achieved by moving from BTKs to ZZKs. Nevertheless, reductions of energy demand and emissions are still substantial when introducing VSBK technology. However, capital requirements for both the manual and Vietnamese VSBKs are
10 SHAKTI Sustainable Energy Foundation, 2012, “Towards Cleaner Brick Kilns in India - A Win–win Approach Based on Zigzag Firing Technology.”
7

substantially higher. Since the brick industry is highly unregulated with many small-scale producers, access to capital is a barrier to implementation of VSBK (measures 3 to 5). Consequently, we excluded measures 3 to 5 from the calculation of the emission reduction potentials. For the implementation of zig-zag kilns with best available technology (measures 1 and 2) we calculate reductions of GHG of 0.9 MtCO2e by 2020 and 5.7 MtCO2e by 2030.
Table 4: Brick kiln investment costs 11 12 13
Kiln conversion Cost per kiln (normalized capacityBTK -> ZZK $30.000BTK -> BAT ZZK $50.000Manual VSBK $240.000BAT manual VSBK $400.000Vietnamese VSBK $500.000
1.4 Textile industryAfter the brick and cement sector, the textile industry is the largest industry with regards to energy demand. Energy demand in the textile industry is largely covered by gas (97%) and oil products (3%), where the oil products are generally used as back-up fuel storage to replace gas during shortages. Hence, our assessment of emissions reductions in the textile industry focusses on demand reduction options for natural gas.
0
50
100
150
200
250
2013 2016 2019 2022 2025 2028
Nat
ural
gas
con
sum
ption
(PJ
) Combination of measures to improve energyefficiency
Remaining energy use
Figure 4: Effects of energy efficiency improvements on coal use in the textile industry
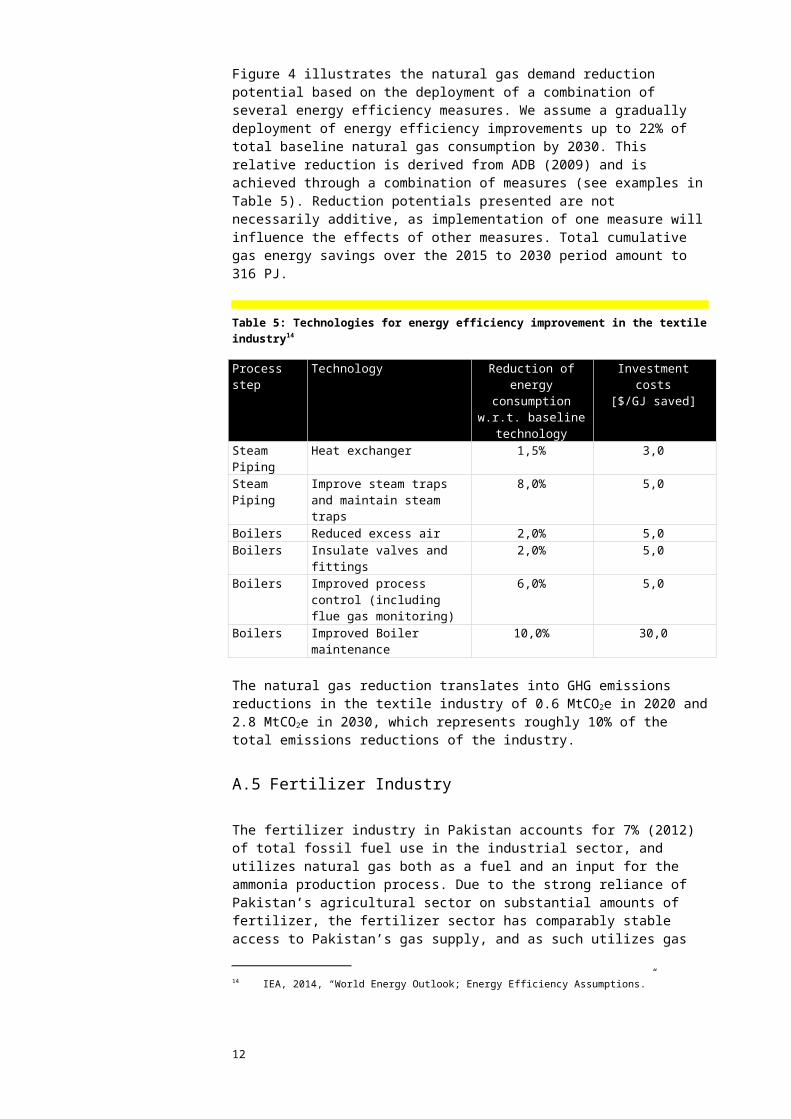
Figure 4 illustrates the natural gas demand reduction potential based on the deployment of a combination of several energy efficiency measures. We assume a gradually deployment of energy efficiency improvements up to 22% of total baseline natural gas consumption by 2030. This relative reduction is derived from ADB (2009) and is achieved through a combination of measures (see examples in Table 5). Reduction potentials presented are not necessarily additive, as implementation of one
11 UNEP, 2012, “Brick Kilns Performance Assessment; A Roadmap for Cleaner Brick Production in India.”
12 SHAKTI Sustainable Energy Foundation, 2012, “Towards Cleaner Brick Kilns in India - A Win–win Approach Based on Zigzag Firing Technology.”
13 Asian Development Bank, 2009, “ADB TA 7060-PAK: Pakistan Sustainable Energy Efficiency Development Program.”
8

measure will influence the effects of other measures. Total cumulative gas energy savings over the 2015 to 2030 period amount to 316 PJ.
Table 5: Technologies for energy efficiency improvement in the textile industry14
Process step Technology Reduction of energy consumption w.r.t. baseline technology
Investment costs[$/GJ saved]
Steam Piping Heat exchanger 1,5% 3,0Steam Piping Improve steam traps and
maintain steam traps8,0% 5,0
Boilers Reduced excess air 2,0% 5,0Boilers Insulate valves and fittings 2,0% 5,0Boilers Improved process control
(including flue gas monitoring)6,0% 5,0
Boilers Improved Boiler maintenance 10,0% 30,0
The natural gas reduction translates into GHG emissions reductions in the textile industry of 0.6 MtCO2e in 2020 and 2.8 MtCO2e in 2030, which represents roughly 10% of the total emissions reductions of the industry.
1.5 Fertilizer Industry
The fertilizer industry in Pakistan accounts for 7% (2012) of total fossil fuel use in the industrial sector, and utilizes natural gas both as a fuel and an input for the ammonia production process. Due to the strong reliance of Pakistan’s agricultural sector on substantial amounts of fertilizer, the fertilizer sector has comparably stable access to Pakistan’s gas supply, and as such utilizes gas as its only fuel for the production process.15 The assessment of gas demand and reduction potential in this section focuses solely on gas used a fuel source.
In our assessment of emissions reductions we consider improvements of the production of ammonia from natural gas based on IEA16. Table 6 lists the specific energy intensities of an average-efficient ammonia process (including steam reforming and Haber-Bosch synthesis), and three levels of efficiency improvements, including the associated average investment costs for each of the production efficiencies. Over all three energy efficiency improvement levels up to 25% fuel could be saved. Cost calculations assuming a plant lifetime of 10 years and Pakistan is at average efficiency in the baseline scenario show an average investment cost per GJ saved in the range of US$ 4-6. These costs would reduce if one takes the savings from declined gas expenditures into consideration. In conclusion we regard the transition towards very high efficiency fertilizer plants seems to be relatively viable pathway to attain at lower fertilizer gas demand.
In Figure 5 several pathways to gas demand reduction in the fertilizer sector are presented, where each pathway represents one of the three levels of improvement to the ammonia production process. We assume the implementation of improvement measures starting in 2015 and to reach full deployment of these levels by 2030. The conversion to medium efficiency would result in a 5% reduction of gas demand in 2030 when compared to the baseline scenario, and a conversion to high efficiency would
14 IEA, 2014, “World Energy Outlook; Energy Efficiency Assumptions.”
15 Asian Development Bank, 2009, “ADB TA 7060-PAK: Pakistan Sustainable Energy Efficiency Development Program.”
16 IEA, 2014, “World Energy Outlook; Energy Efficiency Assumptions.”
9

result in a 10% reduction of total gas demand. Finally, further improvements towards a very high efficiency steam reforming + Haber Bosch would lead to a 25% reduction of gas demand in 2030 compared to the baseline fuel consumption.
Table 6: Natural gas based ammonia production and its efficiency improvements (IEA 2014)
Technology Specific energy consumption
[GJ/t of product]
Investment costs[$/t of product per year]
Average efficiency steam reforming + Haber Bosch
15,38 637
Medium efficiency steam reforming + Haber Bosch
14,61 671
High efficiency steam reforming + Haber Bosch
13,84 708
Very high efficiency steam reforming + Haber Bosch
11,54 849
The energy efficiency improvements of the fertilizer industry result in GHG emissions reductions of 0.4 MtCO2e in 2020 and 1.4 MtCO2e in 2030, representing about 5% of the total industrial emissions reductions. It should be noted that, according to ADB (2009), “energy efficiency upgrades in the fertilizer industry would generally involve significant process upgrades and expansion of production capacities, and it is therefore technically difficult to separate possible savings in energy from benefits associated with capacity enhancement”.
0
10
20
30
40
50
60
70
2013 2016 2019 2022 2025 2028
Natu
ral g
as co
nsum
ption
(PJ)
Conversion to medium efficiency productionConversion to high efficiency productionConversion to very high efficiency productionRemaining energy use
Figure 5: Effects of energy efficiency improvements on gas use in the fertilizer industry
1.6 Iron and steel industry
The iron and steel industry in Pakistan accounts for 5% (2012) of total fossil fuel demand in the industry sector. This demand is mainly met through natural gas (92%), combined with minor usage of oil products (8%).
Looking at the iron and steel industry, a distinction between public and private production of iron & steel can be made, because, conversely to the private sector, the
10

public sector also produces iron and steel in a blast furnaces process. These production process, which is traditionally applied in the state-owned Pakistan Steel Mills (PSM) plant, has a significantly higher energy consumption then processes applied in the private sector, which mainly refer to processing of scrap and re-rolling of existing steel.17 After a short production hiatus due to unsuccessful attempts at privatization of PSM, state-owned production of steel is slowly increasing back towards pre-privatization production levels of roughly 20% (of total Pakistani steel production).18
For the assessment of emission reduction options in the iron and steel sector we distinguish two measures, which are displayed in Figure 6 regarding their impact on the natural gas demand in the iron and steel sector. First, for the private sector the energy efficiency improvements involve reduced consumption by 10% during the re-rolling process which. We assume this 10% improvement to be attained by 2030 for all private steel making plants, which correspond to 32% of total natural gas demand of the iron and steel industry. Consequently, iron and steel gas demand in 2030 can be reduced by 3% through a more energy efficient re-rolling process. Second, enhancing the iron and steel making process of PMS plant to achieve BAT efficiency standard by 2020, which leads to a further reduction of natural gas use by 15%. Between 2015 and 2030 cumulative energy savings of both private and public energy efficiency improvements would equal 123 PJ.
Both measures together allow to reduce GHG emissions in the Pakistani iron and steel industry by 0.4 and 0.9 MtCO2e in 2020 and 2030 respectively.
0
10
20
30
40
50
60
70
80
90
100
2013 2016 2019 2022 2025 2028
Nat
ural
gas
conc
sum
ption
(PJ)
Efficient re-rolling
PSM replacement with BAT
Remaining energy use
Figure 6: Effects of energy efficiency improvements on gas use in the iron and steel sector
1.7 Pulp and paper industry
The paper and pulp industry accounts for 8% (2012) of industrial fossil fuel use in Pakistan, making it the 4th largest industry sector in Pakistan behind the cement, brick, and textile industries. Of total fuel use in the paper and pulp industry sector, 94% can
17 Pakistan State Bank, 2014, "Annual Report 2013-2014 (State of the Economy)"
18 Tahir, P.,2014, Economic and Social Consequences of Privatisation in Pakistan
11
be attributed to natural gas, and the remaining 6% to oil-based fuels which are generally used a back-up fuel.
The energy intensive steps of the paper production process can be structured into the pulping, bleaching, and rolling phases. In the pulping step of the paper production process, wood chips are thermo-mechanically converted into pulp. This step has by far the largest energy intensity, and energy efficiency improvements for this step include increased insulation, improved boiler efficiency, recovery of blow and flash steam, and cogeneration of power and heat. The effect of this combination of energy efficiency improvements are shown in Figure 7.
According to ADB (2009) Improvements in thermal efficiency can reduce the gas demand of the paper and pulp industry by 7%.19 In our analysis we assume a start of deployment of more efficient technologies in 2015 and to reach the 7% share by 2030. This would results in cumulative energy savings of 67 PJ over the 2015 to 2030 period. GHG emissions would reduce accordingly by 0.1 MtCO2e in 2020 and 0.6 MtCO2e in 2030.
0
20
40
60
80
100
120
140
160
2013 2016 2019 2022 2025 2028
Nat
ural
gas
cons
umpti
on (P
J)
Thermal efficiency improvements
Remaining energy use
Figure 7: Effects of energy efficiency improvements on gas use in the paper and pulp sector
1.8 Other industries
The category ‘other industries’ is an aggregate of several industry branches, mainly non-energy intensive industries, not covered by the energy sectors described in the previous sections. This aggregate includes the chemical (excluding fertilizer), food and beverage, and leather industries, as well as other general small- and medium-sized industries.
Approximately 29% (2012) of all industrial fossil fuel use can be allocated to other industries, where it is used as power source for automation, process heating, and captive generation. Since specific energy allocation data is scarce, we assume a conservative estimate of energy efficiency improvements in the other industry in our assessment.
19 Asian Development Bank, 2009, “ADB TA 7060-PAK: Pakistan Sustainable Energy Efficiency Development Program.”
12

Based on relative fuel savings for other industries derived from ADB (2009) we assume a 4% reduction of baseline energy consumption by 2030 due to general thermal energy efficiency improvements (Figure 8). This accumulates to a reduction of the energy consumption of 128 PJ over the period of 2015 to 2030. GHG emissions decline by 0.2 and 1.3 MtCO2e in 2020 and 2030 respectively. It should be noted that a detailed dedicated bottom-up approach for the several industry application aggregated under ‘other industries’ might provide varying GHG mitigation potentials. This requires, however, detailed sub-sectoral data or even on application level in order assess fuel saving potential and hence mitigation options.
0
100
200
300
400
500
600
2013 2016 2019 2022 2025 2028
Foss
il fu
el co
nsum
ption
(PJ)
Thermal efficiency improvements
Remaining energy use
Figure 8: Effects of energy efficiency improvements on fossil fuel use in other industries
2. Residential, commercial,
agriculture
3. Reduction of electricity demandNext to the reductions of fossil fuel emissions and energy demand, as discussed in chapter 1, there exist energy efficiency improvements that result in electricity demand reductions. These energy efficiency improvements have been assessed per industrial sector, and the resulting electricity demand reduction achieved through the combination of sector specific energy efficiency improvements is presented in Figure 9.
With the current set of energy efficiency improvements, industrial electricity demand can be reduced by 7% in 2030. The implementation of energy efficiency improvements will save about 2 TWh in 2020, increasing to more than 5 TWh in 2030. Over the 2015 – 2030 period this will lead to cumulative electricity savings of 46 TWh.
Assumptions made during the assessment of the industrial electricity demand reduction potential differ per sector. For the cement sector, specific energy efficiency improvements used for the three kiln types were based on Worrel (2013). Due to
13

limitations in data, electricity demand reductions resulting from process improvements for brick production were neglected. For fertilizer production, the potential for electricity demand reduction was assessed assuming the ratio for electricity demand reduction was proportionately equal to the energy demand ratio of the baseline and the very high efficiency case. For the remaining sectors (i.e. textile, iron and steel, and other industries), electricity demand reduction potentials were assumed to be in line with the potentials presented in ADB’s ‘Sustainable Energy Efficiency Development Program (2009).
These lower electricity consumption quantities translate into GHG emissions reductions of 1 MtCO2e in 2020 and almost 3 MtCO2e in 2030 when taking Pakistan’s 2012 emission’s intensity of the electricity sector into consideration.
0
10
20
30
40
50
60
70
80
2010 2015 2020 2025 2030
Elec
tric
ity co
nsum
ption
(TW
h) Pulp and paperSugarIron and steelFertilizerBrickOther industries*TextilesCement
Baseline consumption
Sector electricity savings:
* incl. pulp and paper
Figure 9: Savings of electricity resulting from energy efficiency improvements in the industry
14