eprints.uni-kiel.deeprints.uni-kiel.de/12931/1/ecological_archives_e092.docx · web viewmedusae and...
TRANSCRIPT

Ecological Archives E092-144-D1
Cathy H. Lucas, Kylie A. Pitt, Jennifer E. Purcell, Mario Lebrato, and Robert H. Condon. 2011. What's in a jellyfish? Proximate and elemental composition and biometric relationships for use in biogeochemical studies. Ecology 92:1704.
Abstract: Many marine organisms have gelatinous bodies, but the trait is most common in the medusae (phylum Cnidaria), ctenophores (phylum Ctenophora), and the pelagic tunicates (phylum Chordata, class Thaliacea). Although there are taxonomic and trophic differences between the thaliaceans and the other two closely related phyla, the collective term "jellyfish" has been used within the framework of this article. Because of the apparent increase in bloom events, jellyfish are receiving greater attention from the wider marine science community. Questions being posed include: (1) what is the role of jellyfish in pelagic food webs in a changing environment, and (2) what is the role of jellyfish in large-scale biogeochemical processes such as the biological carbon pump? In order to answer such questions, fundamental data on body composition and biomass are required. The purpose of this data set was to compile proximate and elemental body composition and length–mass and mass–mass regressions for jellyfish (i.e., medusae, siphonophores, ctenophores, salps, doliolids, and pyrosomes) to serve as a baseline data set informing studies on biogeochemical cycling, food web dynamics, and ecosystem modeling, and physiology. Using mainly published data from 1932 to 2010, we have assembled three data sets: (1) body composition (wet, dry, and ash-free dry mass, C, N, P as a percentage of wet and dry mass, and C:N), (2) length–mass biometric equations, and (3) mass–mass biometric equations. The data sets represent a total of 102 species from six classes (20 Thaliacea, 2 Cubozoa, 33 Hydrozoa, 26 Scyphozoa, 17 Tentaculata, 4 Nuda) in three phyla. Where it exists, we have included supplementary data on location, salinity, whole animal or tissue type, measured size range, and where appropriate, the regression type with values of sample size, correlation coefficients (r, r2), and level of significance for the relationship. In addition to the raw unpublished data, we have provided summary tables of mean (± SD) body composition for the main taxonomic groups.
Key words: biometric relationships; carbon; ctenophores; dry mass; Medusae; nitrogen; organic mass; proximate composition; salps.
INTRODUCTION
Several marine taxa have a gelatinous body, in particular the medusae and siphonophores (phylum Cnidaria), ctenophores (phylum Ctenophora) and the pelagic tunicates - salps, doliolids and pyrosomes (phylum Chordata, sub-phylum Thaliacea). While it is known that the thaliaceans are rather different from the cnidarians and ctenophores which are closely-related in taxonomic and trophic terms, there is scope for them to be included in the collective terms ‘jellies’, ‘jellyfish’ or ‘gelatinous zooplankton’, due to their watery bodies, low carbon content, ability to reproduce rapidly and form extensive bloom populations, and potential impact on marine plankton communities and biogeochemical cycling. Within the framework of this article the collective term ‘jellyfish’ will be used.
Jellyfish are found throughout the world’s oceans, from the surface to great depths, and from estuaries to the open ocean. In the short term, numbers can increase rapidly in a matter of weeks or months under conditions that favour rapid growth and reproduction (Lucas 2001, Madin et al. 2006). Over longer time-scales outbreaks can become more frequent or persistent in response to large-scale variability in climate (e.g., North Atlantic Oscillation, El Niño) (Kogovšek et al. 2010, Licandro et al. 2010) and oceanic (Lynam et al. 2010) influences; or they can in fact decline (Dawson et al. 2001, Brodeur et al. 2008). Locally, these naturally occurring episodic bloom events can be exacerbated by anthropogenic impacts such as overfishing, translocations, eutrophication, alterations to coastal geomorphology and climate warming (Mills 2001, Lynam et al. 2006, Purcell et al. 2007, Richardson et al. 2009, Dong et al. 2010, Reusch et al. 2010).
Medusae and ctenophores are voracious predators, consuming a wide range of zooplankton prey, and in some ecosystems acting as important ‘keystone’ species (Pauly et al. 2009). Many species consume fish eggs and larvae and/or are competitors with fish larvae for the same food resources. Thus, in some regions of the world’s oceans, jellyfish and fish stocks have been inextricably linked, for example, the Benguela (Lynam et al. 2006), southeast Asia (Uye 2008, Dong et al. 2010), and Bering Sea (Brodeur et al. 2008). Pelagic tunicates (e.g., salps) are efficient filter-feeders, removing small particles such as bacteria and phytoplankton (Madin et al. 2006). At times they can contribute significantly to the cycling of organic matter in the oceans, packaging and exporting primary organic carbon principally out of the euphotic zone via the production of large and rapidly sinking faecal pellets (Wiebe et al. 1979, Madin and Diebel 1998, Phillips et al. 2009). Thus, it is believed that jellyfish populations play an important role in ecosystem diversity and function and in biogeochemical cycling. Bloom populations could potentially alter trophic pathways in the following ways. Firstly, increased conversion of primary and secondary production into gelatinous biomass (Condon and Steinberg 2008, Pitt et al. 2009) may limit carbon bioavailability to higher trophic levels, including fish, and promote a microbially-dominated food web through release of labile organic matter (Condon et al., in press). Increased carbon export and transfer efficiency of the biological carbon pump through sinking of carcasses and faecal pellet production (Billett et al. 2006, Madin et al. 2006, Lebrato and Jones 2009, Pitt et al. 2009) would supply the benthos with an increased food supply. This is particularly important in the deep-sea, which by definition is a food-limited environment (Gage and Tyler 1991). However, large accumulations of dead jellyfish (e.g., Billett et al. 2006) could potentially cause hypoxic events and alter the oxygen exchange flux with sediments as a result of the high oxygen demand for the mineralization of carbon during decomposition (West et al. 2009, Sexton et al. 2010). Finally, blooms can cause trophic cascades in estuarine and coastal systems (Purcell and Decker 2005, Pitt et al. 2007), altering ecosystem services in unknown ways.
Apparent increases in jellyfish bloom events in several regions of the world (e.g., the Giant jellyfish Nemopilema nomurai in the Sea of Japan (Uye 2008), the ctenophore Mnemiopsis leidyi in the Black Sea (Kovalev and Piontkovski 1998), Chrysaora hysoscella and Aequorea forskalea in the Benguela upwelling (Lynam et al. 2006) and the Mauve stinger Pelagia noctiluca in the Mediterranean (Licandro et al. 2010)), has resulted in jellyfish receiving increased attention from the wider marine science community, including biogeochemists, fisheries scientists and ecosystem modelers (Daskalov et al. 2007, Pauly et al. 2009). Ecosystems experiencing shifting baselines or alternative stable states may result in jellyfish having greater influence on ecosystem function. Thus, the need to understand and quantify the role of jellyfish in pelagic and benthic food webs and in biogeochemical cycling in these changing environments gains prominence.

[Editor's note: "weight" has been changed to "mass" throughout per our style regarding SI units, but the abbreviations using "w" for "weight", as in "DW" have not been changed so as to match the data files.]
In order to answer such questions we require data on the spatial and temporal extent of populations, knowledge of trophic ecology and metabolic processes, as well as fundamental data on body composition size to mass conversions. Two commonly applied measures of biomass and production are dry mass (DW) and ash-free dry mass (AFDW), as both these mass types are relatively simple to determine. However, neither DW nor AFDW truly reflect jellyfish biomass when compared with non-gelatinous groups. In the latter group, carbon (C) accounts for 30–60% of DW (Harris et al. 2000), whereas in jellyfish it is typically <15% (Larson 1986). As part of a multinational project studying the magnitude, causes, and consequences of jellyfish blooms globally, data of body composition and biometric equations have been assembled for salps, pyrosomes, doliolids, medusae (including siphonophores), and ctenophores. Data have been compiled primarily from the peer-reviewed literature, spanning the period 1932 to the end of 2010, and covering a wide range of marine ecosystems (e.g., estuaries, coastal seas, oceanic) from the poles to the subtropics. In addition, summary tables have also been compiled using the data set. Where available, data on the salinity of the sample location have been included. It is well established that values of DW and AFDW are affected by ‘water of hydration’, i.e., bound water that is not removed during the drying process at 50–70°C, but which is driven off during the ashing process at 500–600°C, and which is influenced by the ambient salinity and body size (Larson 1986, Hirst and Lucas 1998). Detailed analyses of the effects of salinity and body size on body composition in the ubiquitous scyphozoan Aurelia are given in Hirst and Lucas (1998).
The data sets provide easy access to the most comprehensive compilation of published data of proximate and elemental body composition, and size–mass and mass–mass regression equations in jellyfish. It will serve as a baseline data set for use in a wide range of subject areas, including biogeochemical cycling, food web dynamics, population ecology, ecosystem modeling, as well as rate measurements of feeding, metabolism, and growth.
METADATA
CLASS I. DATA SET DESCRIPTORS
A. Data set identity: What’s in a jellyfish? Proximate and elemental composition and biometric relationships for use in biogeochemical studies.
B. Data set identification code: Jellyfish_body_composition_and_biometry
C. Data set description
Principal Investigator: Cathy Lucas, National Oceanography Centre Southampton, University of Southampton Waterfront Campus, European Way, Southampton, SO14 3ZH, UK.
Abstract: see above.

D. Key words: see above.
CLASS II. RESEARCH ORIGIN DESCRIPTORS
A. Overall project description
Identity: Global expansion of jellyfish blooms: magnitude, causes and consequences.
Originators: Robert H. Condon, Dauphin Island Sea Lab, Dauphin Island, AL, 36528 USA
Carlos M. Duarte, Department of Global Change Research, IMEDEA (UIB-CSIC), Instituto Mediterráneo de Estudios Avanzados, Esporles, 07190, Spain.
William M Graham, Dauphin Island Sea Lab, Dauphin Island, AL, 36528 USA
Period of Study: 2009– due to end late 2011
Objectives:To provide a global synthesis of reports of jellyfish abundance to achieve four main objectives: (1) to examine the hypothesis of a global expansion of jellyfish blooms, and to explore the possible drivers for this expansion; (2) to examine the effects of jellyfish blooms on the ecosystem, addressing in particular, carbon cycling, and food webs; (3) to identify current and future consequences of jellyfish blooms for tourism, industry, and fisheries, including ecosystem-based management on regional and global scales; and (4) to inform the public at large of the project results. The centerpiece of this project is a scientifically-coordinated global jellyfish and environmental database (JEDI, JEllyfish Database Initiative) based on published and unpublished data sets from coastal, estuarine, and open-ocean regions.
Abstract: Jellyfish are an important and often conspicuous component of oceanic food webs. During the past several decades, dramatic spatial increases and temporal shifts in jellyfish distributions have been reported around the world. Undoubtedly there are associated ecological ramifications such as food web and biogeochemical pathway alterations. Moreover, socio-economic impacts include damage to fisheries, industry and tourism. However, reports have remained local in scope, and scientists agree that a composite understanding of the extent of the problem is still lacking. The bottle-neck is the lack of synthetic analyses across marine ecosystems, due to the present fragmentation of data sources. In 2009, a research project entitled “Global expansion of jellyfish blooms: magnitude, causes, and consequences” started with the aim of providing a global synthesis of jellyfish abundance to achieve the objectives outlined above.
Sources of funding: National Center for Ecological Analysis and Synthesis (NCEAS), a Center supported by NSF (Grant #DEB-94-21535), the University of California at Santa Barbara, and the State of California. Data sourced and provided by M. Lebrato were carried out while working on an IFM-funded project under the ‘Future Oceans Cluster’.
B. Specific subproject description
Study Region: Data of body composition and biometric relationships were obtained for a wide range of marine ecosystems, including estuaries, coastal lagoons and fjords, hyposaline seas, coastal and shelf seas, open oceans and the mesopelagic. In terms of climate, data were obtained from polar (e.g., sub-Arctic Pacific, Antarctic Peninsula, Southern Ocean), temperate

(e.g., coastal and shelf Europe, North America, Australia) and some subtropic (e.g., Caribbean, Australia, SE Asia) regions. Although this is a global database, entries are most comprehensive for Europe, North America, the North Atlantic, and the Antarctic, reflecting where most of the research has been conducted over the last ~70 years.
Experimental or sampling design: Most data have been compiled, as published, from the primary articles in the peer-review literature. In a few cases where the primary article could not be accessed, we have cited the primary and secondary source. Shin-Ichi Uye, Kylie Pitt and Cathy Lucas have provided unpublished data (unpublished data) or data from a PhD thesis.
Research Methods:
Collation of data sets:
Data on body composition and biometric relationships were collected by the authors, primarily from the peer-reviewed literature. Where possible we have used the primary literature source so that as much detail and ancillary information can be gathered. In some instances the primary source could not be accessed, so we have cited both the primary and secondary source. The data collated and stored in the ESA Ecological Archives (http://esapubs.org/archive) are as published (i.e., we have not carried out any data transformations). A total of 29 terms have been collated. Detailed information on the analytical methods used to determine size and mass can be found in the original publications, but brief summaries of the most common methods are included in the list of definitions of each term and how they were collected as set out below.
Phylum: The taxonomic phylum to which the animal belongs.
Class: The taxonomic class to which the animal belongs.
Order: The taxonomic order to which the animal belongs.
Genus: The taxonomic genus to which the animal belongs as published in the source reference.
Species: The taxonomic species that identifies the animal as published in the source reference.
Location: The location where the species was collected according to the source reference. This varies in resolution and detail from, for example, ‘Australia’ or ‘Southern Ocean’ to named bays and estuaries such as ‘Southampton Water’ or ‘Kiel Bight’.
Salinity: The salinity of the water from which the species was collected, as published in the source reference. The majority of salinity measurements are made using a CTD (Conductivity, Temperature, Density) sensor, YSI multi-parameter probe, or refractometer. Although salinity is known to affect dry mass and ash free dry mass values due to the effects of bound ‘water of hydration’ (Larson 1986, Hirst and Lucas 1998), we have not attempted to approximate salinity from other literature sources for those records where salinity has not been included in the primary source material.
Life stage: Where it has been stated, the life stage of the sampled animals has been included. Thaliaceans are classified as either solitary or aggregate, oozoids or blastozooids. The life stages of hydrozoans and scyphozoans are rarely described other than as, rather arbitrarily, medusae, immature, ephyrae, juveniles, adults, adults with gonads, and eudoxies (immature or mature males or females) in siphonophores. Similarly ctenophores may be described as larvae, young or mature. In all groups, nd (no data) indicates where no life stage has been recorded.
Tissue type: The great majority of body composition and biometric data are for whole animals. In the cnidarians (principally the scyphozoans) there are some data for separate tissues – umbrella, gonad, oral arm, or tentacle.
Size: (Body composition) The size of individuals used in the analyses of body composition, if available. Sizes are published as either the minimum to maximum range, range (and average), mean ± standard deviation, and less than (<) or more than (>) a numeric value. Most sizes are expressed as linear measures, but some entries have reported mass or biovolume.
Size range: (Biometric equations) The size range of individuals used in the analysis of size–mass and mass–mass regressions. Most sizes are expressed as linear measures, but some entries have reported mass or biovolume.
Units: Standard SI units used to measure size (as length, height, mass, volume, age), as published in the source material. Size definitions are as follows: Thaliaceans – mm3 or mL biovolume, length defined as either oral-aboral (O-A) length or just length, individual wet mass or dry mass; Cnidarians – bell diameter (BD), coronal diameter (CD) for coronate scyphozoans, diameter, disc diameter, interradalia diameter, arm tips, bell height, individual wet mass or dry mass, age in days; Ctenophores – length, oral-apical (O-A) length, gut length, individual wet mass or dry mass.
DW (%WW): Dry mass as a percentage of wet mass. Samples are typically rinsed with distilled water to remove excess salt and gently blotted to remove excess water prior to wet weighing. Dry mass is measured following oven drying at between 50 and 70°C for between 1 and 7 days or until a constant mass is achieved. The overall temperature range used is 50–110°C and the duration of drying range is 5 hours to 3 weeks. Some data are derived from samples that have been freeze-dried.
AFDW (%DW): Ash free dry mass as a percentage of dry mass. Following oven drying, samples are incinerated at 400–600°C for between 2 and 24 hours or until a constant mass is achieved.
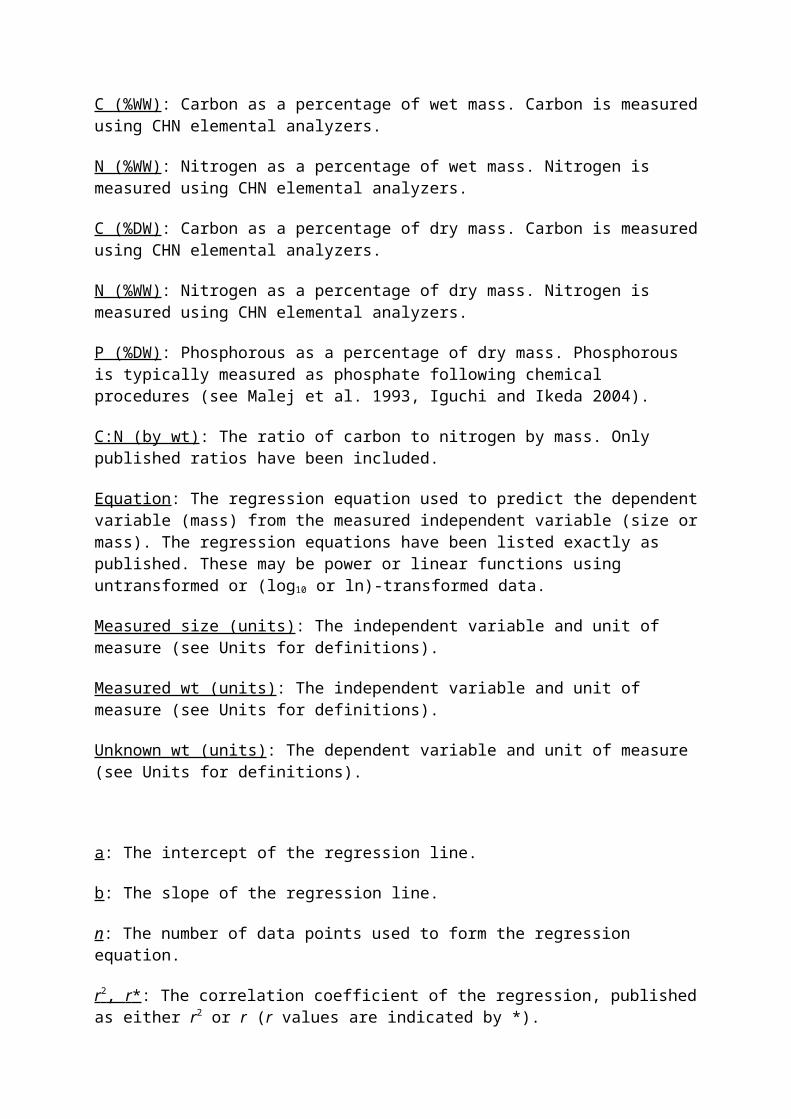
C (%WW): Carbon as a percentage of wet mass. Carbon is measured using CHN elemental analyzers.
N (%WW): Nitrogen as a percentage of wet mass. Nitrogen is measured using CHN elemental analyzers.
C (%DW): Carbon as a percentage of dry mass. Carbon is measured using CHN elemental analyzers.
N (%WW): Nitrogen as a percentage of dry mass. Nitrogen is measured using CHN elemental analyzers.

P (%DW): Phosphorous as a percentage of dry mass. Phosphorous is typically measured as phosphate following chemical procedures (see Malej et al. 1993, Iguchi and Ikeda 2004).
C:N (by wt): The ratio of carbon to nitrogen by mass. Only published ratios have been included.
Equation: The regression equation used to predict the dependent variable (mass) from the measured independent variable (size or mass). The regression equations have been listed exactly as published. These may be power or linear functions using untransformed or (log10 or ln)-transformed data.
Measured size (units): The independent variable and unit of measure (see Units for definitions).
Measured wt (units): The independent variable and unit of measure (see Units for definitions).
Unknown wt (units): The dependent variable and unit of measure (see Units for definitions).
a: The intercept of the regression line.
b: The slope of the regression line.
n: The number of data points used to form the regression equation.
r 2 , r * : The correlation coefficient of the regression, published as either r2 or r (r values are indicated by *).
P: The level of significance of the correlation coefficient.
Source: The source where the entry was obtained. These are either primary sources, or secondary sources as indicated by the phrase ‘cited in’, e.g., Madin and Harbison (1978) Bulletin of Marine Science 28:335–344. (cited in Madin et al. (1981) Marine Biology 63:217–226). unpubl. data = unpublished data.
Summary (descriptive) statistics:
Using the data collated for this study, summary statistics have been carried out using MS Excel to produce Phylum-, Class-, and Order-specific averages for proximate and elemental body composition (Tables 1 and 2).
TABLE 1. Summary of the proximate body composition of whole jellyfish of the Thaliacea, Ctenophora, and Cnidaria. Values are mean (± SD, sample number), calculated using published averages in each study. WW = wet mass, DW = dry mass, AFDW = ash free dry mass. nd = no data in the literature.
Classification Level Taxon DW %WW AFDW %DW
CLASS THALIACEA 5.50 (2.47, 12) 33.35 (10.33, 14 )
Order
Order
Order
Doliolida
Pyrosoma
Salpidae
nd
7.18 (3.59, 3)
4.94 (1.93, 9)
nd
45.90 (21.07, 2)
31.26 (7.23, 12)
PHYLUM
Order
Order
Order
Order
CTENOPHORA
Beroida
Cestida
Cydippida
Lobata
3.53 (0.92, 27)
3.28 (0.95, 8)
nd
4.01 (0.78, 9)
3.43 (1.01, 10)
26.85 (6.45, 15)
29.71 (0.58, 3)
20.20 (0, 1)
32.14 (3.90, 5)
20.59 (2.62, 6)
PHYLUM
CLASS
Order
Order
CLASS
Order
Order
Order
CNIDARIA
HYDROZOA
Hydroida
Siphonophora
SCYPHOZOA
Coronatae
Rhizostomeae
Semaeostomeae
4.07 (1.23, 71)
3.93 (0.98, 30)
3.90 (1.01, 28)
4.43 (0.18, 2)
4.17 (1.39, 41)
4.48 (0.87, 5)
4.90 (0.75, 10)
3.84 (1.56, 26)
34.24 (10.92, 50)
36.47 (12.89, 22)
36.31 (13.19, 21)
39.96 (0, 1)
32.46 (8.92, 28)
31.57 (2.20, 2)
34.76 (16.21, 5)
32.02 (7.33, 21)
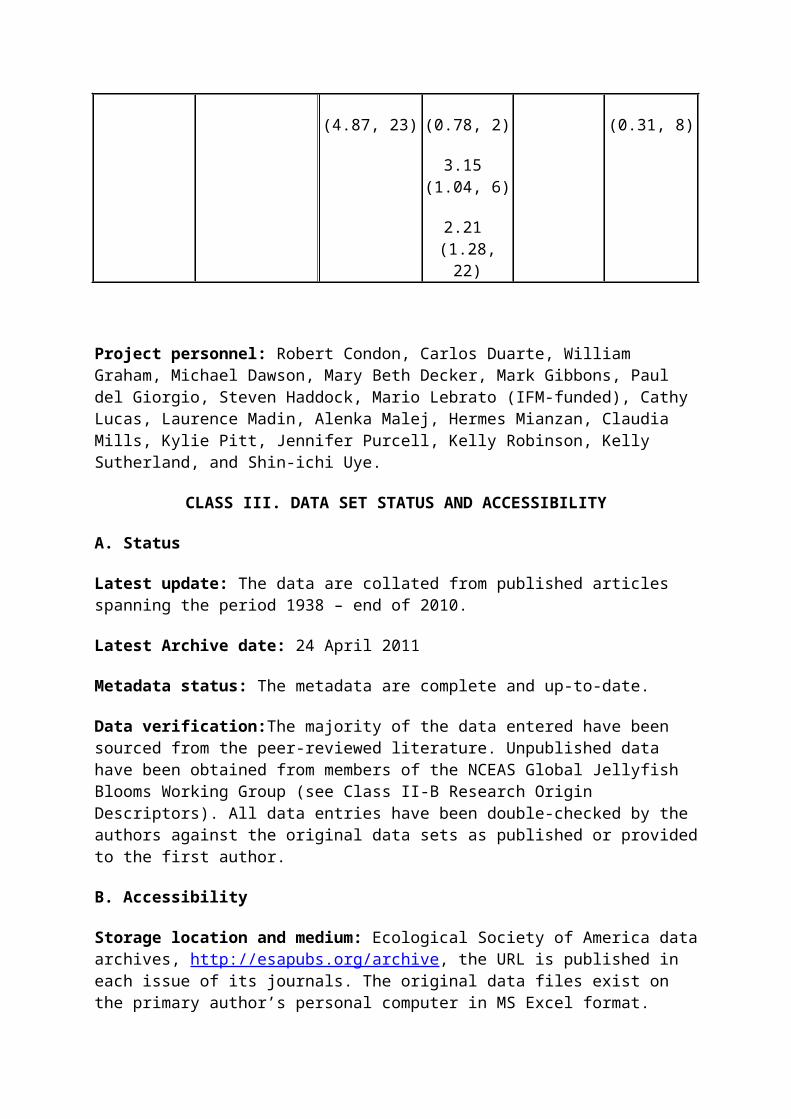
TABLE 2. Summary of the elemental body composition of whole jellyfish of the Thaliacea, Ctenophora, and Cnidaria. Values are mean (± SD, sample number), calculated using published averages in each study. DW = dry mass, C = carbon, N = nitrogen, P = phosphorous, C:N ratio by mass as published only (i.e., not derived from separate C and N values). nd = no data in the literature.
Classification Level
Taxon C %DW N %DW P %DW C:N
CLASS
Order
Order
Order
THALIACEA
Doliolida
Pyrosoma
Salpidae
10.58 (9.26, 26)
0.67 (0, 1)
23.71 (15.54, 4)
8.55 (5.22, 21)
1.70 (1.17, 24)
0.15 (0, 1)
2.20 (1.63, 3)
1.70 (1.17,
0.16 (0.05, 6)
nd
nd
0.16 (0.05, 6)
4.62 (1.05, 39)
4.5 (0, 1)
4.0 (0, 1)
4.64 (1.08, 37)
20)PHYLUM
Order
Order
Order
Order
CTENOPHORA
Beroida
Cestida
Cydippida
Lobata
4.73 (3.78, 41)
6.90 (1.91, 8)
3.0 (0, 1)
6.15 (5.24, 10)
3.37 (3.13, 22)
0.96 (0.70, 29)
1.56 (0.53, 7)
0.70 (0, 1)
1.33 (0.69, 8)
0.43 (0.32, 13)
0.13 (0.07, 5)
0.13 (0.05, 2)
nd
0.23 (0, 1)
0.08 (0.06, 2)
4.29 (0.46, 12)
3.9 (0, 1)
4.4 (0, 1)
4.77 (0.36, 3)
4.13 (0.42, 7)
PHYLUM
CLASS
Order
Order
CLASS
Order
Order
Order
CNIDARIA
HYDROZOA
Hydroida
Siphonophora
SCYPHOZOA
Coronatae
Rhizostomeae
Semaeostomeae
11.73 (7.42, 74)
13.10 (8.56, 41)
13.93 (9.92, 28)
11.38 (4.96, 13)
10.03 (5.33, 33)
15.66 (3.90, 3)
13.39 (4.91, 7)
8.32 (4.87, 23)
3.36 (3.49, 71)
3.95 (4.38, 41)
4.64 (5.07, 28)
2.47 (1.60, 13)
2.48 (1.27, 30)
3.45 (0.78, 2)
3.15 (1.04, 6)
2.21 (1.28, 22)
0.39 (0.60, 10)
1.0 (1.38, 2)
1.0 (1.38, 2)
nd
0.22 (0.06, 8)
nd
nd
0.22 (0.06, 8)
4.53 (1.44, 22)
4.97 (1.65, 14)
3.76 (0.39, 5)
5.65 (1.71, 9)
3.75 (0.31, 8)
nd
nd
3.75 (0.31, 8)
Project personnel: Robert Condon, Carlos Duarte, William Graham, Michael Dawson, Mary Beth Decker, Mark Gibbons, Paul del Giorgio, Steven Haddock, Mario Lebrato (IFM-funded), Cathy Lucas, Laurence Madin, Alenka Malej, Hermes Mianzan, Claudia Mills, Kylie Pitt, Jennifer Purcell, Kelly Robinson, Kelly Sutherland, and Shin-ichi Uye.
CLASS III. DATA SET STATUS AND ACCESSIBILITY
A. Status
Latest update: The data are collated from published articles spanning the period 1938 – end of 2010.
Latest Archive date: 24 April 2011
Metadata status: The metadata are complete and up-to-date.
Data verification:The majority of the data entered have been sourced from the peer-reviewed literature. Unpublished data have been obtained from members of the NCEAS Global Jellyfish Blooms Working Group (see Class II-B Research Origin Descriptors). All data entries have been double-checked by the authors against the original data sets as published or provided to the first author.
B. Accessibility
Storage location and medium: Ecological Society of America data archives, http://esapubs.org/archive, the URL is published in each issue of its journals. The original data files exist on the primary author’s personal computer in MS Excel format.
Contact person:Cathy Lucas, National Oceanography Centre Southampton, University of Southampton Waterfront Campus, European Way, Southampton, SO14 3ZH, UK. E-mail: [email protected], tel: +44 (0)23 8059 6617.
Copyright restrictions: None.
Proprietary restrictions: None.
Costs: None.
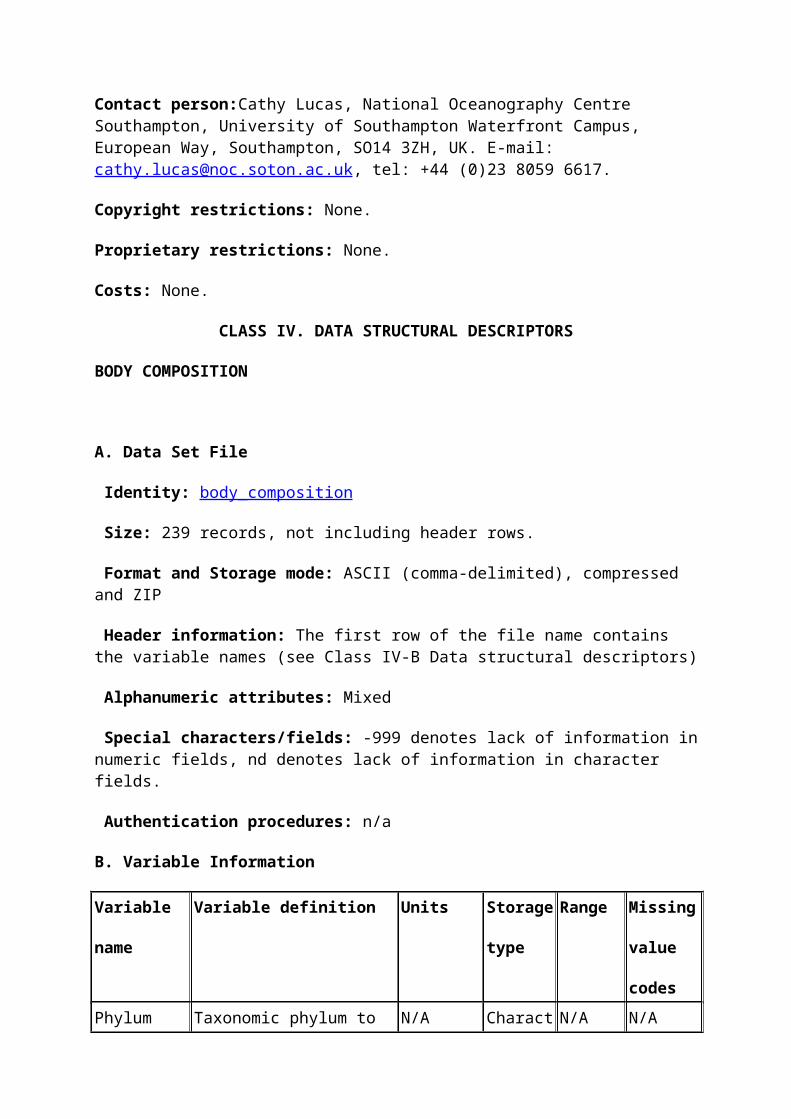
CLASS IV. DATA STRUCTURAL DESCRIPTORS
BODY COMPOSITION
A. Data Set File
Identity: body_composition
Size: 239 records, not including header rows.
Format and Storage mode: ASCII (comma-delimited), compressed and ZIP
Header information: The first row of the file name contains the variable names (see Class IV-B Data structural descriptors)
Alphanumeric attributes: Mixed
Special characters/fields: -999 denotes lack of information in numeric fields, nd denotes lack of information in character fields.

Authentication procedures: n/a
B. Variable Information
Variable
name
Variable definition Units Storage
type
Range Missing
value
codes
Phylum Taxonomic phylum to which the species belongs.
N/A Character N/A N/A
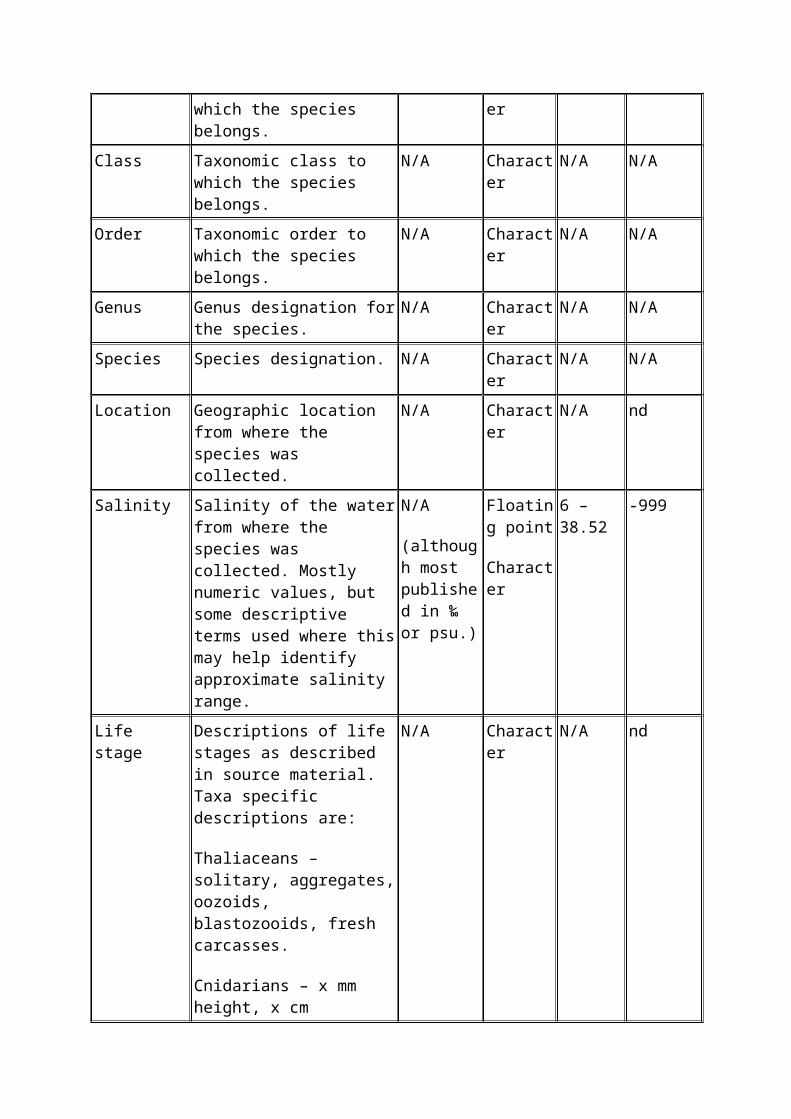
Class Taxonomic class to which the species belongs.
N/A Character N/A N/A
Order Taxonomic order to which the species belongs.
N/A Character N/A N/A
Genus Genus designation for the species.
N/A Character N/A N/A
Species Species designation. N/A Character N/A N/A
Location Geographic location from where the species was collected.
N/A Character N/A nd
Salinity Salinity of the water from where the species was collected. Mostly numeric values, but some descriptive terms used where this may help identify approximate salinity range.
N/A
(although most published in ‰ or psu.)
Floating point
Character
6 – 38.52 -999
Life stage Descriptions of life stages as described in source material. Taxa specific descriptions are:
Thaliaceans – solitary, aggregates, oozoids, blastozooids, fresh carcasses.
Cnidarians – x mm height, x cm diameter, immature, ephyrae, juveniles, medusae, mature + gonads, eudoxies.
Ctenophores – larvae, young, adults, mature.
N/A Character N/A nd
Tissue type Type of tissues used in analysis.
Whole – whole animal or
N/A Character N/A nd

mixed tissue if subsample used.
In scyphozoans, there are also separate analyses of tissues from the gonad, umbrella, tentacle, oral arm.
In siphonophores, there are also separate analyses of tissues from the swim bell, and cormidia + stem.
Size Size of individuals used in the analyses of body composition. Published as either the minimum to maximum size range, range (and average), mean ± standard deviation, and less than (<) or more than (>) a numeric value. Mostly linear measures, but some entries mass or biovolume.
N/A Floating point
0.0021 – 8488 (note variable units)
-999
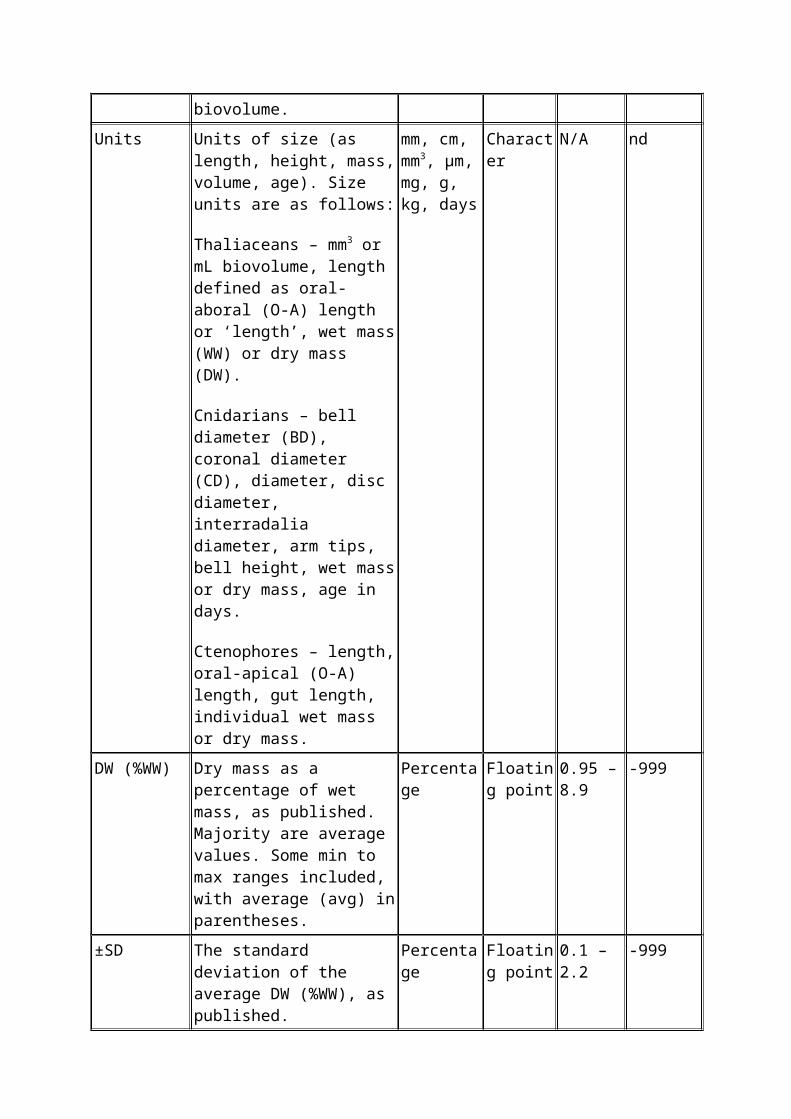
Units Units of size (as length, height, mass, volume, age). Size units are as follows:
Thaliaceans – mm3 or mL biovolume, length defined as oral-aboral (O-A) length or ‘length’, wet mass (WW) or dry mass (DW).
Cnidarians – bell diameter (BD), coronal diameter (CD), diameter, disc diameter, interradalia diameter, arm tips, bell height, wet mass or dry mass, age in days.
Ctenophores – length, oral-apical (O-A) length, gut length, individual wet mass or dry mass.
mm, cm, mm3, µm, mg, g, kg, days
Character N/A nd
DW (%WW) Dry mass as a percentage of wet mass, as published. Majority are average values. Some min to max ranges included, with average (avg) in
Percentage Floating point
0.95 – 8.9
-999

parentheses.
±SD The standard deviation of the average DW (%WW), as published.
Percentage Floating point
0.1 – 2.2 -999
AFDW (%DW)
Ash free dry mass as a percentage of dry mass, as published. Majority are average values. Some min to max ranges included, with average (avg) in parentheses.
Percentage Floating point
10.9 – 92.0
-999
±SD The standard deviation of the average AFDW (%DW), as published.
Percentage Floating point
0.1 – 18.97
-999
C (%WW) Carbon as a percentage of wet mass, as published.
Percentage Floating point
0.02 – 5.6
-999
±SD The standard deviation of the average C (%WW), as published.
Percentage Floating point
0.005 – 1.1
-999
N (%WW) Nitrogen as a percentage of wet mass, as published.
Percentage Floating point
0.004 – 0.53
-999
±SD The standard deviation of the average N (%WW), as published.
Percentage Floating point
0.002 – 0.05
-999
C (%DW) Carbon as a percentage of dry mass, as published. Majority are average values. Some min to max ranges included.
Percentage Floating point
0.67 – 43.0
-999
±SD The standard deviation of the average C (%DW), as published.
Percentage Floating point
0.0 – 5.94
-999
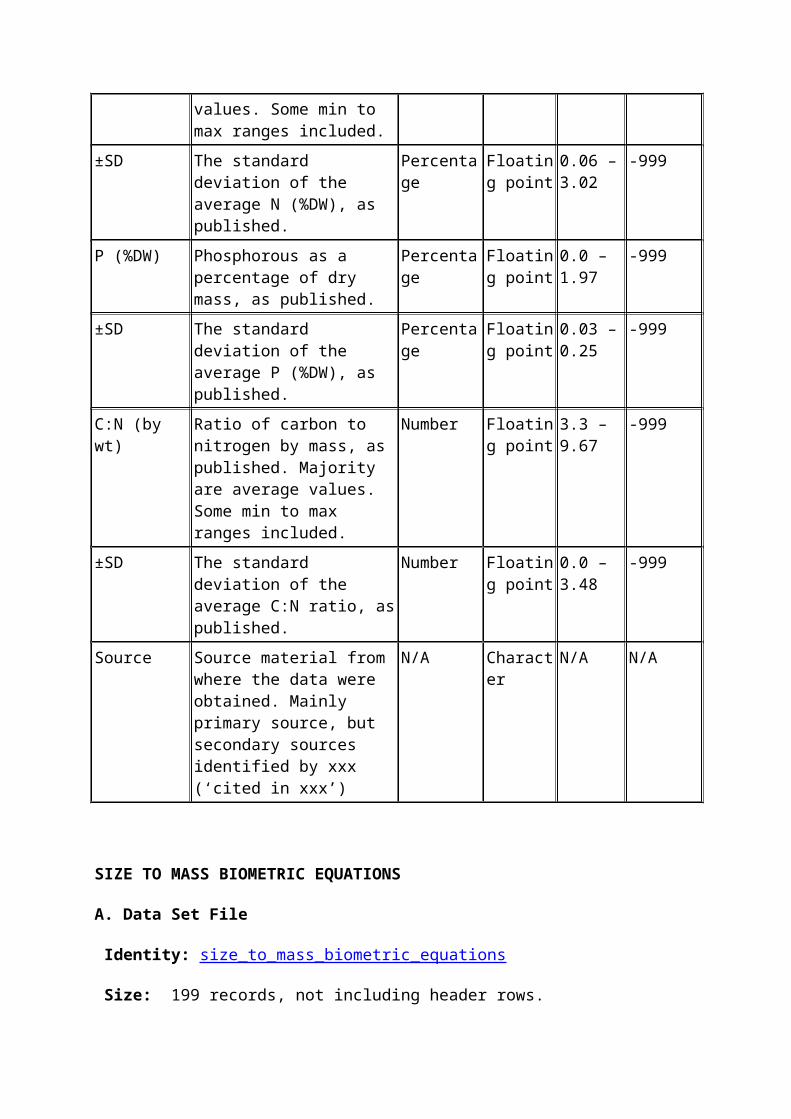
N (%DW) Nitrogen as a percentage of dry mass, as published. Majority are average values. Some min to max ranges included.
Percentage Floating point
0.15 – 24.73
-999
±SD The standard deviation of the average N (%DW), as published.
Percentage Floating point
0.06 – 3.02
-999
P (%DW) Phosphorous as a percentage of dry mass, as published.
Percentage Floating point
0.0 – 1.97
-999
±SD The standard deviation of the average P (%DW), as published.
Percentage Floating point
0.03 – 0.25
-999
C:N (by wt) Ratio of carbon to nitrogen by mass, as published. Majority are average values. Some min
Number Floating point
3.3 – 9.67
-999
to max ranges included.
±SD The standard deviation of the average C:N ratio, as published.
Number Floating point
0.0 – 3.48
-999
Source Source material from where the data were obtained. Mainly primary source, but secondary sources identified by xxx (‘cited in xxx’)
N/A Character N/A N/A
SIZE TO MASS BIOMETRIC EQUATIONS
A. Data Set File
Identity: size_to_mass_biometric_equations
Size: 199 records, not including header rows.
Format and Storage mode: ASCII (comma-delimited), compressed and ZIP
Header information: The first row of the file name contains the variable names (see Class IV-B Data structural descriptors)
Alphanumeric attributes: Mixed
Special characters/fields: -999 denotes lack of information in numeric fields, nd denotes lack of information in character fields.
Authentication procedures: n/a
B. Variable Information
Variablename
Variable definition Units Storagetype
Range Missingvalue codes
Phylum Taxonomic phylum to which the species belongs.
N/A Character N/A N/A
Class Taxonomic class to which the species belongs.
N/A Character N/A N/A
Order Taxonomic order to which the species belongs.
N/A Character N/A N/A
Genus Genus designation for the species.
N/A Character N/A N/A
Species Species designation. N/A Character N/A N/A
Location Geographic location from where the species was collected.
N/A Character N/A nd
Salinity Salinity of the water from where the species was collected. Mostly numeric values, but some descriptive terms used where this may help identify approximate salinity range.
N/A
(although most published in ‰ or psu.)
Floating point
Character
6 – 37 -999
Life stage Descriptions of life stages as described in source material. Taxa specific descriptions are:
Thaliaceans – solitary, aggregates, gonozoids.
Cnidarians – immature, ephyrae, juveniles, medusae, mature + gonads, eudoxies.
Ctenophores – larvae, adults.
N/A Character N/A nd
Tissue type Type of tissues used in analysis.
Whole – whole animal or mixed tissue if subsample used. Part umbrella has been indicated. Assume that unpreserved tissue used unless indicated otherwise.
N/A Character N/A nd
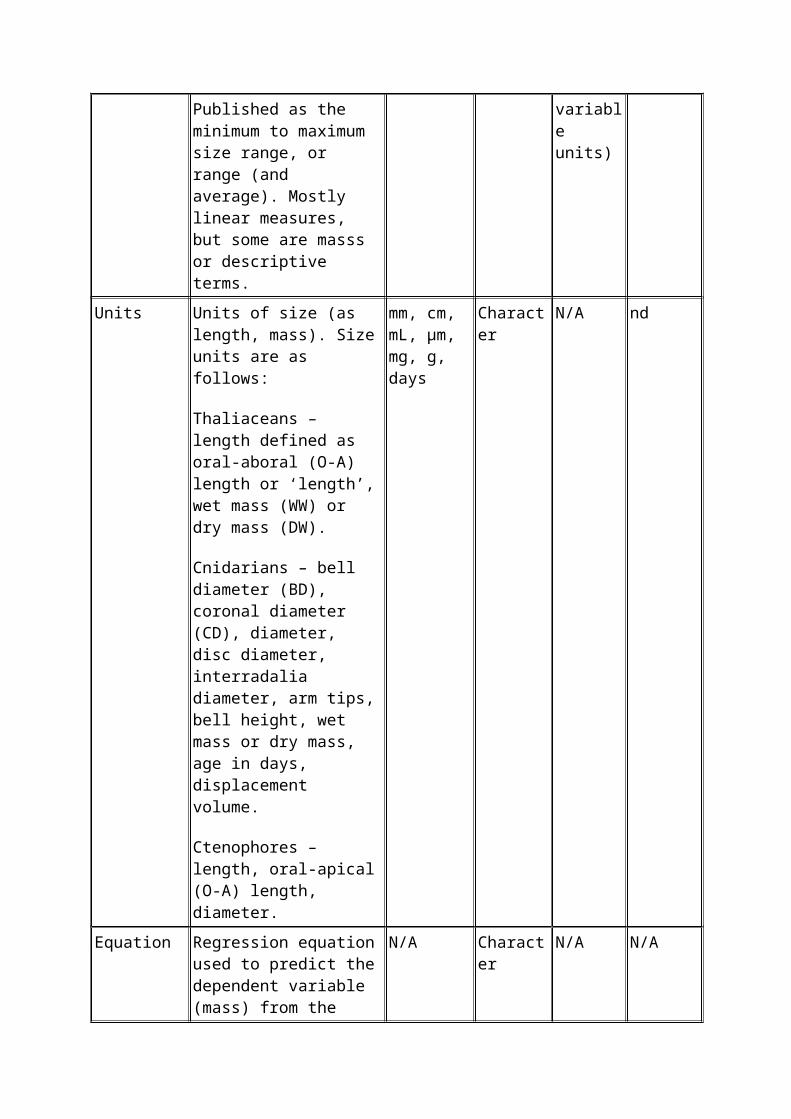
Size range Size range of individuals used in biometric analyses. Published as the minimum to maximum size range, or range (and average). Mostly linear measures, but some are masss or descriptive terms.
N/A Floating point
0.38 – 5456.4 (note variable units)
-999
Units Units of size (as length, mass). Size units are as follows:
Thaliaceans – length defined as oral-aboral (O-A) length or ‘length’, wet mass (WW) or dry mass (DW).
mm, cm, mL, µm, mg, g, days
Character N/A nd
Cnidarians – bell diameter (BD), coronal diameter (CD), diameter, disc diameter, interradalia diameter, arm tips, bell height, wet mass or dry mass, age in days, displacement volume.
Ctenophores – length, oral-apical (O-A) length, diameter.
Equation Regression equation used to predict the dependent variable (mass) from the measured independent variable (size or mass). The regression equations have been listed exactly as published. These may be power or linear functions using untransformed or (log10
or ln)-transformed data.
N/A Character N/A N/A
Measured size (units)
[size–mass biometry]
Independent variable (measured as length, diameter, height, volume) and unit of measure.
N/A
(various units in parentheses)
Character N/A N/A
Measured wt (units)
[mass–mass biometry]
Independent variable (measured as mass) and unit of measure.
N/A
(various units in parentheses)
Character N/A N/A
Unknown wt (units)
Dependent variable (mass) and unit of measure.
N/A
(various units in parentheses)
Character N/A N/A
a Intercept of the regression line.
N/A Floating point
-4.796 – 317.67 (note change of scale and units)
N/A
b Slope of the regression line. N/A Floating point
0.054 – 71.3
(note
N/A

change of regression type)
n Number of data points used to form the regression equation.
Number of individuals
Floating point
3 – 2475 -999
r2, r* Correlation coefficient of the regression equation, published as either r2 or r (indicated by *).
N/A Floating point
0.608 – 0.999
-999
P The level of significance of the correlation coefficient.
Between 0.000 and 0.999
Floating point
0.0001 – 0.05
-999
Source Source material from where the data were obtained. Mainly primary source, but secondary sources identified by xxx (‘cited in xxx’)
N/A Character N/A N/A
MASS TO MASS BIOMETRIC EQUATIONS
A. Data Set File
Identity: mass_to_mass_biometric_equations
Size: 66 records, not including header rows.
Format and Storage mode: ASCII (comma-delimited), compressed and ZIP
Header information: The first row of the file name contains the variable names (see Class IV-B Data structural descriptors)
Alphanumeric attributes: Mixed
Special characters/fields: -999 denotes lack of information in numeric fields, nd denotes lack of information in character fields.
Authentication procedures: n/a
B. Variable Information
As for Class IV-B: Size to Mass Biometric Equations.
CLASS V. SUPPLEMENTAL DESCRIPTORS
A. Data acquisition
Data forms: n/a.
Location of completed data forms: n/a.
B. Quality assurance/quality control procedures: Data were entered directly from source material into the computer file. Values have been double-checked by the authors.
C. Related material: Several publications contain data on biochemical composition (i.e., proteins, lipids, and carbohydrates), but these have not been archived in this study.
Displayed below is the complete list of 113 source references used in the compilation of the three data sets: (1) body composition, (2) size–mass biometric equations, and (3) mass–mass biometric equations.
COMPLETE LIST OF SOURCE REFERENCES
1. Anninsky, B. E., G. A. Finenko, G. I. Abolmasova, and Z. A. Romanova. 2007. Somatic organic content of the ctenophores Mnemiopsis leidyi (Ctenophora: Lobata) and Beroe ovata (Ctenophora: Beroida) in early ontogenetic stages. Russian Journal of Marine Biology 33:417–424.
2. Bailey, T. G., M. J. Youngbluth, and G. P. Owen. 1994. Chemical composition and oxygen consumption rates of the ctenophore Bolinopsis infundibulum from the Gulf of Maine. Journal of Plankton Research 16:673–689.
3. Bailey, T. G., M. J. Youngbluth, and G. P. Owen. 1995. Chemical composition and metabolic rates of gelatinous zooplankton from midwater and benthic boundary layer environments off Cape Hatteras, North Carolina, USA. Marine Ecology Progress Series 122:121–134.
4. Båmstedt, U. 1981. Water and organic content of boreal macroplankton and their significance for the energy content. Sarsia 66:59–66.
5. Båmstedt, U. 1990. Trophodynamics of the scyphomedusae Aurelia aurita. Predation rate in relation to abundance, size and type of prey organism. Journal of Plankton Research 12:215–229.
6. Båmstedt, U., M. B. Martinussen, and S. Matsakis. 1994. Trophodynamics of the two scyphozoan jellyfishes, Aurelia aurita and Cyanea capillata, in western Norway. ICES (International Council for the Exploration of the Sea) Journal of Marine Science 51:369–382.
7. Båmstedt, U., J. Lane, and M. B. Martinussen. 1999. Bioenergetics of ephyra larvae of the scyphozoan jellyfish Aurelia aurita in relation to temperature and salinity. Marine Biology 135:89–98.
8. Buecher, E., C. Sparks, A. Brierley, H. Boyer, and M. Gibbons. 2001. Biometry and size distribution of Chrysaora hysoscella (Cnidaria, Scyphozoa) and Aequorea aequorea (Cnidaria, Hydrozoa) off Namibia with some notes on their parasite Hyperia medusarum. Journal of Plankton Research 23:1073–1080.
9. Ceccaldi, H. J., A. Kanazawa, and S-I. Teshima. 1976. Chemical composition of some Mediterranean macroplanktonic organisms. 1. Proximate analysis. Tethys 8:295–298.
10. Cetta, C. M., L. P. Madin, and P. Kremer. 1986. Respiration and excretion by oceanic salps. Marine Biology 91:529–537.

11. Clarke, A., L. J. Holmes, and D. J. Gore. 1992. Proximate and elemental composition of gelatinous zooplankton from the Southern Ocean. Journal of Experimental Marine Biology and Ecology 155:55–68.
12. Cooper, L. H. N. 1939. Phosphorous, nitrogen, iron and manganese in marine zooplankton. Journal of the Marine Biological Association of the United Kingdom 23:387–390.
13. Costello, J. 1991. Complete carbon and nitrogen budgets for the hydromedusa Cladonema californicum (Anthomedusa: Cladonemidae). Marine Biology 108:119–128.
14. Curl, H. 1962. Standing crops of carbon, nitrogen, and phosphorous and transfer between trophic levels, in continental shelf waters south of New York. Rapports et Proces-verbaux des Réunions Conseil international pour l’Exploration de la Mer 153:183–189.
15. Daan, R. 1986. Food intake and growth of Sarsia tubulosa (Sars, 1835) with quantitative estimates of predation on copepod populations. Netherlands Journal of Sea Research 20:67–74.
16. Daan, R. 1989. Factors controlling the summer development of copepod populations in the Southern Bight of the North Sea. Netherlands Journal of Sea Research 23:305–322.
17. Davenport, J., and G. H. Balazs. 1991. ‘Fiery pyrosomas’: Are Pyrosomas an important items in the diet of leatherback turtles? British Herpetological Society Bulletin 37:33–38.
18. Davenport, J., and E. R. Trueman. 1985. Oxygen uptake and buoyancy in zooplankton organisms from the tropical eastern Atlantic. Comparative Biochemistry and Physiology 18A:857–863.
19. Deibel, D. 1985 Clearance rates of the salp Thalia democratica fed naturally occurring particles. Marine Biology 86:47–54.
20. Doyle, T. K., J. D. R. Houghton, R. McDevitt, J. Davenport, and G. C. Hays. 2007. The energy density of jellyfish: Estimates from bomb-calorimetry and proximate-composition. Journal of Experimental Marine Biology and Ecology 343:239–252.
21. Dubischar, C. D., and U. V. Bathmann. 1997. Grazing impact of copepods and salps on phytoplankton in the Atlantic sector of the Southern Ocean. Deep-Sea Research II 44:415–433.
22. Dubischar, C. D., E. A. Pakhomov, and U. V. Bathmann. 2006. The tunicate Salpa thompsoni ecology in the southern ocean. II. Proximate and elemental composition. Marine Biology 149:625–632.
23. Finenko, G. A., G. I. Abolmasova, and Z. A. Romanova. 1995. Feeding, respiration, and growth of the ctenophore Mnemiopsis mccradyi in relation to grazing conditions. Russian Journal of Marine Biology 21:283–287.
24. Finenko, G. A., B. E. Anninsky, Z. A. Romanova, G. I. Abolmasova, and A. E. Kideys. 2001. Chemical composition, respiration and feeding rates of the new alien ctenophore, Beroe ovata, in the Black Sea. Hydrobiologia 451:177–186.
25. Finenko, G. A., Z. A. Romanova, G. I. Abolmasova, B. E. Anninsky, L. S. Svetlichny, E. S., Hubareva, L. Bat, and A. E. Kideys. 2003. Population dynamics, ingestion, growth and reproduction rates of the invader Beroe ovata and its impact on plankton community in Sevastopol Bay, the Black Sea. Journal of Plankton Research 25:539–549.
26. Fosså, J. H. 1992. Mass occurrence of Periphylla periphylla (Scyphozoa, Coronatae) in a Norwegian fjord. Sarsia 77:237–251.
27. Garcia, J. R. 1990 Population dynamics and production of Phyllorhiza punctata (Cnidaria: Scyphozoa) in Laguna Joyuda, Puerto Rico. Marine Ecology Progress Series 64:243–251.
28. Gibson, D. M., and G-A. Paffenhöfer. 2000. Feeding and growth rates of the doliolid, Dolioletta gegenbauri Uljanin (Tunicata, Thaliacea). Journal of Plankton Research 22:1485–1500.
29. Gorsky, G., S. Dallot, J. Sardou, R. Fenaux, C. Carré, and I. Palazzoli. 1988. C and N composition of some northwestern Mediterranean zooplankton and micronekton species. Journal of Experimental Marine Biology and Ecology 124:133–144.
30. Haddad, M. A., and M. Nogueira Jr. 2006. Reappearance and seasonality of Phyllorhiza punctata von Ledenfeld (Cnidaria, Scyphozoa, Rhizostomeae) medusae in southern Brazil. Revista Brasileira de Zoologia 23:824–831.
31. Harbison, G. R., and R. W. Gilmer. 1976. The feeding rates of the pelagic tunicate Pegea confoederata and two other salps. Limnology and Oceanography 21:517–528.
32. Hay, S., J. R. G. Hislop, and A. M. Shanks. 1990. North Sea scyphomedusae: summer distribution, estimated biomass and significance particularly for 0-group Gadoid fish. Netherlands Journal of Sea Research. 25:113–130.
33. Heron, A. C., P. S. McWilliam, and G. Dalpont. 1988. Length-mass relation in the salp Thalia democratica and potential of salps as a source of food. Marine Ecology Progress Series 42:125–132.
34. Hirota, J. 1972. Laboratory culture and metabolism of the planktonic ctenophore, Pleurobrachia bachei A. Agassiz. In: Takenouti, A.Y. (ed) Biological oceanography of the northern North Pacific. Idemitsu Shoten, Tokyo, pp. 465–484.
35. Hirst, A. G., and C. H. Lucas. 1998. Salinity influences body mass quantification in the scyphomedusa Aurelia aurita: important implications for body mass determination in gelatinous zooplankton. Marine Ecology Progress Series 165:259–269.
36. Hoeger, U. 1983. Biochemical composition of ctenophores. Journal of Experimental Marine Biology and Ecology 72:251–261.
37. Huntley, M. E., P. F. Sykes, and V. Marin. 1989. Biometry and trophodynamics of Salpa thompsoni Foxton (Tunicata: Thaliacea) near the Antarctic Peninsula in Austral summer 1983 – 1984. Polar Biology 10:59–70.
38. Hyman, L. H. 1938. The water content of medusae. Science 87:166–167.39. Hyman, L. H. 1940 Observations and experiments on the physiology of medusae.
Biological Bulletin (Woods Hole, Mass.) 79:282–296. 40. Iguchi, N., and T. Ikeda. 2004. Metabolism and elemental composition of aggregate
and solitary forms of Salpa thompsoni (Tunicata: Thaliacea) in waters off the Antarctic Peninsula during austral summer 1999. Journal of Plankton Research 26:1025–1037.
41. Ikeda, T. 1972. Chemical composition and nutrition of zooplankton in the Bering Sea. In A. Y. Takenouti, editor. Biological oceanography of the northern North Pacific. Idemitsu Shoten, Tokyo, pp. 432–442.
42. Ikeda, T., and B. Bruce. 1986. Metabolic activity and elemental composition of krill and other zooplankton from Prydz Bay, Antarctica, during early summer (November-December). Marine Biology 92:545–555.
43. Ikeda, T., and A.W. Mitchell. 1982. Oxygen uptake, ammonia excretion and phosphate excretion by krill and other Antarctic zooplankton in relation to their body size and chemical composition. Marine Biology 71:283–298.
44. Ivleva, I. V., and T. I. Litovchenko. 1978. Respiration of coelenterata and ctenophore depending on the habitat temperature. Biologiya Morya (Kiev) 46: 3–25. In Russian; English abstract.

45. Jankowski, T. 2000. Chemical composition and biomass parameters of a population of Craspedacusta sowerbii Lank 1880 (Cnidaria: Limnomedusa). Journal of Plankton Research 22:1329–1340.
46. Katechakis, A., H. Stirbor, U. Sommer, and T. Hansen. 2004. Feeding selectivities and food niche separation of Acartia clausi, Penilia avirostris (Crustacea) and Doliolum denticulatum (Thaliacea) in Blanes Bay (Catalan Sea, NW Mediterranean). Journal of Plankton Research 26:589–603.
47. Kideys, A. E., and M. Moghim. 2003. Distribution of the alien ctenophore Mnemiopsis leidyi in the Caspian Sea in August 2001. Marine Biology 142:163–171.
48. Kideys, A. E., G. Shahram, G. Davood, A. Roohi, and S. Bagheri. 2001. Strategy for combating Mnemiopsis in the Caspian waters of Iran. Final report, July 2001, prepared for the Caspian Environment Programme, Baku, Azerbaijan.
49. Kikinger, R. 1992. Cotylorhiza tuberculata (Cnidaria: Scyphozoa) - life history of a stationary population. P.S.Z.N.I. Marine Ecology (Berlin) 13:333–362.
50. Kraeuter, J. N., and E. M. Setzler. 1975. The seasonal cycle of scyphozoa and cubozoa in Georgia estuaries. Bulletin of Marine Science 25:66–74.
51. Kremer, P. 1975. Excretion and body composition of the ctenophore Mnemiopsis leidyi (A. Agassiz): comparisons and consequences. 10th European Marine Biology Symposium on Marine Biology, Ostend, Belgium. Sept 17-23, 1975, Volume 2: 351–362.
52. Kremer, P., and S. W. Nixon. 1976. Distribution and abundance of the ctenophore, Mnemiopsis leidyi, in Narragansett Bay. Estuarine and Coastal Marine Science 4:627–629.
53. Kremer, P., M. F. Canino, and R. W. Gilmer. 1986a. Metabolism of epipelagic tropical ctenophores. Marine Biology 90:403–412.
54. Kremer, P., M. R. Reeve, and M. A. Syms. 1986b. The nutritional ecology of the ctenophore Bolinopsis vitrea: comparisons with Mnemiopsis mccradyi from the same region. Journal of Plankton Research 8:1197–1208.
55. Kremer, P., J. Costello, J. Kremer, and M. Canino. 1990. Significance of photosynthetic endosymbionts to the carbon budget of the scyphomedusa Linuche unguiculata. Limnology and Oceanography 35:609–624.
56. Larson, R. J. 1986. Water content, organic content, and carbon and nitrogen composition of medusae from the Northeast Pacific. Journal of Experimental Marine Biology and Ecology 99:107–120.
57. Larson, R. J. 1991. Diet, prey selection and daily ration of Stomolophus meleagris, a filter-feeding scyphomedusa from the NE Gulf of Mexico. Estuarine and Coastal Shelf Science 32:511–525.
58. Le Borgne, R. 1982. Zooplankton production in the eastern tropical Atlantic Ocean, net growth efficiency and P:B in terms of carbon, nitrogen, and phosphorus. Limnology and Oceanography 27:681–698.
59. Lebrato, M., and D. O. B. Jones. 2009. Mass deposition event of Pyrosoma atlanticum carcasses off Ivory Coast (West Africa). Limnology and Oceanography 54:1197–1209.
60. Lucas, C. H. 1993. The biology of gelatinous predators and their impact on the mesozooplankton community of Southampton Water. PhD Thesis, University of Southampton, UK
61. Lucas, C. H. 1994. Biochemical composition of Aurelia aurita in relation to age and sexual maturity. Journal of Experimental Marine Biology and Ecology 183:179–192.
62. Lucas, C. H. 1996. Population dynamics of Aurelia aurita (Scyphozoa) from an isolated brackish lake, with particular reference to sexual reproduction. Journal of Plankton Research 18:987–1007.

63. Lucas, C. H. 2009. Biochemical composition of the mesopelagic coronate jellyfish Periphylla periphylla from the Gulf of Mexico. Journal of the Marine Biological Association of the United Kingdom 89:77–81.
64. Lucas, C. H., and J. A. Williams. 1994. Population dynamics of the scyphomedusa Aurelia aurita in Southampton Water. Journal of Plankton Research 16:879–895.
65. Lutcavage, M., and P. L. Lutz. 1986. Metabolic rate and food energy requirements of the leatherback sea turtle, Dermochelys coriacea. Copeia 1986:796–798.
66. Madin, L. P., and D. Deibel. 1998. Feeding and energetics of Thaliacea. In Q. Bone, editor. The Biology of Pelagic Tunicates. Oxford University Press, Oxford, pp. 81–103.
67. Madin, L. P., and G. R. Harbison. 1978. Salps of the genus Pegea Savigny 1816 (Tunicata: Thaliacea). Bulletin of Marine Science 28:335–344.
68. Madin, L. P., and J. E. Purcell.1992. Feeding, metabolism and growth of Cyclosalpa bakeri in the subarctic Pacific. Limnology and Oceanography 37:1236–1251.
69. Madin, C.P., C. M. Cetta, and V. L. 1981 Elemental and biochemical composition of salps (Tunicata: Thaliacea). Marine Biology 63:217–226.
70. Malej, A., J. Faganeli, and J. Pezdič. 1993. Stable isotope and biochemical fractionation in the marine pelagic food chain: the jellyfish Pelagia noctiluca and net zooplankton. Marine Biology 116:565–570.
71. Martinussen, M. B., and U. Båmstedt. 1999. Nutritional ecology of gelatinous planktonic predators. Digestion rate in relation to type and amount of prey. Journal of Experimental Marine Biology and Ecology, 232:61–84.
72. Matsakis, S., and R. J. Conover. 1991. Abundance and feeding of medusae and their potential impact as predators on other zooplankton in Bedford Basin (Nova Scotia, Canada). Canadian Journal of Fisheries and Aquatic Science 48:1419–1430.
73. Matsakis, S., and P. Nival. 1989. Elemental composition and food intake of Phialidium hydromedusae in the laboratory. Journal of Experimental Marine Biology and Ecology 130:277–290.
74. Matthews, J. B. L., and L. Hestad. 1977. Ecological studies on the deep-water pelagic community of Korsfjorden, Western Norway. Sarsia 63:57–63.
75. Mayzaud, P., M. Boutonte, R. Perissinotto, and P. Nichols. 2007. Polar and neutral lipid composition in the pelagic tunicate Pyrosoma atlanticum. Lipids 42:647–657.
76. Møller, L. F., and H. U. Riisgård. 2007. Feeding, bioenergetics and growth in the common jellyfish Aurelia aurita and two hydromedusae, Sarsia tubulosa and Aequorea vitrina. Marine Ecology Progress Series 346:167–177.
77. Morand, P., C. Carré, and D. C. Biggs. 1987. Feeding and metabolism of the jellyfish Pelagia noctiluca (Scyphomedusae, Semaeostomeae). Journal of Plankton Research 9:651–665.
78. Morris, R. J., M. J. McCartney, and A. Schulze-Röbbecke. 1983. Bolinopsis infundibulum (O.F. Müller): biochemical composition in relation to diet. Journal of Experimental Marine Biology and Ecology 67:149–157.
79. Mutlu, E. 1999. Distribution and abundance of ctenophores and their zooplankton food in the Black Sea. II. Mnemiopsis leidyi. Marine Biology 135:603–613.
80. Mutlu, E., and F. Bingel. 1999. Distribution and abundance of ctenophores and their zooplankton food in the Black Sea. I. Pleurobrachia pileus. Marine Biology 135:589–601.
81. Nemazie, D. A., J. E. Purcell, and P. M. Gilbert. 1993. Ammonium excretion by gelatinous zooplankton and their contribution to the ammonium requirements of microplankton in Chesapeake Bay. Marine Biology 116:451–458.
82. Nogueira Jr M., and M. A. Haddad. 2006. Relações de tamanho e peso das grandes medusas (Cnidaria) do litoraldo Paraná, Sul do Brasil. Revista Brasileira de Zoologia 23:1231–1234.
83. Olesen, N. J., K. Frandsen, and H. U. Riisgård. 1994. Population dynamics, growth and energetics of jellyfish Aurelia aurita in a shallow fjord. Marine Ecology Progress Series 105:9–18.
84. Olesen, N. J., J. E. Purcell, and D. K. Stoecker. 1996. Feeding and growth by ephyrae of scyphomedusae Chrysaora quinquecirrha. Marine Ecology Progress Series 137:149–159.
85. Percy, J. A., and F. J. Fife. 1981. The biochemical composition and energy content of Arctic marine macrozooplankton. Arctic 34:307–313.
86. Persad, G., R. R. Hopcroft, M. K. Webber, and J. C. Roff. 2003. Abundance, biomass and production of ctenophores and medusae off Kingston, Jamaica. Bulletin of Marine Science 73:379–396.
87. Pertsova, N. M., K. N. Kosobokova, and A. A. Prudkovsky. 2006. Population size structure, spatial distribution, and life cycle of the hydromedusa Aglantha digitale (O.F. Müller, 1766) in the White Sea. Oceanology 46:228–237.
88. Pitt, K. A., and M. J. Kingsford. 2003. Temporal variation in the virgin biomass of the edible jellyfish, Catostylus mosaicus (Scyphozoa, Rhizostomeae). Fisheries Research 63:303–313.
89. Purcell, J. E. 1982. Feeding and growth of the siphonophore Muggiaea atlantica (Cunningham 1893). Journal of Experimental Marine Biology and Ecology 62:339–354.
90. Purcell, J. E. 1992. Effects of predation by the scyphomedusan Chrysaora quinquecirrha on zooplankton populations in Chesapeake Bay, USA. Marine Ecology Progress Series 87:65–76
91. Purcell, J. E., and P. Kremer. 1983. Feeding and metabolism of the siphonophore Sphaeronectes gracilis. Journal of Plankton Research 5:95–106.
92. Purcell, J. E., V. Fuentes, D. Atienza, U. Tilves, D. Astorga, M. Kawahara, and G. C. Hays. 2010. Use of respiration rates of scyphozoan jellyfish to estimate their effects on the food web. Hydrobiologia 645:35–152.
93. Reinke, M. 1987. On the feeding and locomotory physiology of Salpa thompsoni and Salpa fusiformis. Berichte zur Polarforschung 36:1–89.
94. Reeve, M. R. 1980. Comparative experimental studies on the feeding of chaetognaths and ctenophores. Journal of Plankton Research 2:381–393.
95. Reeve, M. R., and L. D. Baker. 1975. Production of two planktonic carnivores (Chaetognath and Ctenophore) in South Florida inshore waters. Fisheries Bulletin US 73:238–248.
96. Reeve, M. R., and M. A. Walter. 1976. A large-scale experiment on the growth and predation potential of ctenophore populations. In G. Mackie, editor. Coelenterate Ecology and Behaviour. Plenum Press, New York, pp. 187–199.
97. Reeve, M. R., M. A. Walter, and T. Ikeda. 1978. Laboratory studies of ingestion and food utilization in lobate and tentaculate ctenophores. Limnology and Oceanography 23:740–751.
98. Reeve, M. R., M. A. Syms, and P. Kremer. 1989. Growth dynamics of a ctenophore (Mnemiopsis) in relation to variable food supply. I. Carbon biomass, feeding, egg production, growth and assimilation efficiency. Journal of Plankton Research 11:535–552.
99. Schneider, G. 1988. Chemische Zusammensetzung und Biomasseparameter der Ohrenqualle Aurelia aurita. Helgoländer Meeresuntersuchungen 42:319–327.

100. Schneider, G. 1989. Zur chemischen Zusammensetzung der ctenophore Pleurobrachia pileus in der Kieler Bucht. Helgoländer Meeresuntersuchungen 43:67–76.
101. Scolardi, K. M., K. L. Daly, E. A. Pakhomov, and J. T. Torres. 2006. Feeding ecology and metabolism of the Antarctic cydippid ctenophores Callianira antarctica. Marine Ecology Progress Series 317:111–126.
102. Shenker, J. M. 1985. Carbon content of the neritic scyphomedusa Chrysaora fuscescens. Journal of Plankton Research 7:169–173.
103. Shiganova, T. A., Y. V. Bulgakova, S. P. Volovik, Z. A. Mirzoyan, and S. I. Dudkin. 2001. The new invader Beroe ovata Mayer 1912 and its effect on the ecosystem of the northeastern Black Sea. Hydrobiologia 451:187–197.
104. Shushkina, E. A., E. I. Musaeva, L. L. Anokhina, and T. L. Lukasheva. 2000. The role of gelatinous macroplankton, jellyfish Aurelia, and ctenophores Mnemiopsis and Beroe in the planktonic communities of the Black Sea. Russian Academy of Sciences. Oceanology 40:809–816.
105. Small, L. F., S. W. Fowler, S. A. Moore, and J. La Rosa. 1983. Dissolved and fecal pellet carbon and nitrogen release by zooplankton in tropical waters. Deep-Sea Research 30 (Part 12A):1199–1220.
106. Uye, S., and H. Shimauchi. 2005. Population biomass, feeding, respiration and growth rates, and carbon budget of the scyphomedusa Aurelia aurita in the Inland Sea of Japan. Journal of Plankton Research 27:237–248.
107. van Soest, R. W. M. 1973. The genus Thalia Blumenbach 1798 (Tunicata, Thaliacea), with descriptions of two new species. Beaufortia 20:193–212.
108. van Soest, R. W. M. 1974a. Taxonomy of the subfamily Cyclosalpinae Yount, 1954 (Tunicata, Thaliacea) with descriptions of two new species. Beaufortia 22:17–55.
109. van Soest, R. W. M. 1974b. A revision of the genera Salpa Forskal 1775, Pegea Savigny 1816, and Ritteriella Metcalf, 1919 (Tunicata, Thaliacea). Beaufortia 22:153–191.
110. Weisse, T., and M-T. Gomiou. 2000. Biomass and size structure of the scyphomedusa Aurelia aurita in the northwestern Black Sea during spring and summer. Journal of Plankton Research 22:223–239.
111. Youngbluth, M. J., and U. Båmstedt. .2001. Distribution, abundance, behavior and metabolism of Periphylla periphylla, a mesopelagic coronate medusa in a Norwegian fjord. Hydrobiologia 451:321–333.
112. Youngbluth, M. J., P. Kremer, T. G. Bailey, and C. A. Jacoby. 1988. Chemical composition, metabolic rates and feeding behaviour of the midwater ctenophore Bathocyroe fosteri. Marine Biology 98:87–94.
113. Yousefian, M., and A. E. Kideys. 2003. Biochemical composition of Mnemiopsis leidyi in the southern Caspian Sea. Fish Physiology and Biochemistry 29:127–131.
D. Computer programs and data processing algorithms: Means and standard deviations were calculated using the “average” and “stdev” functions in MS Excel.
E. Archiving: n/a
F. Publications using the data set: n/a
G. Publications using the same sites: n/a
H. History of data set usage

Data request history: n/a
Data set update history: n/a
Review history: n/a
Questions and comments from secondary users: n/a
ACKNOWLEDGMENTS
This research is a contribution to the “Global Expansion of Jellyfish Blooms: Magnitude, Causes and Consequences” Working Group, supported by the National Center for Ecological Analysis and Synthesis (NCEAS), a Center supported by NSF (Grant #DEB-94-21535), the University of California at Santa Barbara, and the State of California.
LITERATURE CITED
Billett, D. S. M., B. J. Bett, C. L. Jacobs, I. P. Rouse, and D. B. Wigham. 2006. Mass deposition of jellyfish in the deep Arabian Sea. Limnology and Oceanography 51:2077–2083.
Brodeur, R. D., M. B. Decker, L. Cianelli, J. E. Purcell, N. A. Bond, P. J. Stabeno, E. Acuña, and G. L. Hunt. 2008. Rise and fall of jellyfish in the eastern Bering Sea in relation to climate regime shifts. Progress in Oceanography 77:103–111.
Condon, R. H., and D. K. Steinberg. 2008. Development, biological regulation, and fate of ctenophore blooms in the York River estuary, Chesapeake Bay. Marine Ecology Progress Series 369:153–168.
Condon, R. H., D. K. Steinberg, P. A. del Giorgio, T. C. Bouvier, D. A. Bronk, W. M. Graham, and H. W. Ducklow. In press. The ‘jelly carbon pump’: jellyfish blooms result in a major microbial respiratory sink of carbon in marine systems. Proceedings of the National Academy of Science.
Daskalov, G. M., A. N. Grishin, S. Rodionov, and V. Mihneva. 2007. Trophic cascades triggered by overfishing reveal possible mechanisms of ecosystem regime shifts. Proceedings of the National Academy of Science USA 104:10518–10523.
Dawson, M. N., L. E. Martin, and L. K. Penland. 2001. Jellyfish swarms, tourists, and the Christ-child. Hydrobiologia 451:131–144.
Dong, Z., D. Liu, and J. K. Keesing. 2010. Jellyfish blooms in China: Dominant species, causes and consequences. Marine Pollution Bulletin 60:954–963.
Gage, J. D., and P. A. Tyler. 1991. Deep-sea biology: A natural history of organisms at the deep-sea floor. Cambridge University Press, 504 pp.
Harris, R. P., P. H. Wiebe, J. Lenz, H. R. Skjodal, and M. Huntley. 2000. ICES zooplankton methodology manual. Academic Press, London, 684 pp.

Hirst, A. G., and C. H. Lucas. 1998. Salinity influences body mass quantification in the scyphomedusa Aurelia aurita: important implications for body mass determination in gelatinous zooplankton. Marine Ecology Progress Series 165:259–269.
Iguchi, N., and T. Ikeda. 2004. Metabolism and elemental composition of aggregate and solitary forms of Salpa thompsoni (Tunicata: Thaliacea) in waters off the Antarctic Peninsula during austral summer 1999. Journal of Plankton Research 26:1025–1037.
Kogovšek T., B. Bogunović, and A. Malej. 2010. Recurrence of bloom-forming scyphomedusae: wavelet analysis of a 200-year time-series. Hydrobiologia 645:81–96.
Kovalev, A. V., and S. A. Piontkovski. 1998. Interannual changes in the biomass of the Black Sea gelatinous zooplankton. Journal of Plankton Research 20:1377–1385.
Larson, R. J. 1986. Water content, organic content, and carbon and nitrogen composition of medusae from the Northeast Pacific. Journal of Experimental Marine Biology and Ecology 99:107–120.
Lebrato, M., and D. O. B. Jones. 2009. Mass deposition event of Pyrosoma atlanticum carcasses off Ivory Coast (West Africa). Limnology and Oceanography 54:1197–1209.
Licandro, P., D. V. P. Conway, M. N. Daly Yahia, M. L. Fernandez de Puelles, S. Gasparini, J. H. Hecq, P. Tranter, and R. R. Kirby. 2010. A blooming jellyfish in the northeast Atlantic and Mediterranean. Biology Letters 6:688–691.
Lucas, C. H. 2001. Reproduction and life history strategies of the common jellyfish, Aurelia aurita, in relation to its ambient environment. Hydrobiologia 451:229–246.
Lynam, C. P., M. J. Gibbons, B. E. Axelsen, C. A. J. Sparks, J. Coetzee, B. G. Heywood, and A. S. Brierley. 2006. Jellyfish overtake fish in a heavily fished ecosystem. Current Biology 16:R492–R493.
Lynam,C. P., M. J. Attrill, and M. D. Skogen. 2010. Climatic and oceanic influences on the abundance of gelatinous zooplankton in the North Sea. Journal of the Marine Biological Association of the United Kingdom 90:1153–1159.
Madin, L. P., and D. Deibel. 1998. Feeding and energetics of Thaliaceans. In Q. Bone, editor. The Biology of Pelagic Tunicates. Oxford University Press, Oxford, pp.81–103.
Madin, L. P., P. Kremer, P. H. Wiebe, J. E. Purcell, E. H. Horgan, and D. A. Nemazie. 2006. Periodic swarms of the salp Salpa aspera in the Slope Water off the NE United States: Biovolume, vertical migration, grazing, and vertical flux. Deep-Sea Research I 53:804–819.
Malej, A., J. Faganeli, and J. Pezdič. 1993. Stable isotope and biochemical fractionation in the marine pelagic food chain: the jellyfish Pelagia noctiluca and net zooplankton. Marine Biology 116:565–570.
Mills, C. E. 2001. Jellyfish blooms: are populations increasing globally in response to changing ocean conditions? Hydrobiologia 451:55–68.

Pauly, D., W. Graham, S. Libralato, L. Morissette, and M. L. Deng Palamores. 2009. Jellyfish in ecosystems, online databases, and ecosystem models. Hydrobiologia 616:67–85.
Phillips, B., P. Kremer, and L. Madin. 2009. Defecation by Salpa thompsoni and its contribution to vertical flux in the Southern Ocean. Marine Biology 156:455–467.
Pitt, K. A., M. J. Kingsford, D. Rissik, and K. Koop. 2007. Jellyfish modify the response of planktonic assemblages to nutrient pulses. Marine Ecology Progress Series 351:1–13.
Pitt, K. A., D. T. Welsh, and R. H. Condon. 2009. Influence of jellyfish blooms on carbon, nitrogen and phosphorous cycling and plankton production. Hydrobiologia 616:133–149.
Purcell, J. E., and M. B. Decker. 2005. Effects of climate on relative predation by scyphomedusae and ctenophores on copepods in Chesapeake Bay during 1987–2000. Limnology and Oceanography 50:376–387.
Purcell, J. E., S-I. Uye, and T. Lo. 2007. Anthropogenic causes of jellyfish blooms and their direct consequences for humans: a review. Marine Ecology Progress Series 350:153–174.
Reusch, T. B. H., S. Bolte, M. Sparwel, A. G. Moss, and J. Javidpour. 2010. Microsatellites reveal origins and genetic diversity of Eurasian invasions by one of the world’s most notorious marine invader, Mnemiopsis leidyi (Ctenophora). Molecular Ecology 19:2690–2699.
Richardson, A. J., A. Bakun, G. C. Hays, and M. J. Gibbons. 2009. The jellyfish joyride: causes, consequences and management responses to a more gelatinous future. Trends in Ecology and Evolution 24:312–322.
Sexton, M. A., R. R. Hood, J. Sarkodee-ado, and A. M. Liss. 2010. Response of Chrysaora quinquecirrha medusae to low temperature. Hydrobiologia 645:125–133.
Uye, S-I. 2008. Blooms of the giant jellyfish Nemopilema nomurai: a threat to the fisheries sustainability of the East Asian Marginal Seas. Plankton and Benthos Research 3 (Supplement):125–131.
West, E. J., D. T. Welch, and K. A. Pitt. 2009. Influence of decomposing jellyfish on the sediment oxygen demand and nutrient dynamics. Hydrobiologia 616:151–160.
Wiebe, P. H., L. P. Madin, L. R. Haury, G. R. Harbison, and L. M. Philbin. 1979. Diel vertical migration by Salpa aspera and its potential for large-scale particulate organic matter transport to the deep sea. Marine Biology 53:249–255.
[Back to E092-144]