· web viewstudents use appropriate statistics, representations of data, ... analysis of parts of...
TRANSCRIPT

Enhanced TEKS Clarification
Mathematics
Grade 8
2014 - 2015
Grade 8
§111.25. Implementation of Texas Essential Knowledge and Skills for Mathematics, Middle School, Adopted 2012.Source: The provisions of this §111.25 adopted to be effective September 10, 2012, 37 TexReg 7109.§111.28. Grade 8, Adopted 2012.
8.Intro.1 The desire to achieve educational excellence is the driving force behind the Texas essential knowledge and skills for mathematics, guided by the college and career readiness standards. By embedding statistics, probability, and finance, while focusing on computational thinking, mathematical fluency, and solid understanding, Texas will lead the way in mathematics education and prepare all Texas students for the challenges they will face in the 21st century.
8.Intro.2 The process standards describe ways in which students are expected to engage in the content. The placement of the process standards at the beginning of the knowledge and skills listed for each grade and course is intentional. The process standards weave the other knowledge and skills together so that students may be successful problem solvers and use mathematics efficiently and effectively in daily life. The process standards are integrated at every grade level and course. When possible, students will apply mathematics to problems arising in everyday life, society, and the workplace. Students will use a problem-solving model that incorporates analyzing given information, formulating a plan or strategy, determining a solution, justifying the solution, and evaluating the problem-solving process and the reasonableness of the solution. Students will select appropriate tools such as real objects, manipulatives, algorithms, paper and pencil, and technology and techniques such as mental math, estimation, number sense, and generalization and abstraction to solve problems. Students will effectively communicate mathematical ideas, reasoning, and their implications using multiple representations such as symbols, diagrams, graphs, computer programs, and language. Students will use mathematical relationships to generate solutions and make connections and predictions. Students will analyze mathematical relationships to connect and communicate mathematical ideas. Students will display, explain, or justify mathematical ideas and arguments using precise mathematical language in written or oral communication.
8.Intro.3 The primary focal areas in Grade 8 are proportionality; expressions, equations, relationships, and foundations of functions; and measurement and data. Students use concepts, algorithms, and properties of real numbers to explore mathematical relationships and to describe increasingly complex situations. Students use concepts of proportionality to explore, develop, and communicate mathematical relationships. Students use algebraic thinking to describe how a change in one quantity in a relationship results in a change in the other. Students connect verbal, numeric, graphic, and symbolic representations of relationships, including equations and inequalities. Students begin to develop an understanding of functional relationships. Students use geometric properties and relationships, as well as spatial reasoning, to model and analyze situations and solve problems. Students communicate information about geometric figures or situations by quantifying attributes, generalize procedures from measurement experiences, and use the procedures to solve problems. Students use appropriate statistics, representations of data, and reasoning to draw conclusions, evaluate arguments, and make recommendations. While the use of all types of technology is important, the emphasis

Grade 8
on algebra readiness skills necessitates the implementation of graphing technology.
8.Intro.4 Statements that contain the word "including" reference content that must be mastered, while those containing the phrase "such as" are intended as possible illustrative examples.
8.1 Mathematical process standards. The student uses mathematical processes to acquire and demonstrate mathematical understanding. The student is expected to:
8.1A Apply mathematics to problems arising in everyday life, society, and the workplace.
Apply mathematics to problems arising in everyday life, society, and the workplace.ApplyMATHEMATICS TO PROBLEMS ARISING IN EVERYDAY LIFE, SOCIETY, AND THE WORKPLACE
Note(s):
The mathematical process standards may be applied to all content standards as appropriate. TxRCFP:
o Representing, applying, and analyzing proportional relationshipso Using expressions and equations to describe relationships, including the Pythagorean Theoremo Making inferences from data
TxCCRS:
X. Connections
8.1B Use a problem-solving model that incorporates analyzing given information, formulating a plan or strategy, determining a solution,
justifying the solution, and evaluating the problem-solving process and the reasonableness of the solution.
Use a problem-solving model that incorporates analyzing given information, formulating a plan or strategy, determining a solution,
justifying the solution, and evaluating the problem-solving process and the reasonableness of the solution.UseA PROBLEM-SOLVING MODEL THAT INCORPORATES ANALYZING GIVEN INFORMATION, FORMULATING A PLAN OR STRATEGY, DETERMINING A SOLUTION, JUSTIFYING THE SOLUTION, AND EVALUATING THE PROBLEM-SOLVING PROCESS AND THE REASONABLENESS OF THE SOLUTION

Grade 8
Note(s):
The mathematical process standards may be applied to all content standards as appropriate. TxRCFP:
o Representing, applying, and analyzing proportional relationshipso Using expressions and equations to describe relationships, including the Pythagorean Theoremo Making inferences from data
TxCCRS:
VIII. Problem Solving and Reasoning
8.1C Select tools, including real objects, manipulatives, paper and pencil, and technology as appropriate, and techniques, including mental
math, estimation, and number sense as appropriate, to solve problems.
Select tools, including real objects, manipulatives, paper and pencil, and technology as appropriate, and techniques, including mental
math, estimation, and number sense as appropriate, to solve problems.SelectTOOLS, INCLUDING REAL OBJECTS, MANIPULATIVES, PAPER AND PENCIL, AND TECHNOLOGY AS APPROPRIATE, TO SOLVE PROBLEMS
SelectTECHNIQUES, INCLUDING MENTAL MATH, ESTIMATION, AND NUMBER SENSE AS APPROPRIATE, TO SOLVE PROBLEMS
Note(s):
The mathematical process standards may be applied to all content standards as appropriate. TxRCFP:
o Representing, applying, and analyzing proportional relationshipso Using expressions and equations to describe relationships, including the Pythagorean Theoremo Making inferences from data
TxCCRS:
VIII. Problem Solving and Reasoning

Grade 8
8.1D Communicate mathematical ideas, reasoning, and their implications using multiple representations, including symbols, diagrams, graphs,
and language as appropriate.
Communicate mathematical ideas, reasoning, and their implications using multiple representations, including symbols, diagrams, graphs,
and language as appropriate.CommunicateMATHEMATICAL IDEAS, REASONING, AND THEIR IMPLICATIONS USING MULTIPLE REPRESENTATIONS, INCLUDING SYMBOLS, DIAGRAMS, GRAPHS, AND LANGUAGE AS APPROPRIATE
Note(s):
The mathematical process standards may be applied to all content standards as appropriate. TxRCFP:
o Representing, applying, and analyzing proportional relationshipso Using expressions and equations to describe relationships, including the Pythagorean Theoremo Making inferences from data
TxCCRS:
IX. Communication and Representation
8.1E Create and use representations to organize, record, and communicate mathematical ideas.
Create and use representations to organize, record, and communicate mathematical ideas.Create, UseREPRESENTATIONS TO ORGANIZE, RECORD, AND COMMUNICATE MATHEMATICAL IDEAS
Note(s):
The mathematical process standards may be applied to all content standards as appropriate. TxRCFP:
o Representing, applying, and analyzing proportional relationshipso Using expressions and equations to describe relationships, including the Pythagorean Theoremo Making inferences from data

Grade 8
TxCCRS:
IX. Communication and Representation
8.1F Analyze mathematical relationships to connect and communicate mathematical ideas.
Analyze mathematical relationships to connect and communicate mathematical ideas.AnalyzeMATHEMATICAL RELATIONSHIPS TO CONNECT AND COMMUNICATE MATHEMATICAL IDEAS
Note(s):
The mathematical process standards may be applied to all content standards as appropriate. TxRCFP:
o Representing, applying, and analyzing proportional relationshipso Using expressions and equations to describe relationships, including the Pythagorean Theoremo Making inferences from data
TxCCRS:
X. Connections
8.1G Display, explain, and justify mathematical ideas and arguments using precise mathematical language in written or oral communication.
Display, explain, and justify mathematical ideas and arguments using precise mathematical language in written or oral communication.Display, Explain, JustifyMATHEMATICAL IDEAS AND ARGUMENTS USING PRECISE MATHEMATICAL LANGUAGE IN WRITTEN OR ORAL COMMUNICATION
Note(s):
The mathematical process standards may be applied to all content standards as appropriate. TxRCFP:
o Representing, applying, and analyzing proportional relationshipso Using expressions and equations to describe relationships, including the Pythagorean Theoremo Making inferences from data

Grade 8
TxCCRS:
IX. Communication and Representation
8.2 Number and operations. The student applies mathematical process standards to represent and use real numbers in a variety of forms. The student is expected to:
8.2A Extend previous knowledge of sets and subsets using a visual representation to describe relationships between sets of real numbers.
Supporting StandardExtend previous knowledge of sets and subsets using a visual representation to describe relationships between sets of real numbers.
Supporting StandardExtendPREVIOUS KNOWLEDGE OF SETS AND SUBSETS USING A VISUAL REPRESENTATIONIncluding, but not limited to:
Counting (natural) numbers – the set of positive numbers that begins at one and increases by increments of one each time {1, 2, 3, ..., n} Whole numbers – the set of counting (natural) numbers and zero {0, 1, 2, 3, ..., n} Integers – the set of counting (natural numbers), their opposites, and zero {-n, …, -3, -2, -1, 0, 1, 2, 3, ..., n}. The set of integers is denoted by
the symbol Z.
Rational numbers – the set of numbers that can be expressed as a fraction , where a and b are integers and b ≠ 0, which includes the
subsets of integers, whole numbers, and counting (natural) numbers (e.g., -3, 0, 2, etc.). The set of rational numbers is denoted by the symbol Q.
Irrational numbers – the set of numbers that cannot be expressed as a fraction , where a and b are integers and b ≠ 0 Real numbers – the set of rational and irrational numbers. The set of real numbers is denoted by the symbol R. Visual representations of the relationships between sets and subsets of real numbers

Grade 8
To DescribeRELATIONSHIPS BETWEEN SETS OF REAL NUMBERSIncluding, but not limited to:
All counting (natural) numbers are a subset of whole numbers, integers, rational numbers, and real numbers.o Ex: Two is a counting (natural) number, whole number, integer, rational number, and real number.
All whole numbers are a subset of integers, rational numbers, and real numbers.o Ex: Zero is a whole number, integer, rational number, and real number, but not a counting (natural) number.
All integers are a subset of rational numbers and real numbers.o Ex: Negative two is an integer, rational number, and real number, but neither a whole number nor counting (natural) number.
All counting (natural) numbers, whole numbers, and integers are a subset of rational numbers and real numbers.o Ex: Four is a counting (natural) number, whole number, integer, rational number, and real number.
Not all rational numbers are integers, whole numbers, or counting (natural) numbers.o Ex: One-half is a rational number but not an integer, whole number, or counting (natural) number.
Terminating and repeating decimals are rational numbers but not integers, whole numbers, or counting (natural) numbers.o Ex: is a repeating decimal; therefore, it is rational number and a real number.
All irrational numbers are a subset of real numbers.o Ex: π is a real number and an irrational number.
Real numbers include all rational numbers, integers, whole numbers, counting (natural) numbers, and irrational numbers. Not all real numbers are rational numbers.

Grade 8
o Ex: is not a rational number but it is a real number. is an irrational number.
Note(s):
Grade Level(s):o Grade 7 extended previous knowledge of sets and subsets using a visual representation to describe relationships between sets of
rational numbers.o Grade 8 introduces the set of irrational numbers as a subset of real numbers.o Various mathematical process standards will be applied to this student expectation as appropriate.
TxRCFP:o Grade Level Connections (reinforces previous learning and/or provides development for future learning)
TxCCRS:o I. Numeric Reasoningo IX. Communication and Representation
8.2B Approximate the value of an irrational number, including π and square roots of numbers less than 225, and locate that rational number
approximation on a number line.
Supporting StandardApproximate the value of an irrational number, including π and square roots of numbers less than 225, and locate that rational number
approximation on a number line.
Supporting StandardApproximateTHE VALUE OF AN IRRATIONAL NUMBER, INCLUDING π AND SQUARE ROOTS OF NUMBERS LESS THAN 225Including, but not limited to:
Irrational numbers – the set of numbers that cannot be expressed as a fraction , where a and b are integers and b ≠ 0o Rational number approximations of irrational numbers to the appropriate place value for context of mathematical and real-world
problem situations

Grade 8
o Approximation symbol (≈)
o Ex: Pi (π) ≈ ≈ 3.14 Square root – a factor of a number that, when squared, equals the original number
o Radical symbol ( )
represents the principal square root of x, the positive square root
represents the opposite of the principal square root of x, the negative square root Rational number approximations (-15 < x < 15) of square roots less than 225
Whole numbers Decimals (greater than or less than 1) Fractions (proper, improper, and mixed numbers)
Verify rational number approximations of irrational numbers with a calculator Relationship between rational number approximations of perfect squares and irrational numbers
o Perfect squares of consecutive integerso Ex:
Ex:

Grade 8
Ex:
LocateRATIONAL NUMBER APPROXIMATIONS OF IRRATIONAL NUMBERS ON A NUMBER LINEIncluding, but not limited to:
Rational numbers – the set of numbers that can be expressed as a fraction , where a and b are integers and b ≠ 0, which includes the
subsets of integers, whole numbers, and counting (natural) numbers (e.g., -3, 0, 2, etc.). The set of rational numbers is denoted by the symbol Q.
Irrational numbers – the set of numbers that cannot be expressed as a fraction , where a and b are integers and b ≠ 0

Grade 8
All rational number approximations of irrational numbers can be located on a number line.o Characteristics of a number line
A number line begins as a line with predetermined intervals (or tick marks) with positions/numbers labeled.
o A minimum of two positions/numbers should be labeled. Numbers on a number line represent the distance from zero. The distance between the tick marks is counted rather than the tick marks themselves. The placement of the labeled positions/numbers on a number line determines the scale of the number line.
o Intervals between position/numbers are proportional. When reasoning on a number line, the position of zero may or may not be placed. When working with larger numbers, a number line without the constraint of distance from zero allows the ability to “zoom-in”
on the relevant section of the number line. Number lines extend infinitely in both directions (arrows indicate the number line continues infinitely). Numbers increase from left to right on a horizontal number line and from bottom to top on a vertical number line.
o Points to the left of a specified point on a horizontal number line are less than points to the right.o Points to the right of a specified point on a horizontal number line are greater than points to the left.o Points below a specified point on a vertical number line are less than points above.o Points above a specified point on a vertical number line are greater than points below.
Ex: Proportional number line (pre-determined intervals with at least two labeled numbers.
Characteristics of an open number line
o An open number line begins as a line with no intervals (or tick marks) and no positions/numbers labeled.o Numbers/positions are placed on the empty number line only as they are needed.

Grade 8
o When reasoning on an open number line, the position of zero is often not placed.
When working with larger numbers, an open number line without the constraint of distance from zero allows the ability to “zoom-in” on the relevant section of the number line.
o The placement of the first two numbers on an open number line determines the scale of the number line. Once the scale of the number line has been established by the placement of the first two numbers, intervals between
additional numbers placed are approximately proportional.o The differences between numbers are approximated by the distance between the positions on the number line.o Open number lines extend infinitely in both directions (arrows indicate the number line continues infinitely).o Numbers increase from left to right on a horizontal number line and from bottom to top on a vertical number line.
Points to the left of a specified point on a horizontal number line are less than points to the right. Points to the right of a specified point on a horizontal number line are greater than points to the left.
o Landmark (or anchor) numbers may be placed on the open number line to help locate other numbers.o Ex: Open number lines (with no marked intervals)
Rational number approximations of irrational numbers
Ex: Pi (π) ≈ ≈ 3.14
Rational number approximations (-15 < x < 15) of square roots less than 225
Whole numbers Decimals (greater than or less than 1) Fractions (proper, improper, and mixed numbers)
Verify rational number approximations of irrational numbers with a calculator Relationship between rational number approximations of perfect squares and irrational numbers
Perfect squares of consecutive integers Ex:

Grade 8
Ex:
Ex:

Grade 8
Note(s):
Grade Level(s):o Grade 8 introduces approximating the value of an irrational number, including π and square roots of numbers less than 225, and
locate that rational number approximation on a number line.o Various mathematical process standards will be applied to this student expectation as appropriate.
TxRCFP:o Grade Level Connections (reinforces previous learning and/or provides development for future learning)
TxCCRS:o I. Numeric Reasoningo IX. Communication and Representation

Grade 8
8.2C Convert between standard decimal notation and scientific notation.
Supporting StandardConvert between standard decimal notation and scientific notation.
Supporting StandardConvertBETWEEN STANDARD DECIMAL NOTATION AND SCIENTIFIC NOTATIONIncluding, but not limited to:
Decimal notation – a representation of a real number, not including counting (natural) numbers, which uses a decimal point to show place values that are less than one, such as tenths and hundredths (e.g., 0.023, etc.)
Scientific notation – a representation of a number by using a method to write very large or very small numbers using powers of ten that is written as a decimal with exactly one nonzero digit to the left of the decimal point, multiplied by a power of ten (e.g., 2.3 x 10 -2, etc.)
Ex:
Powers – denoted by a number or variable in the superscript place of the base which designates how many times the base will be multiplied by itself if it is positive, or by its inverse if it is negative. If the power is 1, the base will be multiplied by 1 and simplified will not change. If the power is 0, the simplified form will equal 1.
Ex:
Base – the number in an expression or equation which is raised to a power or exponent

Grade 8
E – a symbol used in a calculator to indicate that the preceding number should be multiplied by ten raised to the number that follows
Ex:
Relationship between place value and scientific notation
Format of scientific notationo Powers of 10
Positive or negative integer exponents
o Negative exponents move the decimal to the left the same number of places as the absolute value of the exponent.o Positive exponents move the decimal to the right the same number of places as the exponent.
o Positive or negative decimal with exactly one nonzero digit to the left of the decimal point
o Ex:

Grade 8
Multiplicative identity
Ex: 1 x 10⁻⁷ can be written as 10-7
Decimal notation to scientific notation and vice versa Ex:

Grade 8
Note(s):

Grade 8
Grade Level(s):o Grade 8 introduces converting between standard decimal notation and scientific notation.o Various mathematical process standards will be applied to this student expectation as appropriate.
TxRCFP:o Grade Level Connections (reinforces previous learning and/or provides development for future learning)
TxCCRS:o I. Numeric Reasoningo IX. Communication and Representation
8.2D Order a set of real numbers arising from mathematical and real-world contexts.
Readiness StandardOrder a set of real numbers arising from mathematical and real-world contexts.
Readiness StandardOrderA SET OF REAL NUMBERS ARISING FROM MATHEMATICAL AND REAL-WORLD CONTEXTSIncluding, but not limited to:
Real numbers – the set of rational and irrational numbers. The set of real numbers is denoted by the symbol R. Counting (natural) numbers – the set of positive numbers that begins at one and increases by increments of one each time {1, 2, 3, ..., n} Whole numbers – the set of counting (natural) numbers and zero {0, 1, 2, 3, ..., n} Integers – the set of counting (natural numbers), their opposites, and zero {-n, …, -3, -2, -1, 0, 1, 2, 3, ..., n}. The set of integers is denoted by
the symbol Z.
Rational numbers – the set of numbers that can be expressed as a fraction , where a and b are integers and b ≠ 0, which includes the
subsets of integers, whole numbers, and counting (natural) numbers (e.g., -3, 0, 2, etc.). The set of rational numbers is denoted by the symbol Q.
Irrational numbers – the set of numbers that cannot be expressed as a fraction , where a and b are integers and b ≠ 0 Various forms of real numbers
o Whole numbers

Grade 8
o Integerso Decimals (positive or negative values less than or greater than one)o Fractions (positive or negative proper, improper, and mixed numbers)o Irrational numbers (positive or negative)
Place value – the value of a digit as determined by its location in a number such as ones, tens, hundreds, one thousands, ten thousands, etc. Order numbers – to arrange a set of numbers based on their numerical value Number lines (horizontal/vertical) Numbers increase from left to right on a horizontal number line and from bottom to top on a vertical number line.
o Points to the left of a specified point on a horizontal number line are less than points to the right.o Points to the right of a specified point on a horizontal number line are greater than points to the left.o Points below a specified point on a vertical number line are less than points above.o Points above a specified point on a vertical number line are greater than points below.
Quantifying descriptor in mathematical and real-world problem situations (e.g., between two given numbers, greatest/least, ascending/descending, tallest/shortest, warmest/coldest, fastest/slowest, longest/shortest, heaviest/lightest, closest/farthest, oldest/youngest, etc.)
Ex:
Ex:
Note(s):
Grade Level(s):

Grade 8
o Grade 6 ordered a set of rational numbers arising from mathematical and real-world contexts.o Grade 8 introduces ordering a set of real numbers arising from mathematical and real-world contexts.o Various mathematical process standards will be applied to this student expectation as appropriate.
TxRCFP:o Grade Level Connections (reinforces previous learning and/or provides development for future learning)
TxCCRS:o I. Numeric Reasoningo IX. Communication and Representationo X. Connections
8.3 Proportionality. The student applies mathematical process standards to use proportional relationships to describe dilations. The student is expected to:
8.3A Generalize that the ratio of corresponding sides of similar shapes are proportional, including a shape and its dilation.
Supporting StandardGeneralize that the ratio of corresponding sides of similar shapes are proportional, including a shape and its dilation.
Supporting StandardGeneralizeTHAT THE RATIO OF CORRESPONDING SIDES OF SIMILAR SHAPES ARE PROPORTIONAL, INCLUDING A SHAPE AND ITS DILATIONIncluding, but not limited to:
Congruent – of equal measure, having exactly the same size and same shape Similar shapes – shapes whose angles are congruent and side lengths are proportional (equal scale factor)
o The order of the letters determines corresponding side lengths and angles. Attributes of similar shapes
o Corresponding sides are proportional.o Corresponding angles are congruent.
Notation for similar shapeso Symbol for similarity (~) read as “similar to”

Grade 8
o Ex: ABCD ~ A'B'C'D' Prime notation of image points
o Prime markso Ex: ABCD is the original figure or pre-image and A’B’C’D’ is the name of the image. A’B’C’D’ is read as “A prime, B prime, C
prime, D prime”.o Multiple prime marks
o Ex: ABCD can have a translated image named (e.g., A’’B’’C’’D’’, A’’’B’’’C’’’D’’’, etc.) A’’B’’C’’D’’ is read as “A double-prime, B double-prime, C double-prime, D double-prime” and A’’’B’’’C’’’D’’’ is read as “A triple-prime, B triple-prime, C triple-prime, D triple-prime”.
Generalizations of similarityo The ratio of corresponding sides of similar shapes is proportional.
o Ex: is proportional to when the scale factor of 2 is appliedo Ratios comparing lengths within each shape or between shapes will determine if the shapes are similar.
o Ex:
The reciprocal of the ratio of one side of a figure to the corresponding side of a proportional figure is the scale factor, which represents the change in the size of the figures.
Dilation – a transformation in which an image is enlarged or reduced, depending on the scale factor, in such a way that the angles of the original figure are congruent and the sides proportional so that the image is similar to the original; orientation is maintained to the original figure while congruence is only maintained for a scale factor of 1
o Enlargements (scale factor >1)

Grade 8
o Reduction (scale factor < 1)o Congruent (scale factor = 1)o Ex:
Note(s):
Grade Level(s):o Grade 8 introduces generalizing that the ratio of corresponding sides of similar shapes are proportional, including a shape and its
dilation.o Various mathematical process standards will be applied to this student expectation as appropriate.
TxRCFP:o Representing, applying, and analyzing proportional relationships
TxCCRS:o III.C. Geometric Reasoning – Connections between geometry and other mathematical content strandso IV. Measurement Reasoningo VIII. Problem Solving and Reasoningo IX. Communication and Representationo X. Connections
8.3B Compare and contrast the attributes of a shape and its dilation(s) on a coordinate plane.

Grade 8
Supporting StandardCompare and contrast the attributes of a shape and its dilation(s) on a coordinate plane.
Supporting StandardCompare, ContrastTHE ATTRIBUTES OF A SHAPE AND ITS DILATION(S) ON A COORDINATE PLANEIncluding, but not limited to:
Dilation – a transformation in which an image is enlarged or reduced, depending on the scale factor, in such a way that the angles of the original figure are congruent and the sides proportional so that the image is similar to the original; orientation is maintained to the original figure while congruence is only maintained for a scale factor of 1
o Enlargements (scale factor >1)o Reduction (scale factor < 1)o Congruent (scale factor = 1)
Prime notation of image pointso Prime marks
o Ex: ABCD is the original figure or pre-image and A’B’C’D’ is the name of the image. A’B’C’D’ is read as “A prime, B prime, C prime, D prime”.
o Multiple prime markso Ex: ABCD can have a translated image named (e.g., A’’B’’C’’D’’, A’’’B’’’C’’’D’’’, etc.) A’’B’’C’’D’’ is read as “A double-prime, B
double-prime, C double-prime, D double-prime” and A’’’B’’’C’’’D’’’ is read as “A triple-prime, B triple-prime, C triple-prime, D triple-prime”.
Coordinate plane (all four quadrants)o Origin as center of dilation
Enlargement (scale factor > 1)
Ex: Quadrilateral ABCD is dilated about the origin to create A’B’C’D’.

Grade 8
Reduction (0 < scale factor < 1)
Ex: Quadrilateral ABCD is dilated about the origin to create A’B’C’D’.

Grade 8
Congruent (scale factor = 1)
Point as center of dilation Enlargement (scale factor > 1)
Ex: Quadrilateral ABCD is dilated about Point A to create A’B’C’D’.

Grade 8
Reduction (0 < scale factor < 1)
Ex: Quadrilateral ABCD is dilated about Point A to create A’B’C’D’.

Grade 8
Congruent (scale factor = 1) Similar shapes – shapes whose angles are congruent and side lengths are proportional (equal scale factor)
The order of the letters determines corresponding side lengths and angles. Attributes of similar shapes
o Corresponding sides are proportional.o Corresponding angles are congruent.
Notation for similar shapeso Symbol for similarity (~) read as “similar to”
o Ex: ABCD ~ A’B’C’D’ Generalizations of similarity
o Ratios comparing lengths within each shape or between shapes will determine if the shapes are similar.
Note(s):
Grade Level(s):o Grade 8 introduces comparing and contrasting the attributes of a shape and its dilation(s) on a coordinate plane.

Grade 8
o Various mathematical process standards will be applied to this student expectation as appropriate. TxRCFP:
o Representing, applying, and analyzing proportional relationships TxCCRS:
o III.C. Geometric Reasoning – Connections between geometry and other mathematical content strandso VIII. Problem Solving and Reasoningo IX. Communication and Representationo X. Connections
8.3C Use an algebraic representation to explain the effect of a given positive rational scale factor applied to two-dimensional figures on a
coordinate plane with the origin as the center of dilation.
Readiness StandardUse an algebraic representation to explain the effect of a given positive rational scale factor applied to two-dimensional figures on a
coordinate plane with the origin as the center of dilation.
Readiness StandardUseAN ALGEBRAIC REPRESENTATION TO EXPLAIN THE EFFECT OF A GIVEN POSITIVE RATIONAL SCALE FACTOR APPLIED TO TWO-DIMENSIONAL FIGURES ON A COORDINATE PLANE WITH THE ORIGIN AS THE CENTER OF DILATIONIncluding, but not limited to:
Positive rational numbers – the set of numbers that can be expressed as a fraction , where a and b are whole numbers and b ≠ 0, which
includes the subsets of whole numbers and counting (natural) numbers (e.g., 0, 2, etc.). Various forms of positive rational numbers
o Whole numberso Decimals (less than or greater than one)o Fractions (proper, improper, and mixed numbers)o Percents converted to equivalent decimals or fractions for multiplying or dividing fluently
Scale factor – the common multiplicative ratio between pairs of related data which may be represented as a unit rateo Dilation – a transformation in which an image is enlarged or reduced, depending on the scale factor, in such a way that the angles of

Grade 8
the original figure are congruent and the sides proportional so that the image is similar to the original; orientation is maintained to the original figure while congruence is only maintained for a scale factor of 1
o Enlargements (scale factor >1)o Reduction (scale factor < 1)o Congruent (scale factor = 1)
Coordinate plane (all four quadrants)o Origin as center of dilation
Algebraic representation to describe effects of dilationso (x, y) → (ax, ay), where a is the scale factor used to dilate a figure about the origin
Various representations of dilationso Verbalo Graphicalo Tabularo Algebraico Ex:
Ex:

Grade 8
Note(s):
Grade Level(s):o Grade 8 introduces using an algebraic representation to explain the effect of a given positive rational scale factor applied to two-
dimensional figures on a coordinate plane with the origin as the center of dilation.o Various mathematical process standards will be applied to this student expectation as appropriate.
TxRCFP:o Representing, applying, and analyzing proportional relationships
TxCCRS:o II. Algebraic Reasoningo III.C. Geometric Reasoning – Connections between geometry and other mathematical content strandso IV. Measurement Reasoningo VIII. Problem Solving and Reasoningo IX. Communication and Representationo X. Connections
8.4 Proportionality. The student applies mathematical process standards to explain proportional and non-proportional relationships involving slope. The student is expected to:
8.4A Use similar right triangles to develop an understanding that slope, m, given as the rate comparing the change in y-values to the change in

Grade 8
x-values, (y2 - y1)/ (x2 - x1), is the same for any two points (x1, y1) and (x2, y2) on the same line.
Supporting StandardUse similar right triangles to develop an understanding that slope, m, given as the rate comparing the change in y-values to the change in
x-values, (y2 - y1)/ (x2 - x1), is the same for any two points (x1, y1) and (x2, y2) on the same line.
Supporting StandardUseSIMILAR RIGHT TRIANGLES TO DEVELOP AN UNDERSTANDING THAT SLOPE, m, GIVEN AS THE RATE COMPARING THE CHANGE IN y-
VALUES TO THE CHANGE IN x-VALUES, , IS THE SAME FOR ANY TWO POINTS (x1, y1) AND (x2, y2) ON THE SAME LINEIncluding, but not limited to:
Rate – a multiplicative comparison of two different quantities where the measuring unit is different for each quantity Similar shapes – shapes whose angles are congruent and side lengths are proportional (equal scale factor)
o The order of the letters determines corresponding side lengths and angles. Attributes of similar shapes
o Corresponding sides are proportional.o Corresponding angles are congruent.
Notation for similar shapeso Symbol for similarity (~) read as “similar to”
o Ex: ABCD ~ A’B’C’D’ Generalizations of similarity
o The ratio of corresponding sides of similar shapes is proportional.
o Ex: is proportional to when the scale factor of 2 is appliedo Ratios comparing lengths within each shape or between shapes will determine if the shapes are similar.
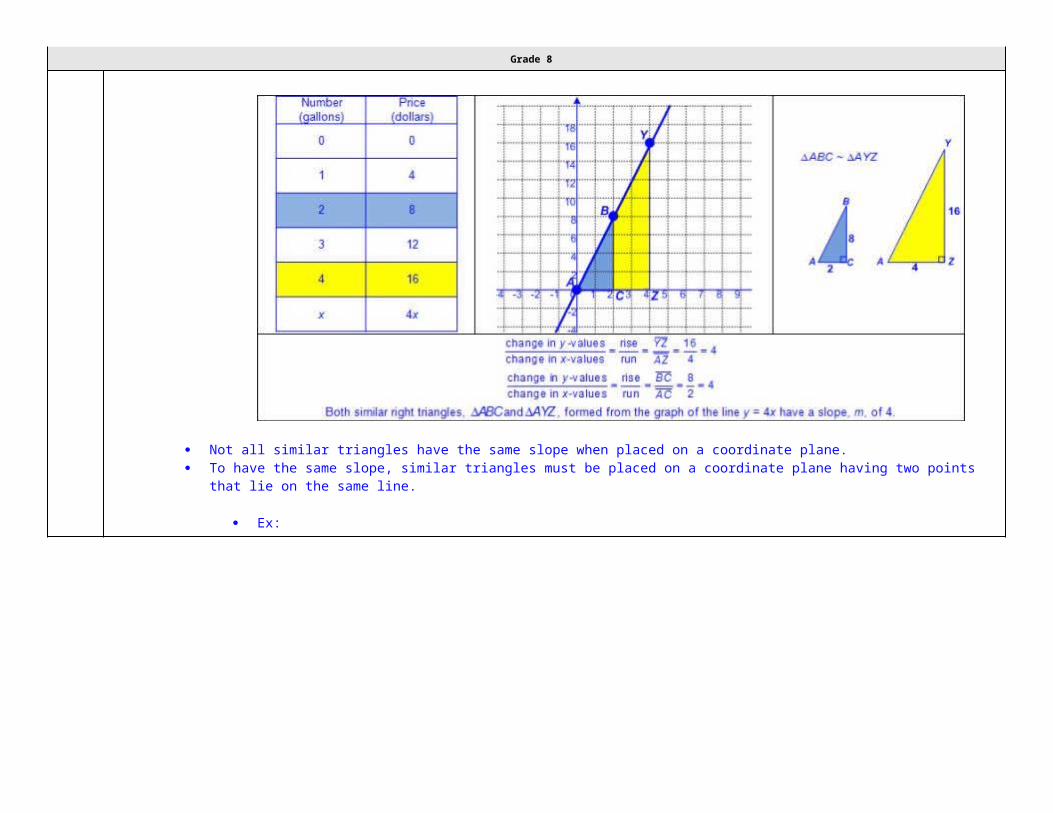
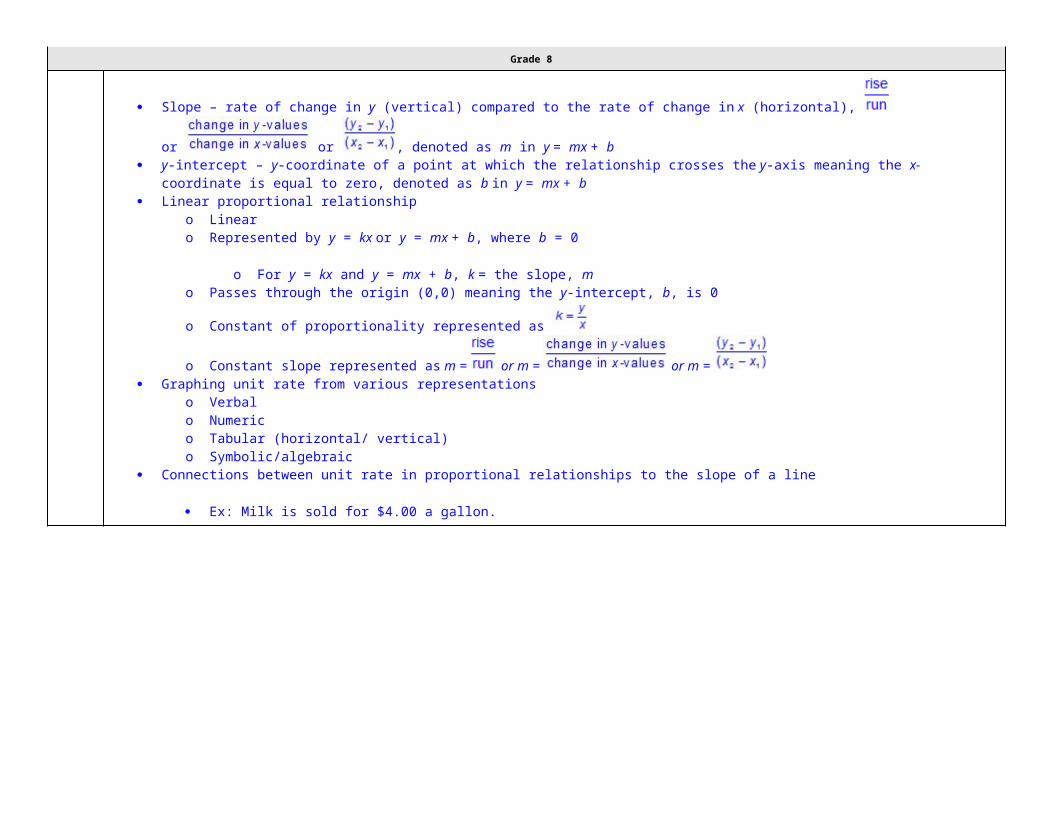
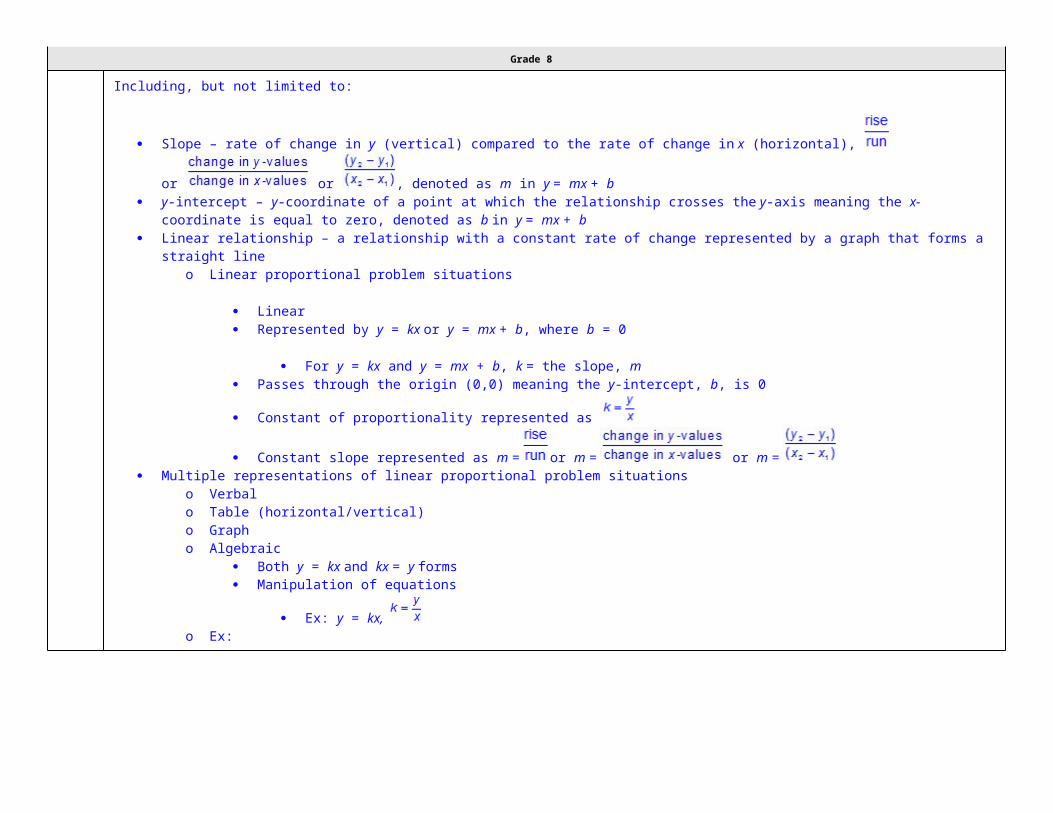
Slope – rate of change in y (vertical) compared to the rate of change in x (horizontal), or or , denoted as m in y = mx + b
o Slope is either positive, negative, zero, or undefined.o Ex:

Grade 8
Connections between similar right triangles and slopeo A right triangle can be formed from any two points on a line by drawing a vertical line from one point and a horizontal line from the
other point until the lines intersect.
o Ex:
Slope of a right triangle is determined between the two vertices not forming the right angle.
Ex: Milk is sold for $4.00 a gallon.

Grade 8
Not all similar triangles have the same slope when placed on a coordinate plane. To have the same slope, similar triangles must be placed on a coordinate plane having two points that lie on the same line.
Ex:

Grade 8
Grade 8
Note(s):
Grade Level(s):o Algebra 1 will determine the slope of a line given a table of values, a graph, two points on the line, and an equation written in various
forms, including y = mx + b, Ax + By = C, and y – y1= m(x – x1).o Various mathematical process standards will be applied to this student expectation as appropriate.
TxRCFP:o Representing, applying, and analyzing proportional relationships
TxCCRS:o I. Numeric Reasoningo II. Algebraic Reasoningo III.C. Geometric Reasoning – Connections between geometry and other mathematical content strandso VIII. Problem Solving and Reasoningo IX. Communication and Representationo X. Connections
8.4B Graph proportional relationships, interpreting the unit rate as the slope of the line that models the relationship.
Readiness StandardGraph proportional relationships, interpreting the unit rate as the slope of the line that models the relationship.
Readiness StandardGraphPROPORTIONAL RELATIONSHIPS, INTERPRETING THE UNIT RATE AS THE SLOPE OF THE LINE THAT MODELS THE RELATIONSHIPIncluding, but not limited to:
Unit rate – a ratio between two different units where one of the terms is 1
Slope – rate of change in y (vertical) compared to the rate of change in x (horizontal), or or , denoted as m in y = mx + b
y-intercept – y-coordinate of a point at which the relationship crosses the y-axis meaning the x-coordinate is equal to zero, denoted as b in y = mx + b

Grade 8
Linear proportional relationshipo Linearo Represented by y = kx or y = mx + b, where b = 0
o For y = kx and y = mx + b, k = the slope, mo Passes through the origin (0,0) meaning the y-intercept, b, is 0
o Constant of proportionality represented as
o Constant slope represented as m = or m = or m = Graphing unit rate from various representations
o Verbalo Numerico Tabular (horizontal/ vertical)o Symbolic/algebraic
Connections between unit rate in proportional relationships to the slope of a line
Ex: Milk is sold for $4.00 a gallon.
Grade 8
Note(s):
Grade Level(s):o Algebra 1 will calculate the rate of change of a linear function represented tabularly, graphically, or algebraically in context of
mathematical and real-world problems.o Various mathematical process standards will be applied to this student expectation as appropriate.
TxRCFP:o Representing, applying, and analyzing proportional relationships
TxCCRS:o I. Numeric Reasoning

Grade 8
o II. Algebraic Reasoningo VIII. Problem Solving and Reasoningo IX. Communication and Representationo X. Connections
8.4C Use data from a table or graph to determine the rate of change or slope and y-intercept in mathematical and real-world problems.
Readiness StandardUse data from a table or graph to determine the rate of change or slope and y-intercept in mathematical and real-world problems.
Readiness StandardUseDATA FROM A TABLE OR GRAPH TO DETERMINE THE RATE OF CHANGE OR SLOPE AND y-INTERCEPT IN MATHEMATICAL AND REAL-WORLD PROBLEMSIncluding, but not limited to:
Slope – rate of change in y (vertical) compared to the rate of change in x (horizontal), or or , denoted as m in y = mx + b
Determining rate of change or slope from various representationso Table (horizontal/vertical)o Graph
Connections between unit rate, rate of change, and slope in mathematical and real-world problems
Ex:

Grade 8
y-intercept – y-coordinate of a point at which the relationship crosses the y-axis meaning the x-coordinate is equal to zero, denoted as b in y = mx + b
Determining y-intercept from various representationso Table (horizontal/vertical)o Graph
Connections between the “starting point” (the output value when the input value is 0) and y-intercept in mathematical and real-world problem situations
Ex:
Grade 8
Linear proportional relationshipo Linearo Represented by y = kx or y = mx + b, where b = 0
o For y = kx and y = mx + b, k = the slope, mo Passes through the origin (0,0) meaning the y-intercept, b, is 0
o Constant of proportionality represented as
o Constant slope represented as m = or m = or m = Linear non-proportional relationship
o Linearo Represented by y = mx + b, where b ≠ 0o Does not pass through the origin (0,0) meaning the y-intercept, b, is not 0

Grade 8
o Constant slope represented as m = or m = or m =
Note(s):
Grade Level(s):o Algebra 1 will calculate the rate of change of a linear function represented tabularly, graphically, or algebraically in context of
mathematical and real-world problems.o Algebra 1 will graph linear functions on the coordinate plane and identify key features, including x-intercept, y-intercept, zeros, and
slope, in mathematical and real-world problems.o Various mathematical process standards will be applied to this student expectation as appropriate.
TxRCFP:o Representing, applying, and analyzing proportional relationships
TxCCRS:o I. Numeric Reasoningo II. Algebraic Reasoningo VIII. Problem Solving and Reasoningo IX. Communication and Representationo X. Connections
8.5 Proportionality. The student applies mathematical process standards to use proportional and non-proportional relationships to develop foundational concepts of functions. The student is expected to:
8.5A Represent linear proportional situations with tables, graphs, and equations in the form of y = kx.
Supporting StandardRepresent linear proportional situations with tables, graphs, and equations in the form of y = kx.
Supporting StandardRepresentLINEAR PROPORTIONAL SITUATIONS WITH TABLES, GRAPHS, AND EQUATIONS IN THE FORM OF y = kx

Grade 8
Including, but not limited to:
Slope – rate of change in y (vertical) compared to the rate of change in x (horizontal), or or , denoted as m in y = mx + b
y-intercept – y-coordinate of a point at which the relationship crosses the y-axis meaning the x-coordinate is equal to zero, denoted as b in y = mx + b
Linear relationship – a relationship with a constant rate of change represented by a graph that forms a straight lineo Linear proportional problem situations
Linear Represented by y = kx or y = mx + b, where b = 0
For y = kx and y = mx + b, k = the slope, m Passes through the origin (0,0) meaning the y-intercept, b, is 0
Constant of proportionality represented as
Constant slope represented as m = or m = or m = Multiple representations of linear proportional problem situations
o Verbalo Table (horizontal/vertical)o Grapho Algebraic
Both y = kx and kx = y forms Manipulation of equations
Ex: y = kx, o Ex:

Grade 8
Note(s):
Grade Level(s):o Grade 7 represented constant rates of change in mathematical and real-world problems given pictorial, tabular, verbal, numeric,
graphical, and algebraic representations, including d = rt.

Grade 8
o Algebra 1 will write and solve equations involving direct variation.o Various mathematical process standards will be applied to this student expectation as appropriate.
TxRCFP:o Representing, applying, and analyzing proportional relationships
TxCCRS:o I. Numeric Reasoningo II. Algebraic Reasoningo VIII. Problem Solving and Reasoningo IX. Communication and Representationo X. Connections
8.5B Represent linear non-proportional situations with tables, graphs, and equations in the form of y = mx + b, where b ≠ 0.
Supporting StandardRepresent linear non-proportional situations with tables, graphs, and equations in the form of y = mx + b, where b ≠ 0.
Supporting StandardRepresentLINEAR NON-PROPORTIONAL SITUATIONS WITH TABLES, GRAPHS, AND EQUATIONS IN THE FORM OF y = mx + b, WHERE b ≠ 0Including, but not limited to:
Slope – rate of change in y (vertical) compared to the rate of change in x (horizontal), or or , denoted as m in y = mx + b
y-intercept – y-coordinate of a point at which the relationship crosses the y-axis meaning the x-coordinate is equal to zero, denoted as b in y = mx + b
Linear relationship – a relationship with a constant rate of change represented by a graph that forms a straight lineo Linear non-proportional problem situations
Linear Represented by y = mx + b, where b ≠ 0 Does not pass through the origin (0,0) meaning the y-intercept, b, is not 0

Grade 8
Constant slope represented as m = or m = or m = Multiple representations of linear non-proportional problem situations
o Verbalo Table (horizontal/vertical)o Grapho Algebraic
Both y =mx + b and mx + b = y forms Manipulation of equations
Ex: y = mx + b, o Ex:
Grade 8
Note(s):
Grade Level(s):o Grade 7 represented linear relationships using verbal descriptions, tables, graphs, and equations that simplify to the form y = mx + b.
Grade 8
o Algebra 1 will write linear equations in two variables in various forms, including y = mx + b, Ax + By = C, and y - y1 = m(x - x1), given one point and the slope and given two points.
o Various mathematical process standards will be applied to this student expectation as appropriate. TxRCFP:
o Representing, applying, and analyzing proportional relationships TxCCRS:
o I. Numeric Reasoningo II. Algebraic Reasoningo VIII. Problem Solving and Reasoningo IX. Communication and Representation
8.5C Contrast bivariate sets of data that suggest a linear relationship with bivariate sets of data that do not suggest a linear relationship from a
graphical representation.
Supporting StandardContrast bivariate sets of data that suggest a linear relationship with bivariate sets of data that do not suggest a linear relationship from a
graphical representation.
Supporting StandardContrastBIVARIATE SETS OF DATA THAT SUGGEST A LINEAR RELATIONSHIP WITH BIVARIATE SETS OF DATA THAT DO NOT SUGGEST A LINEAR RELATIONSHIP FROM A GRAPHICAL REPRESENTATIONIncluding, but not limited to:
Data – information that is collected about people, events, or objects Bivariate data – data relating two quantitative variables that can be represented by a scatterplot Discrete data – data with finite and distinct values, no inclusive of in-between values Scatterplot – a graphical representation used to display the relationship between discrete data pairs
o Characteristics of a scatterplot
Title clarifies the meaning of the data represented. Subtitles clarify the meaning of data represented on each axis.

Grade 8
Numerical data represented with labels may be whole numbers, fractions, or decimals. Points are not connected by a line. Scale of the axes may be intervals of one or more, and scale intervals are proportionally displayed.
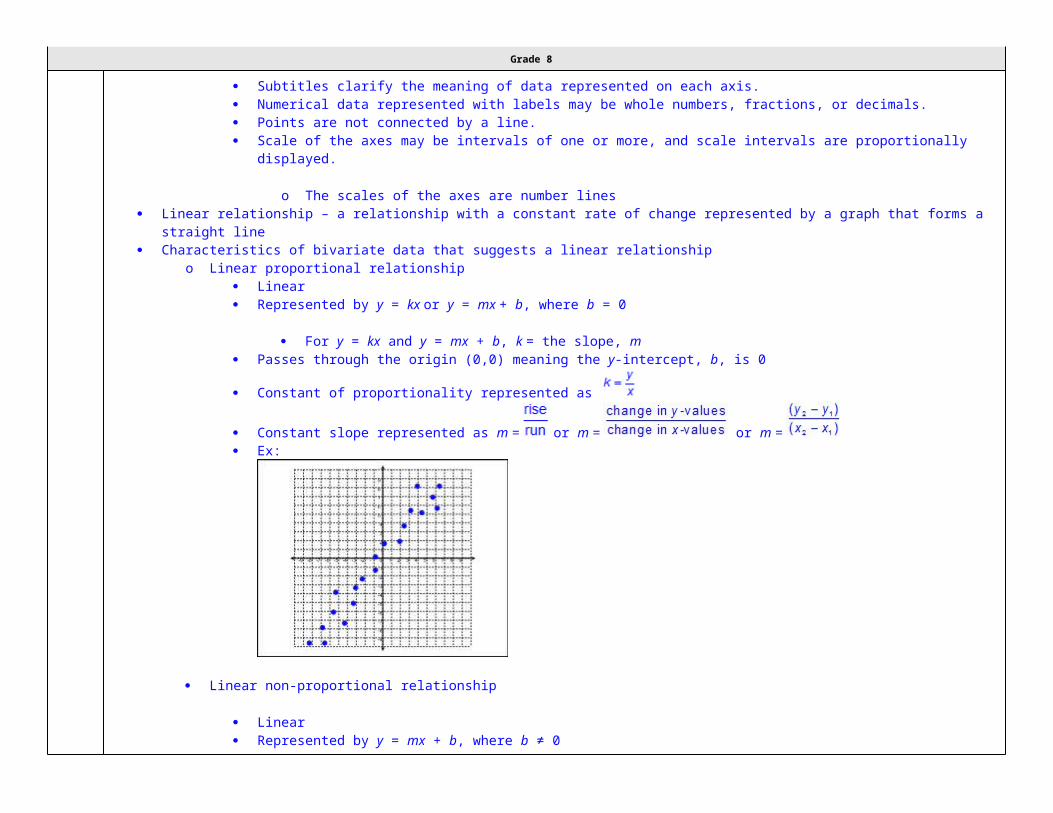
o The scales of the axes are number lines Linear relationship – a relationship with a constant rate of change represented by a graph that forms a straight line Characteristics of bivariate data that suggests a linear relationship
o Linear proportional relationship Linear Represented by y = kx or y = mx + b, where b = 0
For y = kx and y = mx + b, k = the slope, m Passes through the origin (0,0) meaning the y-intercept, b, is 0
Constant of proportionality represented as
Constant slope represented as m = or m = or m = Ex:
Linear non-proportional relationship
Linear Represented by y = mx + b, where b ≠ 0 Does not pass through the origin (0,0) meaning the y-intercept, b, is not 0
Constant slope represented as m = or m = or m =

Grade 8
Ex:
Characteristics of bivariate data that does not suggest a linear relationshipo Not linearo Not represented by y = kx or y = mx + bo No constant slopeo May or may not cross the origin (0,0)o Ex:
Note(s):
Grade Level(s):o Grade 8 introduces contrasting bivariate sets of data that suggest a linear relationship with bivariate sets of data that do not suggest a
linear relationship from a graphical representation.o Algebra 1 will calculate, using technology, the correlation coefficient between two quantitative variables and interpret this quantity as

Grade 8
a measure of the strength of the linear association.o Various mathematical process standards will be applied to this student expectation as appropriate.
TxRCFP:o Representing, applying, and analyzing proportional relationships
TxCCRS:o II. Algebraic Reasoningo VI. Statistical Reasoningo VIII. Problem Solving and Reasoningo IX. Communication and Representation
8.5D Use a trend line that approximates the linear relationship between bivariate sets of data to make predictions.
Readiness StandardUse a trend line that approximates the linear relationship between bivariate sets of data to make predictions.
Readiness StandardUseA TREND LINE THAT APPROXIMATES THE LINEAR RELATIONSHIP BETWEEN BIVARIATE SETS OF DATA TO MAKE PREDICTIONSIncluding, but not limited to:
Bivariate data – data relating two quantitative variables that can be represented by a scatterplot Characteristics of bivariate data that suggests a linear relationship
o Linear proportional relationship
Linear Represented by y = kx or y = mx + b, where b = 0
For y = kx and y = mx + b, k = the slope, m Passes through the origin (0,0) meaning the y-intercept, b, is 0
Constant of proportionality represented as
Constant slope represented as m = or m = or m =

Grade 8
Ex:
Linear non-proportional relationship
Linear Represented by y = mx + b, where b ≠ 0 Does not pass through the origin (0,0) meaning the y-intercept, b, is not 0
Constant slope represented m = or m = or m = Ex:
Graph of data suggests a constant rate of change between the independent and dependent valueso Trend line – the line that best fits the data points of a scatterploto Ex:
Grade 8
Given or collected data Analysis of parts of data representation
o Titleo Labelso Scaleso Graphed data
Predictions of independent value when given a dependent value using a trend line that approximates the linear relationship Predictions of dependent value when given an independent value using a trend line that approximates the linear relationship
Note(s):
Grade Level(s):o Grade 8 introduces using a trend line that approximates the linear relationship between bivariate sets of data to make predictions.o Algebra 1 will calculate, using technology, the correlation coefficient between two quantitative variables and interpret this quantity as
a measure of the strength of the linear association.o Various mathematical process standards will be applied to this student expectation as appropriate.
TxRCFP:o Representing, applying, and analyzing proportional relationships
TxCCRS:o II. Algebraic Reasoningo VI. Statistical Reasoningo VIII. Problem Solving and Reasoningo IX. Communication and Representation

Grade 8
8.5E Solve problems involving direct variation.
Supporting StandardSolve problems involving direct variation.
Supporting StandardSolvePROBLEMS INVOLVING DIRECT VARIATIONIncluding, but not limited to:
Direct variation – a linear relationship between two variables, x (independent) and y (dependent), that always has a constant unchanged ratio, k, and can be represented by y = kx
Slope – rate of change in y (vertical) compared to the rate of change in x (horizontal), or or , denoted as m in y = mx + b
y-intercept – y-coordinate of a point at which the relationship crosses the y-axis meaning the x-coordinate is equal to zero, denoted as b in y = mx + b
Linear relationship – a relationship with a constant rate of change represented by a graph that forms a straight lineo Direct variation
Linear Represented by y = kx or y = mx + b, where b = 0
For y = kx and y = mx + b, k = the slope, m Passes through the origin (0,0) meaning the y-intercept, b, is 0
Constant of proportionality or variation represented as
Constant slope represented as m = or m = or m = Various solution methods for solving problems involving direct variation
o Table (horizontal/vertical)o Grapho Algebraico Ex:

Grade 8
Note(s):
Grade Level(s):
o Grade 7 determined the constant of proportionality ( ) within mathematical and real-world problems.o Algebra 1 will write and solve equations involving direct variation.o Various mathematical process standards will be applied to this student expectation as appropriate.
TxRCFP:o Representing, applying, and analyzing proportional relationships.
TxCCRS:o I. Numeric Reasoningo II. Algebraic Reasoningo VIII. Problem Solving and Reasoningo IX. Communication and Representation

Grade 8
8.5F Distinguish between proportional and non-proportional situations using tables, graphs, and equations in the form y = kx or y = mx + b,
where b ≠ 0.
Supporting StandardDistinguish between proportional and non-proportional situations using tables, graphs, and equations in the form y = kx or y = mx + b,
where b ≠ 0.
Supporting StandardDistinguishBETWEEN PROPORTIONAL AND NON-PROPORTIONAL SITUATIONS USING TABLES, GRAPHS, AND EQUATIONS IN THE FORM y = kx OR y = mx + b, WHERE b ≠ 0Including, but not limited to:
Slope – rate of change in y (vertical) compared to the rate of change in x (horizontal), or or , denoted as m in y = mx + b
y-intercept – y-coordinate of a point at which the relationship crosses the y-axis meaning the x-coordinate is equal to zero, denoted as b in y = mx + b
Linear relationship – a relationship with a constant rate of change represented by a graph that forms a straight lineo Linear proportional relationship
Linear Represented by y = kx or y = mx + b, where b = 0
For y = kx and y = mx + b, k = the slope, m Passes through the origin (0,0) meaning the y-intercept, b, is 0
Constant of proportionality represented as
Constant slope represented as m = or m = or m = o Linear non-proportional relationship
Linear

Grade 8
Represented by y = mx + b, where b ≠ 0 Does not pass through the origin (0,0) meaning the y-intercept, b, is not 0
Constant slope represented as m = or m = or m = Various representations
o Table (horizontal/vertical)
o Ex:
Graph
Ex:

Grade 8

Grade 8
8.5G Identify functions using sets of ordered pairs, tables, mappings, and graphs.
Readiness StandardIdentify functions using sets of ordered pairs, tables, mappings, and graphs.
Readiness StandardIdentifyFUNCTIONS USING SETS OF ORDERED PAIRS, TABLES, MAPPINGS, AND GRAPHSIncluding, but not limited to:
Function – relation in which each element of the input (x) is paired with exactly one element of the output (y) Various representations
o Sets of ordered pairs
o Ex:
Tables (horizontal/vertical)
Ex:
Mappings
Ex:

Grade 8
Graphs
Ex:
Note(s):
Grade Level(s):o Grade 8 introduces identifying functions using sets of ordered pairs, tables, mappings, and graphs.o Various mathematical process standards will be applied to this student expectation as appropriate.
TxRCFP:o Representing, applying, and analyzing proportional relationships
TxCCRS:o II. Algebraic Reasoningo VII. Functions

Grade 8
o IX. Communication and Representation
8.5H Identify examples of proportional and non-proportional functions that arise from mathematical and real-world problems.
Supporting StandardIdentify examples of proportional and non-proportional functions that arise from mathematical and real-world problems.
Supporting StandardIdentifyEXAMPLES OF PROPORTIONAL AND NON-PROPORTIONAL FUNCTIONS THAT ARISE FROM MATHEMATICAL AND REAL-WORLD PROBLEMSIncluding, but not limited to:
Slope – rate of change in y (vertical) compared to the rate of change in x (horizontal), or or , denoted as m in y = mx + b
y-intercept – y-coordinate of a point at which the relationship crosses the y-axis meaning the x-coordinate is equal to zero, denoted as b in y = mx + b
Linear relationship – a relationship with a constant rate of change represented by a graph that forms a straight line Function – relation in which each element of the input (x) is paired with exactly one element of the output (y)
o Linear proportional function
Linear Represented by y = kx or y = mx + b, where b = 0
For y = kx and y = mx + b, k = the slope, m Passes through the origin (0,0) meaning the y-intercept, b, is 0
Constant of proportionality represented as
Constant slope represented as m = or m = or m = o Linear non-proportional function
Linear

Grade 8
Represented by y = mx + b, where b ≠ 0 Does not pass through the origin (0,0) meaning the y-intercept, b, is not 0
Constant slope represented as m = or m = or m = Various representations
o Verbal
o Ex:
Table (horizontal/vertical)
Ex:

Grade 8
Graph
Ex:

Grade 8

Grade 8
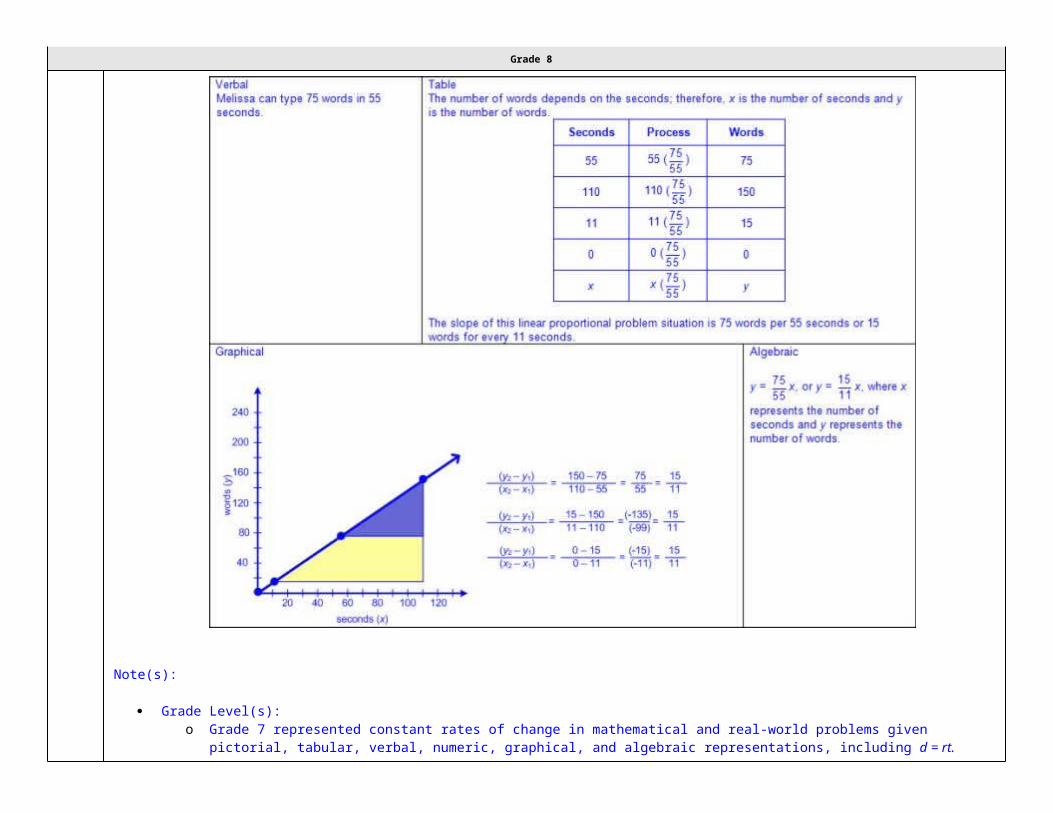
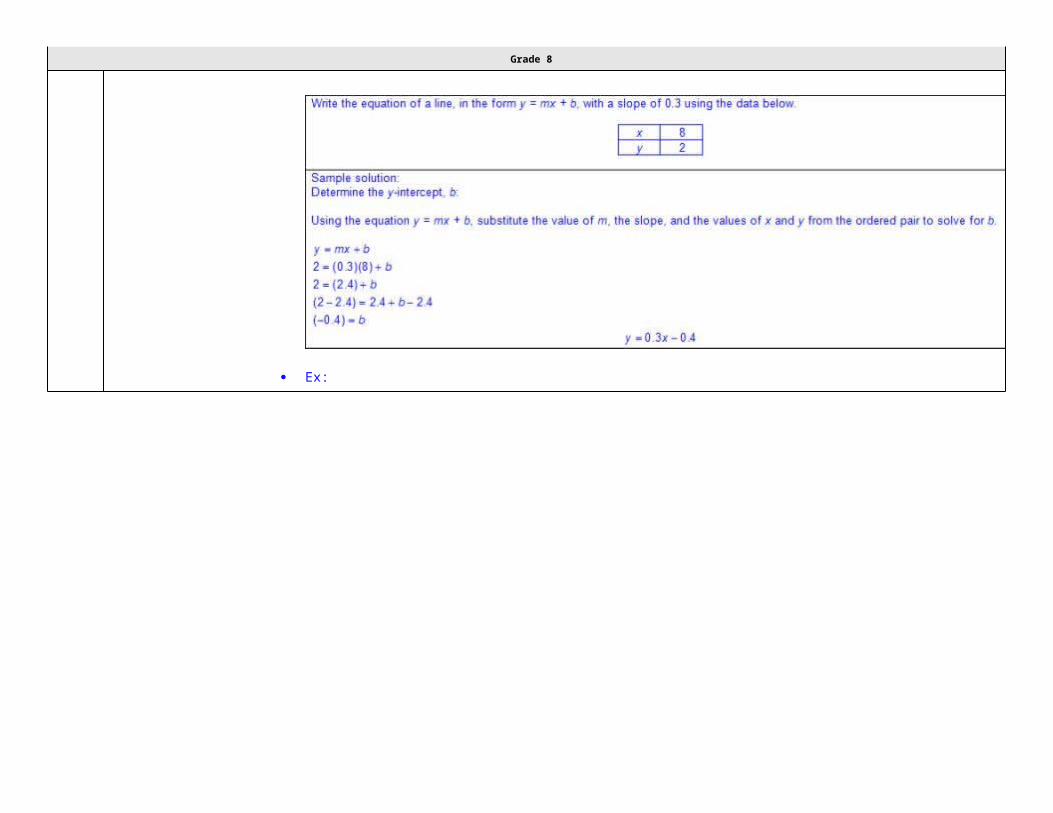
8.5I Write an equation in the form y = mx + b to model a linear relationship between two quantities using verbal, numerical, tabular, and
graphical representations.
Readiness StandardWrite an equation in the form y = mx + b to model a linear relationship between two quantities using verbal, numerical, tabular, and
graphical representations.
Readiness StandardWriteAN EQUATION IN THE FORM y = mx + b TO MODEL A LINEAR RELATIONSHIP BETWEEN TWO QUANTITIES USING VERBAL, NUMERICAL, TABULAR, AND GRAPHICAL REPRESENTATIONSIncluding, but not limited to:
Slope – rate of change in y (vertical) compared to the rate of change in x (horizontal), or or , denoted as m in y = mx + b
y-intercept – y-coordinate of a point at which the relationship crosses the y-axis meaning the x-coordinate is equal to zero, denoted as b in y = mx + b
Linear relationship – a relationship with a constant rate of change represented by a graph that forms a straight lineo Linear proportional relationship
Linear Represented by y = kx or y = mx + b, where b = 0
For y = kx and y = mx + b, k = the slope, m Passes through the origin (0,0) meaning the y-intercept, b, is 0
Constant of proportionality represented as
Constant slope represented as m = or m = or m = o Linear non-proportional relationship
Linear Represented by y = mx + b, where b ≠ 0 Does not pass through the origin (0,0) meaning the y-intercept, b, is not 0

Grade 8
Constant slope represented as m = or m = or m = Equations in the form y = mx + b to represent relationships between two quantities
o Various representations Verbal
Ex:
Ex:

Grade 8
Ex:

Grade 8
Numerical
Ex:

Grade 8
Ex:
Ex:

Grade 8
Tabular (horizontal/vertical)
Ex:
Grade 8
Ex:

Grade 8
Ex:

Grade 8
Graphical
Ex:

Grade 8

Grade 8
8.6 Expressions, equations, and relationships. The student applies mathematical process standards to develop mathematical relationships and make connections to geometric formulas. The student is expected to:
8.6A Describe the volume formula V = Bh of a cylinder in terms of its base area and its height.
Supporting StandardDescribe the volume formula V = Bh of a cylinder in terms of its base area and its height.
Supporting StandardDescribeTHE VOLUME FORMULA V = Bh OF A CYLINDER IN TERMS OF ITS BASE AREA AND ITS HEIGHTIncluding, but not limited to:
Three-dimensional figure – a figure that has measurements including length, width (depth), and heighto Attributes of cylinders
Cylinder
o 2 congruent, parallel circular baseso 1 curved surfaceo Bases of a cylinder – the two congruent, opposite circular baseso Height of a cylinder – the length of a line segment that is perpendicular to both bases
Pi (π) – the ratio of the circumference to the diameter of a circleo Approximations for pi
o π ≈ 3.14
o π ≈ Volume – the measurement attribute of the amount of space occupied by matter
o One way to measure volume is a three-dimensional cubic measure Formulas for volume from STAAR Grade 8 Mathematics Reference Materials

Grade 8
o Cylinder
V = Bh, where B represents the base area and h represents the height of the cylinder which is the number of times the base area is repeated or layered
o The base of a cylinder is a circle whose area may be found with the formula, A = πr2, meaning the base area, B, may be found with the formula B = πr2; therefore, the volume of a cylinder may be found using V = Bh or V = πr2h.
o Ex:
Relationship between volume of a prism and volume of a cylindero The formula used to determine volume of a prism is V = Bh, and the formula to determine the volume of a cylinder is V = Bh.o The base area depends on the shape of the base. (e.g., the shape of the base of a triangular prism is a triangle; the shape of the
base of a cylinder is a circle, etc.)o Ex:

Grade 8
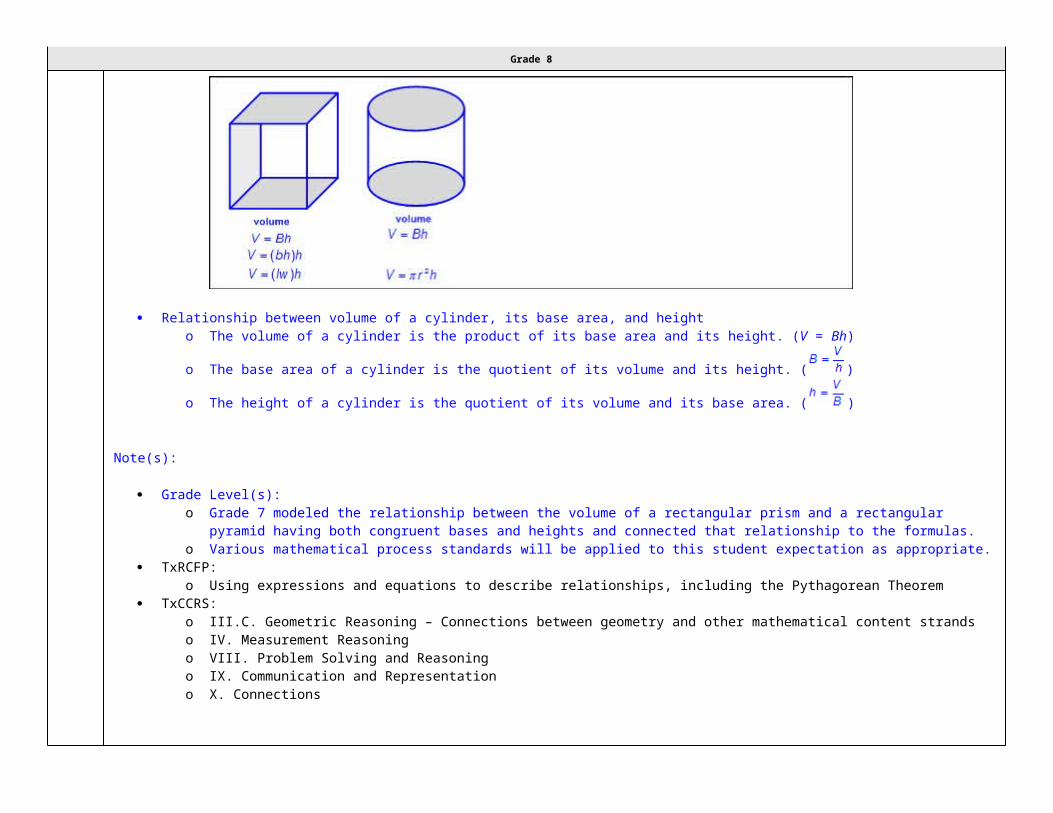
Relationship between volume of a cylinder, its base area, and heighto The volume of a cylinder is the product of its base area and its height. (V = Bh)
o The base area of a cylinder is the quotient of its volume and its height. ( )
o The height of a cylinder is the quotient of its volume and its base area. ( )
Note(s):
Grade Level(s):o Grade 7 modeled the relationship between the volume of a rectangular prism and a rectangular pyramid having both congruent bases
and heights and connected that relationship to the formulas.o Various mathematical process standards will be applied to this student expectation as appropriate.
TxRCFP:o Using expressions and equations to describe relationships, including the Pythagorean Theorem
TxCCRS:o III.C. Geometric Reasoning – Connections between geometry and other mathematical content strandso IV. Measurement Reasoningo VIII. Problem Solving and Reasoningo IX. Communication and Representationo X. Connections
Grade 8
8.6B Model the relationship between the volume of a cylinder and a cone having both congruent bases and heights and connect that
relationship to the formulas.
Model the relationship between the volume of a cylinder and a cone having both congruent bases and heights and connect that
relationship to the formulas.ModelTHE RELATIONSHIP BETWEEN THE VOLUME OF A CYLINDER AND A CONE HAVING BOTH CONGRUENT BASES AND HEIGHTS AND CONNECT THAT RELATIONSHIP TO THE FORMULASIncluding, but not limited to:
Three-dimensional figure – a figure that has measurements including length, width (depth), and heighto Attributes of cylinders and cones
Cylinder
o 2 congruent, parallel circular baseso 1 curved surfaceo Bases of a cylinder – the two congruent, opposite circular baseso Height of a cylinder – the length of a line segment that is perpendicular to both bases
Coneo 1 curved surfaceo 1 vertexo Base of a cone – the circular baseo Height of a cone – the length of a perpendicular line segment from the vertex of the cone to the base
Pi (π) – the ratio of the circumference to the diameter of a circleo Approximations for pi
o π ≈ 3.14
o π ≈ Volume – the measurement attribute of the amount of space occupied by matter
o One way to measure volume is a three-dimensional cubic measure Congruent – of equal measure, having exactly the same size and same shape Various models to represent the relationship between the volume of a cylinder and a cone having both congruent bases and heights
o Filling the cone with a measurable unit (e.g., rice, sand, water, etc.) and emptying the contents into the cylinder until the cylinder is completely full.

Grade 8
The contents of the cone will need to be emptied three times in order to fill the cylinder completely.o Creating a replica of the cone and cylinder with clay and comparing their masses.
The mass of the cylinder will be three times the mass of the cone, whereas the mass of the cone is the mass of the cylinder.
Generalizations from models used to represent the relationship between the volume of a cylinder and a cone having congruent bases and heights.
o The volume of a cylinder is three times the volume of a cone.
o The volume of a cone is the volume of a cylinder. Connections between models to represent volume of a cylinder and cone having both congruent bases and heights to the formulas for volume
o Formulas for volume from STAAR Grade 8 Mathematics Reference Materials Cylinder
o V = Bh, where B represents the base area and h represents the height of the cylinder which is the number of times the base area is repeated or layered
The base of a cylinder is a circle whose area may be found with the formula, A = πr2 meaning the base area, B, may be found with the formula B = πr2; therefore the volume of a cylinder may be found using V = Bh or V = πr2h.
Cone
o V = Bh, where B represents the base area and h represents the height of the cone The base of a cone is a circle whose area may be found with the formula, A = πr2 meaning the base area, B,
may be found with the formula B = πr2; therefore the volume of a cone may be found using V = Bh or V = πr2h .
Relationship between the volume of prisms and cylinders as compared to the volume of pyramids and coneso The formula used to determine volume of a prism is V = Bh, and the formula to determine the volume of a cylinder is V = Bh.
o The formula used to determine volume of a pyramid is V = Bh, and the formula to determine the volume of a cone is V = Bh.o Ex:

Grade 8
Note(s):
Grade Level(s):o Grade 7 explained verbally and symbolically the relationship between the volume of a triangular prism and a triangular pyramid
having both congruent bases and heights and connected that relationship to the formulas.o Various mathematical process standards will be applied to this student expectation as appropriate.
TxRCFP:o Using expressions and equations to describe relationships, including the Pythagorean Theorem
TxCCRS:o III.C. Geometric Reasoning – Connections between geometry and other mathematical content strandso IV. Measurement Reasoningo VIII. Problem Solving and Reasoningo IX. Communication and Representationo X. Connections
8.6C Use models and diagrams to explain the Pythagorean theorem.
Supporting StandardUse models and diagrams to explain the Pythagorean theorem.

Grade 8
Supporting StandardUseMODELS AND DIAGRAMS TO EXPLAIN THE PYTHAGOREAN THEOREMIncluding, but not limited to:
Right triangle – a triangle with one right angle (exactly 90 degrees) and two acute angles Legs – the two shortest sides of a right triangle Hypotenuse – the longest side of a right triangle, the side opposite the right angle Pythagorean theorem
o Verbal: sum of the squares of the legs equals the square of the hypotenuseo Formula: a2 + b2 = c2, where a and b represent the legs and c represents the hypotenuse
Models and diagramso Square tiles
o Ex:
Grid paper
Ex:

Grade 8
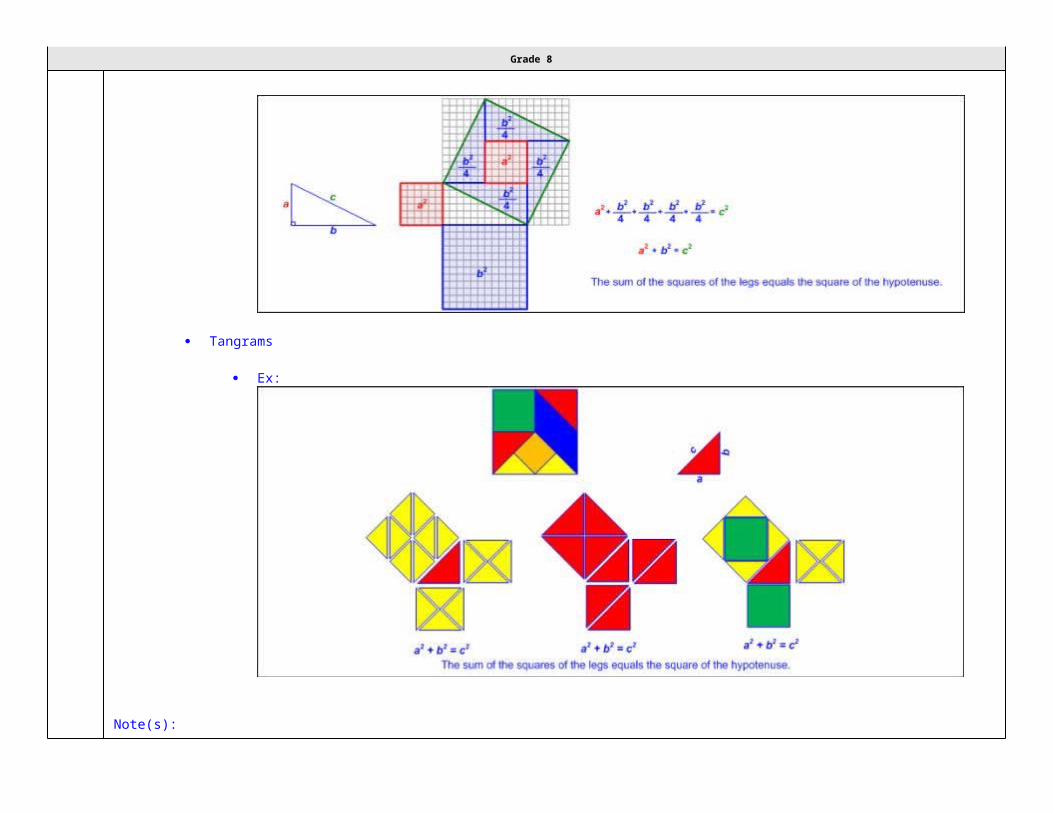
Tangrams
Ex:
Note(s):
Grade 8
Grade Level(s):o Grade 7 used models to determine the approximate formulas for the circumference and area of a circle and connect the models to the
actual formulas.o Various mathematical process standards will be applied to this student expectation as appropriate.
TxRCFP:o Using expressions and equations to describe relationships, including the Pythagorean Theorem
TxCCRS:o III.C. Geometric Reasoning – Connections between geometry and other mathematical content strandso IV. Measurement Reasoningo VIII. Problem Solving and Reasoningo IX. Communication and Representationo X. Connections
8.7 Expressions, equations, and relationships. The student applies mathematical process standards to use geometry to solve problems. The student is expected to:
8.7A Solve problems involving the volume of cylinders, cones, and spheres.
Readiness StandardSolve problems involving the volume of cylinders, cones, and spheres.
Readiness StandardSolvePROBLEMS INVOLVING THE VOLUME OF CYLINDERS, CONES, AND SPHERESIncluding, but not limited to:
Three-dimensional figure – a figure that has measurements including length, width (depth), and heighto Attributes of cylinders, cones, and spheres
Cylinder

Grade 8
o 2 congruent, parallel circular baseso 1 curved surfaceo Bases of a cylinder – the two congruent, opposite circular baseso Height of a cylinder – the length of a line segment that is perpendicular to both bases
Coneo 1 curved surfaceo 1 vertexo Base of a cone – the circular baseo Height of a cone – the length of a perpendicular line segment from the vertex of the cone to the base
Sphereo 1 curved surface with all points on the surface equal distance from the center
Pi (π) – the ratio of the circumference to the diameter of a circleo Approximations for pi
o π ≈ 3.14
o π ≈ o Using the π function on the calculator, round to a specified number of decimal places.
Volume – the measurement attribute of the amount of space occupied by mattero One way to measure volume is a three-dimensional cubic measureo Positive rational number side lengths
Recognition of volume embedded in mathematical and real-world problem situations
Ex: How much sand is needed to fill a sand box? Ex: How much water is needed to fill an aquarium?
Formulas for volume from STAAR Grade 8 Mathematics Reference Materials
o Cylinder
V = Bh, where B represents the base area and h represents the height of the cylinder which is the number of times the base area is repeated or layered
o The base of a cylinder is a circle whose area may be found with the formula, A = πr2 meaning the base area, B, may be found with the formula B = πr2; therefore the volume of a cylinder may be found using V = Bh or V = πr2h.
o Ex:

Grade 8
Cone
V = Bh, where B represents the base area and h represents the height of the cone
The base of a cone is a circle whose area may be found with the formula, A = πr2 meaning the base area, B, may be
found with the formula B = πr2; therefore the volume of a cone may be found using V = Bh or V = πr2h. Ex:

Grade 8
Sphere
V = πr3, where r represents the radius of the sphere Ex:
Composite figures
Ex:

Grade 8
Note(s):
Grade Level(s):o Grade 7 solved problems involving the volume of rectangular prisms, triangular prisms, rectangular pyramids, and triangular
pyramids.o Various mathematical process standards will be applied to this student expectation as appropriate.
TxRCFP:o Using expressions and equations to describe relationships, including the Pythagorean Theorem
TxCCRS:
Grade 8
o I. Numeric Reasoningo III.C. Geometric Reasoning – Connections between geometry and other mathematical content strandso IV. Measurement Reasoningo VIII. Problem Solving and Reasoningo IX. Communication and Representationo X. Connections
8.7B Use previous knowledge of surface area to make connections to the formulas for lateral and total surface area and determine solutions for
problems involving rectangular prisms, triangular prisms, and cylinders.
Readiness StandardUse previous knowledge of surface area to make connections to the formulas for lateral and total surface area and determine solutions for
problems involving rectangular prisms, triangular prisms, and cylinders.
Readiness StandardUsePREVIOUS KNOWLEDGE OF SURFACE AREA TO MAKE CONNECTIONS TO THE FORMULAS FOR LATERAL AND TOTAL SURFACE AREAIncluding, but not limited to:
Three-dimensional figure – a figure that has measurements including length, width (depth), and heighto Attributes of prisms and cylinders
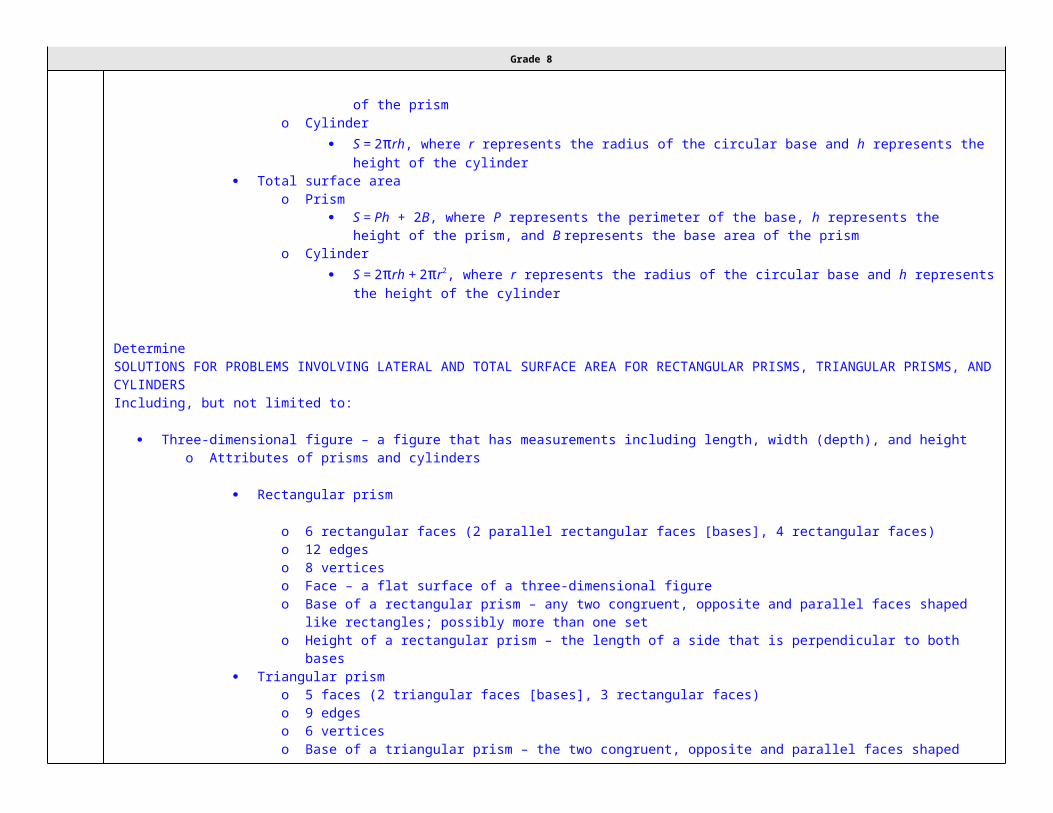
Rectangular prism
o 6 rectangular faces (2 parallel rectangular faces [bases], 4 rectangular faces)o 12 edgeso 8 verticeso Face – a flat surface of a three-dimensional figureo Base of a rectangular prism – any two congruent, opposite and parallel faces shaped like rectangles; possibly more
than one seto Height of a rectangular prism – the length of a side that is perpendicular to both bases
Triangular prism

Grade 8
o 5 faces (2 triangular faces [bases], 3 rectangular faces)o 9 edgeso 6 verticeso Base of a triangular prism – the two congruent, opposite and parallel faces shaped like triangleso Height of a triangular prism – the length of a side that is perpendicular to both bases
Cylindero 2 congruent, parallel circular baseso 1 curved surfaceo Bases of a cylinder – the two congruent, opposite circular baseso Height of a cylinder – the length of a line segment that is perpendicular to both bases
Pi (π) – the ratio of the circumference to the diameter of a circleo Approximations for pi
o π ≈ 3.14
o π ≈o Using the π function on the calculator, round to a specified number of decimal places.
Area – the measurement attribute that describes the number of square units a figure or region coverso Area is a two-dimensional square unit measure.
Surface areao Lateral surface area – the number of square units needed to cover the lateral view (area excluding the base(s) of a three-dimensional
figure)o Total surface area – the number of square units needed to cover all of the surfaces (bases and lateral area)
Connections between nets used to find lateral and total surface area and the formulaso Formulas for surface area from STAAR Grade 8 Mathematics Reference Materials
Lateral surface areao Prism
S = Ph, where P represents the perimeter of the base and h represents the height of the prismo Cylinder
S = 2πrh, where r represents the radius of the circular base and h represents the height of the cylinder Total surface area
o Prism S = Ph + 2B, where P represents the perimeter of the base, h represents the height of the prism,
and B represents the base area of the prismo Cylinder

Grade 8
S = 2πrh + 2πr2, where r represents the radius of the circular base and h represents the height of the cylinder
DetermineSOLUTIONS FOR PROBLEMS INVOLVING LATERAL AND TOTAL SURFACE AREA FOR RECTANGULAR PRISMS, TRIANGULAR PRISMS, AND CYLINDERSIncluding, but not limited to:
Three-dimensional figure – a figure that has measurements including length, width (depth), and heighto Attributes of prisms and cylinders
Rectangular prism
o 6 rectangular faces (2 parallel rectangular faces [bases], 4 rectangular faces)o 12 edgeso 8 verticeso Face – a flat surface of a three-dimensional figureo Base of a rectangular prism – any two congruent, opposite and parallel faces shaped like rectangles; possibly more
than one seto Height of a rectangular prism – the length of a side that is perpendicular to both bases
Triangular prismo 5 faces (2 triangular faces [bases], 3 rectangular faces)o 9 edgeso 6 verticeso Base of a triangular prism – the two congruent, opposite and parallel faces shaped like triangleso Height of a triangular prism – the length of a side that is perpendicular to both bases
Cylindero 2 congruent, parallel circular baseso 1 curved surfaceo Bases of a cylinder – the two congruent, opposite circular baseso Height of a cylinder – the length of a line segment that is perpendicular to both bases
Pi (π) – the ratio of the circumference to the diameter of a circleo Approximations for pi
o π ≈ 3.14
o π ≈

Grade 8
o Using the π function on the calculator, round to a specified number of decimal places. Area – the measurement attribute that describes the number of square units a figure or region covers
o Area is a two-dimensional square unit measure.o Positive rational number side lengths
Formulas for surface area from STAAR Grade 8 Mathematics Reference Materialso Lateral surface area
Prismo S = Ph, where P represents the perimeter of the base and hrepresents the height of the prism
Rectangular prism
Ex:
Triangular prism
Ex:

Grade 8
Cylinder
S = 2πrh, where r represents the radius of the circular base and h represents the height of the cylinder
Ex:

Grade 8
Total surface area
Prism
S = Ph + 2B, where P represents the perimeter of the base, h represents the height of the prism, and B represents the base area of the prism
Rectangular prism
Ex:

Grade 8
Triangular prism
Ex:

Grade 8
Cylinder
Grade 8
S = 2πrh + 2πr2, where r represents the radius of the circular base and h represents the height of the cylinder
Ex:
Note(s):
Grade Level(s):o Grade 7 solved problems involving the lateral and total surface area of a rectangular prisms, rectangular pyramids, triangular prisms,
and triangular pyramids by determining the area of the shape's net.o Grade 8 introduces determining lateral and total surface area using a formula.o Various mathematical process standards will be applied to this student expectation as appropriate.
TxRCFP:o Using expressions and equations to describe relationships, including the Pythagorean Theorem
TxCCRS:o I. Numeric Reasoning

Grade 8
o III.C. Geometric Reasoning – Connections between geometry and other mathematical content strandso IV. Measurement Reasoningo VIII. Problem Solving and Reasoningo IX. Communication and Representationo X. Connections
8.7C Use the Pythagorean Theorem and its converse to solve problems.
Readiness StandardUse the Pythagorean Theorem and its converse to solve problems.
Readiness StandardUseTHE PYTHAGOREAN THEOREM AND ITS CONVERSE TO SOLVE PROBLEMSIncluding, but not limited to:
Right triangle – a triangle with one right angle (exactly 90 degrees) and two acute angles Legs – the two shortest sides of a right triangle Hypotenuse – the longest side of a right triangle, the side opposite the right angle Pythagorean Theorem
o Verbal
The sum of the squares of the legs of a right triangle equals the square of the hypotenuse.o Formula
a2 + b2 = c2, where a and b represent the legs of a right triangle and c represents the hypotenuse When solving for a, b, or c both the positive and negative numerical values should be considered, but since the applications
are measurements the negative values do not apply.o Ex:

Grade 8
Ex:

Grade 8
Ex:

Grade 8
Converse of Pythagorean Theoremo Verbal
If the sum of the squares of the two shortest sides of a triangle equals the square of the third side, then the triangle is a right triangle.
o Formula a2 + b2 = c2, where a and b represent the legs of a right triangle and c represents the hypotenuse
o Ex:

Grade 8
Ex:
Ex:

Grade 8
Note(s):
Grade Level(s):o Grade 8 introduces using the Pythagorean Theorem and its converse to solve problems.o Various mathematical process standards will be applied to this student expectation as appropriate.
TxRCFP:o Using expressions and equations to describe relationships, including the Pythagorean Theorem
TxCCRS:o I. Numeric Reasoning

Grade 8
o III.C. Geometric Reasoning – Connections between geometry and other mathematical content strandso IV. Measurement Reasoningo VIII. Problem Solving and Reasoningo IX. Communication and Representationo X. Connections
8.7D Determine the distance between two points on a coordinate plane using the Pythagorean Theorem.
Supporting StandardDetermine the distance between two points on a coordinate plane using the Pythagorean Theorem.
Supporting StandardDetermineTHE DISTANCE BETWEEN TWO POINTS ON A COORDINATE PLANE USING THE PYTHAGOREAN THEOREMIncluding, but not limited to:
Coordinate plane – a two-dimensional plane on which to plot points, lines, and curves Axes – the vertical and horizontal lines that act as a reference when plotting points on a coordinate plane Intersecting lines – lines that meet or cross at a point Origin – the starting point in locating points on a coordinate plane Quadrants – any of the four areas created by dividing a plane with an x-axis and y-axis Attributes of the coordinate plane
o Two number lines intersect perpendicularly to form the axes, which are used to locate points on the plane.
The horizontal number line is called the x-axis. The vertical number line is called the y-axis.
o The x-axis and the y-axis cross at 0 on both number lines and that intersection is called the origin. The ordered pair of numbers corresponding to the origin is (0,0)
o Four quadrants are formed by the intersection of the x- and y-axes and are labeled counterclockwise with Roman numerals.o Ex:

Grade 8
Iterated units are labeled and shown on both axes to show scale.
Intervals may or may not be increments of one. Intervals may or may not include decimal or fractional amounts.
Relationship between ordered pairs and attributes of the coordinate plane A pair of ordered numbers names the location of a point on a coordinate plane. Ordered pairs of numbers are indicated within parentheses and separated by a comma. (x,y).
The first number in the ordered pair represents the parallel movement on the x-axis, left or right starting at the origin. The second number in the ordered pair represents the parallel movement on the y-axis, up or down starting at the
origin. Right triangle – a triangle with one right angle (exactly 90 degrees) and two acute angles Legs – the two shortest sides of a right triangle Hypotenuse – the longest side of a right triangle, the side opposite the right angle Pythagorean Theorem
o Verbal

Grade 8
The sum of the squares of the legs of a right triangle equals the square of the hypotenuse.o Formula
a2 + b2 = c2, where a and b represent the legs of a right triangle and c represents the hypotenuse When solving for a, b, or c both the positive and negative numerical values should be considered, but since the applications
are measurements the negative values do not apply. Generalizations from points on a coordinate plane
o A right triangle can be formed from any two points on a non-horizontal, non-vertical line by drawing a vertical line from one point and a horizontal line from the other point until the lines intersect.
o Ex:
The Pythagorean Theorem can be used to determine the distance between two points on a coordinate plane.
Ex:
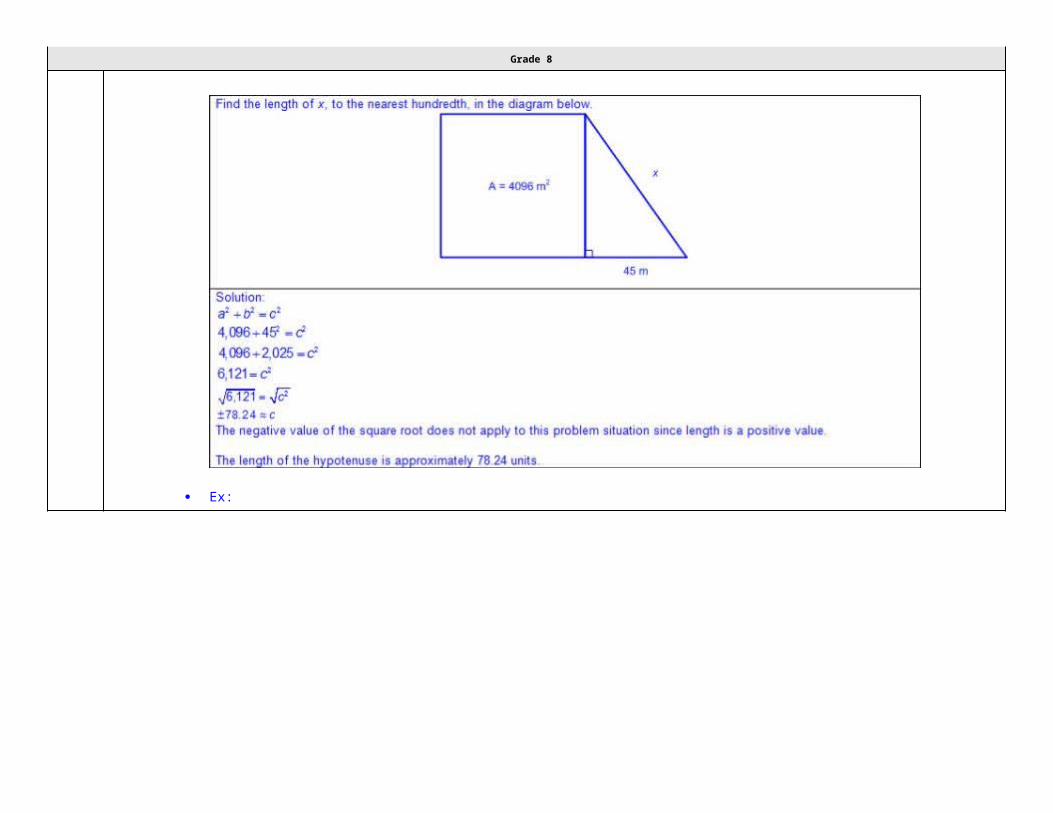
Grade 8
Ex:
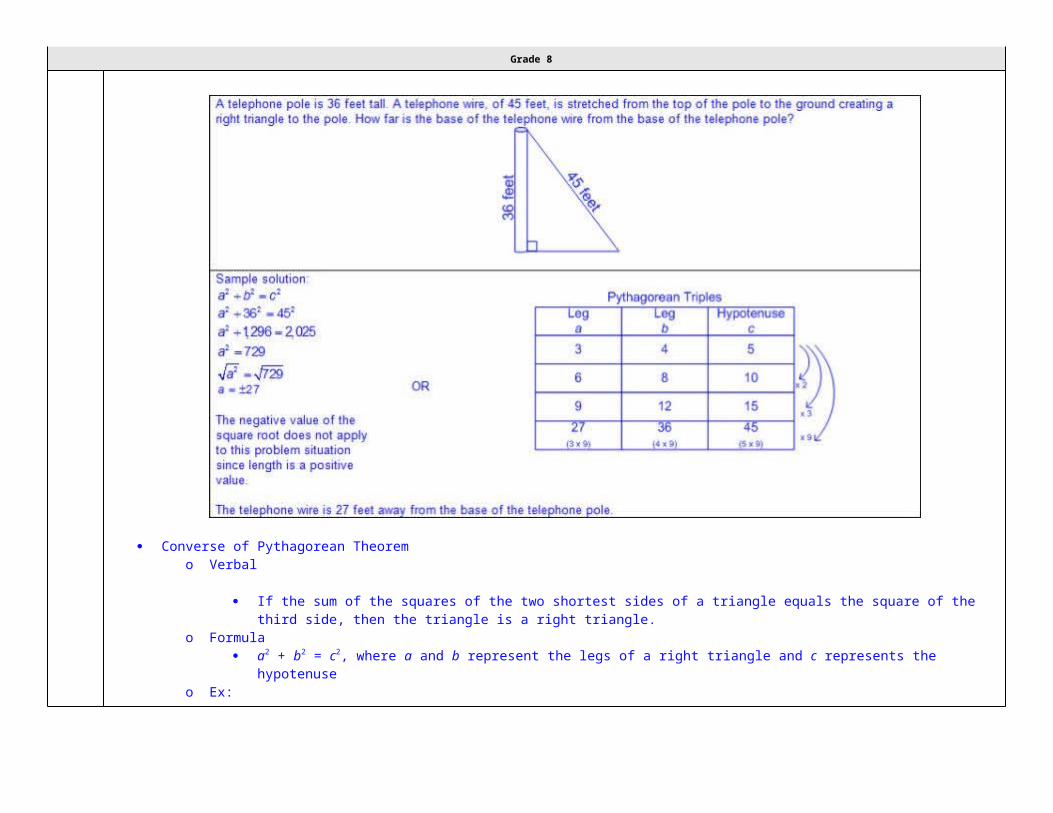
Grade 8
Note(s):
Grade Level(s):o Grade 8 introduces determining the distance between two points on a coordinate plane using the Pythagorean Theorem.o Various mathematical process standards will be applied to this student expectation as appropriate.
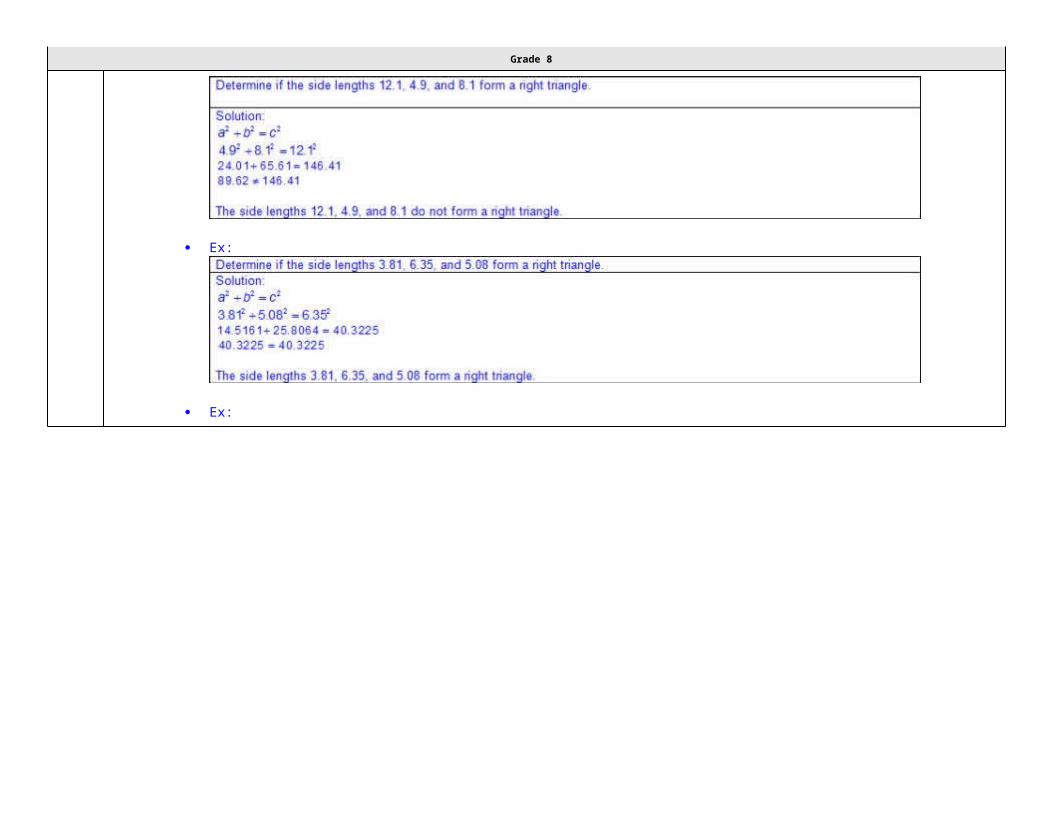
Grade 8
TxRCFP:o Using expressions and equations to describe relationships, including the Pythagorean Theorem
TxCCRS:o I. Numeric Reasoningo III.C. Geometric Reasoning – Connections between geometry and other mathematical content strandso IV. Measurement Reasoningo VIII. Problem Solving and Reasoningo IX. Communication and Representationo X. Connections
8.8 Expressions, equations, and relationships. The student applies mathematical process standards to use one-variable equations or inequalities in problem situations. The student is expected to:
8.8A Write one-variable equations or inequalities with variables on both sides that represent problems using rational number coefficients and
constants.
Supporting StandardWrite one-variable equations or inequalities with variables on both sides that represent problems using rational number coefficients and
constants.
Supporting StandardWriteONE-VARIABLE EQUATIONS OR INEQUALITIES WITH VARIABLES ON BOTH SIDES THAT REPRESENT PROBLEMS USING RATIONAL NUMBER COEFFICIENTS AND CONSTANTSIncluding, but not limited to:
Equation – a mathematical statement composed of algebraic and/or numeric expressions set equal to each other Inequality – a mathematical statement composed of algebraic and/or numeric expressions set apart by an inequality symbol Variable – a letter or symbol that represents a number
o One variable on one or both sides of the equation or inequalityo Ex:

Grade 8
Coefficient – a number that is multiplied by a variable(s)o Whole numberso Integerso Decimals (positive or negative values less than or greater than one)o Fractions (positive or negative proper, improper, and mixed numbers)o Ex:
Constant – a fixed value that does not appear with a variable(s)o Whole numberso Integerso Decimals (positive or negative values less than or greater than one)o Fractions (positive or negative proper, improper, and mixed numbers)o Ex:

Grade 8
Solution set – a set of all values of the variable(s) that satisfy the equation or inequalityo Constraints or conditions
o Ex: Minimum, maximum, up to, no more than, no less than, etc. Distinguishing between equations and inequalities
o Characteristics of equations
Equates two expressions Equality of variable One solution
o Characteristics of inequalities Shows the relationship between two expressions in terms of >,≥, ≤,or ≠ Inequality of the variable One or more solutions
Equality and inequality words and symbolso Equal to, =
o Ex: x is 4, x = 4o Greater than, >
o Ex: x is greater than 4, x > 4o Greater than or equal to, ≥
o Ex: x is greater than or equal to 4, x ≥ 4o Less than, <
o Ex: x is less than 4, x < 4o Less than or equal to, ≤
o Ex: x is less than or equal to 4, x ≤ 4o Not equal to, ≠
o Ex: x is not equal to 4, x ≠ 4 Relationship of order of operations within an equation or inequality

Grade 8
o Order of operations – the rules of which calculations are performed first when simplifying an expression
Parentheses/brackets: simplify expressions inside parentheses or brackets in order from left to right Exponents: rewrite in standard numerical form and simplify from left to right Multiplication/division: simplify expressions involving multiplication and/or division in order from left to right Addition/subtraction: simplify expressions involving addition and/or subtraction in order from left to right
One-variable equations with variables on both sides from a problem situation
Ex:
Ex:
One-variable inequalities with variables on both sides from a problem situation
Ex:
Ex:

Grade 8
Note(s):
Grade Level(s):o Grade 7 wrote one-variable, two-step equations and inequalities to represent constraints or conditions within problems.o Various mathematical process standards will be applied to this student expectation as appropriate.
TxRCFP:o Using expressions and equations to describe relationships, including the Pythagorean Theorem
TxCCRS:o II. Algebraic Reasoningo VIII. Problem Solving and Reasoningo IX. Communication and Representation
8.8B Write a corresponding real-world problem when given a one-variable equation or inequality with variables on both sides of the equal sign
using rational number coefficients and constants.
Supporting StandardWrite a corresponding real-world problem when given a one-variable equation or inequality with variables on both sides of the equal sign
using rational number coefficients and constants.
Supporting StandardWriteA CORRESPONDING REAL-WORLD PROBLEM WHEN GIVEN A ONE-VARIABLE EQUATION OR INEQUALITY WITH VARIABLES ON BOTH

Grade 8
SIDES OF THE EQUAL SIGN USING RATIONAL NUMBER COEFFICIENTS AND CONSTANTSIncluding, but not limited to:
Equation – a mathematical statement composed of algebraic and/or numeric expressions set equal to each other Inequality – a mathematical statement composed of algebraic and/or numeric expressions set apart by an inequality symbol Variable – a letter or symbol that represents a number
o One variable on one or both sides of the equation or inequalityo Ex:
Coefficient – a number that is multiplied by a variable(s)o Whole numberso Integerso Decimals (positive or negative values less than or greater than one)o Fractions (positive or negative proper, improper, and mixed numbers)o Ex:
Constant – a fixed value that does not appear with a variable(s)o Whole numberso Integerso Decimals (positive or negative values less than or greater than one)o Fractions (positive or negative proper, improper, and mixed numbers)

Grade 8
o Ex:
Solution set – a set of all values of the variable(s) that satisfy the equation or inequalityo Constraints or conditions
o Ex: Minimum, maximum, up to, no more than, no less than, etc. Distinguishing between equations and inequalities
o Characteristics of equations
Equates two expressions Equality of the variable One solution
o Characteristics of inequalities Shows the relationship between to expressions in terms of >,≥, ≤, or ≠ Inequality of the variable One or more solutions
Equality and inequality words and symbols
Equal to, = Ex: x is 4, x = 4
Greater than, > Ex: x is greater than 4, x > 4
Greater than or equal to, ≥ Ex: x is greater than or equal to 4, x ≥ 4
Less than, < Ex: x is less than 4, x < 4
Less than or equal to, ≤ Ex: x is less than or equal to 4, x ≤ 4
Not equal to, ≠ Ex: x is not equal to 4, x ≠ 4
Grade 8
Relationship of order of operations within an equation or inequality
o Order of operations – the rules of which calculations are performed first when simplifying an expression Parentheses/brackets: simplify expressions inside parentheses or brackets in order from left to right Exponents: rewrite in standard numerical form and simplify from left to right Multiplication/division: simplify expressions involving multiplication and/or division in order from left to right Addition/subtraction: simplify expressions involving addition and/or subtraction in order from left to right
Corresponding real-world problem situation from a one-variable equation with variables on both sides of the equal sign
Ex:
Corresponding real-world problem situation from a one-variable inequality with variables on both sides of the inequality symbol
Ex:
Note(s):
Grade Level(s):o Grade 7 wrote corresponding real-world problems given a one-variable, two-step equation or inequality.o Various mathematical process standards will be applied to this student expectation as appropriate.
TxRCFP:o Using expressions and equations to describe relationships, including the Pythagorean Theorem
TxCCRS:

Grade 8
o II. Algebraic Reasoningo VIII. Problem Solving and Reasoningo IX. Communication and Representationo X. Connections
8.8C Model and solve one-variable equations with variables on both sides of the equal sign that represent mathematical and real-world
problems using rational number coefficients and constants.
Readiness StandardModel and solve one-variable equations with variables on both sides of the equal sign that represent mathematical and real-world
problems using rational number coefficients and constants.
Readiness StandardModel, SolveONE-VARIABLE EQUATIONS WITH VARIABLES ON BOTH SIDES OF THE EQUAL SIGN THAT REPRESENT MATHEMATICAL AND REAL-WORLD PROBLEMS USING RATIONAL NUMBER COEFFICIENTS AND CONSTANTSIncluding, but not limited to:
Equation – a mathematical statement composed of algebraic and/or numeric expressions set equal to each other Variable – a letter or symbol that represents a number
o One variable on one or both sides of the equationo Ex:
Coefficient – a number that is multiplied by a variable(s)o Whole numberso Integers

Grade 8
o Decimals (positive or negative values less than or greater than one)o Fractions (positive or negative proper, improper, and mixed numbers)o Ex:
Constant – a fixed value that does not appear with a variable(s)o Whole numberso Integerso Decimals (positive or negative values less than or greater than one)o Fractions (positive or negative proper, improper, and mixed numbers)o Ex:
Solution set – a set of all values of the variable(s) that satisfy the equation or inequalityo Constraints or conditions
o Ex: Minimum, maximum, up to, no more than, no less than, etc. Characteristics of equations
o Equates two expressionso Equality of the variableo One solution
Equality words and symbolo Equal to, =
o Ex: x is 4, x = 4

Grade 8
Relationship of order of operations within an equationo Order of operations – the rules of which calculations are performed first when simplifying an expression
Parentheses/brackets: simplify expressions inside parentheses or brackets in order from left to right Exponents: rewrite in standard numerical form and simplify from left to right Multiplication/division: simplify expressions involving multiplication and/or division in order from left to right Addition/subtraction: simplify expressions involving addition and/or subtraction in order from left to right
Models to solve one-variable equations with variables on both sides of the equal sign (concrete, pictorial, algebraic)
Ex:

Grade 8

Grade 8
8.8D Use informal arguments to establish facts about the angle sum and exterior angle of triangles, the angles created when parallel lines are
cut by a transversal, and the angle-angle criterion for similarity of triangles.
Supporting StandardUse informal arguments to establish facts about the angle sum and exterior angle of triangles, the angles created when parallel lines are
cut by a transversal, and the angle-angle criterion for similarity of triangles.
Supporting StandardUseINFORMAL ARGUMENTS TO ESTABLISH FACTS ABOUT THE ANGLE SUM AND EXTERIOR ANGLE OF TRIANGLES, THE ANGLES CREATED WHEN PARALLEL LINES ARE CUT BY A TRANSVERSAL, AND THE ANGLE-ANGLE CRITERION FOR SIMILARITY OF TRIANGLESIncluding, but not limited to:
Angle – two rays with a common end point (the vertex)
Degree – the measure of an angle where each degree represents of a circleo Unit measure labels as “degrees” or with symbol for degrees (°)
o Ex: 90 degrees or 90° Adjacent angles – angles that share a common vertex and side
Ex:

Grade 8
Complementary angles – two angles whose sum of angle measures equals 90 degrees Supplementary angles – two angles whose sum of angle measures equals 180 degrees Triangle – a polygon with three sides and three vertices
o Interior angles of a triangle – angles that are inside of a triangle, formed by two sides of the triangle
o Ex:
Exterior angles of a triangle – angles that are outside of a triangle between one side of a triangle and the extension of the adjacent side
Ex:
Informal arguments to establish facts about triangles
The sum of the measures of the interior angles of a triangle equals 180º.

Grade 8
Adjacent interior and exterior angles create a supplementary pair of angles (the sum of the measures equals 180º). An exterior angle is equal to the sum of the two non-adjacent interior angles or the remote interior angles. The sum of the measures of the exterior angles, one at each vertex, of a triangle equals 360°. Ex:
Congruent angles – angles whose angle measurements are equalo Arc(s) on angles are usually used to indicate congruency.
Vertical angles – a pair of non-overlapping angles that are opposite and congruent to each other when two lines intersect
Ex:
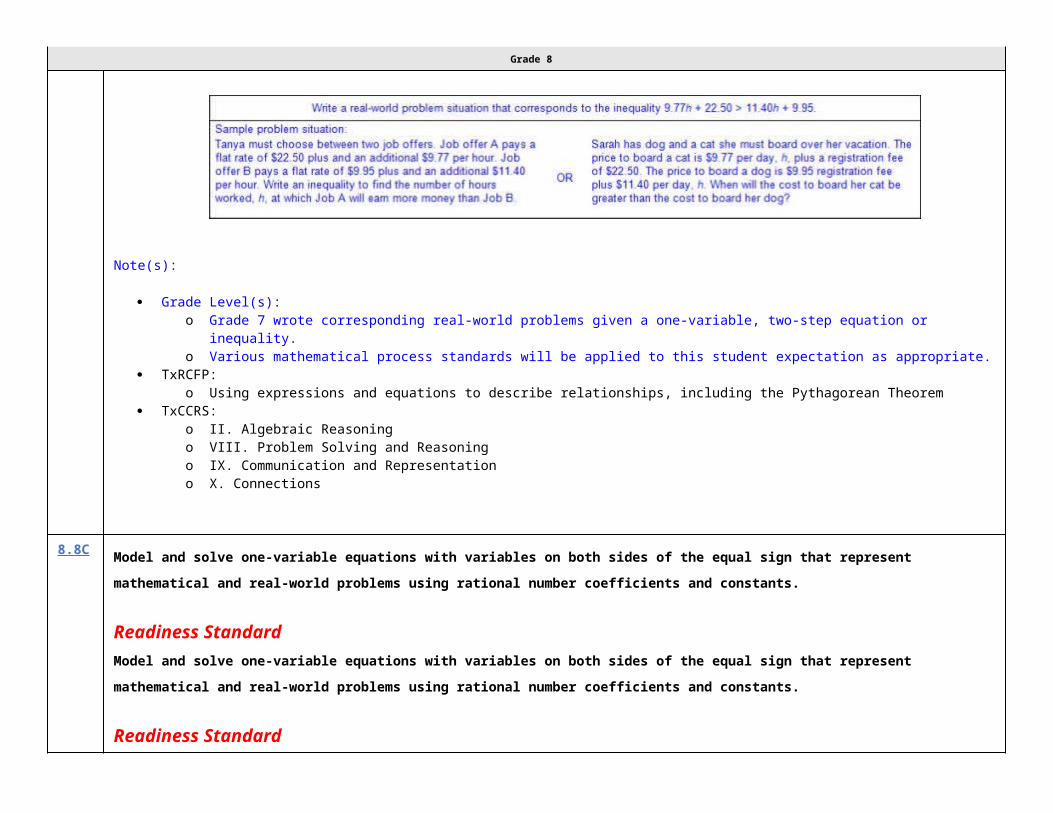
Grade 8
Parallel lines – lines that lie in the same plane, never intersect, and are always the same distance aparto Various orientations including vertical, horizontal, diagonal, and parallel lines of even, uneven, or off-set lengthso Lines that are parallel may or may not contain parallel markings.o Ex:
Transversal – a line that intersects two or more lines
Ex:

Grade 8
Alternate interior angleso When two parallel lines are cut by a transversal, alternate interior angles are formed on opposite sides of the transversal and on the
inside of the parallel lines.o Ex:
Alternate exterior angleso When two parallel lines are cut by a transversal, alternate exterior angles are formed on opposite sides of the transversal and on the
outside of the parallel lines.o Ex:

Grade 8
Corresponding angleso When two parallel lines are cut by a transversal, corresponding angles (one interior angle and one exterior angle) are formed on the
same side of the transversal and on the same side of the parallel lines.o Ex:
Informal arguments to establish facts about the angles created when parallel lines are cut by a transversal
Ex:

Grade 8
Ex:

Grade 8
Angle-angle criterion for triangles – if two angles in one triangle are congruent to two angles in another triangle, then the measure of the third angle in both triangles are congruent
Ex:

Grade 8
Informal arguments to establish facts about the angle-angle criterion for similarity of triangles
Ex:
Ex:

Grade 8
Note(s):
Grade Level(s):o Grade 7 wrote and solved equations using geometry concepts, including the sum of the angles in a triangle, and angle relationships.o Various mathematical process standards will be applied to this student expectation as appropriate.
TxRCFP:o Using expressions and equations to describe relationships, including the Pythagorean Theorem
TxCCRS:o III.C. Geometric Reasoning – Connections between geometry and other mathematical content strandso IV. Measurement Reasoningo VIII. Problem Solving and Reasoningo IX. Communication and Representationo X. Connections
8.9 Expressions, equations, and relationships. The student applies mathematical process standards to use multiple representations to develop foundational concepts of simultaneous linear equations. The student is expected to:

Grade 8
8.9A Identify and verify the values of x and y that simultaneously satisfy two linear equations in the form y = mx + b from the intersections of the
graphed equations.
Supporting StandardIdentify and verify the values of x and y that simultaneously satisfy two linear equations in the form y = mx + b from the intersections of the
graphed equations.
Supporting StandardIdentify, VerifyTHE VALUES OF x AND y THAT SIMULTANEOUSLY SATISFY TWO LINEAR EQUATIONS IN THE FORM y = mx + b FROM THE INTERSECTIONS OF THE GRAPHED EQUATIONSIncluding, but not limited to:
Slope – rate of change in y (vertical) compared to the rate of change in x (horizontal), or or , denoted as m in y = mx + b
y-intercept – y-coordinate of a point at which the relationship crosses the y-axis meaning the x-coordinate is equal to zero, denoted as b in y = mx + b
Linear relationship – a relationship with a constant rate of change represented by a graph that forms a straight lineo Linear proportional relationship
Linear Represented by y = kx or y = mx + b, where b = 0
For y = kx and y = mx + b, k = the slope, m Passes through the origin (0,0), meaning the y-intercept, b, is 0
Constant of proportionality represented as
Constant slope represented as m = or m = or m = o Linear non-proportional relationship
Linear Represented by y = mx + b, where b ≠ 0 Does not pass through the origin (0,0), meaning the y-intercept, b, is not 0

Grade 8
Constant slope represented as m = or m = or m = Intersections of graphed equations as ordered pairs
Ex:
Algebraic verification of intersections of graphed equations as ordered pairs
Ex:
Note(s):

Grade 8
Grade Level(s):o Grade 7 determined if the given value(s) make(s) one-variable, two-step equations and inequalities true.o Algebra 1 will graph systems of two linear equations in two variables on the coordinate plane and determine the solutions if they exist.o Algebra 1 will solve systems of linear equations using concrete models, graphs, tables, and algebraic methods.o Algebra 1 will estimate graphically the solutions to systems of two linear equations with two variables in real-world problems.o Various mathematical process standards will be applied to this student expectation as appropriate.
TxRCFP:o Using expressions and equations to describe relationships, including the Pythagorean Theorem
TxCCRS:o I. Numeric Reasoningo II. Algebraic Reasoningo VIII. Problem Solving and Reasoningo IX. Communication and Representation
8.10 Two-dimensional shapes. The student applies mathematical process standards to develop transformational geometry concepts. The student is expected to:
8.10A Generalize the properties of orientation and congruence of rotations, reflections, translations, and dilations of two-dimensional shapes on
a coordinate plane.
Supporting StandardGeneralize the properties of orientation and congruence of rotations, reflections, translations, and dilations of two-dimensional shapes on
a coordinate plane.
Supporting StandardGeneralizeTHE PROPERTIES OF ORIENTATION AND CONGRUENCE OF ROTATIONS, REFLECTIONS, TRANSLATIONS, AND DILATIONS OF TWO-DIMENSIONAL SHAPES ON A COORDINATE PLANEIncluding, but not limited to:
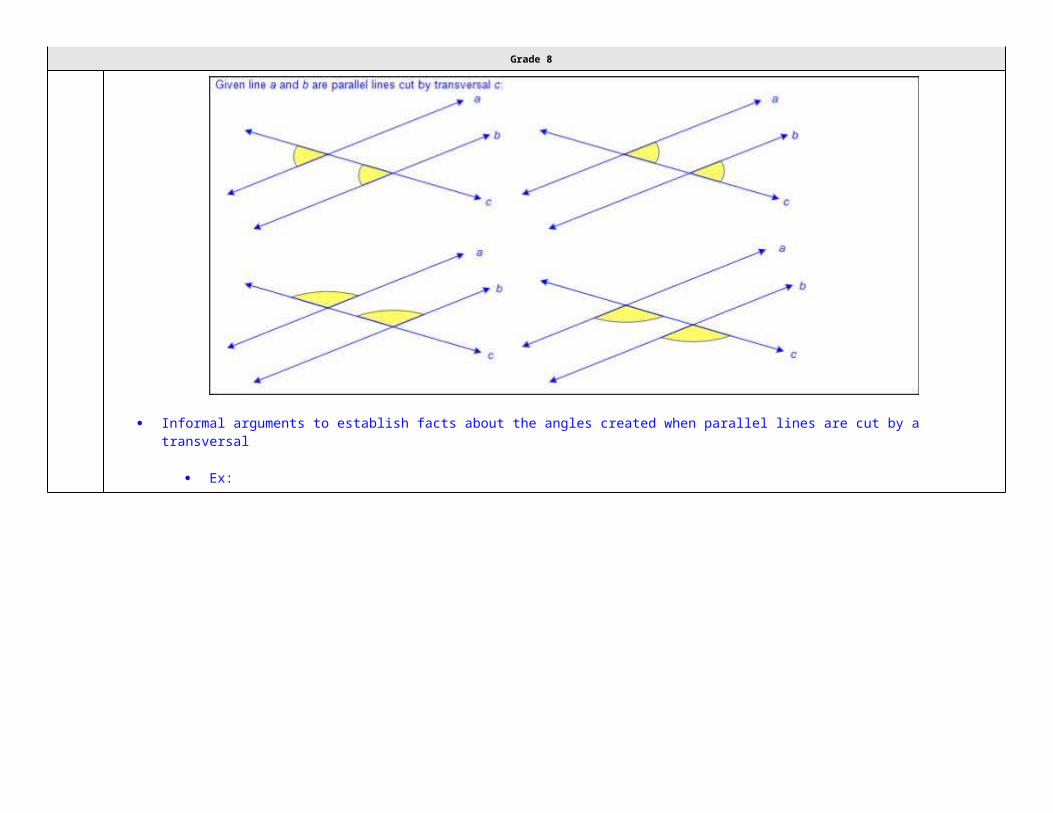
Grade 8
Property of orientationo Orientation is preserved when a two-dimensional figure is transformed and the image is identical in shape and direction.o Orientation is not preserved when a two-dimensional figure is transformed and the image is not identical in shape and direction.
Property of congruenceo Congruence is preserved when a two-dimensional figure is transformed and the image is identical in shape and size.o Congruence is not preserved when a two-dimensional figure is transformed and the image is not identical in shape and size.
Prime notation of image pointso Prime marks
o Ex: ABCD is the original figure or pre-image and A’B’C’D’ is the name of the image. A’B’C’D’ is read as “A prime, B prime, C prime, D prime”.
o Multiple prime markso Ex: ABCD can have a translated image named (e.g., A’’B’’C’’D’’, A’’’B’’’C’’’D’’’, etc.) A’’B’’C’’D’’ is read as “A double-prime, B
double-prime, C double-prime, D double-prime” and A’’’B’’’C’’’D’’’ is read as “A triple-prime, B triple-prime, C triple-prime, D triple-prime”.
Coordinate plane (all four quadrants) Transformation and properties of orientation and congruence
o Rotation – a transformation frequently described as a turn around a designated point; congruence is maintained to the original figure while orientation is only maintained for rotations of 360º
o Ex:

Grade 8
Reflection – a transformation frequently described as a flip; congruence is maintained and orientation is a mirror image
Ex:

Grade 8
Translation – a transformation frequently described as a slide; congruence and orientation are maintained to the original figure
Ex:

Grade 8
Dilation – a transformation in which an image is enlarged or reduced, depending on the scale factor, in such a way that the angles of the original figure are congruent and the sides proportional so that the image is similar to the original; orientation is maintained to the original figure while congruence is only maintained for a scale factor of 1
Ex:

Grade 8
Generalizations of the property of orientation considering only one transformationo Orientation is preserved for rotations of 360º, translations, and dilations.o Orientation is not preserved for rotations other than 360º and reflections.
Generalization of the property of congruence considering only one transformationo Congruence is preserved for rotations, reflections, translations, and dilations with a scale factor of 1.o Congruence is not preserved for dilations for positive scale factors greater than or less than 1.

Grade 8
Note(s):
Grade Level(s):o Grade 8 introduces generalizing the properties of orientation and congruence of rotations, reflections, translations, and dilations of
two-dimensional shapes on a coordinate plane.o Various mathematical process standards will be applied to this student expectation as appropriate.
TxRCFP:o Grade Level Connections (reinforces previous learning and/or provides development for future learning)
TxCCRS:o III.C. Geometric Reasoning – Connections between geometry and other mathematical content strandso VIII. Problem Solving and Reasoningo IX. Communication and Representationo X. Connections
8.10B Differentiate between transformations that preserve congruence and those that do not.
Supporting StandardDifferentiate between transformations that preserve congruence and those that do not.
Supporting StandardDifferentiateBETWEEN TRANSFORMATIONS THAT PRESERVE CONGRUENCE AND THOSE THAT DO NOTIncluding, but not limited to:
Property of congruenceo Congruence is preserved when a two-dimensional figure is transformed and the image is identical in shape and size.o Congruence is not preserved when a two-dimensional figure is transformed and the image is not identical in shape and size.
Generalization of the property of congruence considering only one transformationo Congruence is preserved for rotations, reflections, translations, and dilations with a scale factor of 1.o Congruence is not preserved for dilations for positive scale factors greater than or less than 1.
Prime notation of image pointso Prime marks

Grade 8
o Ex: ABCD is the original figure or pre-image and A’B’C’D’ is the name of the image. A’B’C’D’ is read as “A prime, B prime, C prime, D prime”.
o Multiple prime markso Ex: ABCD can have a translated image named (e.g., A’’B’’C’’D’’, A’’’B’’’C’’’D’’’, etc.) A’’B’’C’’D’’ is read as “A double-prime, B
double-prime, C double-prime, D double-prime” and A’’’B’’’C’’’D’’’ is read as “A triple-prime, B triple-prime, C triple-prime, D triple-prime”.
Various representations of transformations to determine congruence (verbal, graphical, tabular, algebraic)o Rotation – a transformation frequently described as a turn around a designated point; congruence is maintained to the original figure
while orientation is only maintained for rotations of 360ºo Ex:
Reflection – a transformation frequently described as a flip; congruence is maintained and orientation is a mirror image
Ex:
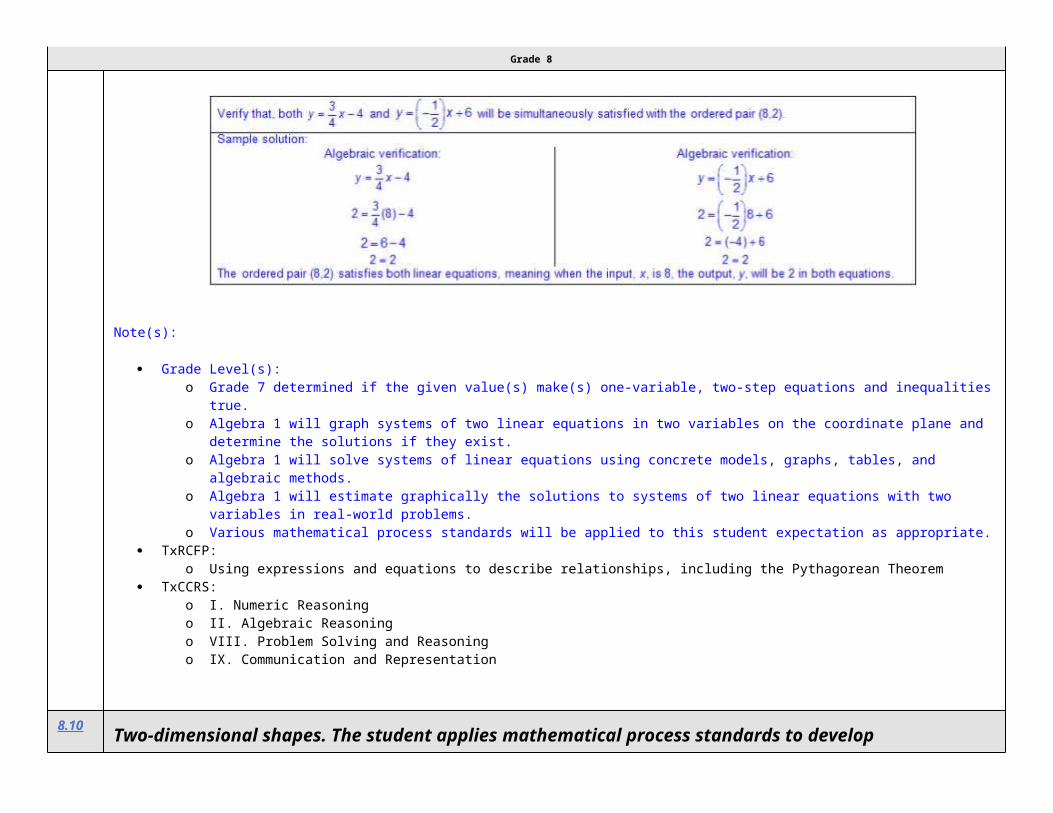
Grade 8
Translation – a transformation frequently described as a slide; congruence and orientation are maintained to the original figure
Ex:
Dilation – a transformation in which an image is enlarged or reduced, depending on the scale factor, in such a way that the angles of the original figure are congruent and the sides proportional so that the image is similar to the original; orientation is maintained to the original figure while congruence is only maintained for a scale factor of 1
Ex:

Grade 8
Ex:
Note(s):
Grade Level(s):o Grade 8 introduces differentiating between transformations that preserve congruence and those that do not.o Various mathematical process standards will be applied to this student expectation as appropriate.
TxRCFP:o Grade Level Connections (reinforces previous learning and/or provides development for future learning)
TxCCRS:o III.C. Geometric Reasoning – Connections between geometry and other mathematical content strandso VIII. Problem Solving and Reasoning

Grade 8
o IX. Communication and Representationo X. Connections
8.10C Explain the effect of translations, reflections over the x- or y-axis, and rotations limited to 90°, 180°, 270°, and 360° as applied to two-
dimensional shapes on a coordinate plane using an algebraic representation.
Readiness StandardExplain the effect of translations, reflections over the x- or y-axis, and rotations limited to 90°, 180°, 270°, and 360° as applied to two-
dimensional shapes on a coordinate plane using an algebraic representation.
Readiness StandardExplainTHE EFFECT OF TRANSLATIONS, REFLECTIONS OVER THE x- OR y-AXIS, AND ROTATIONS LIMITED TO 90°, 180°, 270°, AND 360° AS APPLIED TO TWO-DIMENSIONAL SHAPES ON A COORDINATE PLANE USING AN ALGEBRAIC REPRESENTATIONIncluding, but not limited to:
Prime notation of image pointso Prime marks
o Ex: ABCD is the original figure or pre-image and A’B’C’D’ is the name of the image. A’B’C’D’ is read as “A prime, B prime, C prime, D prime”.
o Multiple prime markso Ex: ABCD can have a translated image named (e.g., A’’B’’C’’D’’, A’’’B’’’C’’’D’’’, etc.) A’’B’’C’’D’’ is read as “A double-prime, B
double-prime, C double-prime, D double-prime” and A’’’B’’’C’’’D’’’ is read as “A triple-prime, B triple-prime, C triple-prime, D triple-prime”.
Coordinate plane (all four quadrants) Effects of transformations as algebraic representations
o Translation – a transformation frequently described as a slide; congruence and orientation are maintained to the original figureo Ex:

Grade 8
Reflection – a transformation frequently described as a flip; congruence is maintained and orientation is a mirror image
Ex:
Rotation – a transformation frequently described as a turn around a designated point; congruence is maintained to the original figure while orientation is only maintained for rotations of 360º

Grade 8
Ex:
Various combinations of transformations
Ex:

Grade 8
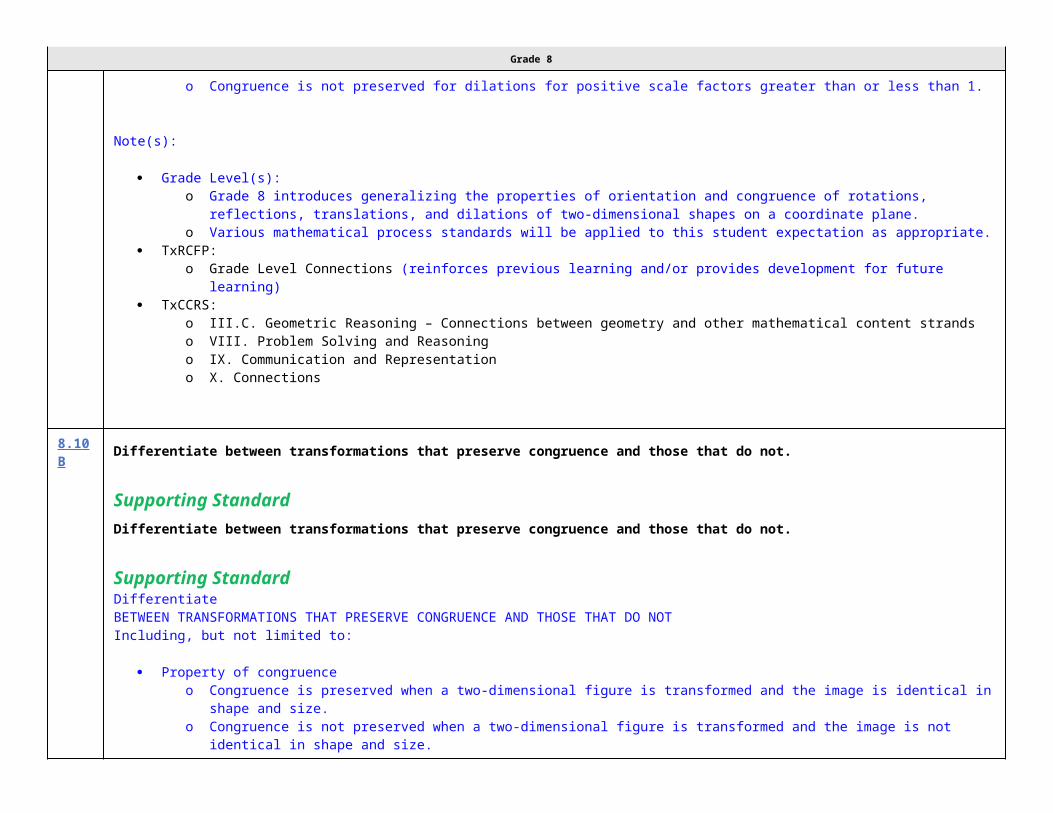
Grade 8
Note(s):
Grade Level(s):o Grade 8 introduces explaining the effect of translations, reflections over the x- or y-axis, and rotations limited to 90°, 180°, 270°, and
360° as applied to two-dimensional shapes on a coordinate plane using an algebraic representation.o Various mathematical process standards will be applied to this student expectation as appropriate.
TxRCFP:o Grade Level Connections (reinforces previous learning and/or provides development for future learning)
TxCCRS:o III.C. Geometric Reasoning – Connections between geometry and other mathematical content strandso VIII. Problem Solving and Reasoningo IX. Communication and Representationo X. Connections
8.10D Model the effect on linear and area measurements of dilated two-dimensional shapes.
Supporting StandardModel the effect on linear and area measurements of dilated two-dimensional shapes.
Supporting StandardModelTHE EFFECT ON LINEAR AND AREA MEASUREMENTS OF DILATED TWO-DIMENSIONAL SHAPESIncluding, but not limited to:
Linear measuremento Perimeter – a linear measurement of the distance around the outer edge of a figureo Circumference – a linear measurement of the distance around a circleo Perimeter and circumference are one-dimensional linear measures.o Positive rational number side lengths
Area – the measurement attribute that describes the number of square units a figure or region coverso Area is a two-dimensional square unit measure.o Positive rational number side lengths

Grade 8
Dilation – a transformation in which an image is enlarged or reduced, depending on the scale factor, in such a way that the angles of the original figure are congruent and the sides proportional so that the image is similar to the original; orientation is maintained to the original figure while congruence is only maintained for a scale factor of 1
o Enlargements (scale factor >1)o Reduction (scale factor < 1)o Congruent (scale factor = 1)
Model of the effect on linear and area measurements of dilated two-dimensional figureso Dilating a two-dimensional figure by a scale factor, recording the linear and area measurements of the figure and image, and
determining the relationship between the scale factor and measurements
Multiplying linear dimensions of a two-dimensional figure by a constant scale factor results in a proportional one-dimensional measure (perimeter/circumference).
Multiplying linear dimensions of a two-dimensional figure by a constant scale factor results in a two-dimensional measure (area) that is equivalent to the original area multiplied by the scale factor squared.
Ex:

Grade 8
Ex:

Grade 8
Ex:

Grade 8

Grade 8
8.11 Measurement and data. The student applies mathematical process standards to use statistical procedures to describe data. The student is expected to:
8.11A Construct a scatterplot and describe the observed data to address questions of association such as linear, non-linear, and no association
between bivariate data.
Supporting StandardConstruct a scatterplot and describe the observed data to address questions of association such as linear, non-linear, and no association
between bivariate data.
Supporting StandardConstructA SCATTERPLOTIncluding, but not limited to:
Data – information that is collected about people, events, or objects Discrete data – data with finite and distinct values, not inclusive of in-between values Scatterplot – a graphical representation used to display the relationship between discrete data pairs
o Characteristics of a scatterplot
Title clarifies the meaning of the data represented. Subtitles clarify the meaning of data represented on each axis. Numerical data represented with labels may be whole numbers, fractions, or decimals. Points are not connected by a line. Scale of the axes may be intervals of one or more, and scale intervals are proportionally displayed.
o The scales of the axes are number lines. Data pairs are analyzed to find possible relationships between the two sets of data
o A pair of numbers is collected to determine if a relationship exists between the two sets of data
o Ex: Distance from basket and number of baskets madeo Ex: Time spent reading and score on reading test
Various forms of positive and negative rational numbers within related data pairs
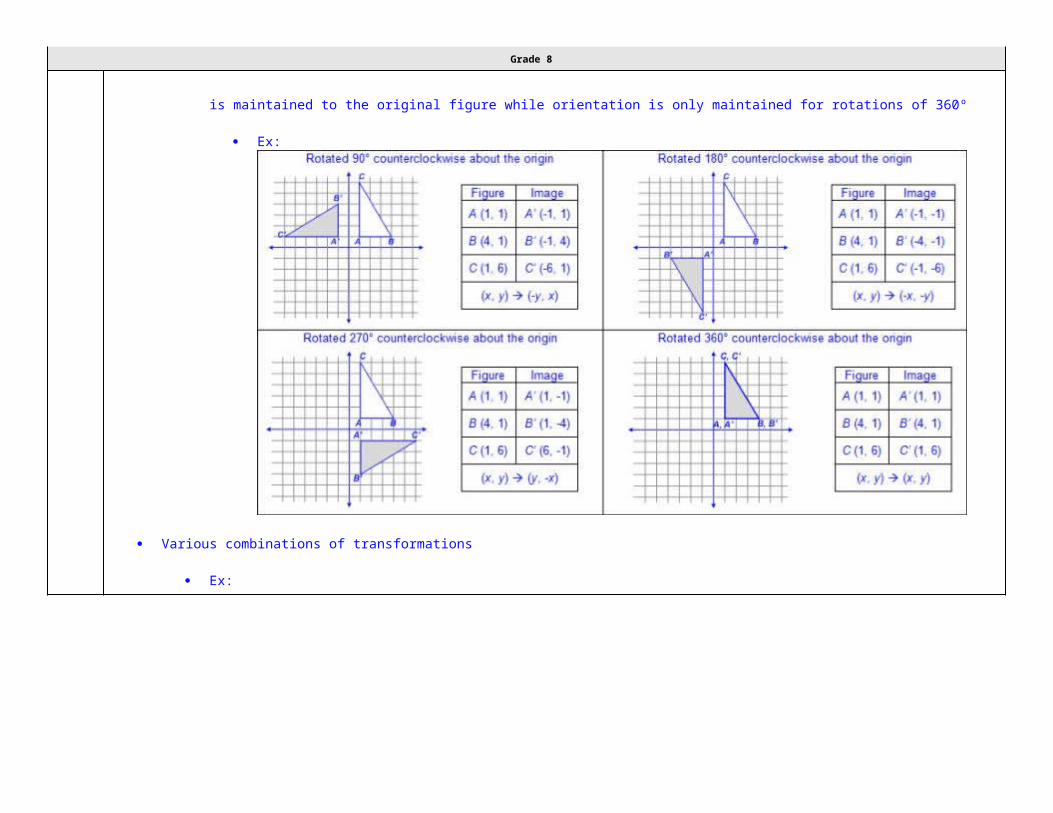
Grade 8
o Whole numberso Integerso Decimalso Fractions (proper, improper, and mixed numbers)
Relationship between related data pairs and ordered pairs graphed on the coordinate planeo Scatterplots consist of an x- and y-axis and a series of points (ordered pairs) to represent data from an observation.o Pairs of data are used to form ordered pairs that can be graphed.
Given or collected data Bivariate data – data relating two quantitative variables that can be represented by a scatterplot
Ex:

Grade 8
Ex:

Grade 8
Ex:

Grade 8
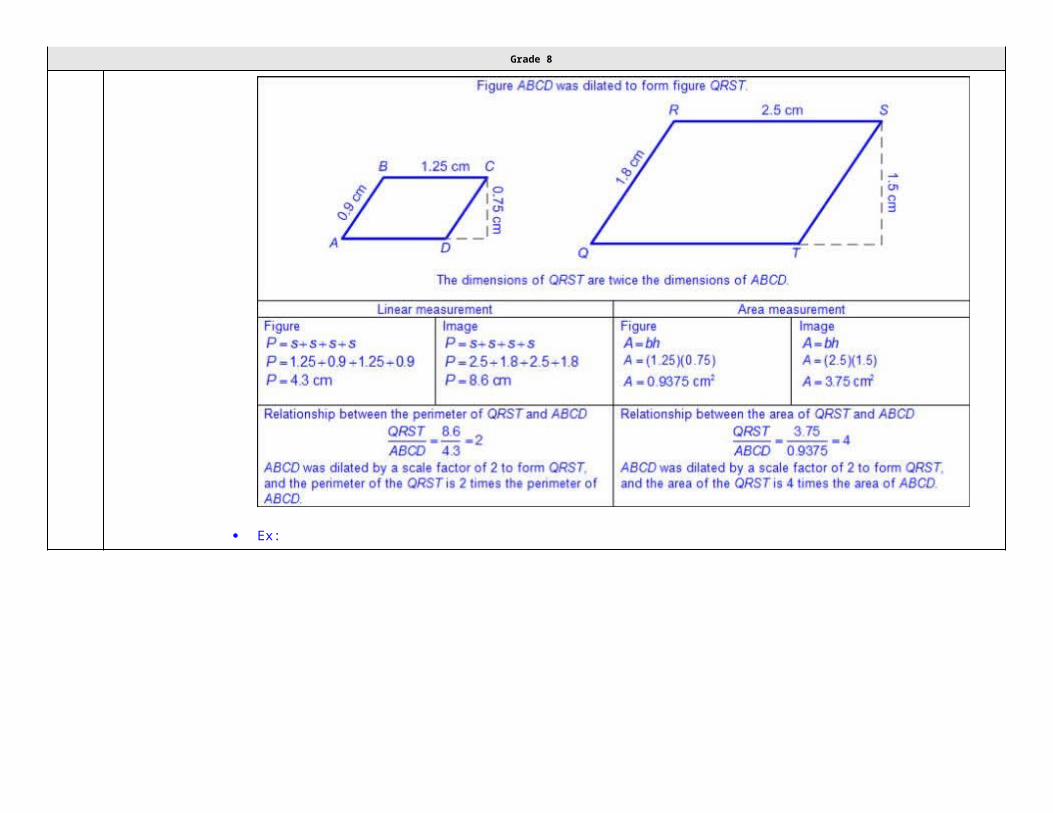
Grade 8
DescribeTHE OBSERVED DATA ON A SCATTERPLOT TO ADDRESS QUESTIONS OF ASSOCIATION SUCH AS LINEAR, NON-LINEAR, AND NO ASSOCIATION BETWEEN BIVARIATE DATAIncluding, but not limited to:
Discrete data – data with finite and distinct values, not inclusive of in-between values Scatterplot – a graphical representation used to display the relationship between discrete data pairs Data pairs are analyzed to find possible relationships between the two sets of data
o A pair of numbers is collected to determine if a relationship exists between the two sets of data
o Ex: Distance from basket and number of baskets madeo Ex: Time spent reading and score on reading test
Various forms of positive and negative rational numbers within related data pairso Whole numberso Integerso Decimalso Fractions (proper, improper, and mixed numbers)
Relationship between related data pairs and ordered pairs graphed on the coordinate planeo Scatterplots consist of an x- and y-axis and a series of points (ordered pairs) to represent data from an observation.o Pairs of data are used to form ordered pairs that can be graphed.
Given or collected data Bivariate data – data relating two quantitative variables that can be represented by a scatterplot Association within a scatterplot
o Linearo Ex:

Grade 8
Ex:

Grade 8

Grade 8
Non-linear
Ex:
Ex:

Grade 8

Grade 8
No association
Ex:
Ex:

Grade 8

Grade 8
8.11B Determine the mean absolute deviation and use this quantity as a measure of the average distance data are from the mean using a data set
of no more than 10 data points.
Supporting StandardDetermine the mean absolute deviation and use this quantity as a measure of the average distance data are from the mean using a data set
of no more than 10 data points.
Supporting StandardDetermineTHE MEAN ABSOLUTE DEVIATION AND USE THIS QUANTITY AS A MEASURE OF THE AVERAGE DISTANCE DATA ARE FROM THE MEAN USING A DATA SET OF NO MORE THAN 10 DATA POINTSIncluding, but not limited to:
Mean absolute deviation – a measure of variability of data around the mean calculated by the average distance between each data point and the mean
Given or collected data limited to no more than 10 data points Process for calculating the mean absolute deviation
o Find the mean of the data.o Find the absolute value of the difference between each data point and the mean.o Find the mean of the absolute differences.o Ex:
Relationship between mean absolute deviation and distance of data points on a number line
Ex:

Grade 8
Note(s):
Grade Level(s):o Grade 7 compared two groups of numeric data using comparative dot plots or box plots by comparing their shapes, centers, and
spreads.o Various mathematical process standards will be applied to this student expectation as appropriate.
TxRCFP:o Making inferences from data
TxCCRS:o I. Numeric Reasoningo IV. Measurement Reasoningo VI. Statistical Reasoningo VIII. Problem Solving and Reasoningo IX. Communication and Representation
8.11C Simulate generating random samples of the same size from a population with known characteristics to develop the notion of a random
sample being representative of the population from which it was selected.

Grade 8
Simulate generating random samples of the same size from a population with known characteristics to develop the notion of a random
sample being representative of the population from which it was selected.SimulateGENERATING RANDOM SAMPLES OF THE SAME SIZE FROM A POPULATION WITH KNOWN CHARACTERISTICS TO DEVELOP THE NOTION OF A RANDOM SAMPLE BEING REPRESENTATIVE OF THE POPULATION FROM WHICH IT WAS SELECTEDIncluding, but not limited to:
Population – total collection of persons, objects, or items of interest Sample – a subset of the population selected in order to make inferences about the entire population
Ex:
Ex:
Random sample – a subset of the population selected without bias in order to make inferences about the entire populationo Random samples are more likely to contain data that can be used to make predictions about a whole population.
Simulation – an experiment or model used to test the outcomes of an event Developing a design for a simulation Appropriate methods to simulate random samples from a population
o With technology
Calculator Computer model Random number generators
o Without technology Spinners (even and uneven sections) Color tiles Two-color counters Coins Deck of cards Marbles

Grade 8
Number cubeso Ex:
Note(s):
Grade Level(s):o Grade 7 compared two populations based on data in random samples from these populations, including informal comparative
inferences about differences between the two populations.o Various mathematical process standards will be applied to this student expectation as appropriate.
TxRCFP:o Making inferences from data
TxCCRS:o V. Probabilistic Reasoningo VI. Statistical Reasoningo VIII. Problem Solving and Reasoningo IX. Communication and Representation
8.12 Personal financial literacy. The student applies mathematical process standards to develop an economic way of thinking and problem solving useful in one's life as a knowledgeable consumer and investor. The student is expected to:
8.12A Solve real-world problems comparing how interest rate and loan length affect the cost of credit.

Grade 8
Supporting StandardSolve real-world problems comparing how interest rate and loan length affect the cost of credit.
Supporting StandardSolveREAL-WORLD PROBLEMS COMPARING HOW INTEREST RATE AND LOAN LENGTH AFFECT THE COST OF CREDITIncluding, but not limited to:
Amortization – process of paying down a loan with payments that include both principal and interest until the full amount of the loan is paid in full
Credit – buying or obtaining goods or services now with an agreement to pay in the future Annual percentage rate (APR) – annual percentage rate applied to the balance on a loan compounded monthly Principal – the original amount invested or borrowed Collateral – something which is pledged to secure repayment of a loan; in the event of default on the loan, the collateral is forfeited Compound interest – interest that is computed on the latest balance, including any previously earned interest that has been added to the
original principal Formula for compound interest from STAAR Grade 8 Mathematics Reference Materials
o Compound interest
A = P(1+ r)t, where A represents the total amount of money deposited or borrowed, including interest, P represents the principal amount, r represents the interest rate in decimal form, and t represents the number of years the amount is deposited or borrowed
Various types of loanso Easy access loan
Payday loan – a high-interest, short term loan of cash for which collateral, such as an automobile title, is required Car title loan – a high-interest, short term loan of cash for which an automobile title is required as collateral
o Consumer loan – loans made by various businesses and financial institutions Longer the repayment period, usually the higher the interest rate Longer the repayment period, the lower the monthly payment Longer the repayment period, the greater the amount of money repaid over the life of the loan May or may not calculate compound interest
Real-world problem situations comparing interest rates, loan length, and cost of credito Ex:

Grade 8
Ex:
Note(s):
Grade Level(s):o Grade 6 distinguished between debit cards and credit cards.o Various mathematical process standards will be applied to this student expectation as appropriate.
TxRCFP:o Financial Literacy
TxCCRS:o I. Numeric Reasoning
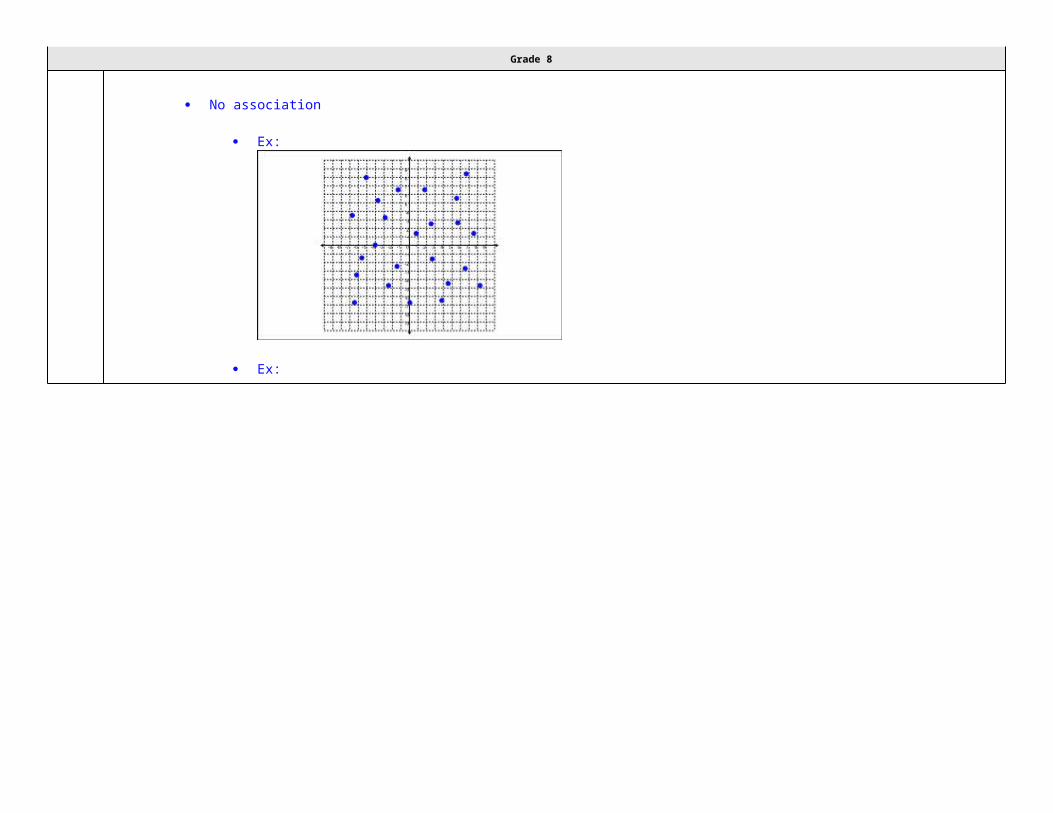
Grade 8
o VIII. Problem Solving and Reasoningo IX. Communication and Representationo X. Connections
8.12B Calculate the total cost of repaying a loan, including credit cards and easy access loans, under various rates of interest and over different
periods using an online calculator.
Calculate the total cost of repaying a loan, including credit cards and easy access loans, under various rates of interest and over different
periods using an online calculator.CalculateTHE TOTAL COST OF REPAYING A LOAN, INCLUDING CREDIT CARDS AND EASY ACCESS LOANS, UNDER VARIOUS RATES OF INTEREST AND OVER DIFFERENT PERIODS USING AN ONLINE CALCULATORIncluding, but not limited to:
Amortization – process of paying down a loan with payments that include both principal and interest until the full amount of the loan is paid in full
Credit – buying or obtaining goods or services now with an agreement to pay in the future Annual percentage rate (APR) – annual percentage rate applied to the balance on a loan compounded monthly Principal – the original amount invested or borrowed Collateral – something which is pledged to secure repayment of a loan; in the event of default on the loan, the collateral is forfeited Compound interest – interest that is computed on the latest balance, including any previously earned interest that has been added to the
original principal Formula for compound interest from STAAR Grade 8 Mathematics Reference Materials
o Compound interest
A = P(1+ r)t, where A represents the total amount of money deposited or borrowed, including interest, P represents the principal amount, r represents the interest rate in decimal form, and t represents the number of years the amount is deposited or borrowed
Various types of loanso Easy access loan
Payday loan – a high-interest, short term loan of cash for which collateral, such as an automobile title, is required Car title loan – a high-interest, short term loan of cash for which an automobile title is required as collateral
o Consumer loan – loans made by various businesses and financial institutions Longer the repayment period, the higher the interest rate Longer the repayment period, the lower the monthly payment

Grade 8
Longer the repayment period, the higher the effective interest rate May or may not calculate compound interest
o Credit card Tend to have higher interest rates than other types of loans Various fees may be associated Longer the repayment period, the higher the effective interest rate Calculates compound interest
Online calculator to compare the costs of loanso Ex:
Note(s):
Grade Level(s):o Grade 6 explained why it is important to establish a positive credit history.o Various mathematical process standards will be applied to this student expectation as appropriate.
TxRCFP:o Financial Literacy
TxCCRS:o I. Numeric Reasoningo VIII. Problem Solving and Reasoningo IX. Communication and Representation
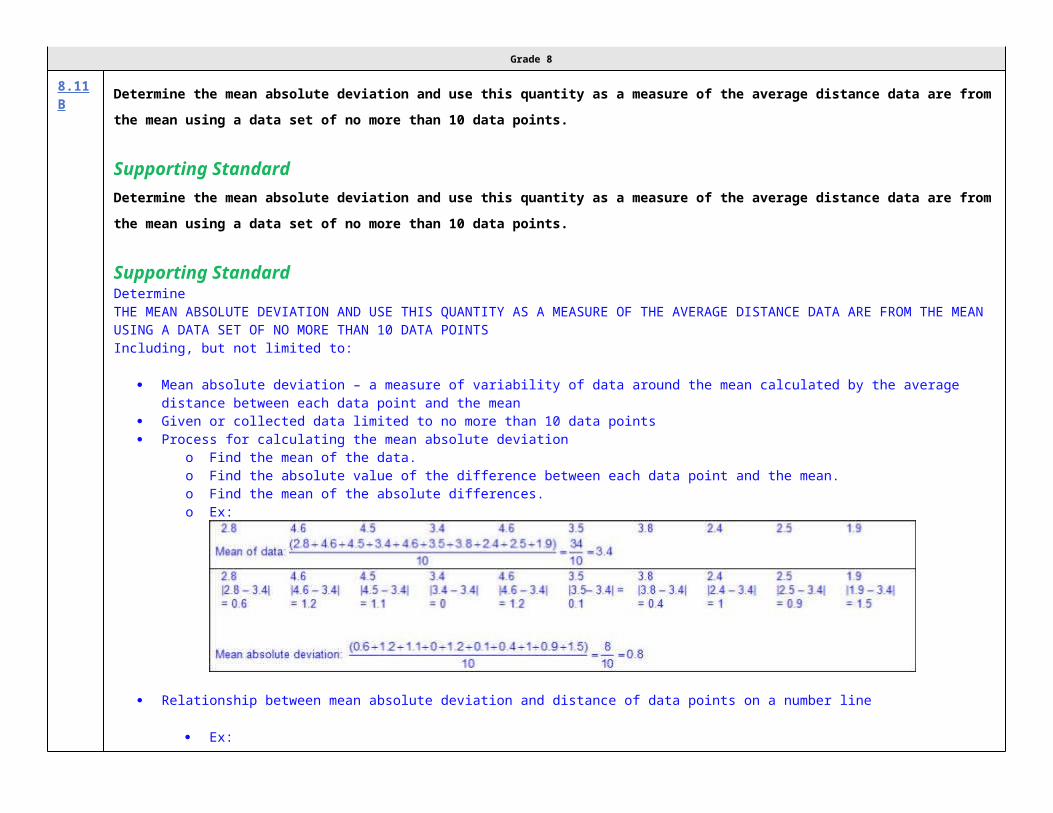
Grade 8
o X. Connections
8.12C Explain how small amounts of money invested regularly, including money saved for college and retirement, grow over time.
Supporting StandardExplain how small amounts of money invested regularly, including money saved for college and retirement, grow over time.
Supporting StandardExplainHOW SMALL AMOUNTS OF MONEY INVESTED REGULARLY, INCLUDING MONEY SAVED FOR COLLEGE AND RETIREMENT, GROW OVER TIMEIncluding, but not limited to:
Principal – the original amount invested or borrowed Various types of investments
Savings account – a bank or credit union account in which the money deposited earns interest so there will be more money in the future than originally deposited
Traditional savings accounts – money put into a savings account much like paying a monthly expense such as a light bill or phone bill
Taxable investment account – many companies will create an investment portfolio with the specific purpose of saving and building a strong portfolio to be used to pay for college
Annuity – deductible and non-deductible contributions may be made, taxes may be waived if used for higher education; sold by financial institutions
U.S. savings bond – money saved for a specific length of time and guaranteed by the federal government 529 account – educational savings account managed by the state
Retirement savings – optional savings plans or accounts to which the employer can make direct deposits of an amount deducted from the employee's pay at the request of the employee
401(k) – a set amount of money, or percentage of pay, that is set aside from an employee’s pay check by their employer, before the employee’s wages are taxed. The employer may or may not contribute as well to the employee’s 401(k) fund depending on employer’s policy. The money is taxed when it is withdrawn at retirement age. In addition, if withdrawn prior to retirement age an additional penalty tax is assessed.

Grade 8
403(b) – a set amount of money, or percentage of pay, that is set aside from an employee’s pay check by their employer, before the employee’s wages are taxed. The money is taxed when it is withdrawn at retirement age. In addition, if withdrawn prior to retirement age an additional penalty tax is assessed.
Similar to a 401(k), however 403(b) plans are offered by non-profit organizations Individual retirement account (IRA) – a set amount of money, or percentage of pay, that is invested by an individual with a
bank, mutual fund, or brokerage. Social Security – a percentage of an employee's pay required by law that the employer withholds from the employee's pay for
social security savings which is deposited into the federal retirement system; payment toward that employee's eventual retirement; the employer also is required to pay a matching amount for the employee into the federal retirement system.
Generalizations of investing money regularly, including money for college and retirement
o Small amounts of money invested regularly build a larger principal amount to earn more interesto A small amount of money invested for a longer period of time has the potential to earn as much interest as one large lump sum
investment.o Investing small amounts of money regularly may be more manageable for most people and demonstrates long-term financial planning
and responsibility.
Note(s):
Grade Level(s):o Grade 7 analyzed and compared monetary incentives, including sales, rebates, and coupons.o Various mathematical process standards will be applied to this student expectation as appropriate.
TxRCFP:o Financial Literacy
TxCCRS:o VIII. Problem Solving and Reasoningo IX. Communication and Representationo X. Connections
8.12D Calculate and compare simple interest and compound interest earnings.
Readiness Standard

Grade 8
Calculate and compare simple interest and compound interest earnings.
Readiness StandardCalculate, CompareSIMPLE INTEREST AND COMPOUND INTEREST EARNINGSIncluding, but not limited to:
Principal – the original amount invested or borrowed Simple interest – interest paid on the original principal in an account, disregarding any previously earned interest Compound interest – interest that is computed on the latest balance, including any previously earned interest that has been added to the
original principal Formulas for interest from STAAR Grade 8 Mathematics Reference Materials
o Simple interest
I = Prt, where I represents the interest, P represents the principal amount, r represents the interest rate in decimal form, and t represents the number of years the amount is deposited or borrowed
Ex:
Compound interest
A = P(1+ r)t, where A represents the total amount of money deposited or borrowed, including interested, P represents the principal amount, r represents the interest rate in decimal form, and t represents the number of years the amount is deposited or borrowed
Ex:
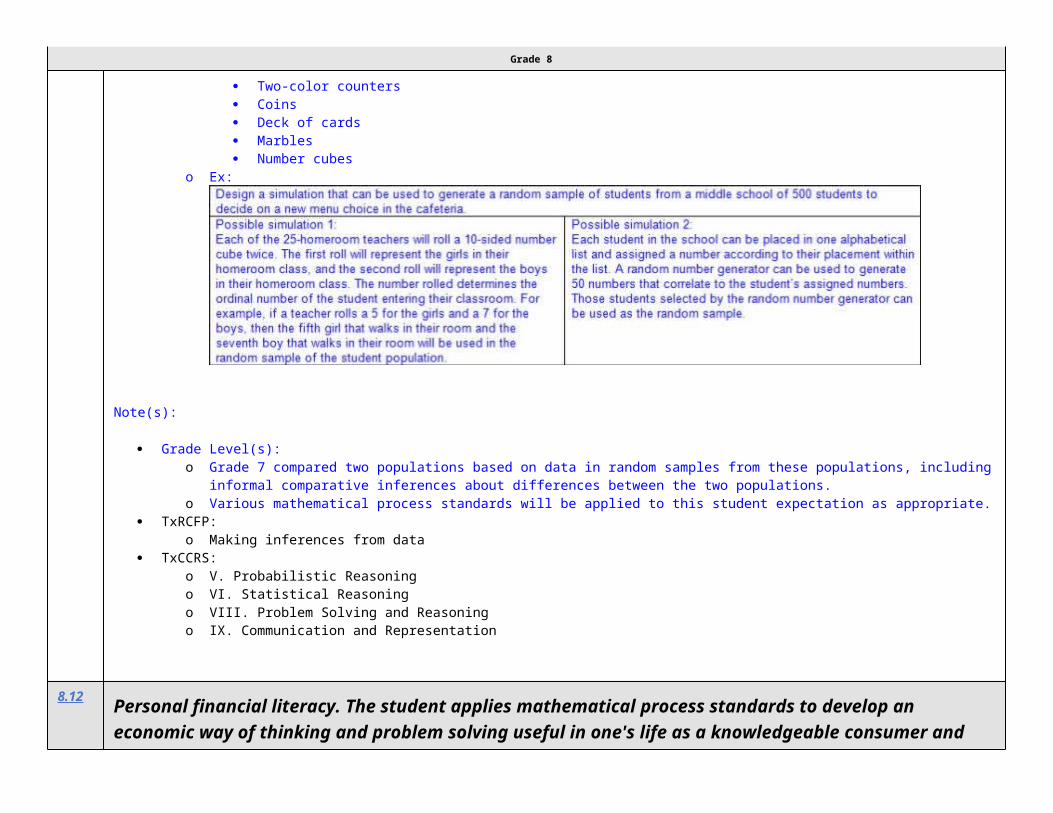
Grade 8
Note(s):
Grade Level(s):o Grade 7 calculated and compared simple interest and compound interest earnings.o Various mathematical process standards will be applied to this student expectation as appropriate.
TxRCFP:o Financial Literacy
TxCCRS:o I. Numeric Reasoningo VIII. Problem Solving and Reasoningo IX. Communication and Representationo X. Connections
8.12E Identify and explain the advantages and disadvantages of different payment methods.
Identify and explain the advantages and disadvantages of different payment methods.Identify, ExplainTHE ADVANTAGES AND DISADVANTAGES OF DIFFERENT PAYMENT METHODSIncluding, but not limited to:
Check – a written document telling the financial institution to pay a specific amount of money from your account to a specific person or organization
o Must include date, name of payee (person or organization to whom to pay), amount, and a signature from the account holdero Advantages of checks
Financial institutions can trace a check to prove your payment was or was not paid.

Grade 8
Physical copy of transaction may be obtained if duplicate (carbon copy) checks are used or if electronic scanning from a financial institution is available.
Immediate tracking of payments may help to stay within a budget. Payment form to those who do not accept other forms of payment such as credit cards, debit cards, or electronic payments Funds may be received without having a bank account. Funds may be mailed.
o Disadvantages of checks Checks usually must be purchased. Timing of withdrawals from bank account depends on when the check is cashed by the payee, which may take days or
weeks. Fees may be assessed by a financial institution and payee if the value of the check exceeds the available funds in the
account and there is not an overdraft protection.
o Bounced check Not all retailers accept checks as a form of payment. Postage may be required if mailing a check as a form of payment.
Credit card – a card that can be used to borrow money from financial institutions, stores, or other businesses in order to buy products and services on credit
o Lending company allows an individual to borrow money and pay it back over timeo Advantages of credit card
Convenience of not carrying cash, counting change, or writing in a check book Quick payment form of payment by swiping the card and signing for the purchase Repayment may occur in one payment or over time. Accepted most places as a form of payment Incentives may be offered by the lender (e.g., cash back, frequent flier miles, other reward programs, etc.). Information from credit card use and payments is linked to an individual’s credit score to determine future lending. Theft protection may be available if the card is used without authorization from the cardholder.
o Disadvantages of credit cards Fees may be assessed for using a credit card (e.g., annual membership fees, interest rates on unpaid balances, etc.). Spending may be more difficult to track Limits on the amount of money from the lender as available credit may limit purchases Failure to repay the entire amount borrowed may result in a decrease an individual’s credit score to determine future lending
and/or legal actions from the lender. Application required for each credit card obtained Not all brands of credit cards are accepted at every location (e.g., American Express, Visa, a store specific credit card, etc.). May not be accepted as a form of payment for certain purchases (e.g., school lunches, bus fare, etc.) Banking information may be compromised if lost or stolen
Debit card – a card that is linked to your checking account so that a person can withdraw money, make deposits, or make purchases at a
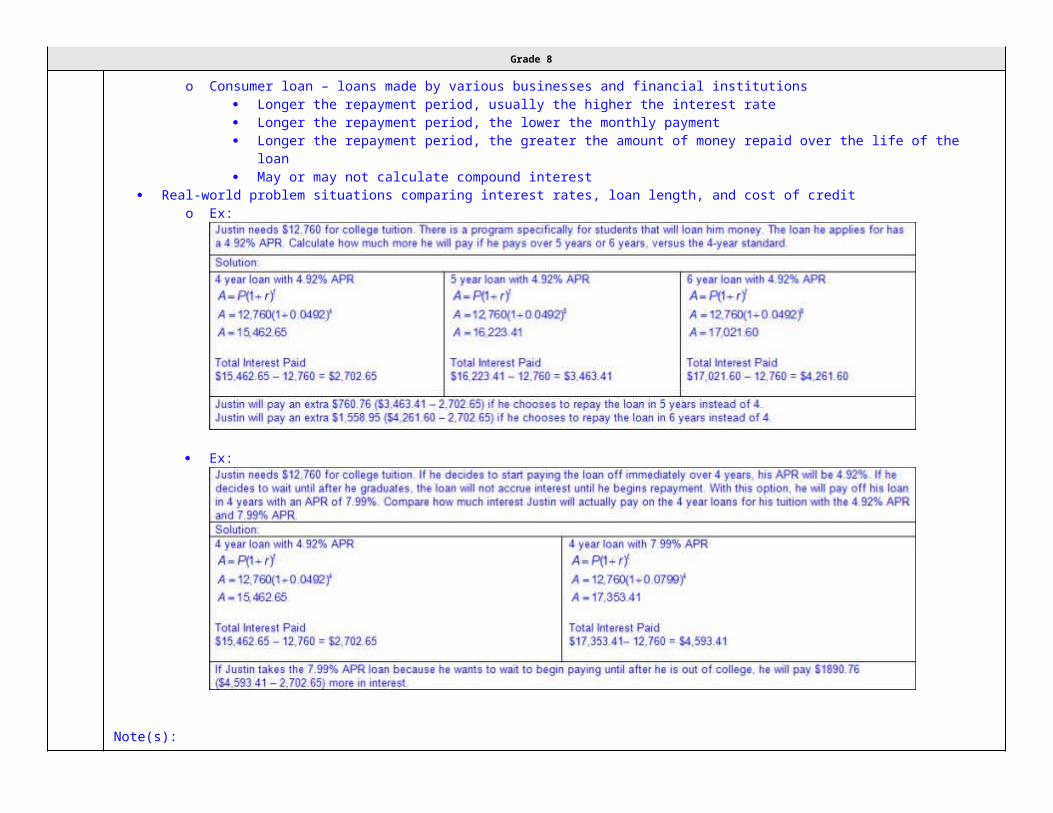
Grade 8
storeo Advantages of debit cards
Convenience of not carrying cash, counting change, or writing in a checkbook Quick payment form of payment by swiping the card and signing for the purchase or entering a personalized identification
code (PIN) Money is withdrawn from account within hours of the purchase Accepted most places No application required Incentives may be offered by the financial institution (e.g., cash back, etc.). Purchases are usually accepted only for amounts of the available balance in the account
o Disadvantages of debit cards Fees may be assessed for withdrawing money from an automated teller machine (ATM). Information is not linked to an individual’s credit score. Limits may be set by a financial institution regarding the amount of purchases that can be made within a specific time period
(e.g., $700 within a 24-hour period, etc.). Banking information may be compromised if lost or stolen Requires a bank account
Electronic payment (e-payment) – payments using security features on the Interneto Various types of electronic payments
One-time customer to vendor paymento Ex: Online shopping purchase
Recurring customer-to-vendor paymentso Ex: Payment for monthly bill (e.g., mortgage, phone service, etc.)
Automatic bank-to-vendor paymento Ex: Payments initiated at time of purchase (e.g., car payments, life insurance, etc.)
o Advantages of electronic payments Convenience of not carrying cash, counting change, or writing in a check book Quick form of payment by entering banking information No postage needed to mail payment May be set up as reoccurring payment
o Disadvantages of electronic payments Bank information may be compromised if an unsecure website is used to make a purchase
Casho Advantages of cash
Quick payment form of payment Accepted for most purchases
o Disadvantages of cash Finite limit of funds available

Grade 8
May be difficult to track spending Have to carry cash
Note(s):
Grade Level(s):o Grade 6 described the information in a credit report and how long it is retained.o Various mathematical process standards will be applied to this student expectation as appropriate.
TxRCFP:o Financial Literacy
TxCCRS:o IX. Communication and Representationo X. Connections
8.12F Analyze situations to determine if they represent financially responsible decisions and identify the benefits of financial responsibility and
the costs of financial irresponsibility.
Analyze situations to determine if they represent financially responsible decisions and identify the benefits of financial responsibility and
the costs of financial irresponsibility.AnalyzeSITUATIONS TO DETERMINE IF THEY REPRESENT FINANCIALLY RESPONSIBLE DECISIONSIncluding, but not limited to:
Characteristics of financially responsible decisionso Reserving high-interest credit card for emergencies (only use if necessary)o Planning a budgeto Staying within a planned budgeto Consistently invest to create savings for various timeframes and needs (e.g., emergency funds, car, college savings, home down
payment, retirement savings, etc.)o Make payments toward debt aggressively and/or do not create any new debt beyond what is necessary (e.g., home mortgage, etc.)o Ex:

Grade 8
Characteristics of financially irresponsible decisionso Create and/or increase debt quickly without financial planningo Create long term debto Promise to pay without consulting budgeto Making promises to pay that are not within planned budgeto Putting needs on a high-interest credit card (e.g., groceries, etc.)o Ex:
IdentifyTHE BENEFITS OF FINANCIAL RESPONSIBILITY AND THE COSTS OF FINANCIAL IRRESPONSIBILITYIncluding, but not limited to:
Various benefits of financial responsibilityo Interest on investmentso Earning good credit scores
Various costs of financial irresponsibilityo Insufficient fundso Overdraft feeso Compounding interest charges

Grade 8
o Earning poor credit scores
Note(s):
Grade Level(s):o Grade 8 introduces analyzing situations to determine if they represent financially responsible decisions and identifying the benefits of
financial responsibility and the costs of financial irresponsibility.o Various mathematical process standards will be applied to this student expectation as appropriate.
TxRCFP:o Financial Literacy
TxCCRS:o VIII. Problem Solving and Reasoningo IX. Communication and Representationo X. Connections
8.12G
Estimate the cost of a two-year and four-year college education, including family contribution, and devise a periodic savings plan for
accumulating the money needed to contribute to the total cost of attendance for at least the first year of college.
Supporting StandardEstimate the cost of a two-year and four-year college education, including family contribution, and devise a periodic savings plan for
accumulating the money needed to contribute to the total cost of attendance for at least the first year of college.
Supporting StandardEstimateTHE COST OF A TWO-YEAR AND FOUR-YEAR COLLEGE EDUCATION, INCLUDING FAMILY CONTRIBUTIONIncluding, but not limited to:
Various considerations for each collegeo School related costs
Tuition (in state or out of state)
Grade 8
Fees Room and board Books Cost of living in location (various costs of living depending on the city and state of college) Inflation – the general increase in prices and decrease in the purchasing value of money
o When planning ahead of time for college savings, the increase in all expenses based on inflation must be considered (e.g., tuition, room and board, etc.)
o Family contributiono Ex:
DeviseA PERIODIC SAVINGS PLAN FOR ACCUMULATING THE MONEY NEEDED TO CONTRIBUTE TO THE TOTAL COST OF ATTENDANCE FOR AT LEAST THE FIRST YEAR OF COLLEGEIncluding, but not limited to:
Various methods to pay for college

Grade 8
o Savings account – a bank or credit union account in which the money deposited earns interest so there will be more money in the future than originally deposited
Traditional savings account – money put into a savings account much like paying a monthly expense such as a light bill or phone bill
Taxable investment account – many companies will create an investment portfolio with the specific purpose of saving and building a strong portfolio to be used to pay for college
Annuity – deductible and non-deductible contributions may be made, taxes may be waived if used for higher education; sold by financial institutions
U.S. savings bond – money saved for a specific length of time and guaranteed by the federal government 529 account – educational savings account managed by the state
o Grant – money that is awarded to students usually based on need with no obligation to repay this moneyo Scholarship – money that is awarded to students based on educational achievement with no obligation to repay this moneyo Student loan – borrowed money that must be paid back with interest
Direct subsidized federal student loan – a loan issued by the U.S. government in an amount determined by the college available to undergraduate students who demonstrate a financial need where the U.S. Government pays the interest on the loans while the student is enrolled at least half-time, up to six months after leaving school, or during a requested deferment period
Direct unsubsidized federal student loan – a loan issued by the U.S. government in an amount determined by the college available to undergraduate or graduate students where the interest is paid by the borrower from the time the loan is initiated, even during requested deferment or forbearance periods
Private student loan – a loan issued by a lender other than the U.S. Governmento Work study – programs that allow students to work in exchange for a portion of their tuitiono Family contribution
Plan for saving for collegeo Estimate the total cost of attendance for each year at the collegeo Determine what, if any, scholarships, grants, or family contributions will be receivedo Determine if a savings account was established to pay for collegeo Determine if any additional income will be received through work-study programs or outside employmento Determine if student loans are available to cover any remaining costs for attending college
Note(s):
Grade Level(s):o Grade 6 compared the annual salary of several occupations requiring various levels of post-secondary education or vocational
training and calculated the effects of the different annual salaries on lifetime income.o Various mathematical process standards will be applied to this student expectation as appropriate.

Grade 8
TxRCFP:o Financial Literacy
TxCCRS:o I. Numeric Reasoningo VIII. Problem Solving and Reasoningo IX. Communication and Representationo X. Connections
Bibliography:Texas Education Agency & Texas Higher Education Coordinating Board. (2009). Texas college and career readiness standards. Retrieved from http://www.thecb.state.tx.us/collegereadiness/crs.pdf
Texas Education Agency. (2013). Introduction to the revised mathematics TEKS – kindergarten-algebra I vertical alignment. Retrieved fromhttp://www.projectsharetexas.org/sites/default/files/resources/documents/K-AlgebraIVAChart.pdf
Texas Education Agency. (2013). Texas response to curriculum focal points for kindergarten through grade 8 mathematics. Retrieved fromhttp://projectsharetexas.org/resource/txrcfp-texas-response-curriculum-focal-points-k-8-mathematics-revised-2013
Bold black text in italics: Knowledge and Skills Statement (TEKS); Bold black text: Student Expectation (TEKS)Bold red text in italics: Student Expectation identified by TEA as a Readiness Standard for STAAR
Bold green text in italics: Student Expectation identified by TEA as a Supporting Standard for STAARBlue text: Supporting information / Clarifications from TCMPC (Specificity)
Black text: Texas Education Agency (TEA); Texas College and Career Readiness Standards (TxCCRS)