spectrix.netspectrix.net/2017oct6/uswp5c19_36_02-f.758-update.docx · web viewthis recommendation...
TRANSCRIPT

U.S. Radiocommunications SectorFact Sheet
Working Party: ITU-R WP 5C Document No: USWP5C19_36_020
Ref: Document 5C/292/Annex 13 Date: 02 October 2017
Document Title: Working document toward a preliminary draft revision of Recommendation ITU-R F.758-6 - System parameters and considerations in the development of criteria for sharing or compatibility between digital fixed wireless systems in the fixed service and systems in other services and other sources of interference
Author(s)/Contributors(s):
Brian M. PattenNTIA
Eric P. LeeDISA DSO
Tito E. Alvarez Jr.MITRE support to DISA DSO
Phone: 202-482-0819Email: [email protected]
Phone: 301-225-3792Email: [email protected]
Phone: 703-983-3839Email: [email protected]
Purpose/Objective: This contribution will provide a few additional editorials to correct errors made in updating systems (particularly for the 26 GHz system) in the tables and add a complementary P-MP system to go with the previously suggested update.
Abstract: This contribution will correct bandwidths for the 26 GHz system and insert wider gain values to take into account legacy systems (Table 8). It was requested by the WP 5C meeting to add a complementary system to the suggested P-MP system upgrade in Table 13. Adjust the language in section 4.7 to explain the philosophy of how to use the tables.
/TT/FILE_CONVERT/5B0CEBCC7F8B9A952F8CC1E8/DOCUMENT.DOCX 04/10/2017 01:09:00 PM 01/06/2017 12:51:00 PM

- 2 -5C/292 (Annex 13)-E
Introduction
The proposed modifications .continue to progress the revision of Recommendation ITU-R F.758-6. Specific changes including moving the 128-QAM system in the 24.25 – 29.5 GHz to the right column and [restoring the 16-QAM or adding a QPSK] system to the left column. The technical parameters in the respective columns have also been verified.
Proposal
Attachment: Proposed modifications to working document toward a preliminary draft revision of RECOMMENDATION ITU-R F.758-6
__________
/TT/FILE_CONVERT/5B0CEBCC7F8B9A952F8CC1E8/DOCUMENT.DOCX 04/10/2017 01:09:00 PM 01/06/2017 12:51:00 PM
Radiocommunication Study Groups
Received: Date 2017
Subject: 5C/292 Annex 13
Document 5C/XX-E30 October 2017English only
United States of America
PROPOSED MODIFICATIONS TO WORKING DOCUMENT TOWARD A PRELIMINARY DRAFT REVISION OF RECOMMENDATION ITU-R F.758-6
System parameters and considerations in the development of criteriafor sharing or compatibility between digital fixed wireless systems
in the fixed service and systems in other servicesand other sources of interference

- 3 -5C/292 (Annex 13)-E
ATTACHMENT
Annex 13 to Working Party 5C Chairman's Report
WORKING DOCUMENT TOWARD A PRELIMINARY DRAFT REVISION OF RECOMMENDATION ITU-R F.758-6*
System parameters and considerations in the development of criteriafor sharing or compatibility between digital fixed wireless systems
in the fixed service and systems in other servicesand other sources of interference
(Question ITU-R 252/5)(1992-1997-2000-2003-2005-2012-2015-20XX)
Summary for draft revisionTechnical characteristics of FS systems in the Tables 6 to 13 are updated/added. Editorial changes were made throughout the document to improve readability and clarity of the document.
Scope
This Recommendation contains principles for the development of sharing criteria of digital systems in the fixed service. Considerations are mainly given on how to properly design performance and availability degradations due to interference within the allowable objectives, as specified in Recommendation ITU-R F.1094, under the various interference environments. It also contains information on representative technical characteristics and typical system sharing parameters of digital fixed wireless systems in the fixed service for use in sharing studies above about 30 MHz. In cases where analyses indicate sharing issues, additional information on specific fixed systems deployed by administrations can be found in Report ITU-R F.2108.
KeywordsFixed service, sharing criteria, compatibility
The ITU Radiocommunication Assembly,
considering
a) that it is necessary to establish sharing criteria between the fixed service (FS) and other services in frequency bands where both services are allocated with equal rights;b) that sharing may be managed by determining allowable values of performance and availability degradations of fixed wireless systems (FWS) caused by interference from other radio services allocated in the same frequency bands as the FS with equal rights;
c) that compatibility with systems of other services having allocation in the same band on a secondary basis, unwanted emissions from any other systems of services outside the band under
* This Recommendation should be brought to the attention of Radiocommunication Study Groups 4, 6 and 7.
/TT/FILE_CONVERT/5B0CEBCC7F8B9A952F8CC1E8/DOCUMENT.DOCX 04/10/2017 01:09:00 PM 01/06/2017 12:51:00 PM

- 4 -5C/292 (Annex 13)-E
consideration, falling into a band allocated to the fixed service on a primary basis, and emissions from sources other than radio services need also to be taken into account;d) that principles for apportioning the performance and availability degradation among the different elements of the FWS and between each interference source, need to be established;e) that the technical characteristics of each service need to be understood in order to derive interference criteria corresponding to the allowable degradation in performance and availability of the FWS;f) that performance and availability degradation may result from both long-term and short-term interference and hence both long-term and short-term interference criteria need to be established;g) that availability of a basic methodology for the development of sharing criteria for the FS is useful for other ITU-R Study Groups,
noting
a) that characteristics of digital and analogue fixed systems based on previous versions of the Recommendation are contained in Report ITU-R F.2108;
b) that Recommendation ITU-R F.1094 provides the overall apportionment principle of the performance and availability degradations to the FS due to interference from other services or sources,
recommends1 that the development of sharing criteria and assessment of interference conditions between the FS and other services and other sources of interference should be considered in accordance with the principles described in Annex 1;2 that the information provided in Annex 2 should be considered as guidance to the technical characteristics and typical system parameters of digital fixed wireless FS systems that need to be taken into account when developing criteria for sharing with other services;3 that the system parameters in the tables in Annex 3 may be used as supplementary information for the bands for which Annex 2 does not provide typical parameters.
ANNEX 1
Basic considerations in the development of sharing criteria
1 Overall performance objectiveOne of the functions of a radiocommunication planner is to design and implement a transmission network which meets the performance objectives laid down by the ITU-T and ITU-R. It is important, therefore, that real systems can meet the appropriate design objectives, recognizing the increasing use of the radio spectrum. There are various ITU-R F-Series Recommendations that relate to the overall performance objective for various types of circuit.
/TT/FILE_CONVERT/5B0CEBCC7F8B9A952F8CC1E8/DOCUMENT.DOCX 04/10/2017 01:09:00 PM 01/06/2017 12:51:00 PM

- 5 -5C/292 (Annex 13)-E
1.1 Error performance and availability objectives
1.1.1 ITU-T and ITU-R Reference Recommendation
Error performance objectives for real digital fixed wireless links used in 27 500 km hypothetical reference paths and connections are given in Recommendation ITU-R F.1668, Error performance objectives for real digital fixed wireless links used in 27 500 km hypothetical reference paths and connections, based on Recommendations ITU-T G.826, ITU-T G.828 and ITU-T G.829. It is the only Recommendation defining error performance objectives for all real digital fixed wireless links. NOTE 1 – The applicability of older Recommendations ITU-R F.634, ITU-R F.696 and ITU-R F.697 is limited to systems designed prior to the approval of Recommendation ITU-T G.826 (December 2002).
Availability objectives for real digital fixed wireless links used in 27 500 km hypothetical reference paths and connections are given in Recommendation ITU-R F.1703, based on Recommendation ITU-T G.827. It is the only Recommendation defining availability objectives for all real digital fixed wireless links. NOTE 2 – The applicability of older Recommendations ITU-R F.695, ITU-R F.696 and ITU-R F.697 is limited to systems designed prior to the approval of RecommendationITU-R F.1703 (January 2005).
Most new applications are for systems using a single or a small number of hops (for example,for cellular network backhaul or for connecting remote areas to metropolitan area networks). Nevertheless, the interference protection of each hop continues to be based on the Recommendations cited above.
1.1.2 Time basis for evaluation
1.1.2.1 General principles
Availability evaluation is made on a time basis of one year, as established by ITU-T (G.827) and is independent from the actual transport media.
Error performance evaluation is made on a time basis of one month, as established by ITU-T (G.826) and is independent from the actual transport media. In particular, since radio propagation is characterized by large variability depending on season and climate, the objectives are intended to be fulfilled in the worst month (which concept is clarified in Recommendation ITU-R P.581).
When necessary, for prediction purposes, conversion of annual statistics to worst-month statistics is addressed in Recommendation ITU-R P.841.
In case of radio connections affected by interference from any source, the overall error performance and availability evaluations include the additional effect of interference within the appropriate time basis above.
It should be noted that the concepts of “long-term” and “short-term” interference (see § 4.1 and 4.2 in this Annex 1) are not directly correlated with the “month” or “year” time basis. Both types of interference, depending on their time and level variability, may, in principle, affect the “error performance” (on month basis), but only interference longer than 10 consecutive seconds may affect the “availability” (on year basis) of FS systems.
The latter will normally only be seen in long-term interference, but in special cases may include short-term interference.
/TT/FILE_CONVERT/5B0CEBCC7F8B9A952F8CC1E8/DOCUMENT.DOCX 04/10/2017 01:09:00 PM 01/06/2017 12:51:00 PM

- 6 -5C/292 (Annex 13)-E
1.1.2.2 Practical applications
According to the principles described above, whenever a sharing or compatibility situation with FS systems arises, different studies are necessary for separately evaluating the impact of the interference on FS availability (on year basis) and FS error performance (on month basis).
However, in some practical cases, both studies are not necessary due to the expected physical situation of the wanted and unwanted paths.
In particular, when the interference into FS victim is constantly present (e.g. from a GSO space station), it is generally assumed that the acceptable level of interference should be sufficiently low for not affecting the FS system availability threshold, on a yearly basis. In this case, ensuring the suitable FS availability degradation, it is generally assumed that any related “error performance” degradation would be within the acceptable limits (in any month) and no specific study is required.
On the contrary, when the interference into the FS victim is relatively fast varying (e.g. from a non-GSO space station), it is generally assumed that, due to uncorrelated wanted and unwanted paths, the acceptable interference level may be higher, so that the “error performance” degradation would predominate over the possible “availability” degradation. In this case, the “error performance” degradation study should be carried out on the “worst month” basis (see example in Recommendations ITU-R F.1108 and ITU-R F.1495).
In principle, it is expected that, when the variability of the interference is slowing down (quasi static situations), there might be a speed threshold where both “availability” and “error performance” degradations might be equally impacted. In such cases, specific studies should be carried out for both cases with their appropriate time basis.
2 Sub-division of the performance and availability objectivesThe previous section dealt with the overall performance objectives for digital reference connections. However, there are, in practice, a large number of potential sources of interference contributing to the degradation of performance of a fixed wireless system. In order to move towards a practical method for planning, the overall performance objectives need to be subdivided between individual sections of the overall hypothetical reference connections (HRX) and hypothetical reference path (HRP). Within a section, the performance objective is then apportioned between the various sources.
2.1 Apportionment of section error performance and availability objective
This is covered in Recommendation ITU-R F.1094, Maximum allowable error performance and availability degradations to digital fixed wireless systems arising from radio interference from emissions and radiations from other sources. The allowable performance objective is divided into an element of X% for the FS portion, Y% for frequency sharing on a primary basis, and Z% for all other sources of interference (it should be noted that X% + Y% + Z% = 100%) where X, Y, and Z are typically 89%, 10%, and 1%, respectively. There may be a further subdivision of the X% allowance to suit local requirements and this could be apportioned in such a way as to suit the grade of service (see § 4.1.3).
A particular point to note is that an interference source (say a transmitter Tx) may affect more than one hop of a system.
2.2 Apportionment of performance and availability degradation to different services
When establishing the sharing criteria with other co-primary services, it may be necessary to consider the apportionment of the error performance objective (EPO) and availability performance
/TT/FILE_CONVERT/5B0CEBCC7F8B9A952F8CC1E8/DOCUMENT.DOCX 04/10/2017 01:09:00 PM 01/06/2017 12:51:00 PM
- 7 -5C/292 (Annex 13)-E
objectives (APO) to short-term and long-term interferences (see the introductory part in § 4). Then, the following points should be taken into consideration:a) For the band shared by the FS and one radio service on a primary basis,
performance/availability degradation Y1% of the FS caused by the interference from other services should not exceed 10% of the objective in accordance with Recommendation ITU-R F.1094.
b) After the establishment of the sharing criteria with the first co-primary service, performance/availability degradation Y2% of the FS caused by the interference from another co-primary service sharing the same band may be developed as follows: – multi-interference environment due to both services should carefully be
examined, in particular the case leading to the allowance limit of Y1% and simultaneously receiving additional interference from the second co-primary service;
– then the limit of Y2 could be derived from a typical interference model for the FS and the second co-primary service taking also into account potential effect of the first co-primary service in that model.
3 Characteristics of interferenceIt is necessary to have information available on interference levels arising from other services, which would degrade system performance by specific amounts. This would be facilitated if, with the assistance from other Study Groups, a table were compiled giving information on the characteristics of emissions.
Two categories of interference are worth considering:– for sharing studies, the interference arising from services sharing the same band on a
primary basis that is likely to be within the receiver (Rx) bandwidth from digital modulations, in either carrier wave or burst emissions. Reference can be made to existing text where available in ITU-R F-Series and SF-Series Recommendations (e.g. Recommendation ITU-R SF.766);
– for compatibility studies, emissions from systems other than those sharing the same band on a primary basis that could be numerous and diverse, produced either by continuous or pulse and/or burst emissions, and may be considered in a similar way to the spurious emissions. Such emissions could be either from systems/applications operating in the same band on a secondary basis as well as from unwanted emissions from systems operating in other bands.
Ultimately, another table could be prepared, again with the assistance of other Radiocommunication Study Groups, which compares levels of interference or Gaussian noise required to produce a specified degradation in the channel performance.
4 Considerations on allowable performance/availability degradations due to interference and related interference criteria
Methods for characterizing interference levels into terrestrial FWS include power flux-density (pfd), the power level at the input to the antenna or the power level at the receiver input. It is worth noting that all of these methods are in use in ITU-R F- and ITU-R SF-Series Recommendations.
In general, the received power due to an interferer is not constant, but it varies because of varying propagation conditions of the interfering path or because of motion of the interfering transmitter. The propagation conditions that are of greatest significance on interfering paths are ducting and
/TT/FILE_CONVERT/5B0CEBCC7F8B9A952F8CC1E8/DOCUMENT.DOCX 04/10/2017 01:09:00 PM 01/06/2017 12:51:00 PM

- 8 -5C/292 (Annex 13)-E
tropo-scatter. Propagation conditions, including multi-path fading, rain fading, and diffraction fading, may also cause the received power of the desired signal to vary (system fade), which requires the system to have an adequate fade margin. The variations in the received power of the desired and interfering signals may, or may not, be correlated depending on the frequency band and the interference geometry.
To simplify the analysis of interference, separate consideration is given to short-term interference, which is the term used to describe the highest levels of interference power that occur for less than 1 per cent of the time, and to long-term interference, which addresses the remaining portion of the interference power distribution.
When the desired signal fades, the percentage of time for which a performance threshold is violated will increase slightly because of the interference power that is present when the signal fades near the threshold. In considerations of the interference under these conditions, the interference is referred to as long-term interference. Long-term interference degrades the error performance and availability of a system by reducing the fade margin that is available to protect the fixed service system against fading. In sharing and compatibility studies, long-term interference is usually characterized as the interference power that is exceeded by 20% of the time, at the victim receiver input. This is the power level that would be used in Tables 2, 3A and 3B in the following §§ 4.1.1 and 4.1.2. For the percentages of time applied to the protection criteria see § 1.1.2.
Short-term interference requires separate consideration because the interference power may be high enough to produce degradation even when the desired signal is unfaded. Such interference must occur rarely enough and in events of short duration for the interference to be acceptable. A short-term interference criterion is set based on the interference power necessary to cause a particular error performance defect (such as an errored second) when the desired signal is unfaded. This is the approach taken in RR Appendix 7, and Recommendations ITU-R SM.1448, ITU-R F.1494, ITU-R F.1495, ITU-R F.1606, ITU-R F.1669 and ITU-R SF.1650.
Because permissible error performance defects can only occur for percentages of time that are much smaller than 1% of the time if error performance objectives are to be met, short-term interference studies require knowledge of the interference power that is exceeded for percentages of time much less than 1 per cent. The interference criterion for a particular error performance defect is specified by the power level (relative to the receiver noise) and the percentage of time allocated for this defect.
In sharing and compatibility studies in the frequency bands where multipath fading is the dominant propagation impairment for FS receivers (mostly in frequency bands below about 15 GHz), the fadings on the desired and interfering paths are uncorrelated. Under these conditions, Recommendation ITU-R F.1108 introduced the Fractional Degradation in Performance (FDP) method, which shows that it is appropriate to use the average value of the interference power as the critical value for long-term interference power. However, in this calculation, the average power must be determined while excluding periods of time when the interference power levels exceed the limit used for the short-term interference criteria. (Recommendation ITU-R F.1108 gives a relevant example applied to NGSO.)
In frequency bands where rain is the dominant factor, the use of FDP in considerations of long-term interference is not appropriate for two reasons: 1) The distribution of the fading of the desired signal must be independent of the distribution of the received interference power so that their joint distribution density can be represented by the product of the individual distribution densities;2) The percentage of time that a fade depth of the desired signal is exceeded must be decreased by a factor of 10 for a 10 dB increase in fade depth. This is the characteristic of multipath fading as noted in Recommendation ITU-R P.530. In these bands, it is considered sufficient to ensure that all degradation of error performance and availability requirements allocated to long-term interference
/TT/FILE_CONVERT/5B0CEBCC7F8B9A952F8CC1E8/DOCUMENT.DOCX 04/10/2017 01:09:00 PM 01/06/2017 12:51:00 PM

- 9 -5C/292 (Annex 13)-E
are met using the level of the time-varying interference representing the 20% of time definition for long-term interference criterion, and that the interference power distribution meets the error performance degradation criteria developed for short-term interference. Interference power that is between the percentage of time defined for short-term criteria (< 1% of the time) and the time defined for the long-term criteria (> 20% of the time) could be evaluated on a case-by-case basis, but such considerations should take into account also the occurrence of interference power levels that are less than that expected for 20% of the time.
When continuously pulsed or burst interference emissions are considered, their impact on fixed service systems should be determined based on the coupling mechanism for the interference and not by the duty-cycle characteristics of the interfering signal. (E.g. a radar emission with less than 1% duty cycle should be evaluated both as a long-term and/or short-term interference, as appropriate.)
The number and values of the interference criteria necessary to protect a fixed wireless system will depend on the characteristics of the fixed wireless system and the interferer. In case of time varying interference, a single interference criterion may not be adequate; two or three values, corresponding to a long term (20% of time) and short terms (< 1% of time) have been specified in some Recommendations.
It should be noted that the events where error performance is degraded are events of very short duration because of the stringent requirements of error performance objectives.
The number of short-term interference criteria corresponds to the number of error performance criteria that are appropriate for the sharing scenario. The exact percentage of time associated with a short-term interference criterion is related to a performance objective for the system under consideration; more information on fulfilling short-term interference objectives can be found in Recommendations ITU-R F.1494, ITU-R F.1495 and ITU-R F.1606, all of which deal with protection criteria applicable to time-varying interference.
Table 1 lists the references relating to performance/availability objectives and sharing between the FS and other primary services concerning interference into the FS.
The error performance and availability objectives should be fulfilled independently whether they are resulting from long-term or short-term interference.
/TT/FILE_CONVERT/5B0CEBCC7F8B9A952F8CC1E8/DOCUMENT.DOCX 04/10/2017 01:09:00 PM 01/06/2017 12:51:00 PM

- 10 -5C/292 (Annex 13)-E
TABLE 1
ITU-R Recommendations relating to frequency sharing between the FSand other primary services
Recommendation ITU-R Title
F.1094 Maximum allowable error performance and availability degradations to digital fixed wireless systems arising from radio interference from emissions and radiations from other sources
F.1108 Determination of the criteria to protect fixed service receivers from the emissions of space stations operating in non-geostationary orbits in shared frequency bands
F.1334 Protection criteria for systems in the fixed service sharing the same frequency bands in the 1 to 3 GHz range with the land mobile service
F.1338 Threshold levels to determine the need to coordinate between particular systems in the broadcasting-satellite service (sound) in the geostationary-satellite orbit for space-to-Earth transmissions and the fixed service in the band 1 452-1 492 MHz
F.1494 Interference criteria to protect the fixed service from time varying aggregate interference from other services sharing the 10.7-12.75 GHz band on a co-primary basis
F.1495 Interference criteria to protect the fixed service from time varying aggregate interference from other radiocommunication services sharing the 17.7-19.3 GHz band on a co-primary basis
F.1565 Performance degradation due to interference from other services sharing the same frequency bands on a co-primary basis with real digital fixed wireless systems used in the international and national portions of a 27 500 km hypothetical reference path at or above the primary rate
F.1606 Interference criteria to protect fixed wireless systems from time varying aggregate interference produced by non-geostationary satellites operating in other services sharing the 37-40 GHz and 40.5-42.5 GHz bands on a co-primary basis
F.1668 Error performance objectives for real digital fixed wireless links used in 27 500 km hypothetical reference paths and connections
F.1669 Interference criteria of fixed wireless systems operating in the 37-40 GHz and 40.5-42.5 GHz bands with respect to satellites in the geostationary orbit
F.1670 Protection of fixed wireless systems from terrestrial digital video and sound broadcasting systems in shared VHF and UHF bands
F.1703 Availability objectives for real digital fixed wireless links used in 27 500 km hypothetical reference paths and connections
F.1706 Protection criteria for point-to-point fixed wireless systems sharing the same frequency band with nomadic wireless access systems in the 4 to 6 GHz range
SF.1006 Determination of the interference potential between earth stations of the fixed-satellite service and stations in the fixed service
SF.1650 The minimum distance from the baseline beyond which in-motion earth stations located on board vessels would not cause unacceptable interference to the terrestrial service in the bands 5 925-6 425 MHz and 14-14.5 GHz
4.1 Long-term interference
Recommendation ITU-R F.1094 lays the foundations for the apportionment of EPO and APO.
In this section, relations between the following two issues a) and b) are considered with the exclusion of short-term interference considerations:a) Degradation in the error performance (EP) or the availability performance (AP)
resulting from interference from the co-primary service, which is clearly specified as 10% in Recommendation ITU-R F.1094 (and also in Recommendation ITU-R F.1565).
/TT/FILE_CONVERT/5B0CEBCC7F8B9A952F8CC1E8/DOCUMENT.DOCX 04/10/2017 01:09:00 PM 01/06/2017 12:51:00 PM

- 11 -5C/292 (Annex 13)-E
b) Degradation in fade margin due to the interference, which is directly calculated from (I/N) value, as 10 log ((N + I)/N) = 10 log ((1 + (I/N))) (dB).
It should be noted that the I/N ratio is generally defined in terms of mean (root-mean-square (rms)) power of both noise and interference; however, when continuously pulsed/burst interference emissions are concerned, their peak-to-mean power ratio might play a significant role in defining the protection criteria.
When the peak-to-mean power ratio becomes very high and the fixed service receiver bandwidth becomes large, it may be necessary to take into account an I/N objective in terms of peak interference integrated over the whole victim bandwidth to correctly evaluate the fade margin degradation due to the interference. Background on high peak interference impact and protection criteria may be found in Recommendation ITU-R F.1097, for radar interference, and Recommendation ITU-R SM.1757, further detailed in Report ITU-R SM.2057, for UWB-SRR (ultra-wideband short-range radars) interference.
In the following sections, guidance is given only for the more usual cases where the mean (rms) interference power evaluation is appropriate.
4.1.1 Effect of fade margin reduction in bands where multipath is a dominant factor
In cases where the performance of digital systems is dominated by multipath fading (e.g. at frequencies below about 17 GHz), the introduction of an aggregate interference contribution that is 10 dB below the system noise floor causes a 10% increase in the time that the system carrier-to-noise plus interference (C/(N + I)) ratio is below a critical value. Any temporal characteristics of the exposure of the FS to interference will also need to be taken into account with respect to the error performance objectives in determining the degradation in performance.
Furthermore, it should be noted that many FWS employ space diversity reception in the bands where multipath is the dominant fade effect, and that the receiving power in systems using diversity is subject to more moderate distribution than Rayleigh fading. Therefore, such systems achieve the same performance as a non-diversity implementation, but with a much smaller fade margin. The same degradation in fade margin will more impact systems with diversity reception resulting in about two times EP degradation. Table 2 indicates these relations between them for three (I/N) values.
TABLE 2
Degradation in error performance due to multipath fading
Interference level relative to receiver thermal noise (dB)
Resultant degradation
in fade margin(dB)
Resultant degradation in EP (Note 1)
Systems without space diversity
Systems with space diversity
–6 1 25% 50%–10 0.5 10% 20%
–13 0.2 5% 10%
NOTE 1 – Multipath fading subject to Rayleigh distribution and the typical space diversity effect are considered. The numbers would be different for different fading distributions.
Using typical parameters and probabilistic distributions given in Recommendation ITU-R P.530, example calculation results are given in Tables 3A and 3B, each providing relations between the (I/N) value and resultant AP degradation for a link with a hop length of 6 km and 3 km,
/TT/FILE_CONVERT/5B0CEBCC7F8B9A952F8CC1E8/DOCUMENT.DOCX 04/10/2017 01:09:00 PM 01/06/2017 12:51:00 PM
- 12 -5C/292 (Annex 13)-E
respectively. Interpretation of the figures in Tables 3A and 3B, for example, is that, if the nominal margin 42.9 dB is degraded by 1 dB (down to 41.9 dB), the link AP specified at an unavailability ratio of 0.001% in the absence of interference will increase to 0.001085% (8.5% increase) with interference.
General observation is that resultant degradation in AP is greater in systems having a smaller nominal fade margin. System designers should consider all the related parameters including propagation information when developing a sharing criterion in terms of (I/N) value.
It should be noted that the example calculations of the resultant degradations of AP and fade margin in Tables 3A and 3B are based on uncorrelated rain fade. If the effects of correlated rain fade are taken into account, the resultant numbers may become smaller values. An example of this effect can be found in Recommendation ITU-R F.1669.
TABLE 3A
Degradation in AP due to rainfall fading (Radio frequency: 23 GHz, Link length: 6 km)
Climate(Rain rate
exceeded for
0.01% of time)
Interference level
relative to receiver thermal
noise(dB)
Resultant degradati
on in margin
(dB)
Specified AP without interference:
Unavailability ratio 0.01%
Specified AP without interference:
Unavailability ratio 0.001%
Nominal margin
(dB)
Resultant degradation in AP
Nominal margin
(dB)
Resultant degradation in AP
32 mm/h
–6 1 20.1 14.6% 42.9 8.5%
–10 0.5 20.1 7.0% 42.9 4.2%
–13 0.2 20.1 2.8% 42.9 1.7%
22 mm/h
–6 1 13.8 22.0% 29.6 12.6%
–10 0.5 13.8 10.3% 29.6 6.1%–13 0.2 13.8 4.0% 29.6 2.4%
TABLE 3B
Degradation in AP due to rainfall fading (Radio frequency: 23 GHz, Link length: 3 km)
Climate(Rain rate
exceeded for
0.01% of time)
Interference level
relative to receiver thermal
noise(dB)
Resultant degradati
on in margin
(dB)
Specified AP without interference:
Unavailability ratio 0.01%
Specified AP without interference:
Unavailability ratio 0.001%
Nominal margin
(dB)
Resultant degradation in AP
Nominal margin
(dB)
Resultant degradation in AP
32 mm/h
–6 1 11.2 27.8% 24.1 15.7%
–10 0.5 11.2 12.7% 24.1 7.5%
–13 0.2 11.2 4.8% 24.1 2.9%
22 mm/h
–6 1 7.6 44.3% 16.3 24.2%
–10 0.5 7.6 19.5% 16.3 11.4%–13 0.2 7.6 7.2% 16.3 4.5%
/TT/FILE_CONVERT/5B0CEBCC7F8B9A952F8CC1E8/DOCUMENT.DOCX 04/10/2017 01:09:00 PM 01/06/2017 12:51:00 PM

- 13 -5C/292 (Annex 13)-E
4.1.3 Contribution of combined receiver thermal and interference noise
The calculations in Tables 2 and 3 of the preceding sections were referenced to a power level identified as the “receiver thermal noise”. In practice the reference level should be an effective noise level that includes all the noise in the receiving system as well as the assumed interference within the fixed service as in the portion X defined in Recommendation ITU-R F.1094. Note that the other-service interference would also be referenced to this effective level. Thus, increasing the assumed value for same-service interference will reduce the performance degradation allowed by a given level of other-service interference power.
4.1.4 EP/AP degradation in multi-hop links
In Recommendation ITU-R F.1565, the EP degradation of real FWS due to interference from other co-primary services is specified for each section of the HRX. More specifically, EP degradation of real FWS could be evaluated for the entire portion of short haul inter-exchange section and access network section. In case of the long haul inter-exchange section, the minimum link length for which the EPO is specified is 50 km.
It should be noted that, if a multi-hop FWS is deployed forming all of the access network section or short haul inter-exchange section, or long haul inter-exchange section shorter than 50 km, the EPO for interference specified in Recommendation ITU-R F.1565 does not need to apply to individual hops but to the multi-hop link in total.
Similar consideration could apply to the allocation of the APO specified in Recommendation ITU-R F.1703 noting that a link is considered available only if both directions are available.
This point should be taken into account in the sharing environment where the interference does not occur significantly in every hop but affect only specific hops. For example, if only one hop is exposed to the interference within the N-hop FWS link forming all of the section, resultant EP/AP degradation should be allocated to the one exposed hop accordingly as shown in the calculation condition of Tables 2, 3A and 3B.
4.2 Short-term interference
A system must meet its EP objectives and availability objectives regardless of whether the permissible degradations are due to short-term or long-term interference events. This requires consideration of the degradations allocated to short-term interference along with the degradations allocated for long-term interference so that their sum does not exceed the permitted performance degradation.
The derivation of permitted short-term interference levels, and associated time percentages, is a complex process. Since it is detailed in several existing ITU-R Recommendations for different conditions and frequency bands, calculations are not presented here.
The procedures described in Recommendations ITU-R F.1494, ITU-R F.1495 and ITU-R F.1606, and in Annex 5 to Report ITU-R M.2119 provide examples of the development of short-term interference criteria.
5 Use of automatic transmit power control (ATPC) in digital systemsFS systems in some frequency bands may make use of ATPC. ATPC is usually activated by the level of received signal below a predefined threshold; in some cases, also a bit error ratio (BER) degradation threshold might complement the ATPC activation algorithm. Where applicable, ATPC may be taken into account when performing sharing studies involving the FS. Such studies should consider the maximum transmit power level, the range of ATPC and the distribution of FS power levels with respect to time, due to propagation loss variation.
/TT/FILE_CONVERT/5B0CEBCC7F8B9A952F8CC1E8/DOCUMENT.DOCX 04/10/2017 01:09:00 PM 01/06/2017 12:51:00 PM

- 14 -5C/292 (Annex 13)-E
In presence of relatively high interference (e.g. when short-term interference is considered) this distribution may be difficult to determine since the level of interference might cause ATPC activation (e.g. triggering the BER threshold) or prevent ATPC activation (e.g. preventing the received signal threshold to be reached) in an unpredictable way. For inter-service sharing analysis, the short-term interference evaluation into the ATPC equipped systems should nevertheless use the long-term power of the wanted transmitter rather than its maximum power, unless the interference source has the same propagation path configurations. For example, if the interference path is from a satellite-based station, there is no correlation with the wanted FS path. In such cases, it must be assumed that the wanted transmitter power is at its lowest level. If, however, the interference path is from a terrestrial source, then some correlation of fading may be assumed (see Note below). In this case, the assumed wanted power could be the maximum power of the ATPC range. More information on ATPC can be found in Recommendations ITU-R F.1494, ITU-R F.1495, ITU-R F.1606 and ITU-R F.1669.NOTE – This is mostly the case in frequency bands higher than 17 GHz, where rain is the dominant factor affecting the link propagation, for example, Recommendations ITU-R P.452 and ITU-R P.839 give information on rain cell size and rain intensity distribution (in azimuth and elevation direction) within the cells. In lower frequency bands, where multipath is the dominant factor, deep fading on the wanted-signal path and interference path are uncorrelated.
6 Calculation of actual interference levelsTo complete the analysis of sharing, the probability of interference arriving at the input to the antenna must be evaluated. This will take into account up-to-date propagation models and path factors, which are described in the ITU-R P-Series Recommendations and Reports. It is unlikely that a single model will suffice for all possible applications. The transmission loss calculation will also include factors such as absorption losses, diffraction losses, scattering loss, polarization coupling loss, aperture-to-medium coupling loss and the effect of multipath. Also, both aggregate and single-entry interference levels may need to be considered.
/TT/FILE_CONVERT/5B0CEBCC7F8B9A952F8CC1E8/DOCUMENT.DOCX 04/10/2017 01:09:00 PM 01/06/2017 12:51:00 PM

- 15 -5C/292 (Annex 13)-E
ANNEX 2
Digital FS system parameters for sharing/compatibility studies
1 IntroductionIn order to calculate degradations in performance and availability, it is necessary to know the characteristics of the FWS being degraded. There is a large variety of FWS in operation or being developed to meet future requirements. This variety in system parameters can be generalized by representative systems for specific frequency ranges where equipment operations are consistently similar. This Annex provides details of the key radio system parameters required for interference evaluation and calculations for frequency sharing studies with other services. The system parameters are presented in tabular form for the minimal number of frequency ranges required to undertake sharing studies between the FS and other services.
2 Transmitter characterization
2.1 Equipment parameters
The basic transmitter parameters needed to assess interference potential to other services are:– carrier frequency;– spectral characteristics (e.g. bandwidth and transmitter power density);– equivalent isotropically radiated power (e.i.r.p.);– antenna radiation pattern.
Operating frequencies normally correspond to radio-frequency channel arrangements specified in ITU-R Recommendations. The modulation type and radio-frequency channel arrangement will give a guide to the spectral characteristics of the emissions for generic statistical evaluations, where only co-channel interference situation is usually taken into account. However, deterministic (station-by-station) sharing calculations would require a template of the spectral characteristics to be specified so that any frequency offset rejection at a given wanted/interfering signal carrier frequency separation may be calculated.
The e.i.r.p. of the transmitter is calculated from the transmitter power, feeder/multiplexer losses and antenna gain. In principle, the maximum e.i.r.p. value would correspond to maximum antenna gain, minimum feeder/multiplexer losses and maximum transmitter output power, which represents the worst interference potential to other services; however, when sharing/compatibility studies require statistical evaluation of an aggregation of a large number of interfering FS stations or the potential interference situation may randomly appear within a large geographical area, it might not be appropriate to use the absolute worst case and a range of values to be used in a random (or other convenient statistical distribution) is more appropriate.
Knowledge of antenna radiation patterns is essential to perform detailed sharing studies. In cases where measured patterns are not available, the reference radiation patterns addressed in the following Recommendations should be used:– Recommendation ITU-R F.699, Reference radiation patterns for fixed wireless system
antennas for use in coordination studies and interference assessment in the frequency range from 100 MHz to about 70 GHz;
/TT/FILE_CONVERT/5B0CEBCC7F8B9A952F8CC1E8/DOCUMENT.DOCX 04/10/2017 01:09:00 PM 01/06/2017 12:51:00 PM

- 16 -5C/292 (Annex 13)-E
/TT/FILE_CONVERT/5B0CEBCC7F8B9A952F8CC1E8/DOCUMENT.DOCX 04/10/2017 01:09:00 PM 01/06/2017 12:51:00 PM

- 17 -5C/292 (Annex 13)-E
– Recommendation ITU-R F.1245, Mathematical model of average radiation patterns for line-of-sight point-to-point radio-relay system antennas for use in certain coordination studies and interference assessment in the frequency range from 1 GHz to about 70 GHz, and
– Recommendation ITU-R F.1336, Reference radiation patterns of omnidirectional, sectoral and other antennas in point-to-multipoint systems for use in sharing studies in the frequency range from 1 GHz to about 70 GHz.
2.2 Statistic distribution over the territory
In the past, the major application of FS links was for multi-channel, multi-hop trunk connections oriented around the known directions between switching centres of large cities or rural connection in remote areas. For both applications, the network economy generally required that each hop be designed as the longest possible with the current technology for the expected propagation behaviour. This resulted, for the large majority of FS links, in the general use of the maximum possible output power associated to the larger antenna.
Therefore, the maximum possible transmitter e.i.r.p. was, in practice, coincident with the e.i.r.p. assumed for sharing studies. Moreover, the FS station density over the territory was limited to few large telecom stations where all trunk links converged.
Nowadays, the advent of mobile networks and the need of wireless data connections in the access network have changed the typical distribution of link lengths; they are mainly defined by different considerations about the cellular system coverage (i.e. distance between base stations to be connected via FS links) or geographical location of private customers data centres with respect to the closest core network access point.
In populated areas, this resulted in denser FS networks requiring:– shorter hops, randomly deployed over the territory;– significantly different hop lengths in the same geographical area;– careful coordination of the network;– different e.i.r.p. imposed, on link per link basis, by the licensing rules for minimizing
interference and maximizing spectrum efficiency.
The above considerations, applied to sharing studies, lead to the need of a “probabilistic oriented” deployment scenario where the e.i.r.p. spreads, according to the link length, within a range of values and link directions are randomly distributed over any azimuth angle and a wider elevation range.
The achievable link length decreases as the operating frequency increases, due to fixed power output levels according to administration domestic regulatory requirements and higher propagation attenuation. Therefore, for each band, the e.i.r.p. upper bound is limited by the maximum available on the market, while the lower bound is, in practice, limited by the minimum “economic” link length in the band. In fact most licensing conditions imply a fee-per-link which decreases as the operating band increases; therefore, the user is economically encouraged to use higher bands (where equipment is also cheaper) for the shorter links instead of just reducing the e.i.r.p. in lower bands.
Therefore, the power output and e.i.r.p. ranges reported in Tables 54 through 1211 give the sensible range of values useful for “probabilistic” studies.
As the link length distribution function is ultimately related to the geographical distribution of mobile base stations or customer premises, the e.i.r.p. statistical distribution cannot be assumed
/TT/FILE_CONVERT/5B0CEBCC7F8B9A952F8CC1E8/DOCUMENT.DOCX 04/10/2017 01:09:00 PM 01/06/2017 12:51:00 PM

- 18 -5C/292 (Annex 13)-E
“Gaussian” but might be evaluated on a case-by-case basis. Appendix 1 to this Annex shows examples of these calculations.
To build an accurate probabilistic model, a sharing model should distribute the fixed service links in a nodal arrangement with random distribution over the geographical area. A weighted factor should be assumed for urban, suburban and rural locations, which roughly identify the characteristics of the FS used in average, to distribute the fixed nodes more accurately.
The weighting factor is dependent on the kind of fixed service to be deployed and should be determined on a case-by-case basis. The actual percentage subdivision in these geographical areas may vary from country to country. As an example, in one country, values of 60% / 30% / 10% are used for urban, suburban and rural, respectively.
3 Receiver characterization
3.1 Equipment parameters
Assessment of the effects of interference into the FS from other services requires knowledge of the performance characteristics of the radio receiver. The following receiver parameters are important for frequency sharing studies:– noise figure;– noise bandwidth;– receiver thermal noise power density;– received signal power for 1 10−3, 1 10−6, 1 10−10 BER (post-error-correction)
(Refer to Note 1);– nominal receiver input level.NOTE 1 – Typically, for uncoded systems, the carrier level corresponding to 1 10−6 BER is around 4 dB higher than that for 1 10–3 BER; the carrier level difference between the 1 10−6 and 1 10−10 BER points is also about 4 dB. For radio equipment using forward error correction (FEC), the carrier level corresponding to 1 10−6 BER is 1 to 2 dB higher than that for 1 10−3 BER; the carrier difference between 1 10−6 and 1 10−10 is also 1 to 2 dB. In the following Tables, the received signal power for 1 10−6 is only addressed, since the corresponding parameters for other BERs could be theoretically derived from the modulation scheme or the error correction effect.
The received signal levels and interference levels could be referenced to the low noise amplifier (LNA)/mixer input of the receiver, so that they would be independent of receive antenna gain and feeder/multiplexer losses (assuming this to be the same for both transmitter/receiver).
It should also be noted that deterministic (station-by-station) sharing calculations require information on the frequency selectivity of the radio equipment. Generic sharing/compatibility studies, in the same allocated band, are usually based on co-channel interference situation; hence the noise bandwidth is sufficient.
The required signal levels for given BERs could be derived from the calculated receiver thermal noise level adding the required signal-to-thermal noise ratio, S/N, for a given BER. Information on theoretical and practical S/N for the most common modulation formats may be found in Recommendation ITU-R F.1101.
3.2 Permitted interference
It is necessary to specify maximum interference levels for both long- and short-term time percentages. Where aggregate long-term interference is specified, if interference from multiple
/TT/FILE_CONVERT/5B0CEBCC7F8B9A952F8CC1E8/DOCUMENT.DOCX 04/10/2017 01:09:00 PM 01/06/2017 12:51:00 PM

- 19 -5C/292 (Annex 13)-E
sources can simultaneously occur, it should be noted that single-entry interference criteria will be correspondingly lower. In the case of short-term interference, the time percentages of interest will be related to the system performance objectives.
The long- and short-term interference levels, and associated time percentages, must be individually derived for each system type in accordance with the principles described in Annex 1.
4 Tables of system parametersTables 5 to 12 show representative parameter values to be used in studies of sharing/compatibility for digital FWS that are currently used in various frequency bands.
In most of the bands, a large variety (e.g. in terms of channel spacing and modulation formats) of FWS are present in the world; their actual use in a geographical area depends on regional and national allocations and needs. Therefore, the system parameters shown are not representative of any actual FS system, but represent an averaging or an expected range of values suitable for generic sharing/compatibility studies.
Each row in the tables takes into account a specific parameter (or its expected range) that has been defined or derived according to the principles in the following paragraphs.
4.1 Frequency range and its related reference ITU-R Recommendation
The range is approximate and generally covered by the relevant radio-frequency channel arrangement Recommendation; actual band limits depend on regional and national allocations to FS.
4.2 Modulation format
For each frequency range, the two columns refer to two types of applications. The first is assumed as representative of simpler (e.g. narrower band, low complexity modulation format) systems, which often exhibit the higher e.i.r.p. density. The second is assumed to be representative of more complex (e.g. wider band, high complexity modulation format) systems, which usually require high error performance and are consequently assumed to be more sensitive to interference.
Sharing studies are generally independent of modulation, because they are based upon I/N objectives. The modulation format, in principle, is useful only for the evaluation of Rx signal levels (nominal and for BER 1 × 10⁻⁶), which may be used for short-term interference evaluation.
It should be noted that, mostly in point-to-multipoint (PMP) but also in point-to-point (PP), adaptive modulation operation (i.e. the modulation is changed according to the propagation and/or intra-system interference situation) can be used for increasing the available throughput/capacity of the system when possible.
4.3 Channel spacing and receiver noise bandwidth
Channel spacing is necessary for simple evaluation of the Tx output power density. However, in some bands, the ITU-R Recommendation reports a variety of channel spacing, which actual use is country-specific; therefore, a number of values are given for channel spacing. The actual noise bandwidth is implementation dependent; however, for the purpose of generic sharing/compatibility studies, the nominal value is generally assumed equal to the channel bandwidth.
4.4 Tx output power range (dBW)
When frequency coordination is applied (either link-by-link in PP systems, or among cells and terminals of the same PMP system) for intra-service (FS to FS) interference managing, the e.i.r.p. (and consequently the Tx output power) is fixed at a level that just permits to offer the service, with
/TT/FILE_CONVERT/5B0CEBCC7F8B9A952F8CC1E8/DOCUMENT.DOCX 04/10/2017 01:09:00 PM 01/06/2017 12:51:00 PM

- 20 -5C/292 (Annex 13)-E
the expected quality, over the specific link or within the cell area. Therefore, the range of output power presented, provides information not only on the maximum power provided by the system design, but also on the actual spread of power actually used over a large territory. The values take into account the Tx filter losses.
4.5 Tx output power density range (dBW/MHz)
In sharing/compatibility studies, power spectral densities may be needed. The Tx output power density is obtained by scaling the Tx output power with the bandwidth factor, for the links in the considered network: TX output power density (dBW/MHz) = TX output power (dBW) – 10log(channel spacing in MHz).
4.6 Feeder/multiplexer loss range (dB)
Among the large variety of systems present in the world, different physical deployment methodologies exist. Conventional indoor systems (e.g. with the radio frequency front ends in protected environment) associated to a tower/rooftop mounted antenna connected by a feeder are present mostly in the lower bands; full outdoor systems (e.g. within a waterproof mount integrated or close to the antenna) are present mostly in higher bands, but their presence in the lower bands is increasing. Therefore 0 dB feeder losses refer to full outdoor applications, while the higher value, only in bands below 18/23 GHz, is derived from an average feeder length of ~50 m of flexible waveguide. The feeder/multiplexer loss row reflects feeder losses and, if any, also losses due to multichannel combining systems (excluding the channel filter losses, which are taken into account within the Tx power output or in the Rx noise figure).
4.7 Antenna gain range (dBi) (point-to-point) or antenna type and gain range (dBi) (point-to-multipoint)
In PP systems, smaller antennas are generally coupled with low or null feeder losses (e.g. full outdoor applications); reference radiation patterns can be found in Recommendations ITU-R F.699 and ITU-R F.1245. In PMP, representative antenna types are Omni, Yagi, Dish, Sectoral; reference radiation patterns can be found in Recommendation ITU-R F.1336.
Care should be taken considering that:– in sharing studies, it is not always the maximum value of antenna gain that causes the
most interference. A lower antenna gain has a wider beam and, in some scenarios, this is more harmful, being the FS either the victim or the interferer. This can be determined on a case-by-case basis for each sharing scenario from a given representative range;
– the range of gain is representative of the whole networks population, as each network is characterized by a different distribution of antenna gain values. The typical value is likely to lay somewhere in a given range, which would also depend on different national considerations.
4.8 e.i.r.p. range (dBW)
The e.i.r.p. range depends on the above-mentioned Power output, feeder losses and antenna gain as e.i.r.p. = (Tx output power) + (Antenna gain) – (Feeder losses). However, the actual e.i.r.p. range is not to be computed as the direct sum of the highest and lowest values as the following considerations apply:– When a feeder losses range is given, the 0 dB value refers to full outdoor applications,
which usually exhibit moderate output power.– Where regulatory limits apply, e.i.r.p. may not be equal to the maximum power plus the
maximum gain – the minimum feeder loss (in decibels).
/TT/FILE_CONVERT/5B0CEBCC7F8B9A952F8CC1E8/DOCUMENT.DOCX 04/10/2017 01:09:00 PM 01/06/2017 12:51:00 PM

- 21 -5C/292 (Annex 13)-E
– Systems with less complex modulation may, in principle, have low transmitter back-off and consequent higher power; however, a design tailored on the average link budget required by the market for that application suggests, for economy reasons, to maintain a moderate power. Nevertheless, when used in smaller channel spacing, the e.i.r.p. density (dBW/MHz) may become higher.
– Systems with higher order of modulation, require higher transmitter back-off and, when associated to high capacity wideband systems, use the maximum power commonly available. Nevertheless, the e.i.r.p. density (dBW/MHz) might not be the highest among FS applications.
– In a given network, the highest Tx output power is not necessarily associated with the highest antenna gain.
The e.i.r.p. at different antenna directions may be calculated taking into account the antenna radiation pattern.
4.9 e.i.r.p. density range (dBW/MHz)
In sharing/compatibility studies, the e.i.r.p. spectral density is often used. It can be easily obtained by scaling with the bandwidth factor for the links in the considered network: e.i.r.p. density (dBW/MHz) = e.i.r.p. (dBW) – 10log (channel spacing in MHz).
In some cases, a mode is also provided, where the mode is the statistical parameter for the most frequently occurring value.
4.10 Receiver noise figure typical (dB)
The receiver noise figure includes the Rx filter losses. The value is intended to be a cost-effective balancing for the application (mostly dependent on the required link budget targeted in the system design).
4.11 Receiver noise power density typical (dBW/MHz)
The receiver noise power density typical is derived from the thermal noise power density and is described as: –144 dBW/MHz + Noise figure. Absolute Rx noise power may be derived adding the nominal noise bandwidth factor = 10log(channel spacing (in MHz)).
4.12 Normalized Rx input level for 1 × 10⁻⁶ BER (dBW/MHz)
The normalized Rx input level for 10−6 BER depends on the corresponding S/N for the actual modulation format and on the channel bandwidth. It can be derived from the receiver noise power density with the formula:
Normalized Rx Level (dBW/MHz) = Rx Noise power density (dBW/MHz) + S/N (dB).
Actual Rx input level is obtained by adding the nominal noise bandwidth factor = 10 log (channel spacing in MHz).
Information about theoretical S/N for a number of modulation formats, coded and uncoded, may be found in Recommendation ITU-R F.1101. When data is available on typical expected S/N figure including coding gain, it is reported in the table, in other cases values in the table are derived from that Recommendation assuming that, in present systems, the actual coding gain recovers at least the implementation losses.
4.13 Nominal long-term interference power density (dBW/MHz)
The long-term interference power density given in Tables 5-12 13 and Tables 1415-17 18 is equal to NRX + I/N. This value is intended to provide a starting point for sharing or compatibility
/TT/FILE_CONVERT/5B0CEBCC7F8B9A952F8CC1E8/DOCUMENT.DOCX 04/10/2017 01:09:00 PM 01/06/2017 12:51:00 PM

- 22 -5C/292 (Annex 13)-E
considerations. Although a value for NRX is available in the second row above this entry in each column of these Tables, an appropriate value for I/N depends on the frequency band and the sharing or compatibility conditions as shown in Table 4 below.
In most cases, in the past, an aggregate value of −10 dB has been used for sharing conditions with one co-primary service; however, other values have also been used or developed in sharing and compatibility studies in different interference environments.
A value of −6 dB was used in some cases of co-primary sharing in bands below 3 GHz. In addition, further guidance is provided for sharing studies involving more than one co-primary service; Table 4 provides some guidance in the choice of I/N values for use in determining an appropriate long-term interference power density.
TABLE 4
Guidance in the choice of I/N values for long-term interference
I/N1 Frequency range
Sharing/compatibility conditions†2
Comments and relevant ITU-R Recommendations
–6 dB 30 MHz to 3 GHzSharing condition except as noted elsewhere in this Table
Generally applicable value for the aggregate interferenceSee the relevant Recommendations in Table 1.–10 dB Above 3 GHz
≤ 6 dB 30 MHz to 3 GHz Sharing with more than one co-primary service
Apportionment of F.1094 objectives (see § 2 in Annex 1 of this Recommendation)6 dB or –10 dB, as appropriate, may be applicable where the risk of simultaneous interference from the stations of the other co-primary allocations is negligible. In other cases, a more stringent criterion may be required to account for aggregate interference from all interfering co-primary services (i.e. 6 dB or 10 dB should be intended as maximum aggregate I/N from all other co-primary services).
≤ –10 dB Above 3 GHz
–13 dB 3-6 GHzCompatibility with UWB For indoor FWA terminals only
SM.1757
–15 dB 27-31 GHz Sharing with FS using HAPS
F.1609
–20 dB 3-8.5 GHz Compatibility with UWB SM.1757–20 dB All Compatibility studies F.1094
1 These values of I/N apply to the aggregate interference from the operations of the shared service.2 For purposes of this Recommendation, compatibility studies refer to those studies performed between FWS and: – systems in services having allocation on a secondary basis in bands allocated to the fixed service on a primary
basis;
† For purposes of this Recommendation, compatibility studies refer to those studies performed between FWS and: – systems in services having allocation on a secondary basis in bands allocated to the fixed
service on a primary basis; – systems in services having allocation in other bands (e.g. in adjacent bands); – sources of emissions other than radio services.
/TT/FILE_CONVERT/5B0CEBCC7F8B9A952F8CC1E8/DOCUMENT.DOCX 04/10/2017 01:09:00 PM 01/06/2017 12:51:00 PM
- 23 -5C/292 (Annex 13)-E
– systems in services having allocation in other bands (e.g. in adjacent bands); or – sources of emissions other than radio services.
4.14 Additional information (nominal Rx input level)
The nominal Rx input level (dBW) is not mentioned in the tables because of its wide variability in actual networks. However, this may be needed for “short-term” interference evaluation. Nominal receive level depends on required link-specific budget, needed for achieving the required error performance and availability. In addition, when ATPC is used, the nominal receiver level is further reduced by the ATPC range. Typically, when ATPC is used, the nominal receiver level should be decreased by ~10 dB. When needed, the nominal Rx input level data should be supplied by the national administrations concerned in the specific study.
In any case, for proper link function, including ATPC, the nominal Rx input level would not be lower than about 10 to 15 dB above the Rx input level for BER = 10−6.
For each frequency range in Tables 5-13, the two columns refer to the representative values for simpler systems and more complex systems, respectively (see § 4.2 in Annex 2).
Note: the highest modulation format should reflect the reference format (and traffic capacity), of an adaptive modulation system, used for calculating the usual error performance availability (e.g. 99.99% or higher) and should be used for calculating any degradation (according ITU-R relevant recommendations) from outside interference in sharing and compatibility studies (e.g. not higher than 256/512 QAM). Nevertheless, higher modulation formats, up to 4096 QAM are commonly used for increasing capacity, as best effort, in “clearer sky conditions”.
[Editor's Note: Regarding the footnote "Nominal short-term interference density = nominal long-term interference + 15 dB" which appears in square brackets in a number of Tables below; further discussions/contributions are required to clarify the concept taking into account considerations and other ITU-R Recommendations on short term interference criteria mentioned in this Recommendation ITU-R F.758.]
/TT/FILE_CONVERT/5B0CEBCC7F8B9A952F8CC1E8/DOCUMENT.DOCX 04/10/2017 01:09:00 PM 01/06/2017 12:51:00 PM

- 24 -5C/292 (Annex 13)-E
TABLE 5(*)
System parameters for PP FS systems in allocated bands below 3 GHzFrequency range
(GHz) 0.4061-0.450 0.457-0.464 1.350-1.530 1.700-2.100
1.900-2.300 1.900-2.300 2.290-2.670
Reference ITU-R Recommendation F.1567 F.1242 F.382 F.1098 F.1243Modulation ……. …….. 4-FSK, QPSK ……. …….. ……. ……. …….. ……. ……..Channel spacing and receiver noise bandwidth (MHz)
0.05, 0.1, 0.15, 0.2, 0.25, 0.3, 0.5, 0.6,
0.75, 1, 1.75, 3.5
0.05, 0.1, 0.15, 0.2, 0.25, 0.3, 0.5, 0.6,
0.75, 1, 1.75, 3.5
0.0125 0.25, 0.5, 1, 2, 3.5
0.25, 0.5, 1, 2, 3.5
29 0.05, 0.1, 0.15, 0.2, 0.25, 0.3, 0.5, 0.6, 0.75, 1, 1.75, 3.5
0.05, 0.1, 0.15, 0.2, 0.25, 0.3, 0.5, 0.6, 0.75, 1, 1.75, 3.5
0.25, 0.5, 1, 2, 3.5
0.25, 0.5, 1, 2, 3.5
Tx output power range (dBW) NOTE NOTE 1 to 10 NOTE NOTE NOTE NOTE NOTE NOTE NOTETx output power density range (dBW/MHz) 20 to 29Feeder/multiplexer loss range (dB) 0 to 4Antenna size (m) and gain range (dBi) 11 to 17 (yagi)e.i.r.p. range (dBW) 14 to 20e.i.r.p. density range (dBW/MHz) 33 to 39Receiver noise figure typical (dB) 4Receiver noise power density typical (=NRX) (dBW/MHz)
-140 (1)
Normalized Rx input level for6 BER (dBW/MHz)
-121 ( 2 )
Nominal long-term interference power density (dBW/MHz)
NRX + I/N NRX + I/N -140 + I/N ( 3 ) NRX + I/N NRX + I/N NRX + I/N NRX + I/N NRX + I/N NRX + I/N NRX + I/N
NOTE – The intended set of parameters for two reference systems for sharing/coexistence compatibility studies currently are presently not or only partially or completely unavailable; administrations are invited to contribute. On a provisional basis, the parameters reported in Annex 3 for the same bands may be used.
(*) For each frequency range in Tables 5-12, the two columns refer to the representatives for simpler systems and more complex systems, respectively (see § 4.2 in Annex 2).(1) Receiver noise power density in the channel will be -159 dBW/12.5 kHz.( 2 ) Normalize Rx input level for 6 BER in the channel will be -140 dBW/12.5 kHz.( 3) Nominal long-term interference power density in the channel will be -159+I/N dBW /12.5 kHz.(4) [Nominal short-term interference density = nominal long-term interference + 7 dB/12.5 kHz.]
/TT/FILE_CONVERT/5B0CEBCC7F8B9A952F8CC1E8/DOCUMENT.DOCX 04/10/2017 01:09:00 PM 01/06/2017 12:51:00 PM
- 25 -5C/292 (Annex 13)-E
TABLE 6(*)
System parameters for PP FS systems in allocated bands between 3 and 7.2 GHz
Frequency range (GHz) 3.600-4.200 3.700-4.200 4.400-5.000 5.925-6.425 6.425-7.125Reference ITU-R Recommendation F.635 F.382 F.1099 F.383 F.384
Modulation 64-QAM
512-QAM
64-QAM 256-QA
M……..
16-QAM 256-QAM 64-QAM 128-QAM QPSK 64-QAM
Channel spacing and receiver noise bandwidth (MHz)
10, 30, 40, 60, 80, 90
10, 30, 40, 60, 80, 90
9(3), 10, 13(3), 20, 28, 29, 40, 60,
80
9(3) , 10, 13(3) , 20, 28, 29, 40, 60,
8028, 29
8(3), 9(3), 10, 13(3), 16.6(3),
20, 28, 33.2(3), 40,
60, 80
9(3), 10, 13(3), 20, 28, 40, 60,
80
5, 10, 20, 28, 29.65, 40, 60, 90
5, 10, 20, 28, 29.65, 40, 60, 90
5, 10, 20, 30, 40,80
5, 10, 20, 30, 40,80
Tx output power range (dBW) NOTE NOTE NOTE −5NOTE −5…−10 −5 −8…2.0 −11…2 −13…4 −15…3
Tx output power density range (dBW/MHz)(1)
−19.5…, −14.5
−25,2…−14.5
−19.5…, −14.5 −24... −14.0 −25.7…−9.7 −26…−9 −31…−13.0
Feeder/multiplexer loss range (dB) 3 0 3 2.5…5.6 1.1…3 1.2…2.8 0…6.3
Antenna gain range (dBi) 22.5 21.5…22.5
22.5 38.1…45.0 38.7…46.6 35.3…43.9 32.6…47.4
e.i.r.p. range (dBW) 14.5 11.5…14.5
14.5 20.6...37.5 25.7…45.9 27.1…42.2 15.8…48.8
e.i.r.p. density range (dBW/MHz)(1) 0.0…5.0 −3.7…5.0 0.0…5.0 4.6...21.5(Mode 14.3)
10.9…31.1 (Mode 26.9)
14.1…29.1 (Mode 21.7)
−0.2…32.7(Mode 8.2..
.24.2)
Receiver noise figure typical (dB) 6.5 6.5…7 6.5 5 4.0 5 4.5…5
Receiver noise power density typical (=NRX) (dBW/MHz)
−137.5 −137.5…−137
−137.5 −139 −140 −139 −139.5…−139
Normalized Rx input level for 1 × 10⁻⁶ BER (dBW/MHz)
−104.9 −117.0…−116.5
−104.9 −112.5 −110.5 −125.5 −113…−112.5
Nominal long-term interference power density (dBW/MHz)(2)
NRX + I/N
NRX + I/N
NRX + I/N −137.5 + I/NNRX +
I/N
−137.5…−137 + I/N
−137.5 + I/N −139 + I/N(4)
−140 + I/N −139 + I/N(4)
−139.5…−139 + I/N
(4) NOTE – The intended set of parameters for two reference systems for sharing/coexistence compatibility studies are currently are partially or completely unavailable presently
/TT/FILE_CONVERT/5B0CEBCC7F8B9A952F8CC1E8/DOCUMENT.DOCX 04/10/2017 01:09:00 PM 01/06/2017 12:51:00 PM

- 26 -5C/292 (Annex 13)-E
not or only partially available; administrations are invited to contribute. On a provisional basis, the parameters reported in Annex 3 for the same bands may be used.(1) To calculate the values for the Tx/ e.i.r.p. densities, channel spacing/bandwidth needs to be identified. In these tables, the channel spacing indicated in the bold letter text is used. Where a modal value (Mode) is provided, it is to be taken as indicative within the range specified and further sensitivity analysis may be required on a case-by-case basis to assess a given interference potential due to the variations within the range specified.(2) Nominal long-term interference power density is defined by “Receiver noise power density + (required I/N)” as described in § 4.13 in Annex 2 (see also § 4.1 in Annex 1).(3) This channel spacing value is not specified in the reference Recommendation.(4) [Nominal short-term interference density = nominal long-term interference + 15 dB.]
/TT/FILE_CONVERT/5B0CEBCC7F8B9A952F8CC1E8/DOCUMENT.DOCX 04/10/2017 01:09:00 PM 01/06/2017 12:51:00 PM

- 27 -5C/292 (Annex 13)-E
TABLE 7(*)
System parameters for PP FS systems in allocated bands between 7.1 and 14 GHz Frequency range
(GHz)7.110-7.900 7.725-8.500 10.5-10.68 10.7-11.7 12.75-13.25
Reference ITU-R Recommendation F.385 F.386 F.747 F.387 F.497
Modulation 16-QAM 128-QAM 16-QAM 128-QAM QPSK(3)
128 QAM
16-QAM 64-QAM QPSK QPSK
Channel spacing and receiver noise bandwidth (MHz)
3.5, 5, 7, 10, 14, 20, 28, 30(3), 40(3), 60(3), 80(3)
3.5, 5, 7, 10, 14, 20, 28, 30(3), 40(3), 60(3), 80(3)
1.25, 2.5, 5, 7, 10, 11.662, 14, 20, 28, 29.65, 30, 40, 60(3),
80(3)
1.25, 2.5, 5, 7, 10, 11.662, 14, 20, 28, 29.65, 30, 40, 60(3),
80(3)
1.25, 2.5,
3.5, 7
1.25, 2.5,
3.5, 7
5, 10, 20, 40, 60, 67, 80
5, 10, 20, 40, 60, 67, 80
3.5, 7, 14, 28
3.5, 7, 14, 28
Tx output power range (dBW)
−6.5… 20.0[13]
−6.5…20.0[13]
−6.5… 20.0[13] −6.5… 20.0[13] NOTE NOTE 3…5.0 0.0 NOTE NOTE
Tx output power density range (dBW/MHz)(1)
−25.5…10.0 −25.5…10.0 −25.5…10.0 −25.5…10.0 −14.8...−12.8 −16.0
Feeder/multiplexer loss range (dB)
0…3.0 0…3.0 0…3.0 0…3.0 0…9.5 0…7.6
Antenna gain range (dBi) 12…48.6 12…48.6 12…48.6 12…48.6 44…51 36…48.0e.i.r.p. range (dBW) 5.5…[55]65.5 5.5…[55]65.5 5.5…[55]65.5 5.5…[55] 65.5 33.1...51.2 13.3…43.0e.i.r.p. density range (dBW/MHz)(1)
−13.5…55.5 −13.5…55.5 −13.5…55.5 −13.5…55.5 15.3...33.4(Mode 28.5)
−2.7…27.0(Mode 15.9)
Receiver noise figure typical (dB)
2.5…6 2.5…6 2.5…6 2.5…8 5 5
Receiver noise power density typical (=NRX) (dBW/MHz)
−141.5…−138.0
−141.5…−138.0
−141.5…−138.0 −141.5…−136 −139 −139
Normalized Rx input level for 1 × 10⁻⁶ BER (dBW/MHz)
−121.0…−117.5
−112.5…−115.0
−121.0…−117.5 −111.3…−106.5 −118.5 −112.5
Nominal long-term interference power density (dBW/MHz)(2)
−141.5…−138.0 + I/N
(4)
−138.0 + I/N(4)
−141.5…−138.0 + I/N
(4)
−141.5…−136+ I/N
(4)
NRX + I/N
NRX + I/N
−139 + I/N(4)
−139 + I/N(4)
NRX + I/N
NRX + I/N
/TT/FILE_CONVERT/5B0CEBCC7F8B9A952F8CC1E8/DOCUMENT.DOCX 04/10/2017 01:09:00 PM 01/06/2017 12:51:00 PM

- 28 -5C/292 (Annex 13)-E
NOTE – The intended set of parameters for two reference systems for sharing/coexistence compatibility studies currently are partially or completely unavailableare presently not or only partially available; administrations are invited to contribute. On a provisional basis, the parameters reported in Annex 3 for the same bands may be used.(1) To calculate the values for the Tx/ e.i.r.p. densities, channel spacing/bandwidth needs to be identified. In these tables, the channel spacing indicated in the bold textletter is used. Where a modal value (Mode) is provided, it is to be taken as indicative within the range specified and further sensitivity analysis may be required on a case-by-case basis to assess a given interference potential due to the variations within the range specified.(2) Nominal long-term interference power density is defined by “Receiver noise power density + (required I/N)” as described in § 4.13 in Annex 2 (see also § 4.1 in Annex 1).(3) This channel spacing value is not specified in the reference Recommendation.(4) [Nominal short-term interference density = nominal long-term interference + 15 dB.]
/TT/FILE_CONVERT/5B0CEBCC7F8B9A952F8CC1E8/DOCUMENT.DOCX 04/10/2017 01:09:00 PM 01/06/2017 12:51:00 PM

- 29 -5C/292 (Annex 13)-E
TABLE 8*)
System parameters for PP FS systems in allocated bands between 14 and 34 GHzFrequency range (GHz) 14.4-15.35 17.7-19.7 21.2-23.6 24.25-29.50 31.8-33.4
Reference ITU-R Recommendation F.636 F.595 F.637 F.748 F.1520
Modulation FSK 128-QAM QPSK 64-QAM FSK 128-QAM QPSK128-QAM16-QAM(4)
128-QAM… (4) QPSK 256-QAM
Channel spacing and receiver noise bandwidth (MHz)
2.5, 3.5, 7, 14, 28
2.5, 3.5, 7, 14, 28,40
1.25, 1.75, 2.5, 3.5, 5, 7, 7.5, 10, 13.75, 20,
27.5, 30, 40, 50, 55, 60(5)
(4) , 110, 220
1.25, 1.75, 2.5, 3.5, 5, 7, 7.5, 10, 13.75, 20,
27.5, 30, 40, 50, 55, 60(5)
(4) , 110, 220
2.5, 3.5, 7, 14,
25(3), 28, 50, 56,
112
2.5, 3.5, 7, 14, 28,
30(3), 50, 56, 112
2.5, 3.5, 7, 14, 2814, 28, 40(5), 56, 60(5), 112
302.5, 3.5, 7, 14, 28, 40(5)(4) , 56, 60(5)(4) , 112
3.5, 7, 14, 28, 56(5)(4)
3.5, 7, 14, 28, 56(5)(4)
Tx output power range (dBW) 0 15-11…[10]
−37…−3.0 −10 −10 −13 −39…−19 -10 −29…−9
−29…−15
Tx output power density range (dBW/MHz)(1)
−5.44 0.528 −45.4…−19.0
−26 −24.0 −27.8 −53.8…−33.8(6)
-24.8 −37.5…−17.5
−43.5…−29.5
Feeder/multiplexer loss range (dB) 0… 6.0 0…5.00…10.0
0.0…2 0…9.3 0…3 … 0.00.00.0 0.00.0 0…1.5 0…1.5
Antenna gain range (dBi) 37 31.931.9…[49.0]
21.7…48.3 32…45 34.8 … 31.5 31.5…48 37.8…43
37.8…43
e.i.r.p. range (dBW) 31…37 41.9…46.9 −4.4…43 −1.1...33 21.8…24.8
… −7.5…12.5
21.5…38 7.3…34.0
7.3…28.05
e.i.r.p. density range (dBW/MHz)(1) 25.6…31.6 27.4…32.4 −13.1…27.3(Mode 16.2)
−17.1...17(Mode 8.0)
7.8…10.8 −221.3…−2.3(6)
6.7…23.2 −1.1…25.5
−7.2…13.5
Receiver noise figure typical 8 5.0 5 11 6 8 6.5 6 6Receiver noise power density typical (=NRX) (dBW/MHz)
−136 −139 −139 −133 −138 −136-137.5−136
−138 −138
Normalized Rx input level for1 × 10−6 BER (dBW/MHz)
−106.5 −125.5 −112.5 −119.6 −108.5 −115.5 -108 −131.3 −107.3
/TT/FILE_CONVERT/5B0CEBCC7F8B9A952F8CC1E8/DOCUMENT.DOCX 04/10/2017 01:09:00 PM 01/06/2017 12:51:00 PM

- 30 -5C/292 (Annex 13)-E
Nominal long-term interference power density (dBW/MHz)(2)
NRX + I/N(8)(7)
−136 + I/N(8)(7)
−139 + I/N(8)(7)
−139 + I/N( 8 ) (7)
−133 + I/N(8)(7)
−138 + I/N(8)(7)
−136 + I/N −137.5 NRX+ I/N −138 + I/N
−138 + I/N
NOTE – The intended set of parameters for two reference systems for sharing/coexistence compatibility studies currently are partially or completely unavailableare presently not or only partially available; administrations are invited to contribute. On a provisional basis, the parameters reported in Annex 3 for the same bands may be used.(1) To calculate the values for the Tx/ e.i.r.p. densities, channel spacing/bandwidth needs to be identified. In these tables, the channel spacing indicated in the bold textletter is used. Where a modal value (Mode) is provided, it is to be taken as indicative within the range specified and further sensitivity analysis may be required on a case-by-case basis to assess a given interference potential due to the variations within the range specified.(2) Nominal long-term interference power density is defined by “Receiver noise power density + (required I/N)” as described in § 4.13 in Annex 2 (see also § 4.1 in Annex 1).(3) This channel spacing value is not specified in the reference Recommendation.(4) This system uses adaptive modulation between QPSK and 164096-QAM and depending on the performance criteria sought, a base modulation from 16-QAM to +256-QAM is selected under ordinary conditions. This system uses the frequency range 24.25-29.50 GHz or portions thereof.(54 ) Frequency block bandwidth.(5 6) These Tx/e.i.r.p. density values are calculated from a channel spacing (bandwidth) of 30 MHz within a 60 MHz frequency block.( 6 7) Nominal long-term interference power density should be a range, not just the range proposed for 4096-QAM.( 7 8) [Nominal short-term interference density = nominal long-term interference + 15 dB.]
/TT/FILE_CONVERT/5B0CEBCC7F8B9A952F8CC1E8/DOCUMENT.DOCX 04/10/2017 01:09:00 PM 01/06/2017 12:51:00 PM

- 31 -5C/292 (Annex 13)-E
TABLE 9System parameters for PP FS systems in allocated bands between 36 and 59 GHz
Frequency range(GHz)
36.0-40.5 40.5-43.5 51.4-52.6 55.78-59.0
Reference ITU-R Recommendation F.749 F.2005 F.1496 F.1497Modulation QPSK 32-QAM QPSK 256-QAM …….. …….. FSK ……..Channel spacing and receiver noise bandwidth (MHz)
2.5, 3.5, 7, 14, 28, 56, 112, 140
2.5, 3.5, 7, 10 14, 28, 30, 40,
50 56, 112, 140
7, 14, 28, 56, 112
7, 14, 28, 56, 112
3.5, 7, 14, 28, 56
3.5, 7, 14, 28, 56
3.5, 7, 10(3), 14, 20(3), 28, 30(3), 40(3) 50,
56, 100
3.5, 7, 14, 28, 50, 56, 100
Tx output power range (dBW) −60…−15 −37.5…−16.5 −10 −17 NOTE NOTE −20…3 NOTETx output power density range (dBW/MHz)(1)
−68.4…−23.4 −45.9…−29.0 −24.5 −34.5 −37.0…−7.0
Feeder/multiplexer loss range (dB) 0 0 0...2.5 0...2.5 0…2.5Antenna gain range (dBi) 34…45 34…46 38...44 38...44 40.1…48.8e.i.r.p. range (dBW) −20.8…30 −1.7…27 25.5...34 18.5...27 17.6…51.8e.i.r.p. density range (dBW/MHz)(1) −29.2…21.5 −15.7…17 11...19.5 1.0...9.5 0.6…41.8Receiver noise figure typical (dB) 8 7 7 7 7Receiver noise power density typical (=NRX) (dBW/MHz)
−136 −137.7 −137 −137 −137
Normalized Rx input level for 1 × 10⁻⁶ BER (dBW/MHz)
−122.5 −114.2 −123.5 −104.4 −123.6
Nominal long-term interference power density (dBW/MHz)(2)
−136 + I/N( 4 )
−137.7 + I/N( 4 )
−137+ I/N −137 + I/N NRX + I/N NRX + I/N −137 + I/N NRX + I/N
(1) To calculate the values for the Tx/ e.i.r.p. densities, channel spacing/bandwidth needs to be identified. In these tables, the channel spacing indicated in the bold letter is used. Where a modal value (Mode) is provided, it is to be taken as indicative within the range specified and further sensitivity analysis may be required on a case-by-case basis to assess a given interference potential due to the variations within the range specified.(2) Nominal long-term interference power density is defined by “Receiver noise power density + (required I/N)” as described in § 4.13 in Annex 2 (see also § 4.1 in Annex 1).(3) This channel spacing value is not specified in the reference Recommendation.( 4 ) [Nominal short-term interference density = nominal long-term interference + 15 dB. ]
/TT/FILE_CONVERT/5B0CEBCC7F8B9A952F8CC1E8/DOCUMENT.DOCX 04/10/2017 01:09:00 PM 01/06/2017 12:51:00 PM

- 32 -5C/292 (Annex 13)-E
NOTE – The intended set of parameters for two reference systems for sharing/coexistence compatibility studies currently are partially or completely unavailableare presently not or only partially available; administrations are invited to contribute. On provisional basis, the parameters reported in Annex 3 for the same bands may be used.
TABLE 10
System parameters for PP FS systems in allocated bands beyond 59 GHz
Frequency range(GHz)
59-64 64-66 71-76/81-86
Reference ITU-R Recommendation F.1497 F.1497 F.2006Modulation QPSK 64-QAM BPSK 64-QAM QPSK 64 QAM
Channel spacing and receiver noise bandwidth (MHz)
50; 100 50; 100; 150; 250; 500(3); 1 250; 2 500
30; 50 50; 100; 150; 250; 500(3) ;
1 250; 2 500
250, 500, 750, 1 000, 1 250, 1 500, 1 750,
2 000, 2 250
500, 700, 1 000
Tx output power range (dBW) –22...–20 –24 –15...–12 –24 –10 –20–47 to -50
044 to 5024 to 30-6 to 3
8–136
-94 to -91
Tx output power density range (dBW/MHz)(1) –42...–40 –51 –29.8...–26.8 –51 –41Feeder/multiplexer loss range (dB) 0...2.5 0...2.5 0...2.5 0...2.5 0
Antenna gain range (dBi) 38...48 38...48 48...50 38...48 54e.i.r.p. range (dBW) 13.5...28 11.5...24 30.5...38 11.5...24 44
e.i.r.p. density range (dBW/MHz)(1) –6.5...8 –15.5...–3.0 15.8...23.3 –15.5...–3.0 13Receiver noise figure typical (dB) 8 8 9 8 10
Receiver noise power density typical (=NRX) (dBW/MHz)
–136 –136 –135 –136 –134
Normalized Rx input level for 1 × 10⁻⁶ BER (dBW/MHz)
–122.5 –109.5 –124.5 –109.5 –120.5
Nominal long-term interference power density (dBW/MHz)(2)
–136+ I/N(4)
–136 + I/N –135 + I/N –136 + I/N –134 + I/N(4)
–136 + I/N(4)
(1) To calculate the values for the Tx/ e.i.r.p. densities, channel spacing/bandwidth needs to be identified. In these tables, the channel spacing indicated in the bold text letter is used. Where a modal value (Mode) is provided, it is to be taken as indicative within the range specified and further sensitivity analysis may be required on a case-by-case basis to assess a given interference potential due to the variations within the range specified.(2) Nominal long-term interference power density is defined by “Receiver noise power density + (required I/N)” as described in § 4.13 in Annex 2 (see also § 4.1 in Annex 1).(3) This channel spacing value is not specified in the reference Recommendation.[(4) Nominal short-term interference density = nominal long-term interference + 15 dB.]
/TT/FILE_CONVERT/5B0CEBCC7F8B9A952F8CC1E8/DOCUMENT.DOCX 04/10/2017 01:09:00 PM 01/06/2017 12:51:00 PM
- 33 -5C/292 (Annex 13)-E
TABLE 11
System parameters of PMP FS systems below 0.47 GHz
Frequency range (GHz) 0.457-0.464
Reference ITU-R Recommendation
Modulation format Central Stations4-FSK, QPSK
Terminal Stations4-FSK, QPSK
Channel spacing and receiver noise bandwidth (MHz) 0.0125 0.0125Maximum Tx output power range (dBW) 1 to 10 1 to 10
Maximum Tx output power density range (dBW/MHz)(1) 20 to 29 20 to 29Minimum feeder/multiplexer loss range (dB) 1 … 3 1 … 4
Maximum antenna gain range (dBi) 2 … 11(omni / sectoral)
8 … 17(directional)
Maximum e.i.r.p. range (dBW) 14 to 20 18 to 24Maximum e.i.r.p. density range (dBW/MHz)(1) 33 to 39 37 to 43
Receiver noise figure (dB) 4 4Receiver noise power density typical (=NRX) (dBW/MHz) -140 (1) -140(1)
Normalized Rx input level for 1 × 10⁻⁶ BER (dBW/MHz) -121( 2) -121( 2) Nominal long-term interference power density (dBW/MHz)(2)
-140 + I/N ( 3 ) -140 + I/N( 3 )
(1) Receiver noise power density in the channel will be -159 dBW/12.5 kHz( 2 ) Normalize Rx input level for 6 BER in the channel will be -140 dBW/12.5 kHz( 3) Nominal long-term interference power density in the channel will be -159+I/N dBW /12.5 kHz
/TT/FILE_CONVERT/5B0CEBCC7F8B9A952F8CC1E8/DOCUMENT.DOCX 04/10/2017 01:09:00 PM 01/06/2017 12:51:00 PM

- 34 -5C/292 (Annex 13)-E
TABLE 1112(*)
System parameters of PMP FS systems in allocated bands between 1.3 andbelow 11 GHz
Frequency range(GHz)
1.35-2.69(1.35-2.5 sub-
bands)1.35-2.69
(2.5-2.69 sub-bands) 3.40-3.80 10.15-10.68
Reference ITU-R Recommendation F.701 F.701 F.1488 F.747, F.1568Modulation format Central
Stations …………
Terminal Stations
…………
Central StationsQPSK through
64-QAM(7)
Terminal StationsQPSK
Central StationsQPSK through
64-QAM(7)
Terminal Stations QPSK
Central Stations64-QAM
Terminal Station
64-QAM
Channel spacing and receiver noise bandwidth (MHz)
Multiple of 0.5
Multiple of 0.5
5, 5.5, 6(8) 5, 5.5, 6(8) 25(5), 1.75, 3.5, ...14(9)
25(5), 1.75, 3.5, ...14(9)
1.75 (3), 2.5, 5, 28(5), 30(5)
1.75 (3), 2.5, 5, 28(5), 30(5)
Tx output power range (dBW) NOTE NOTE 5…13 −6…0 5…13 −6…0 −3 −12
Tx output power density range (dBW/MHz)(1)
−2.78…6.01 −13.8…−6.99 −6.46…10.6 −17.5…−2.43 −5.43 −14.4
Feeder/multiplexer loss range (dB) 3 0 2 0 0.5 0
Antenna type and gain range (dBi) 13 (omni)…16 (sector)
13 (omni) 10 (omni)…18 (sector)
8 (indoor)…18 (outdoor)
15 (90° microstrip
sectoral)
18 (panel)
e.i.r.p. range (dBW) 23…26 32 21…29 8…18 11.5 6
e.i.r.p. density range (dBW/MHz)(1) 15.2…19.0 24.2…25.0 9.54…26.5 −3.46…15.6 9.07 3.57
Receiver noise figure typical (dB) 4 4 3 3 5 5
Receiver noise power density typical (=NRX) (dBW/MHz)
−140 −140 −141 −141 −139 −139
Normalized Rx input level for 1 × 10⁻⁶ BER (dBW/MHz)
−126.5…−113.5 −126.5 −127.5…−114.5 −127.5 −112.5 −112.5
Nominal long-term interference power density (dBW/MHz)(2)
NRX + I/N NRX + I/N 140 + I/N −140 + I/N −141 + I/N −141 + I/N −139 + I/N −139 + I/N
NOTE – The intended set of parameters for two reference systems for sharing/coexistence compatibility studies currently are partially or completely unavailableare presently not or only partially available; administrations are invited to contribute. On a provisional basis, the parameters reported in Annex 3 for the same bands may be used.(1) To calculate the values for the Tx/ e.i.r.p. densities, channel spacing/bandwidth needs to be identified. In these tables, the channel spacing indicated in the bold textletter is used. Where a modal value (Mode) is provided, it is to be taken as indicative within the range specified and further sensitivity analysis may be required on a case-by-case basis to assess a given interference potential due to the variations within the range specified.
/TT/FILE_CONVERT/5B0CEBCC7F8B9A952F8CC1E8/DOCUMENT.DOCX 04/10/2017 01:09:00 PM 01/06/2017 12:51:00 PM

- 35 -5C/292 (Annex 13)-E
(2) Nominal long-term interference power density is defined by “Receiver noise power density + (required I/N)” as described in § 4.13 in Annex 2 (see also § 4.1 in Annex 1).(3) This channel spacing value is not specified in the reference Recommendation.(4) Footnote not used.(5) [Footnote text TBD](6) Footnote not used.(7) The modulation format is usually changed dynamically according to the propagation impairment.(8) Recommendation ITU-R F.701 recommends only a basic pattern of 0.5 MHz (or its integer multiple). The values of 5, 5.5 and 6 MHz are proposed as most common channel spacings for these systems.(9) Recommendation ITU-R F.1488 recommends only a basic pattern of 0.25 MHz (or its integer multiple). The values of 1.75, 3.5, … 14 MHz are proposed as most common channel spacings for these systems.
/TT/FILE_CONVERT/5B0CEBCC7F8B9A952F8CC1E8/DOCUMENT.DOCX 04/10/2017 01:09:00 PM 01/06/2017 12:51:00 PM

- 36 -5C/292 (Annex 13)-E
TABLE 1213(*)
System parameters of PMP FS systems in allocated bands above 11 GHz
Frequency range(GHz) 17.70-19.70 21.20-23.60 24.25-29.50 31.8-33.4 38.60-40.00
Reference ITU-R Recommendation
F.595 F.637 F.748 F.1520 F.749
Modulation Central Station
Terminal Stations
Central Station
Terminal Stations
MultiPoint 60CM High Gain Antenna
Station QPSK through 256QAM(7)
Central StationQPSK through
16-QAM(7)
Terminal StationsQPSK through
16-QAM(7)
Central Station
Terminal Stations
Central Station
Terminal Stations
Channel spacing and receiver noise bandwidth (MHz)
2.5, 5, 10, 20, 30, 40,
50
2.5, 5, 10, 20, 30, 40,
50
3.5, 7, 14, 28
3.5, 7, 14, 28
40, 50, 56, 100, 112 3.5, 7, 14, 28, 30(3), 56, 112, 40(5), 60(5),
3.5, 7, 14, 28, 30(3), 56, 112,
40(5), 60(5)
3.5, 7, 14, 28, 56(5), 112, 168
3.5, 7, 14, 28, 56(5), 112, 168
50(5), 60(5)
50(5), 60(5)
Tx output power range (dBW)
NOTE NOTE NOTE NOTE −12 to -5 −19 [−39…−19] NOTE NOTE NOTE NOTE
Tx output power density range (dBW/MHz)(1)
-62 to -28 −33.8(6) −53.8…−33.8(6)
Feeder/multiplexer loss range (dB)
0 to 1 0 0
Antenna type and gain range (dBi)
43 (directional) 6.5 (omni)… 31.515 (planar)…35
e.i.r.p. range (dBW) 29 to 36.5dBW −12.5… −7.5…12.5
e.i.r.p. density range (dBW/MHz)(1)
17…18 −27.3(6) −22.3…−2.3(6)
Receiver noise figure typical (dB)
6 8 8
Receiver noise power density typical (=NRX) (dBW/MHz)
-138 −136 −136
/TT/FILE_CONVERT/5B0CEBCC7F8B9A952F8CC1E8/DOCUMENT.DOCX 04/10/2017 01:09:00 PM 01/06/2017 12:51:00 PM

- 37 -5C/292 (Annex 13)-E
Normalized Rx input level for 1 × 10⁻⁶ BER (dBW/MHz)
-130 −122.5...−115.5
−122.5…−115.5
Nominal long-term interference power density (dBW/MHz)(2)
NRX + I/N
NRX + I/N NRX + I/N NRX + I/N −138 + I/N −136 + I/N −136 + I/N NRX + I/N
NRX + I/N NRX + I/N
NRX + I/N
(1) To calculate the values for the Tx/ e.i.r.p. densities, channel spacing/bandwidth needs to be identified. In these tables, the channel spacing indicated in the bold textletter is used. Where a modal value (Mode) is provided, it is to be taken as indicative within the range specified and further sensitivity analysis may be required on a case-by-case basis to assess a given interference potential due to the variations within the range specified.(2) Nominal long-term interference power density is defined by “Receiver noise power density + (required I/N)” as described in § 4.13 in Annex 2 (see also § 4.1 in Annex 1).(3) This channel spacing value is not specified in the reference Recommendation.(4) Footnote not used.(5) [Footnote text TBD](6) [Footnote text TBD](7) [Footnote text TBD]
/TT/FILE_CONVERT/5B0CEBCC7F8B9A952F8CC1E8/DOCUMENT.DOCX 04/10/2017 01:09:00 PM 01/06/2017 12:51:00 PM
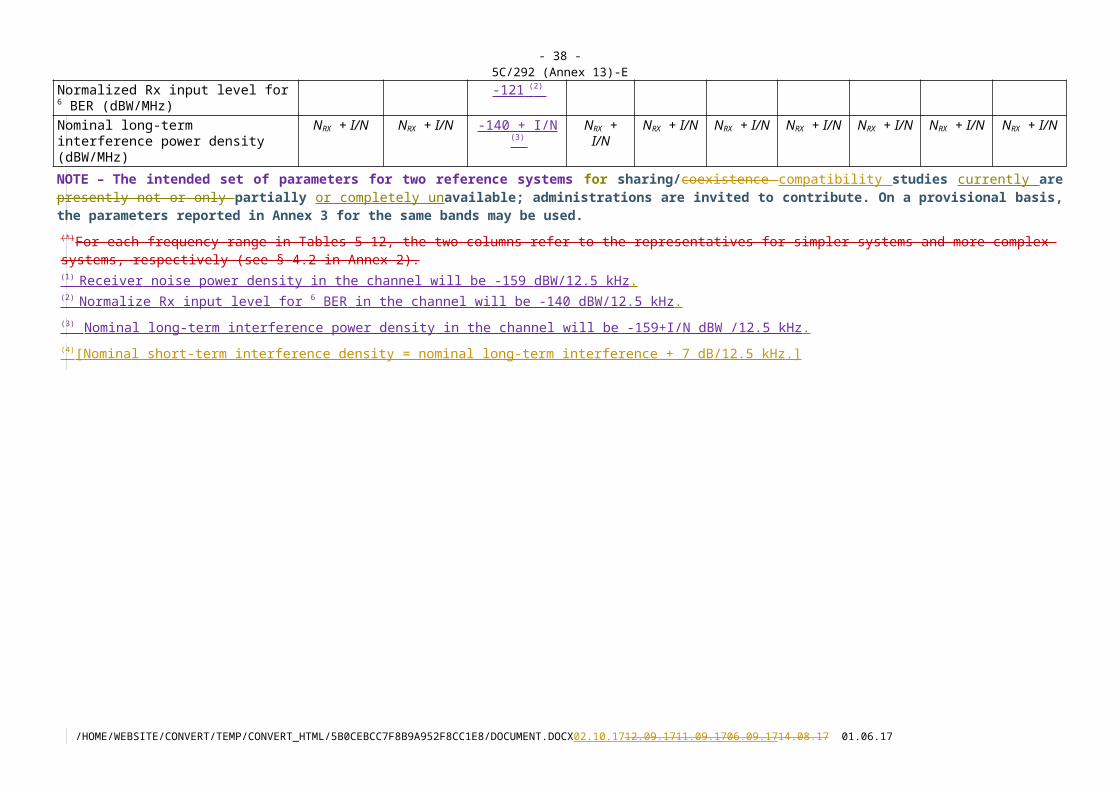
- 38 -5C/292 (Annex 13)-E
APPENDIX 1 TO ANNEX 2
Examples for statistical distribution studies
The following examples were derived analysing some PP networks in the mobile infrastructure networks which statistical functions are linked to the statistics of mobile base stations on a territory of one administration. These networks were described as follows:– 1 335 links with length range 16-0.4 km in the 11 GHz band;– 1 285 links with length range 8.7-0.1 km in the 15 GHz band;– 1 058 links with length range 5.1-0.1 km in the 18 GHz band.
The consequent statistical distributions of their e.i.r.p. are presented in Table 1314.
TABLE 1314
Difference between the theoretical maximum and statistical dispersion of the actual data
for e.i.r.p.; in the example three systems in one administration
Frequency band(GHz)
10.715-10.95511.245-11.485
14.5-14.66014.970-15.130
17.850-17.97018.600-18.720
Theoretical maximum(*) 40.3 38.1 35Actual data maximum 38.8 35.4 33
Actual data average () 31.7 28.4 22.8Actual data standard deviation () 3.2 3.2 4.3
Difference between theoretical maximun and actual data maximun
1.5 2.7 2
+ 2 38.1 34.8 31.4Theoretical maximum ( + 2) 2.2 3.3 3.6
+ 1.64 37 33.7 29.9Theoretical maximum ( + 1.64) 3.3 4.4 5.1
(*) Theoretical maximum = Tx output power (maximum) − Feeder/multiplexer loss (minimum) + Antenna gain (maximum), this value may not become the actual data maximum.
The differences between the theoretical and the actual data maxima range from 1.5 to 2.7 dB. The data points of the actual transmitter data for these systems were more than 2 000 data points. Then assuming that a data set more than 2 000 data points follows a normal distribution, the values of 2 and 1.64 are calculated. Where is the standard deviation and is the average. About 95% of the data points are within 2 from the average and about 90% of the data points are within 1.64 from the average. e.i.r.p. reduces about 3 dB for 95% and about 4 dB for 90% from the theoretical maximum.
It is noted that such analysis may lead to a bit different results depending on the statistical distribution of the data.
However, it is demonstrated that, in practical examples, there is some difference between the theoretical maximum and the maximum values of actual data.
/TT/FILE_CONVERT/5B0CEBCC7F8B9A952F8CC1E8/DOCUMENT.DOCX 04/10/2017 01:09:00 PM 01/06/2017 12:51:00 PM

- 39 -5C/292 (Annex 13)-E
ANNEX 3
Other FS specific system parameters
The information in this Annex still represents real systems deployed along the times. Some of these parameters may be obsolete but no new consolidated set of parameters have been yet contributed from administrations; however, they can still be used on a provisional basis when reference systems data, for the interested bands, are not found in the Tables in Annex 2.
This Annex is based on Report ITU-R F.2108. The following terms are updated:
The terms “Hub”, “Base station”, “Central station” have been unified to “Central station”.
The terms “Remote station”, “Out station”, Terminal station” have been unified to “Terminal station”.
For each frequency range in Tables 15-18, the two columns refer to the representative values for simpler systems and more complex systems, respectively (see § 4.3 in Annex 2).
/TT/FILE_CONVERT/5B0CEBCC7F8B9A952F8CC1E8/DOCUMENT.DOCX 04/10/2017 01:09:00 PM 01/06/2017 12:51:00 PM

- 40 -5C/292 (Annex 13)-E
TABLE 1415(*)
System parameters for PP FS systems in allocated bands below 3 GHz Frequency range
(GHz) 0.4061-0.450 1.350-1.530 1.700-2.1001.900-2.300 1.900-2.300 2.290-
2.670Reference ITU-R Recommendation F.1567 F.1242 F.382 F.1098 F.1243
Modulation QPSK 32-QAM MSK QPSK O-QPSK QPSK QPSK 256-QAM MSK
Channel spacing and receiver noise bandwidth (MHz)
0.05, 0.1, 0.15, 0.2, 0.25, 0.3, 0.5, 0.6, 0.75, 1, 1.75, 3.5
0.05, 0.1, 0.15, 0.2,
0.25, 0.3, 0.5, 0.6, 0.75, 1,
1.75, 3.5
0.25, 0.5, 1, 2, 3.5
0.25, 0.5, 1, 2, 3.5
29 29 1.75, 2.5, 3.5, 7, 10, 14
1.75, 2.5, 3.5, 7, 10,
14
0.25, 0.5, 1, 1.75, 2, 2.5, 3.5, 7, 14
Maximum Tx output power range (dBW)
7 0 7 0…7 7 3 −9…7 −1…2 5
Maximum Tx output power density range (dBW/MHz) (1)
1.6…13 −2.4…7.0 4.0 −3.0…7 −7.6 −12 −14…−1.5 −6.4…−3.4 −6.5
Minimum feeder/multiplexer loss range (dB)
2 2 5 1…5 3 1 3…6 0…2 4
Maximum antenna gain range (dBi) 25 25 16 16…33 33 31 28…30 33…38 25
Maximum e.i.r.p. range (dBW) 30 23 20 20…39 40 34 14…30 32…40 26
Maximum e.i.r.p. density range (dBW/MHz)(1)
25…36 21…30 17 17…39 25 19 10…19 27…35 15
Receiver noise figure (dB) 5 3.5 4 4…7 4 4 4…6 3…4 4
Receiver noise power density typical (=NRX) (dBW/MHz)
−139 −140.5 −140 −140…−137 −140 −140 −140…−138 −141…−140 −140
Normalized Rx input level for 1 × 10⁻⁶ BER (dBW/MHz)
−125.5 −117 −126.5 −126.5…−123.5
−126.5 −126.5 −126.5…−124.5
−108.4…−107.4
−126.5
Nominal long-term interference power density (dBW/MHz)(2)
−139 + I/N −140.5 + I/N −140 + I/N −140…−137 + I/N
−140 + I/N −140 + I/N −140…−138 + I/N
−141…−140 + I/N
−140 + I/N
(*) For each frequency range in Tables 14-17, the two columns refer to the representatives for simpler systems and more complex systems, respectively (see § 4.3 in Annex 2).(1) To calculate the values for the Tx/e.i.r.p. densities, channel spacing/bandwidth needs to be identified. In these tables, the channel spacing indicated in bold lettertext is used.(2) Nominal long-term interference power density is defined by “Receiver noise power density +(required I/N)” as described in § 4.13 in Annex 2 (see also § 4.1 in Annex 1).
/TT/FILE_CONVERT/5B0CEBCC7F8B9A952F8CC1E8/DOCUMENT.DOCX 04/10/2017 01:09:00 PM 01/06/2017 12:51:00 PM

- 41 -5C/292 (Annex 13)-E
TABLE 1516(*)
System parameters for PP FS systems in allocated bands between 3 and 12 GHz
Frequency range(GHz) 3.600-4.200 3.700-4.200 10.5-10.68
Reference ITU-R Recommendation F.635 F.382 F.747
Modulation 64-QAM 512-QAM QPSK QPSK(3) 128-TCMChannel spacing and receiver noise bandwidth (MHz) 10, 30, 40, 60, 80,
9010, 30, 40, 60, 80,
9028, 29 1.25, 2.5, 3.5, 7 1.25, 2.5, 3.5, 7
Maximum Tx output power range (dBW) −1 7 0 −2 −3
Maximum Tx output power density range (dBW/MHz)(1) −16…−11 −9.0 −15 −10 −7.0Minimum feeder/multiplexer loss range (dB) 0 3 3 0 0
Maximum antenna gain range (dBi) 42 40 37 49 51Maximum e.i.r.p. range (dBW) 41 44 38 47 48
Maximum e.i.r.p. density range (dBW/MHz)(1) 26…31 28 23 39 44Receiver noise figure (dB) 3 2 4 3 4
Receiver noise power density typical (=NRX) (dBW/MHz) −141 −142 −140 −141 −140Normalized Rx input level for 1 × 10⁻⁶ BER (dBW/MHz) −114.5 −106.5 −126.5 −127.5 −116.4
Nominal long-term interference power density (dBW/MHz)(2) −141 + I/N −142 + I/N −140 + I/N −141 + I/N −140 + I/N
(1) To calculate the values for the Tx/e.i.r.p. densities, channel spacing/bandwidth needs to be identified. In these tables, the channel spacing indicated in bold lettertext is used.(2) Nominal long-term interference power density is defined by “Receiver noise power density +(required I/N)” as described in § 4.13 in Annex 2 (see also § 4.1 in Annex 1).(3) There are two modulations (QPSK and 4FSK) described and QPSK is selected.
/TT/FILE_CONVERT/5B0CEBCC7F8B9A952F8CC1E8/DOCUMENT.DOCX 04/10/2017 01:09:00 PM 01/06/2017 12:51:00 PM

- 42 -5C/292 (Annex 13)-E
TABLE 1617(*)
System parameters for PP FS systems in allocated bands beyond 12 GHz
Frequency range (GHz)
12.75-13.25 51.4-52.6
Reference ITU-R Recommendation F.497 F.1496
Modulation QPSK 4-FSK 32-QAM
Channel spacing and receiver noise bandwidth (MHz) 3.5, 7, 14, 28 3.5, 7, 14, 28, 56 3.5, 7, 14, 28, 56
Maximum Tx output power range (dBW) 10 −20 −20
Maximum Tx output power density range (dBW/MHz) (1) −4.5…4.6 −34...−25 −31
Minimum feeder/multiplexer loss range (dB) 0 0 0
Maximum antenna gain range (dBi) 49 50 50
Maximum e.i.r.p. range (dBW) 45 30 30
Maximum e.i.r.p. density range (dBW/MHz) (1) 31…40 16...25 19
Receiver noise figure (dB) 10 11 7
Receiver noise power density typical (=NRX) (dBW/MHz) −134 −133 −137
Normalized Rx input level for 1 × 10⁻⁶ BER (dBW/MHz) −120.5 −109.9 −113.5
Nominal long-term interference power density (dBW/MHz)(2) −134 + I/N −133 + I/N −137 + I/N
(1) To calculate the values for the Tx/e.i.r.p. densities, channel spacing/bandwidth needs to be identified. In these tables, the channel spacing indicated in bold textletter is used.(2) Nominal long-term interference power density is defined by “Receiver noise power density +(required I/N)” as described in § 4.13 in Annex 2 (see also § 4.1 in Annex 1).
/TT/FILE_CONVERT/5B0CEBCC7F8B9A952F8CC1E8/DOCUMENT.DOCX 04/10/2017 01:09:00 PM 01/06/2017 12:51:00 PM

- 43 -5C/292 (Annex 13)-E
TABLE 1718(*)
System parameters of PMP FS systemsin allocated bands below 11 GHz
Frequency range (GHz)
1.35-2.69(1.35-2.5 sub-bands)
Reference ITU-R Recommendation F.701
Modulation format Central Stations QPSK(4)
Terminal Stations QPSK(4)
Channel spacing and receiver noise bandwidth (MHz) 2, 3.5 (5) 2, 3.5 (5)
Maximum Tx output power range (dBW) 0…7 0…7
Maximum Tx output power density range (dBW/MHz)(1) −3.0…1.6 −3.0…1.6Minimum feeder/multiplexer loss range (dB) 0…4.4 0…4
Maximum antenna gain range (dBi) 13 (omni/sectoral)... 17 (omni/section)
17.5 (yagi/horn)... 27 (dish/horn)
Maximum e.i.r.p. range (dBW) 6…24 16…34Maximum e.i.r.p. density range (dBW/MHz)(1) 3.0…19 13…29
Receiver noise figure (dB) 3.5…4 3.5…4Receiver noise power density typical (=NRX) (dBW/MHz) −140.5…−140 −140.5…−140
Normalized Rx input level for 1 × 10⁻⁶ BER (dBW/MHz) −127…−126.5 −127…−126.5Nominal long-term interference power density (dBW/MHz)(2) −140.5…−140 + I/N −140.5…−140 + I/N
(1) To calculate the values for the Tx/e.i.r.p. densities, channel spacing/bandwidth needs to be identified. In these tables, the channel spacing indicated in bold textletter is used.(2) Nominal long-term interference power density is defined by “Receiver noise power density +(required I/N)” as described in § 4.13 in Annex 2 (see also § 4.1 in Annex 1).(3) Footnote not used.(4) There are systems using O-QPSK and QPSK in the band and the QPSK system is selected since it has all the parameters.(5) Recommendation ITU-R F.701 recommends only a basic pattern of 0.5 MHz (or its integer multiple). The values of 2 and 3.5 MHz are proposed as most common channel spacings for these systems.
/TT/FILE_CONVERT/5B0CEBCC7F8B9A952F8CC1E8/DOCUMENT.DOCX 04/10/2017 01:09:00 PM 01/06/2017 12:51:00 PM