mathwithsheppard.weebly.commathwithsheppard.weebly.com/.../46523129/unit_4_booklet.docx · web...
TRANSCRIPT
MFM 1P Date:
Unit 4: Relationships Booklet
Date Topic Homework Completed
Thurs. Nov 2 4.1 Reading and Interpreting Scatter Plots Pages 6-9
Fri. Nov 3 4.2 Independent and Dependent Variables Pages 14-16
Mon. Nov 6 4.3 Drawing Scatter Plots Page 20-21
Tues. Nov 7 4.4 Lines of Best Fit Page 25-29
Wed. Nov 8 Quiz 1: Scatter Plots4.5 Linear or Non-Linear Relationships Pages 34-37
Thurs. Nov 9 4.6 Distance Time Graphs Pages 42-44
Fri. Nov 10 Per 1- AssemblyPer 2 - 4.7 Calculating Speed Pages 48-50
Mon. Nov 13 Per 1 - 4.7 Calculating SpeedPer 2 - Review Handout
Tues. Nov 14 Unit Test
Name: __________________________
mathwithsheppard.weebly.com
1

MFM 1P Date:
2
MFM 1P Date: Activity 4.1: Reading and Interpreting Scatte
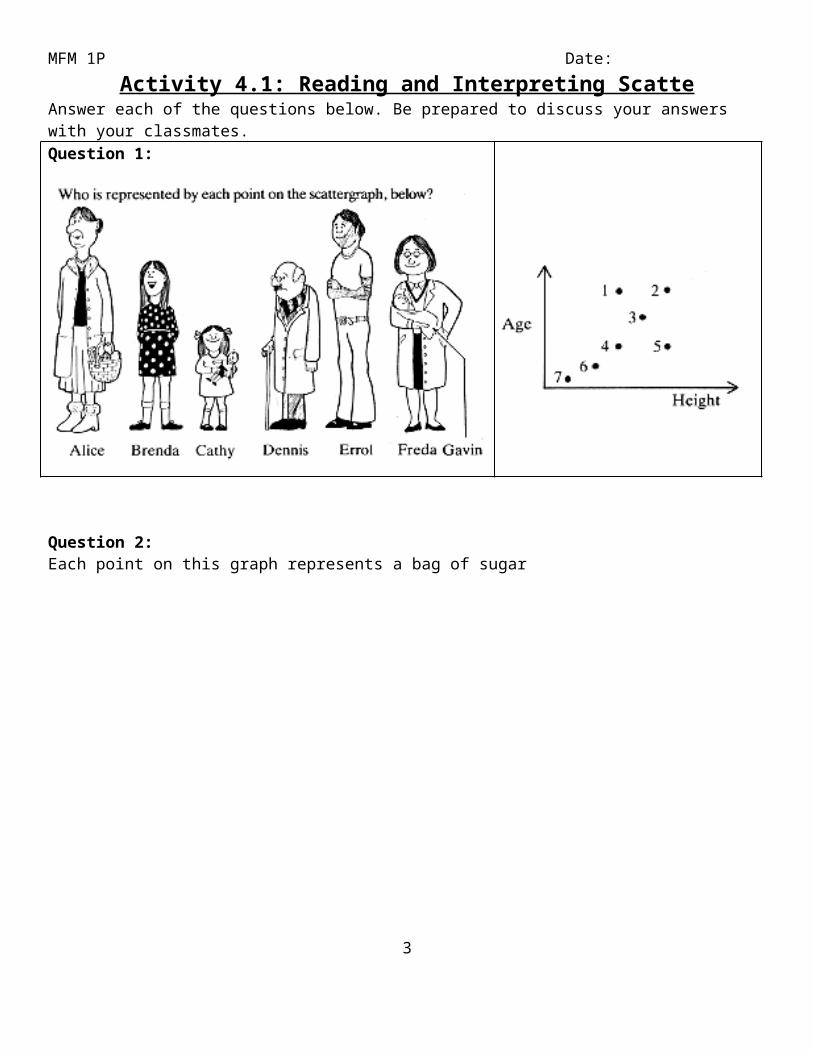
Answer each of the questions below. Be prepared to discuss your answers with your classmates. Question 1:
Question 2: Each point on this graph represents a bag of sugar
3
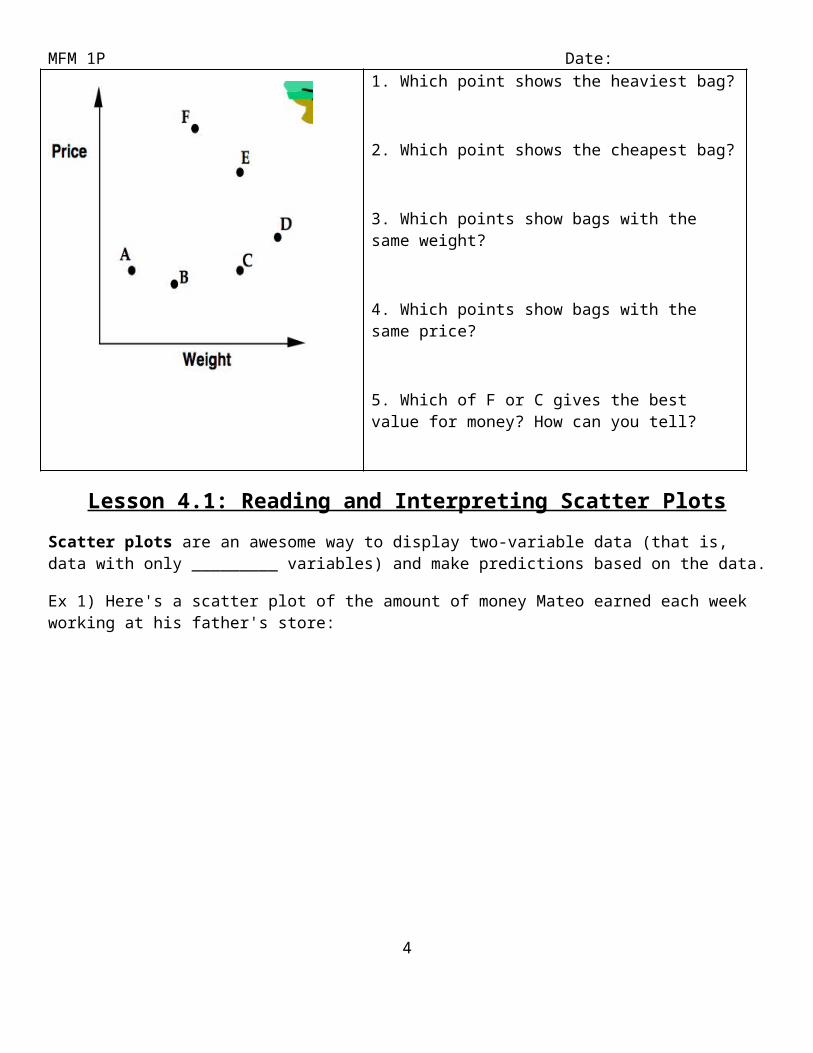
MFM 1P Date: 1. Which point shows the heaviest bag?
2. Which point shows the cheapest bag?
3. Which points show bags with the same weight?
4. Which points show bags with the same price?
5. Which of F or C gives the best value for money? How can you tell?
Lesson 4.1: Reading and Interpreting Scatter Plots
Scatter plots are an awesome way to display two-variable data (that is, data with only _________ variables) and make predictions based on the data.
Ex 1) Here's a scatter plot of the amount of money Mateo earned each week working at his father's store:
4

MFM 1P Date:
The weeks are plotted on the x-axis, and the amount of money he earned for that week is plotted on the y-axis. Label both axes, and give a title to the Scatter Plot.
Independent and Dependent Variables In general, the independent variable (the variable that isn't influenced by anything) is on the x-axis, and the dependent variable (the one that is affected by the independent variable) is plotted on the y-axis.
Ex 1) Explain why weeks is consider the independent variable and Mateo’s paycheck is considered the dependent variable.
OutliersAn outlier is a data point that stand out noticeable from the general behavior of the data set. In other words, it does not follow the trend.
Ex 2) Do there appear to be any outliers in the data? If yes, label it. Provide an explanation for the outlier(s).
5
MFM 1P Date: Correlation
With scatter plots we often talk about how the variables relate to each other. This is called correlation. There are three types of correlation: positive, negative, and none (no correlation).
● Positive Correlation: as one variable increases so does the other. o Height and shoe size are an example; as one's height increases so does the shoe size.
● Negative Correlation: as one variable increases, the other decreases. o Time spent studying and time spent on video games are negatively correlated; as your time
studying increases, time spent on video games decreases.
● No Correlation: there is no apparent relationship between the variables. o Video game scores and shoe size appear to have no correlation; as one increases, the other one
is not affected.
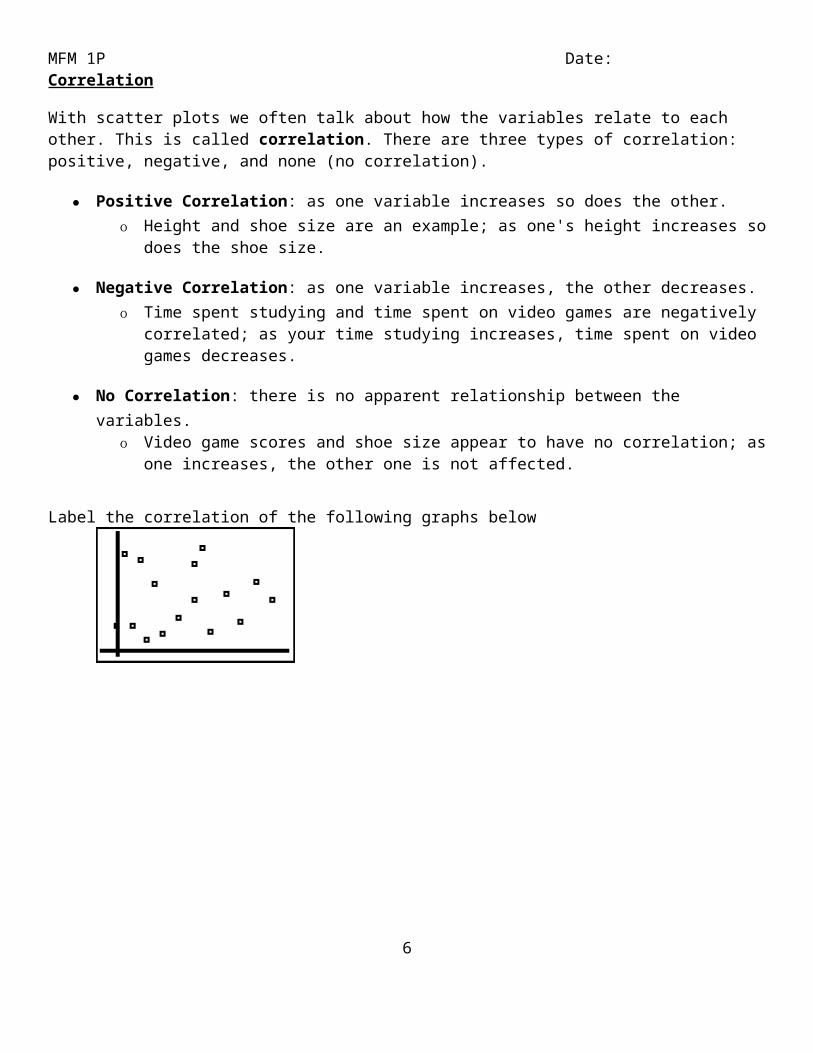
Label the correlation of the following graphs below
6
MFM 1P Date:
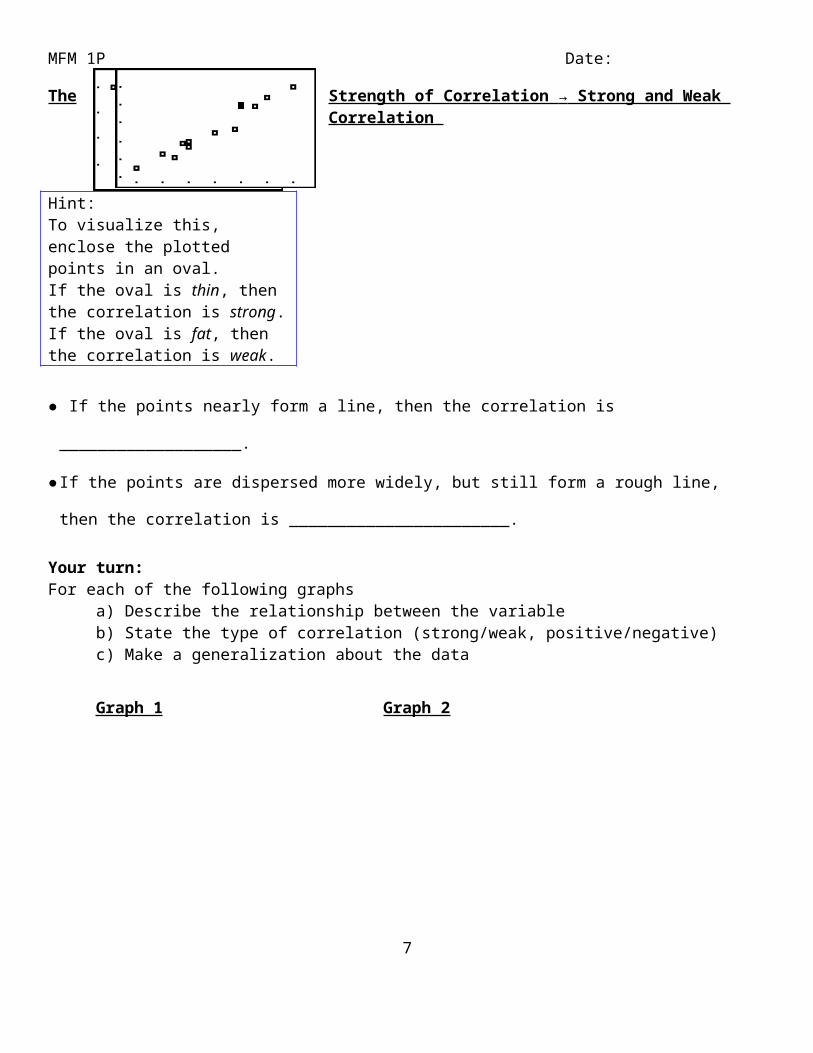
The Strength of Correlation → Strong and Weak Correlation
Hint:To visualize this, enclose the plotted points in an oval.If the oval is thin, then the correlation is strong.If the oval is fat, then the correlation is weak.
● If the points nearly form a line, then the correlation is ___________________.
● If the points are dispersed more widely, but still form a rough line, then the correlation is
_______________________.
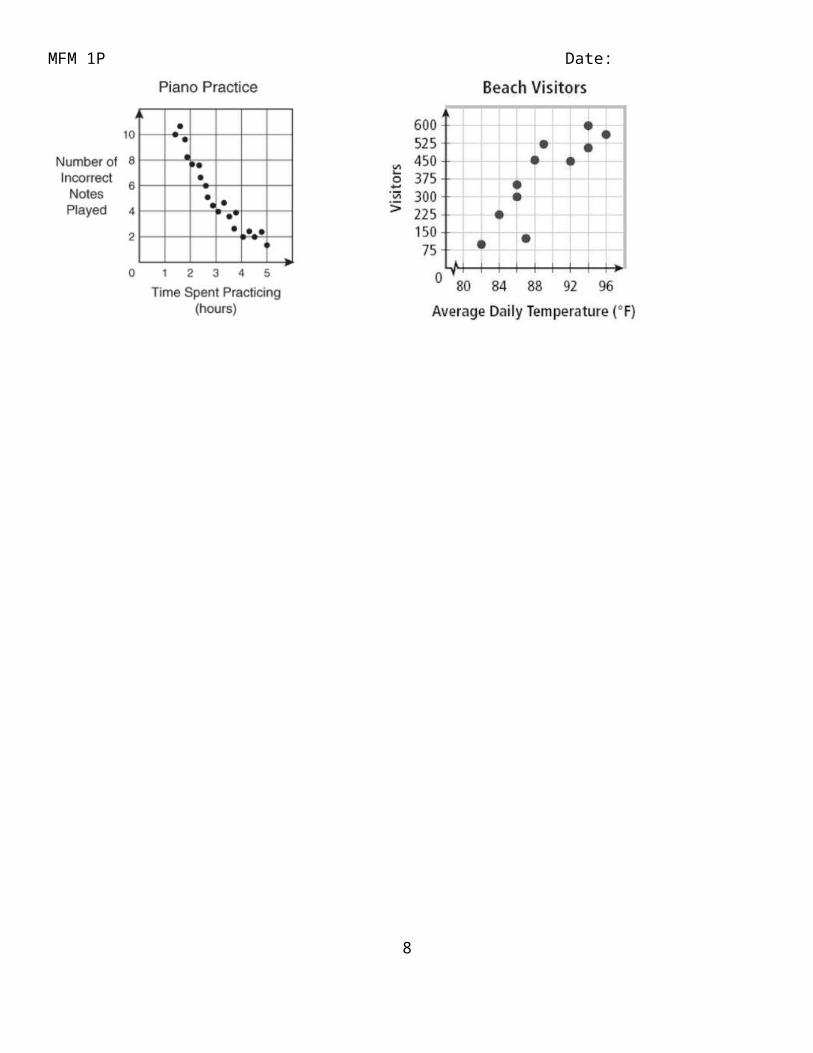
Your turn:For each of the following graphs
a) Describe the relationship between the variable b) State the type of correlation (strong/weak, positive/negative)c) Make a generalization about the data
Graph 1 Graph 2
7
MFM 1P Date:
8
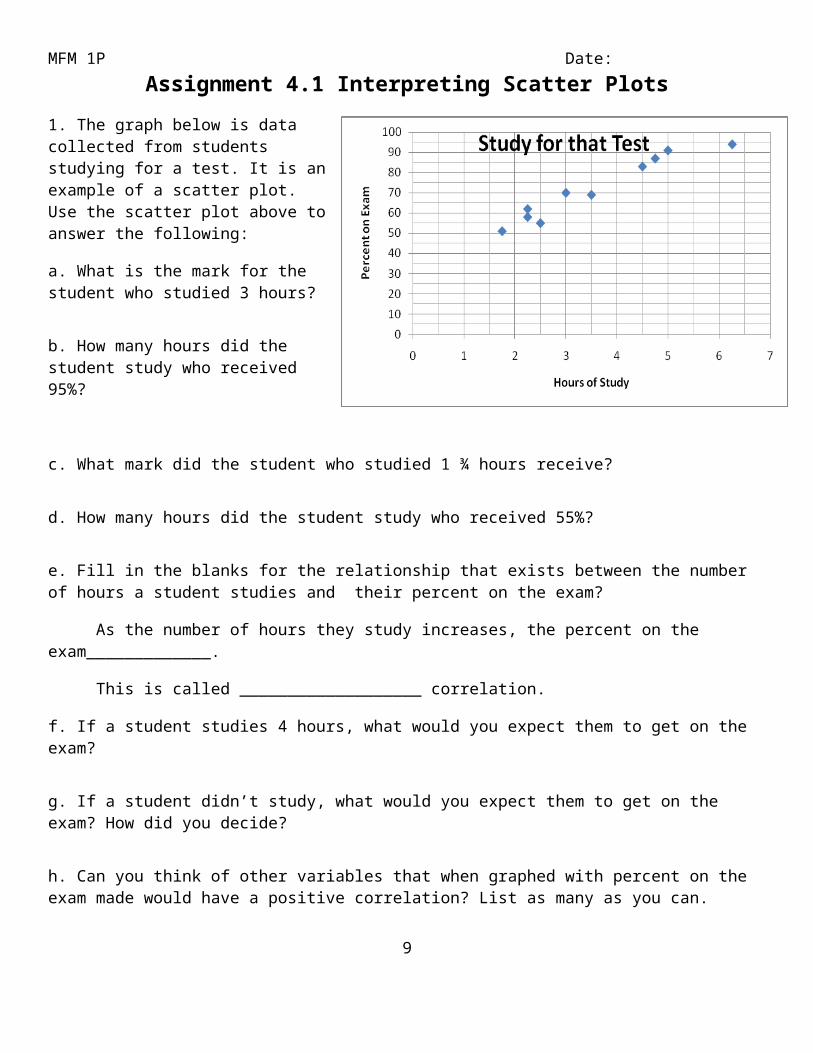
MFM 1P Date: Assignment 4.1 Interpreting Scatter Plots
1. The graph below is data collected from students studying for a test. It is an example of a scatter plot. Use the scatter plot above to answer the following:
a. What is the mark for the student who studied 3 hours?
b. How many hours did the student study who received 95%?
c. What mark did the student who studied 1 ¾ hours receive?
d. How many hours did the student study who received 55%?
e. Fill in the blanks for the relationship that exists between the number of hours a student studies and their percent on the exam?
As the number of hours they study increases, the percent on the exam_____________.
This is called ___________________ correlation.
f. If a student studies 4 hours, what would you expect them to get on the exam?
g. If a student didn’t study, what would you expect them to get on the exam? How did you decide?
h. Can you think of other variables that when graphed with percent on the exam made would have a positive correlation? List as many as you can.
9

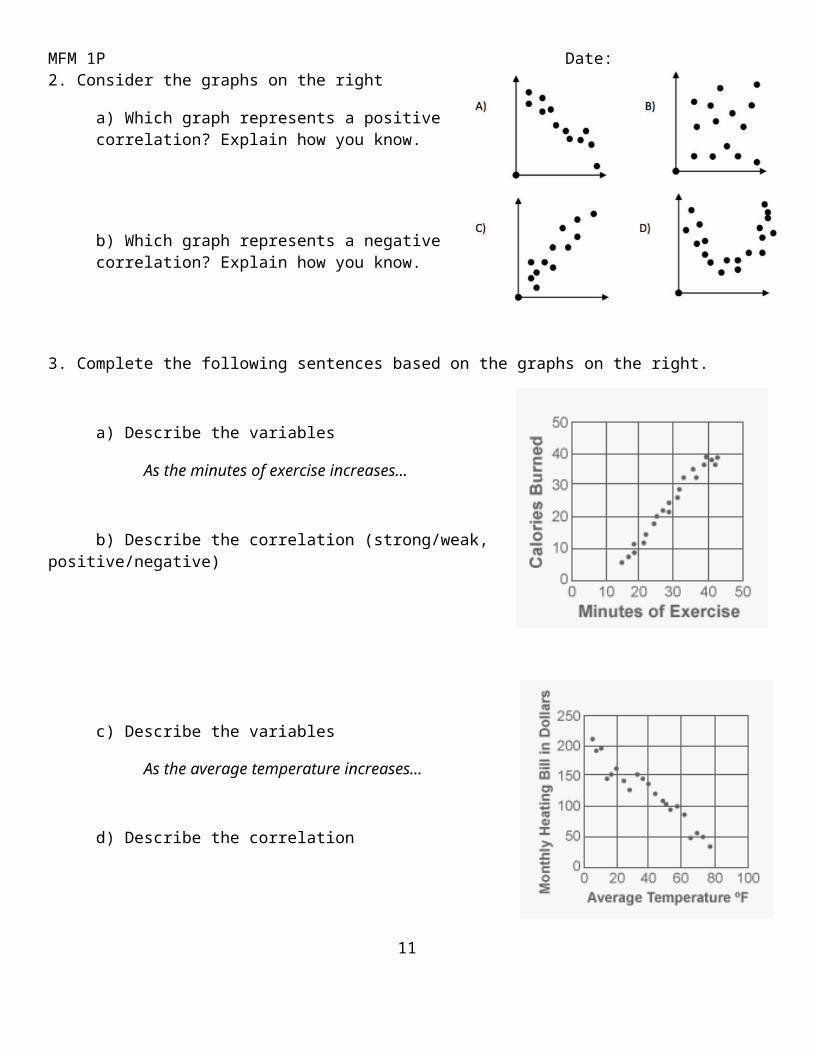
MFM 1P Date: 2. Consider the graphs on the right
a) Which graph represents a positive correlation? Explain how you know.
b) Which graph represents a negative correlation? Explain how you know.
3. Complete the following sentences based on the graphs on the right.
a) Describe the variables
As the minutes of exercise increases…
b) Describe the correlation (strong/weak, positive/negative)
c) Describe the variables
As the average temperature increases…
d) Describe the correlation
10
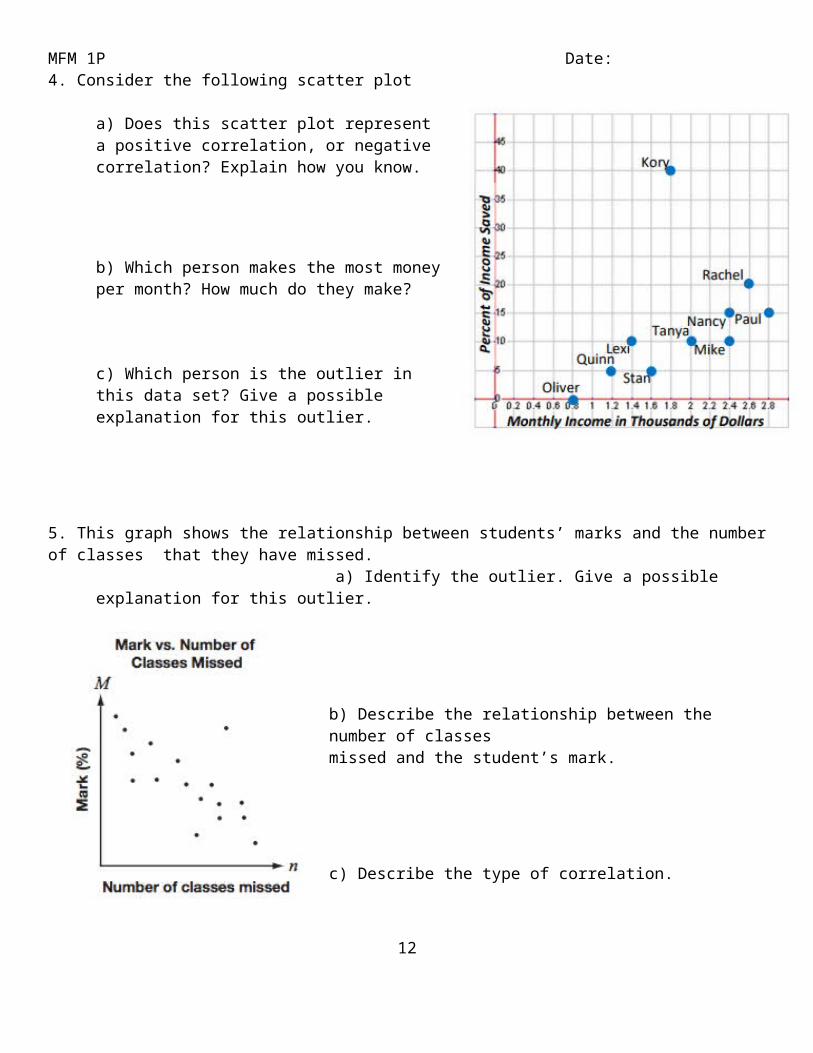
MFM 1P Date: 4. Consider the following scatter plot
a) Does this scatter plot represent a positive correlation, or negative correlation? Explain how you know.
b) Which person makes the most money per month? How much do they make?
c) Which person is the outlier in this data set? Give a possible explanation for this outlier.
5. This graph shows the relationship between students’ marks and the number of classes that they have missed.
a) Identify the outlier. Give a possible explanation for this outlier.
b) Describe the relationship between the number of classes missed and the student’s mark.
c) Describe the type of correlation.
11
MFM 1P Date:
12
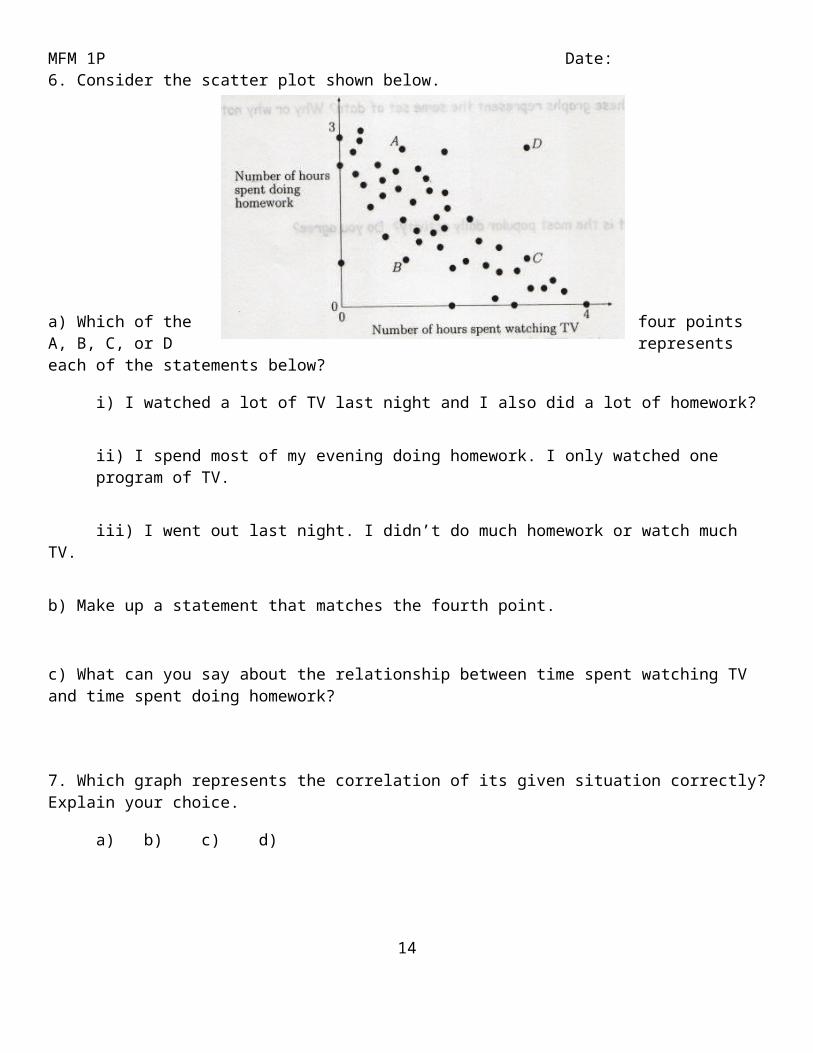
MFM 1P Date: 6. Consider the scatter plot shown below.
a) Which of the four points A, B, C, or D represents each of the statements below?
i) I watched a lot of TV last night and I also did a lot of homework?
ii) I spend most of my evening doing homework. I only watched one program of TV.
iii) I went out last night. I didn’t do much homework or watch much TV.
b) Make up a statement that matches the fourth point.
c) What can you say about the relationship between time spent watching TV and time spent doing homework?
7. Which graph represents the correlation of its given situation correctly? Explain your choice.
a) b) c) d)
13
MFM 1P Date:
14

MFM 1P Date: Activity 4.2: Independent and Dependent Variables
Consider the following 4 graphs, then answer the questions
1. Use words to describe each graph. Write your descriptions below. (Start each sentence with “As the age of the object increases….)
Graph A:
Graph B:
Graph C:
Graph D:
2. What are some possible objects that each of the graphs are describing? Justify your answers.
15

MFM 1P Date: Lesson 4.2: Independent and Dependent Variables
Recall: Scatter plots show the relationship between _________ sets of data (also known as variables)
Ex 1) Determine if the following scenarios represent could be represented with a scatter plot or not.
a) Lucas conducts an experiment where he records the number of speeding tickets issued in Iron County in a given year along with the average price of gasoline for that same given year. He collects this data from the year 1972 through 2012.
b) Lea conducts an experiment where she records the heights of all the NBA basketball players on the Miami Heat’s roster for the 2014 season.
c) Adel conducts an experiment where she records the selling price of several homes in a neighborhood.
d) Lisa conducts an experiment on the number of times a person works out a week and the person’s weight.
Positive or Negative Correlation
Often times, we do not need a scatter plot to predict the type of correlation that two variables will have.
Positive Correlation → As one variables increases, it causes the other variable to __________________
Negative Correlation → As one variable increases, it causes the other variable to __________________
No Correlation → As one variable increase, it has no effect on the other variable.
Ex 2) Decided if each of the following data sets would have positive, negative, or no correlation. (Note: We always say “In general…”, it doesn’t always have to be true, but in general it is.)
a) The number of hours a person has driven and the number of miles driven
b) The number of siblings a student has and the grade they have in math class
c) The age of a car and the value of the car
d) The number of weeks a song has been out and the weekly sales
e) The age of a house and the number of people living in the house
f) The number of songs downloaded on your phone and the amount of memory available 16

MFM 1P Date:
17
MFM 1P Date: Dependent and Independent Variables
If one variable is effecting another variable – we tend to call one the that is effecting a change the independent variable and the other one, the one that is responding to the change, the dependent variable.
Ex 3) Consider the following example: Decide which is the independent and dependent variable, if possible.
a) The temperature outside and the cost of air conditioning
b) The amount of body fat a person has and the time spent at working out at the gym.
c) The amount of gasoline you put in your car and the distance you can travel before your next fill up.
d) The amount of G-force on a fighter pilot and the speed of the jet
e) In general, the more years of education you complete, the higher your earning potential will be.
f) **The number of songs downloaded on your phone and the amount of memory available
IMPORTANT NOETS about independent and dependent variables
● The independent variable is located on the ___________ axis and ______ in the table of values
o Common independent variables are time (hours, minutes, age, etc.) and temperature.
● The dependent variable is located on the ____________ axis and ___________ in the table of values.
Ex 4) In the following situations, identify the independent (I) and dependent (D) variables and draw a sketch of what the graph would look like with the proper axis.
18

MFM 1P Date: A. Outdoor air temperature and amount of ice cream sold at a grocery store.
Independent Variable: _________________________
Dependent Variable: __________________________
B. A person’s age and their average yearly income
Independent Variable: _________________________
Dependent Variable: __________________________
BE CAREFUL → Correlation does not always imply causation!Two variables can show correlation, but one variable might not be causing/effecting change in the other.
Ex 5) Consider the following example
An ice cream store records the number of sunglasses were sold at the store and compares it to the number of ice cream cones that were sold. Here is the scatter plot of their results.
What do you notice?
What is a lurking variable?
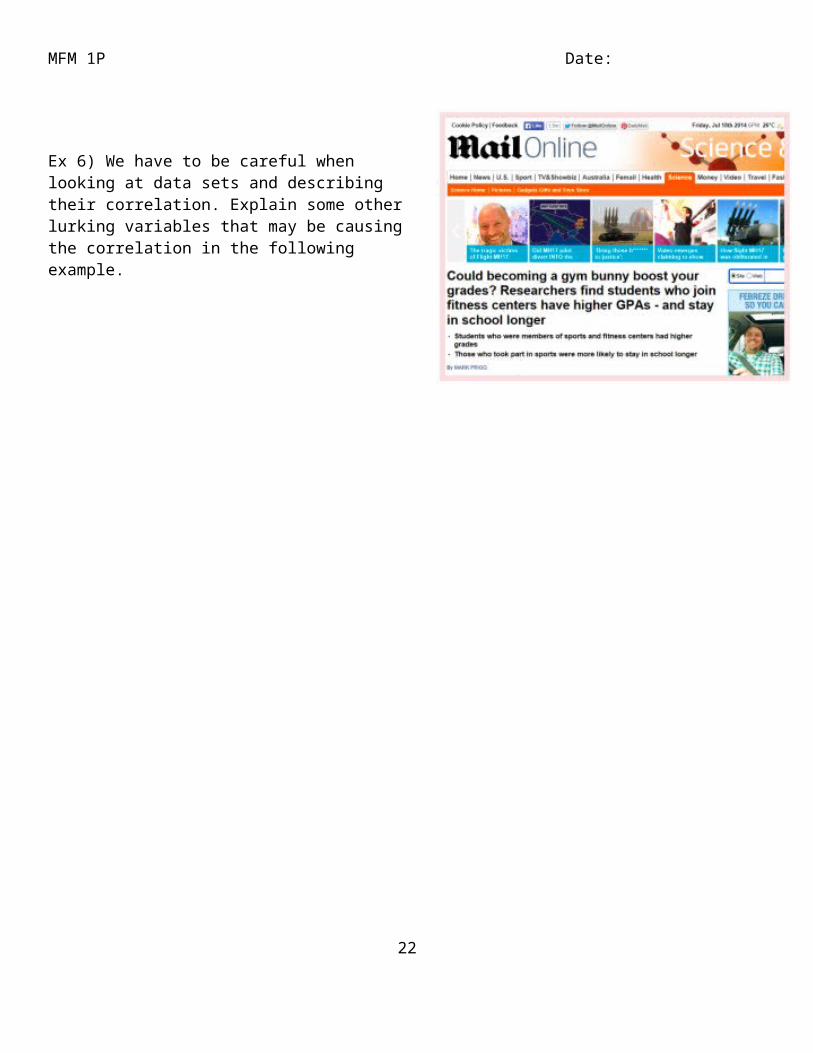
Ex 6) We have to be careful when looking at data sets and describing their correlation. Explain some other lurking variables that may be causing the correlation in the following example.
19

MFM 1P Date: Assignment 4.2: Independent and Dependent Variables
1. Decided if each of the following data sets would have positive, negative, or no correlation. (Note: We always say “In general…”, it doesn’t always have to be true, but in general it is.)
a) shoe size and weight of a person
b) day of the week and temperature
c) cost to heat a house and outside temperature
d) the amount of study time and the score on a test
e) the amount of time a heater is on and the temperature of the room
f) the amount of time a candle is burned and the height of the candle
g) a child’s height versus age
h) a person’s height versus eye color
i) a person’s height versus number of pets owned
20

MFM 1P Date: 2. For each situation below, decide which of the variables is independent and which is dependent. Write your choice beside the variables.
a) The electric company charges its customers based on usage. The billing amount is based on the quantity of electricity consumed.
the billing amount ____________________________
the quantity of electricity consumed ____________________________
b) Emily is selling lemonade. The number of cups of lemonade she sells determines how much money she earns.
the number of cups of lemonade Emily sells ____________________________the amount of money Emily earns ____________________________
c) Jeffrey, a food blogger, receives payment from an advertiser each month. The amount of money he earns depends on how many site visitors he receives each month.
the amount of money Jeffrey earns ____________________________the number of visitors Jeffrey receives ____________________________
d) Carmen is purchasing watermelons for a watermelon-eating contest at her company picnic. The number of people who have entered the contest determines how many watermelons Carmen will purchase.
the number of people who have entered in the contest ____________________________the number of watermelons to be purchased ____________________________
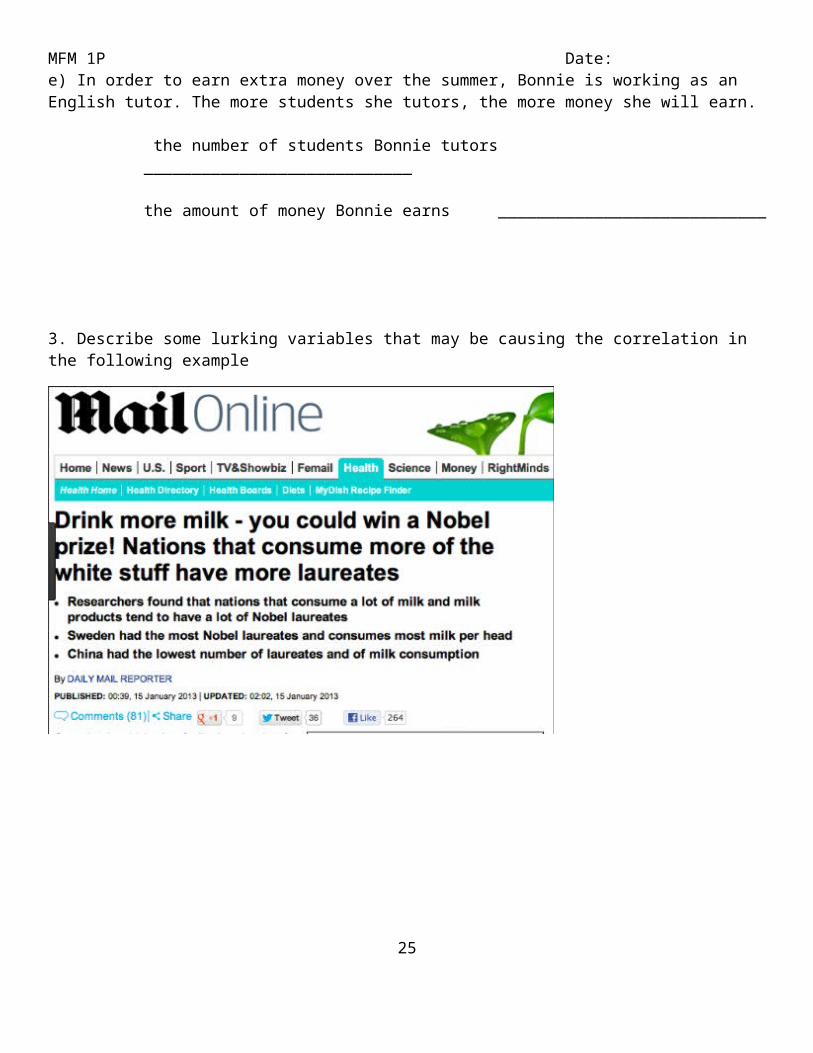
e) In order to earn extra money over the summer, Bonnie is working as an English tutor. The more students she tutors, the more money she will earn.
the number of students Bonnie tutors ____________________________
the amount of money Bonnie earns ____________________________
3. Describe some lurking variables that may be causing the correlation in the following example21
MFM 1P Date:
22

MFM 1P Date: Lesson 4.3: Drawing Scatter Plots
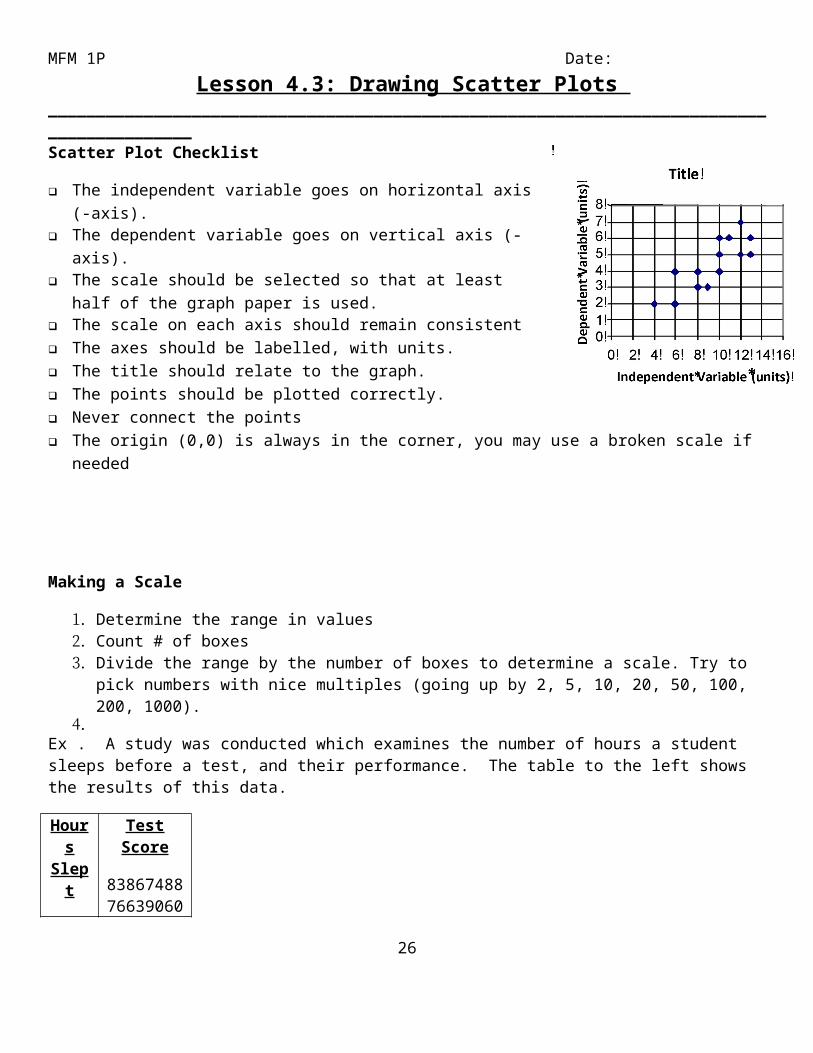
__________________________________________________________________________________________Scatter Plot Checklist
❑ The independent variable goes on horizontal axis (-axis).❑ The dependent variable goes on vertical axis (-axis).❑ The scale should be selected so that at least half of the graph paper is
used.❑ The scale on each axis should remain consistent❑ The axes should be labelled, with units.❑ The title should relate to the graph.❑ The points should be plotted correctly.❑ Never connect the points❑ The origin (0,0) is always in the corner, you may use a broken scale if
needed
Making a Scale
1. Determine the range in values2. Count # of boxes3. Divide the range by the number of boxes to determine a scale. Try to pick numbers
with nice multiples (going up by 2, 5, 10, 20, 50, 100, 200, 1000).4.
Ex . A study was conducted which examines the number of hours a student sleeps before a test, and their performance. The table to the left shows the results of this data.
Hours Slept
8778657497
Test Score
8386748876639060
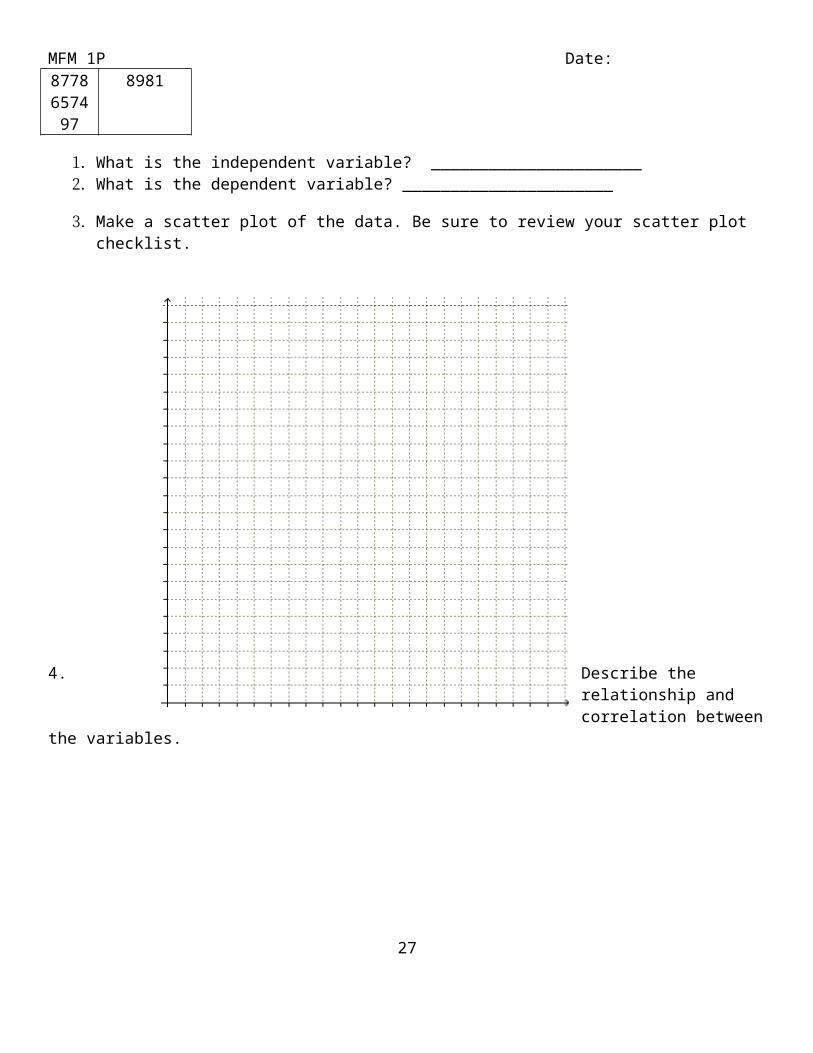
8981
1. What is the independent variable? ______________________2. What is the dependent variable? ______________________
3. Make a scatter plot of the data. Be sure to review your scatter plot checklist.
23

MFM 1P Date:
4. Describe the relationship and correlation between the variables.
24
MFM 1P Date:
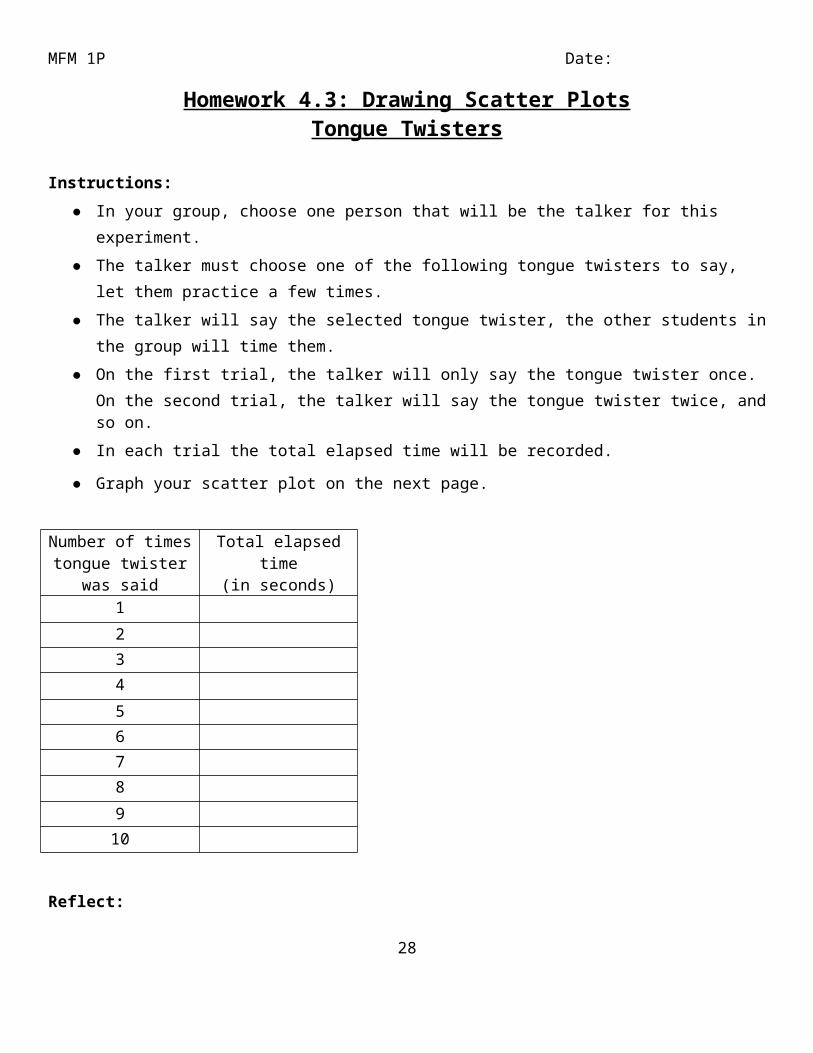
Homework 4.3: Drawing Scatter PlotsTongue Twisters
Instructions:
● In your group, choose one person that will be the talker for this experiment.
● The talker must choose one of the following tongue twisters to say, let them practice a few times.
● The talker will say the selected tongue twister, the other students in the group will time them.
● On the first trial, the talker will only say the tongue twister once. On the second trial, the talker will say the tongue twister twice, and so on.
● In each trial the total elapsed time will be recorded.
● Graph your scatter plot on the next page.
Number of times tongue twister was
said
Total elapsed time(in seconds)
1
234
5678
910
Reflect:
1. What type of correlation do you notice?
2. What is important when drawing a scatter plot?
25
MFM 1P Date:
26
MFM 1P Date:
Lesson 4.4: Lines of Best Fit (LOBF)
27
MFM 1P Date:
Warm Up:
28

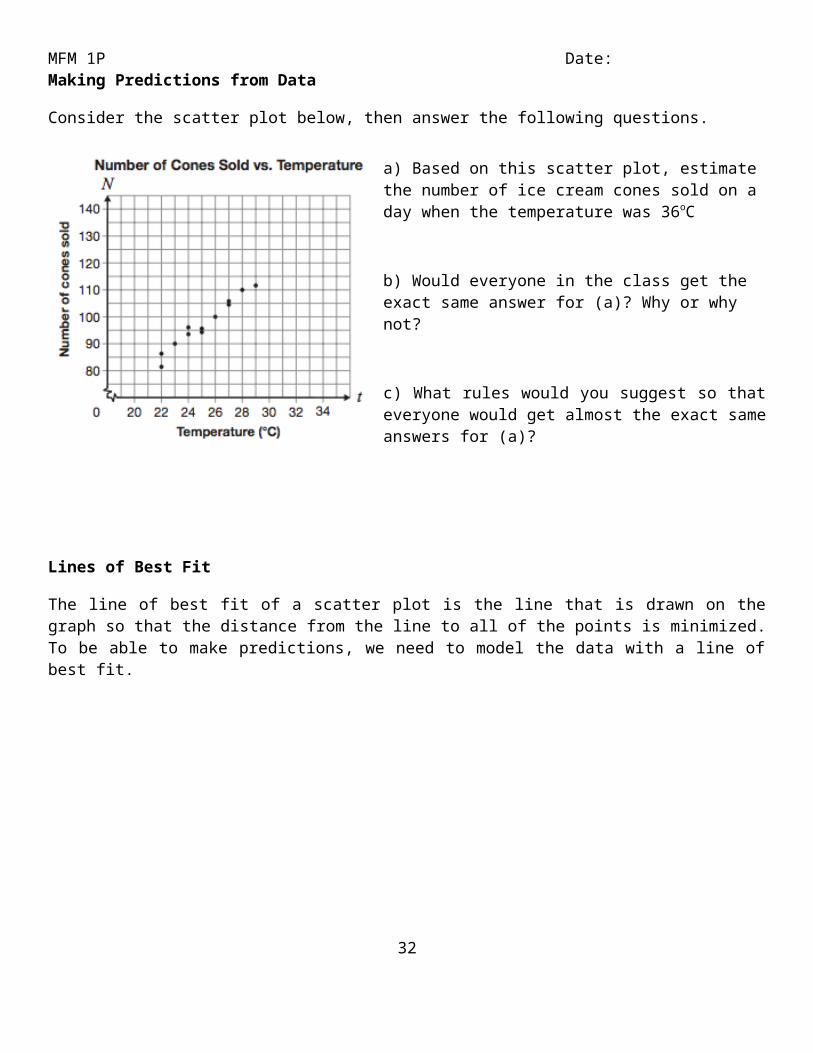
MFM 1P Date: Making Predictions from Data
Consider the scatter plot below, then answer the following questions.
a) Based on this scatter plot, estimate the number of ice cream cones sold on a day when the temperature was 36oC
b) Would everyone in the class get the exact same answer for (a)? Why or why not?
c) What rules would you suggest so that everyone would get almost the exact same answers for (a)?
Lines of Best Fit
The line of best fit of a scatter plot is the line that is drawn on the graph so that the distance from the line to all of the points is minimized. To be able to make predictions, we need to model the data with a line of best fit.
29
MFM 1P Date:
Understanding Lines of Best Fit
Lines of best fit are useful when we want to predict what we ________________ to happen. We can use lines of best fit to see what would happen if the trend continues.
Ex 3) Draw a Line of Best fit for the scatter plot below:Think about it: Do you include an outlier point in you consideration when creating a line of best fit?
Recall: We always identify any outliers by circling the point on the scatter plot.
Interpolate
● When you interpolate, you are making a prediction __________ the data.You are interpolating when the value you are finding is somewhere between the first point and the last point.
● These predictions are usually fairly _________.
30
MFM 1P Date:
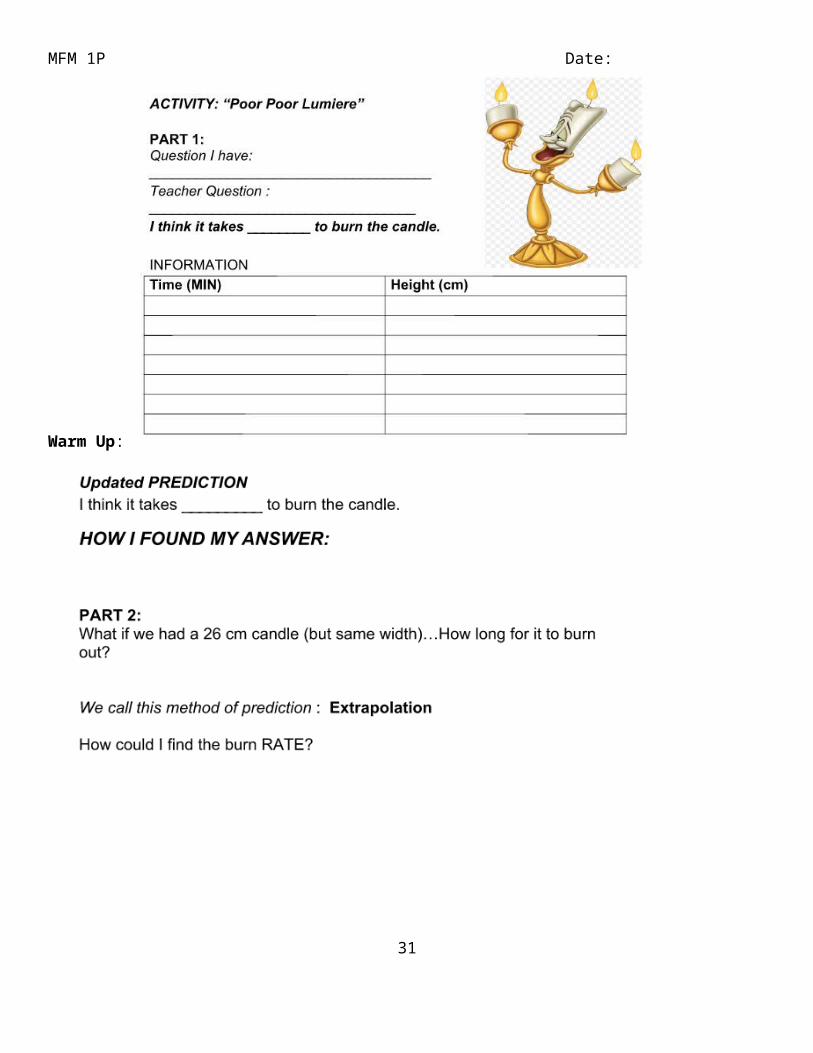
ExtrapolateYou are extrapolating when the value you are finding is before the first point or after the last point. This means you may need to extend the line.
● When you extrapolate, you are making a prediction _____________ the data.
● It often requires you to _______________the line.
● These predictions are less ______________.
Making Predictions - Use your line of best fit to estimate the following:
Question Answer Method of PredictionA student’s mark if they studied for 4 hours.A student’s mark if they did not study.How long a student studied for if they received 60 out of 100.How long a student studied for if they received 100 out of 100.
Assignment 4.4 Lines of Best Fit
1. Identify the outlier, if any exist, then draw a line of best fit. Check your lines of best fit with your elbow partner, do they look the same?
31
MFM 1P Date:
32
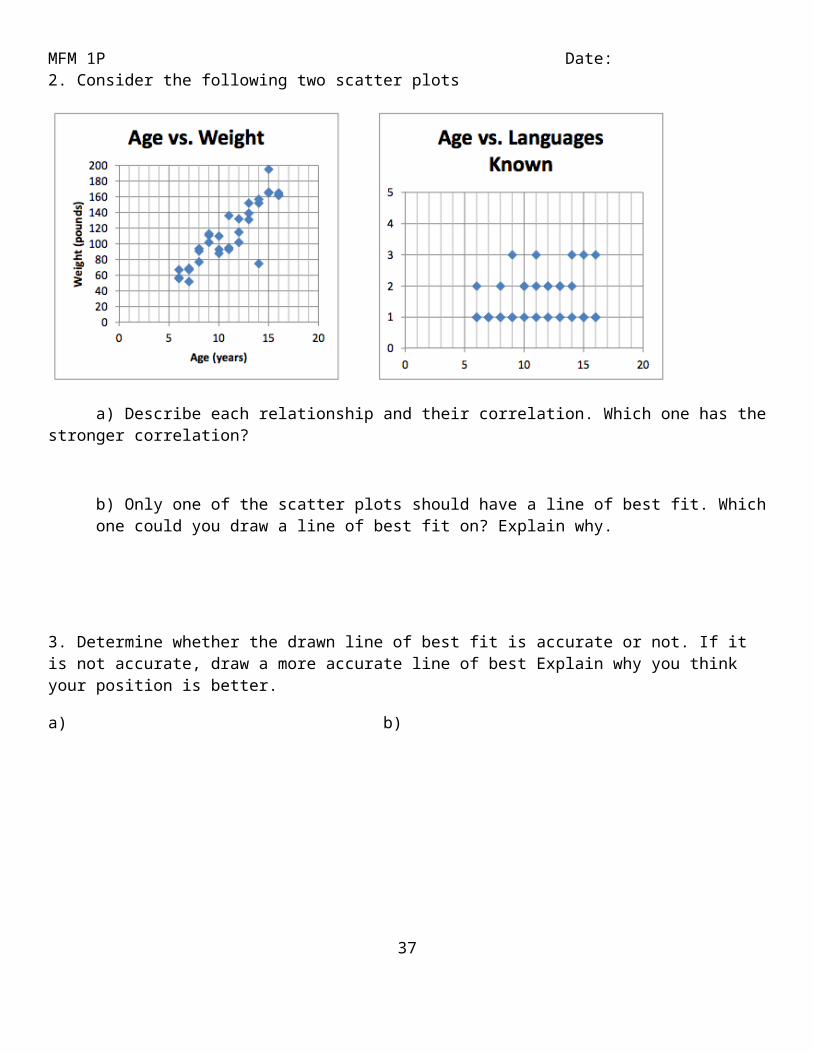
MFM 1P Date: 2. Consider the following two scatter plots
a) Describe each relationship and their correlation. Which one has the stronger correlation?
b) Only one of the scatter plots should have a line of best fit. Which one could you draw a line of best fit on? Explain why.
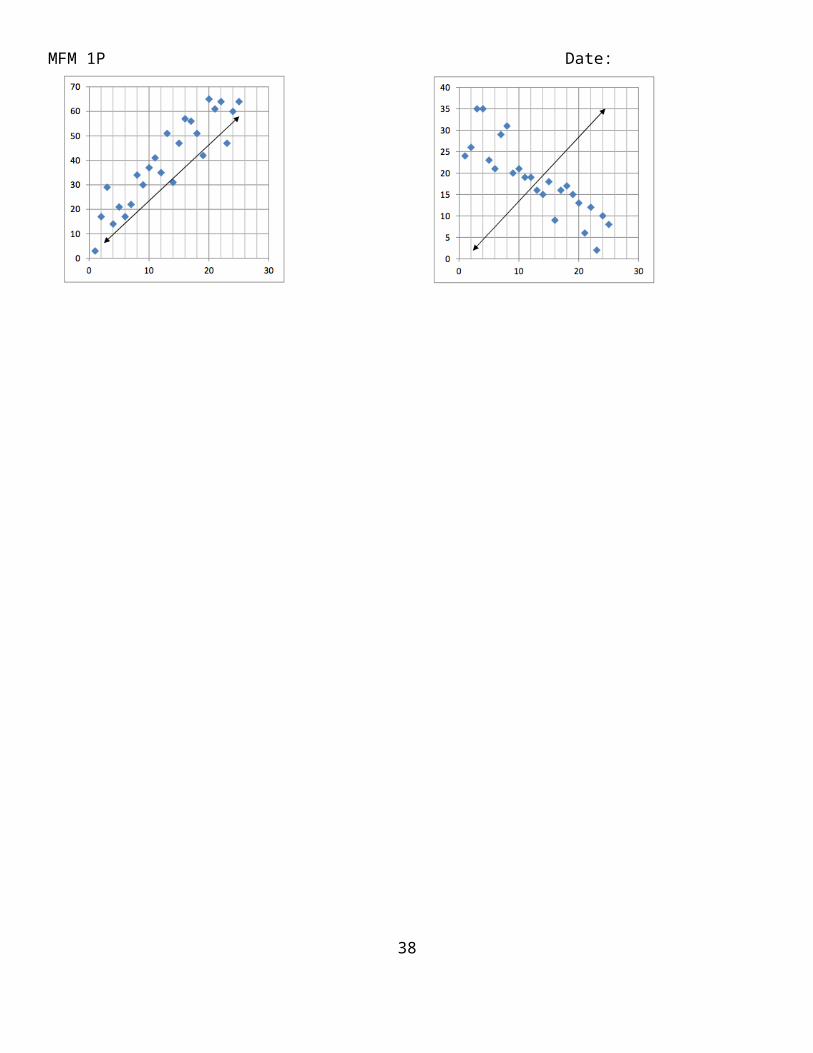
3. Determine whether the drawn line of best fit is accurate or not. If it is not accurate, draw a more accurate line of best Explain why you think your position is better.
a) b)
33

MFM 1P Date:
c) d)
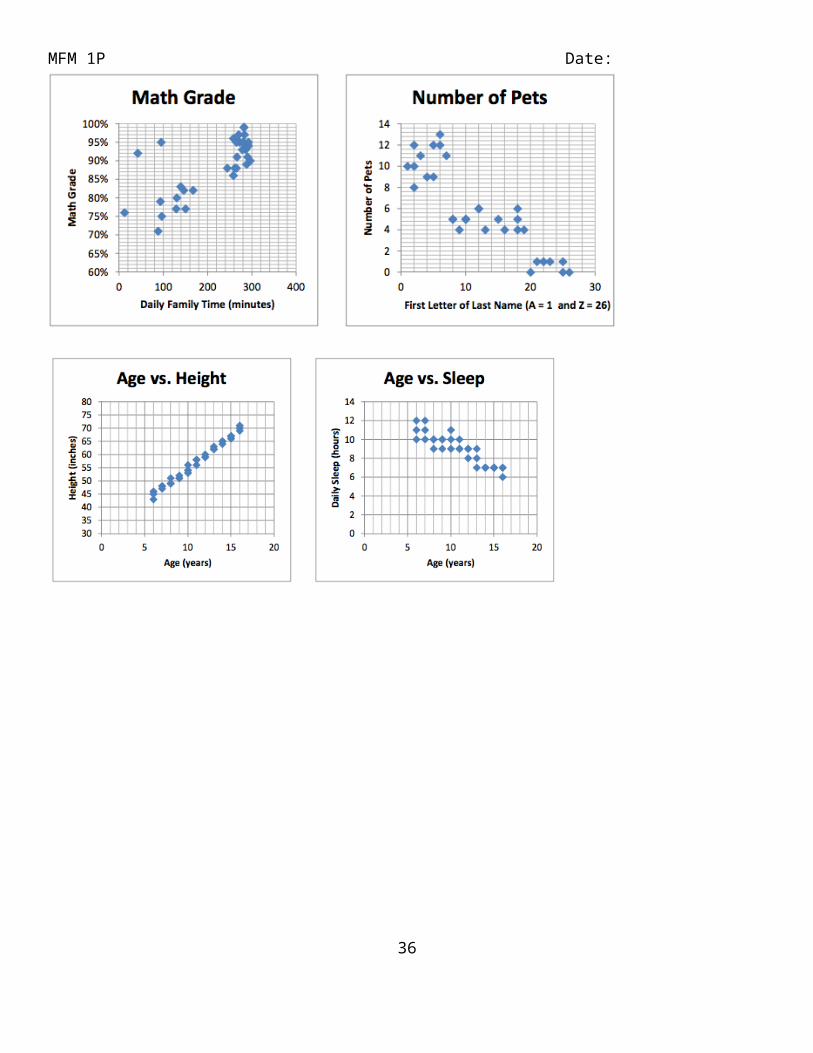
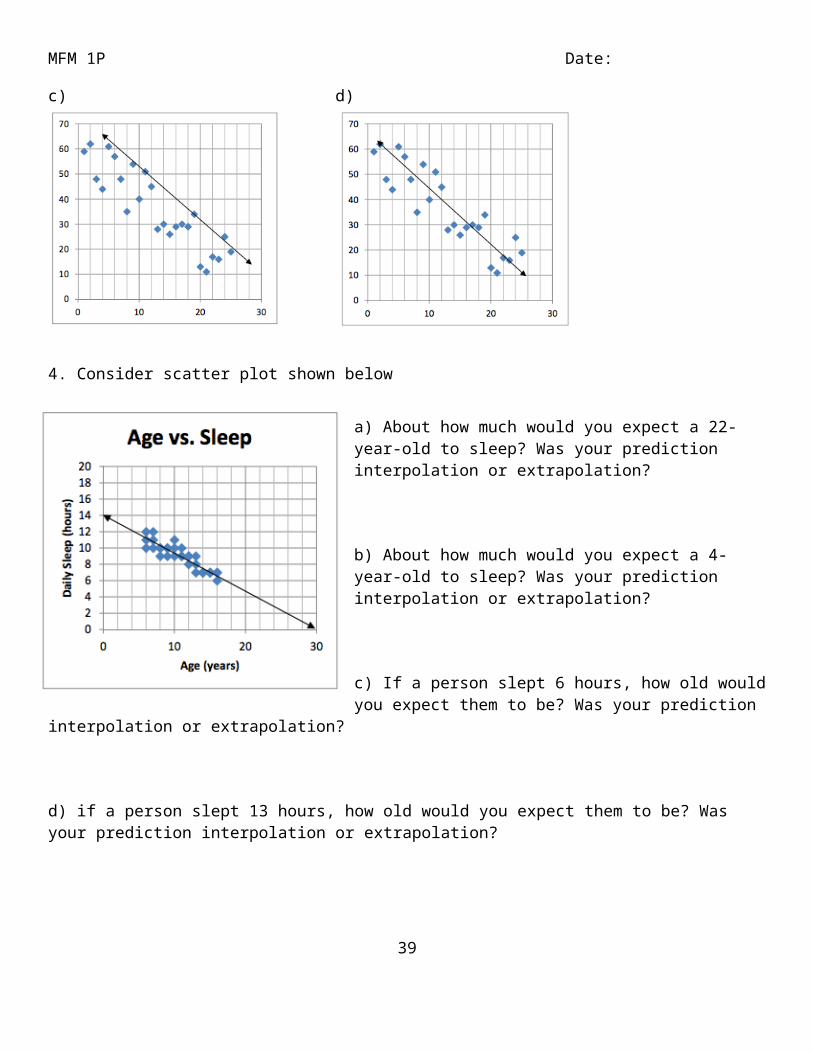
4. Consider scatter plot shown below
a) About how much would you expect a 22-year-old to sleep? Was your prediction interpolation or extrapolation?
b) About how much would you expect a 4-year-old to sleep? Was your prediction interpolation or extrapolation?
c) If a person slept 6 hours, how old would you expect them to be? Was your prediction interpolation or extrapolation?
d) if a person slept 13 hours, how old would you expect them to be? Was your prediction interpolation or extrapolation?
34

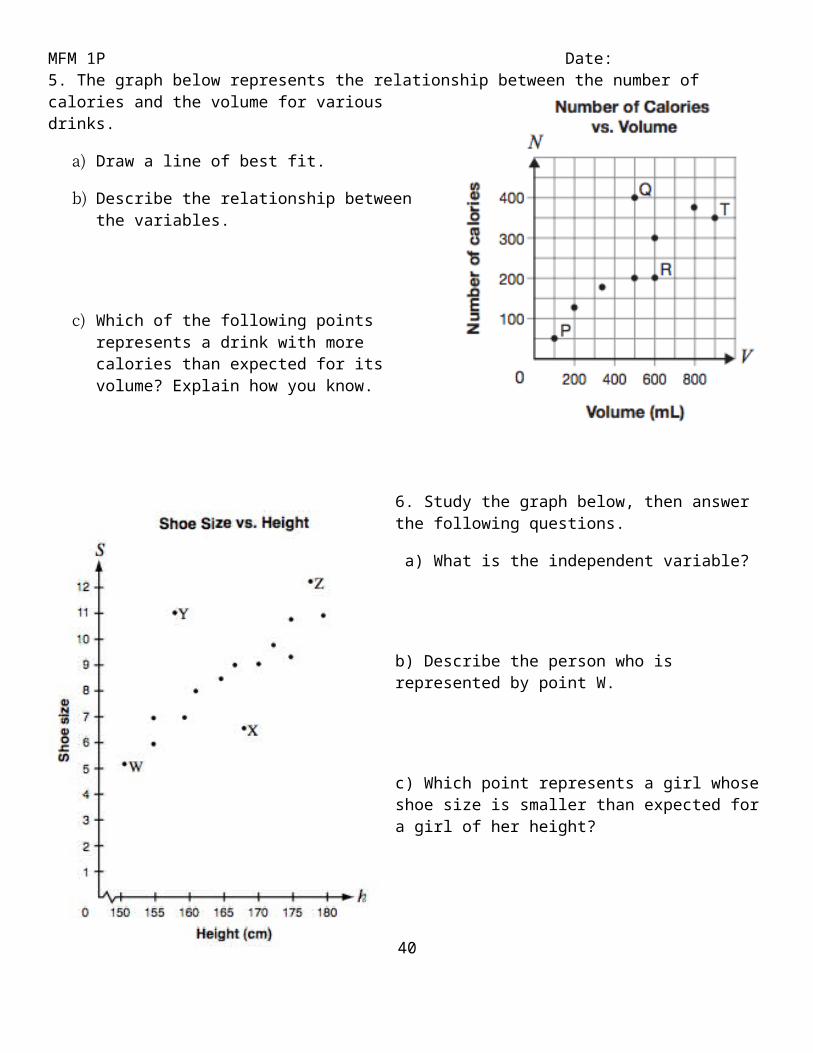
MFM 1P Date: 5. The graph below represents the relationship between the number of calories and the volume for various drinks.
a) Draw a line of best fit.
b) Describe the relationship between the variables.
c) Which of the following points represents a drink with more calories than expected for its volume? Explain how you know.
6. Study the graph below, then answer the following questions.
a) What is the independent variable?
b) Describe the person who is represented by point W.
c) Which point represents a girl whose shoe size is smaller than expected for a girl of her height?
35
MFM 1P Date:
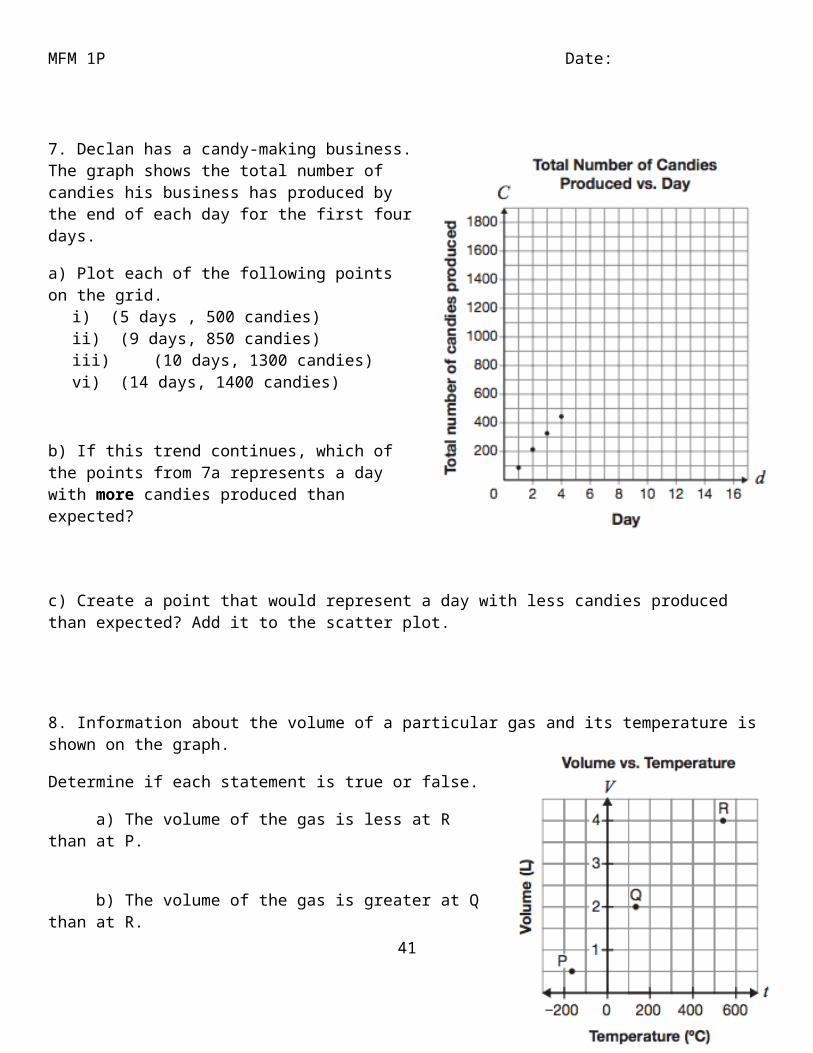
7. Declan has a candy-making business. The graph shows the total number of candies his business has produced by the end of each day for the first four days.
a) Plot each of the following points on the grid.i) (5 days , 500 candies)ii) (9 days, 850 candies)iii) (10 days, 1300 candies) vi) (14 days, 1400 candies)
b) If this trend continues, which of the points from 7a represents a day with more candies produced than expected?
c) Create a point that would represent a day with less candies produced than expected? Add it to the scatter plot.
8. Information about the volume of a particular gas and its temperature is shown on the graph.
Determine if each statement is true or false.
a) The volume of the gas is less at R than at P.
b) The volume of the gas is greater at Q than at R.
c) The temperature of the gas is lower at P than at Q.
d) The temperature of the gas is higher at Q than at R.
36
MFM 1P Date: e) If the temperature of the gas is 400 oC, what would you expect the volume to be?
37
MFM 1P Date: Activity 4.5 Linear and Non-Linear Relationships
Review: Fill in the blanks
● A linear relation is a relationship in which the graph forms a straight _______________________.
● When a scatter plot shows a linear trend, a _______________________________ can be used as a
model for the relationship.
● Making a prediction inside the data is called __________________________. This type of prediction is
usually reliable.
● Making a prediction external to the data is called __________________________. When extrapolating,
you extend the line of best fit beyond your data, so this type of prediction is usually less reliable.
● When drawing a line of best fit, make sure that you remember….
● The line should go through as many _________________ as possible.
● The line must follow the ______________________ in the data.
● There should be approximately the same number of points _____________ and ___________ the line.
● You should not use only the beginning and end point to draw your line of best fit.
● You need to use a _________________ when drawing your line of best fit.
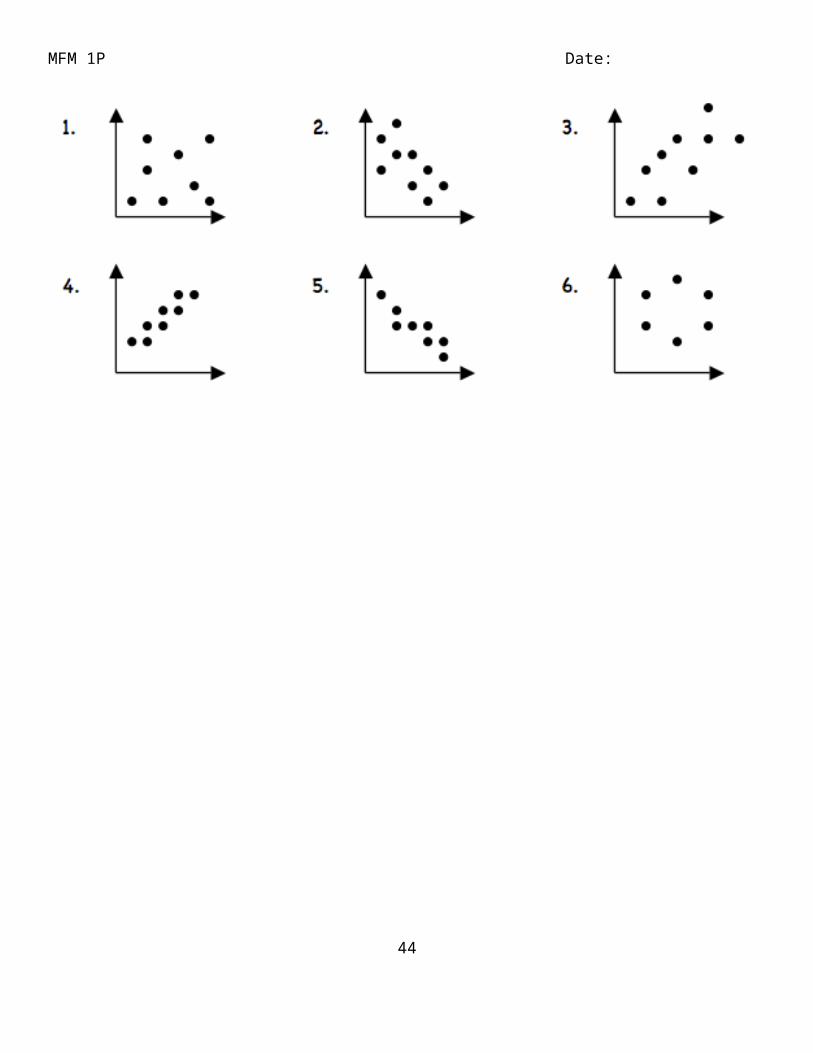
Review: Describe the type of correlation shown in each of the scatter plots below.
38
MFM 1P Date:
39
MFM 1P Date: Lesson 4.5 Linear and Non-Linear Relationships
LINEAR vs. NON-LINEAR Correlation
● If the points form a relatively straight line on a scatter plot, we say that there is a _______________
relationship.
● A _________________________ of best fit can be used to model a linear relationship.
● BUT…..If the points do not form a relatively straight
line on a scatter plot, but a trend is still evident, we say that
there is a _______________ relationship.
● A _________________________ of best fit can be used
to model a linear relationship.
Example: Draw a curve of best fit for the following scatter plot.
Practice Problems:
1. Write two key words to describe each relation, then draw a line or curve of best fit.
a) b)
40
MFM 1P Date:
41

MFM 1P Date:
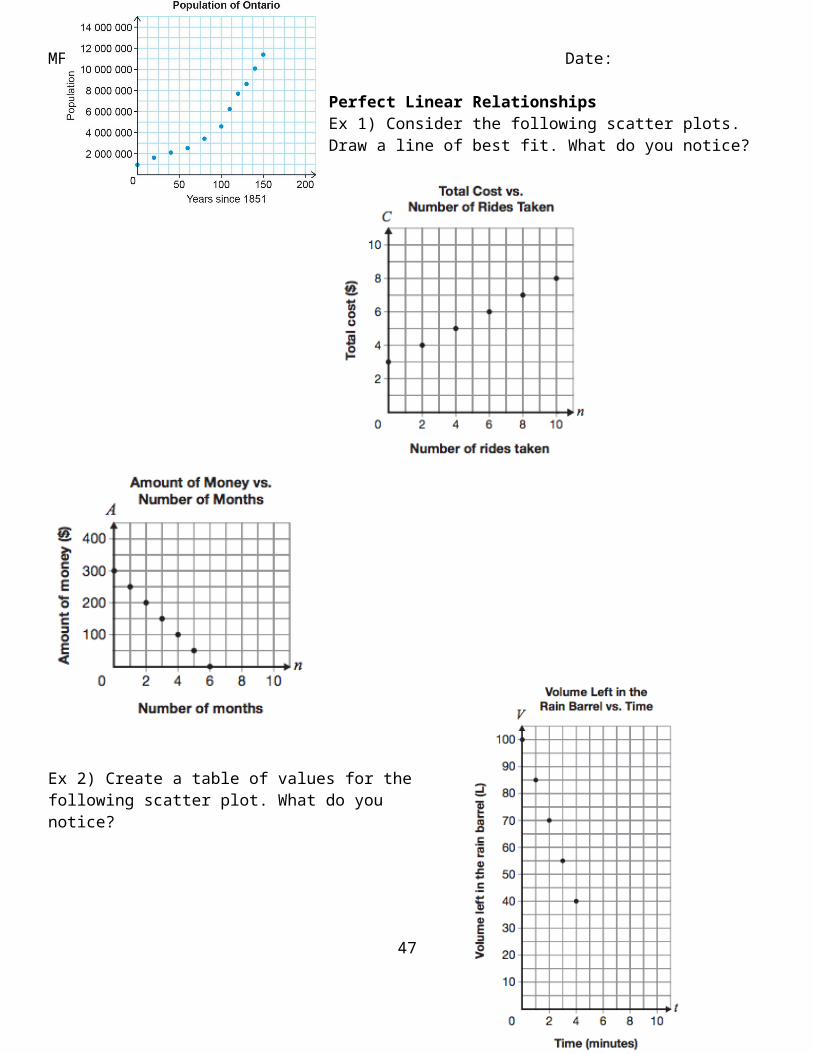
Perfect Linear RelationshipsEx 1) Consider the following scatter plots. Draw a line of best fit. What do you notice?
Ex 2) Create a table of values for the following scatter plot. What do you notice?
42
MFM 1P Date:
Reflect: What makes a perfect linear relationship?
43
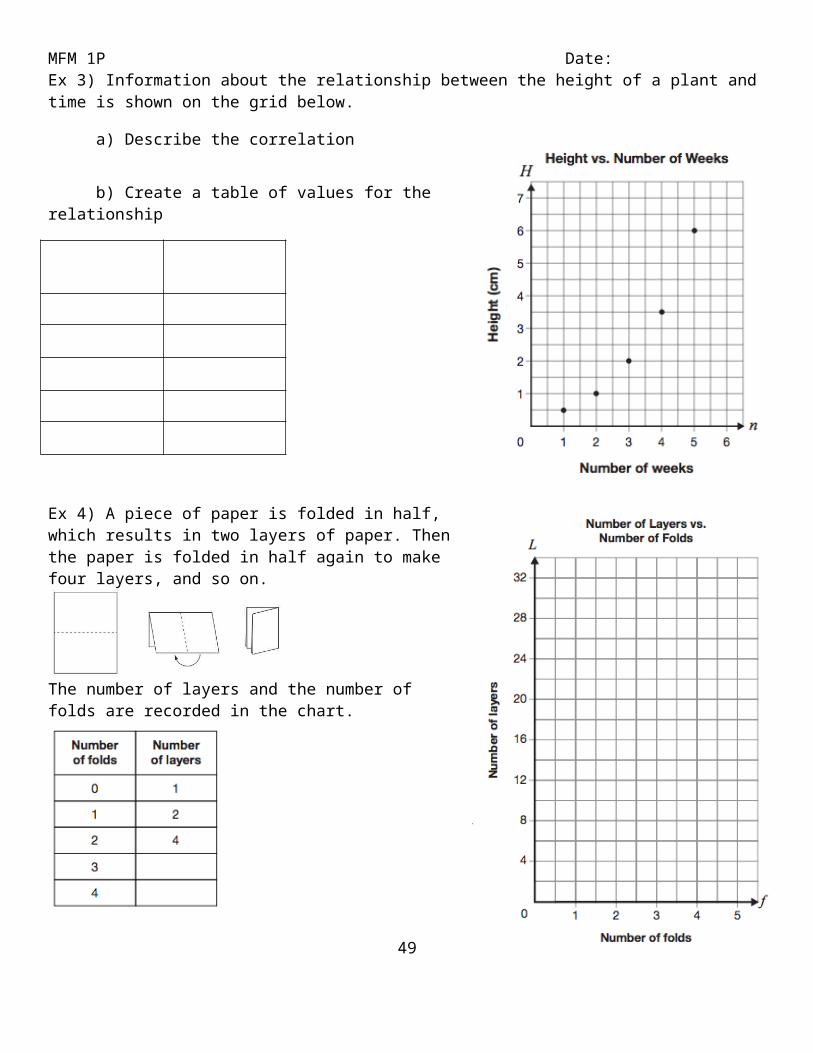
MFM 1P Date: Ex 3) Information about the relationship between the height of a plant and time is shown on the grid below.
a) Describe the correlation
b) Create a table of values for the relationship
Ex 4) A piece of paper is folded in half, which results in two layers of paper. Then the paper is folded in half again to make four layers, and so on.
The number of layers and the number of folds are recorded in the chart.
Determine whether this relationship is linear or non-linear. Justify your answer
44

MFM 1P Date:
Assignment 4.5 Linear or Non-Linear Relationships
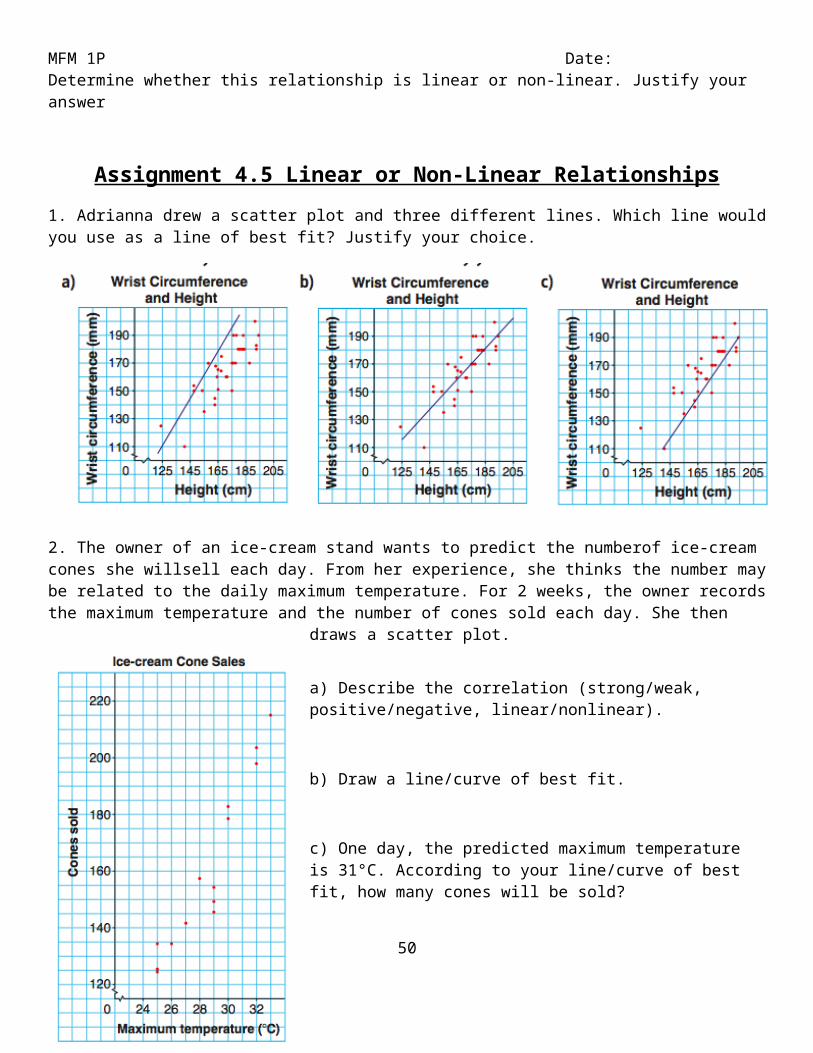
1. Adrianna drew a scatter plot and three different lines. Which line would you use as a line of best fit? Justify your choice.
2. The owner of an ice-cream stand wants to predict the numberof ice-cream cones she willsell each day. From her experience, she thinks the number may be related to the daily maximum temperature. For 2 weeks, the owner records the maximum temperature and the number of cones sold each day. She then draws a scatter plot.
a) Describe the correlation (strong/weak, positive/negative, linear/nonlinear).
b) Draw a line/curve of best fit.
c) One day, the predicted maximum temperature is 31°C. According to your line/curve of best fit, how many cones will be sold?
d) Is your answer to 2c interpolation or extrapolation?
45

MFM 1P Date:
46
MFM 1P Date: 3. Each of the following graphs shown a non linear correlation. Draw a curve of best fit for each set of data.
4. Consider the scatter plot shown on right.
a) Does this scatter plot show a positive correlation, negative correlation, or no correlation? Explain why.
b) Is there an outlier in this data set? If so, approximatelyhow old is the outlier and how about many minutes does he or she study per day?
c) Is this correlation linear or non-linear? Explain why.
d) What can you say about the relationship between your age and the amount that you study?
47
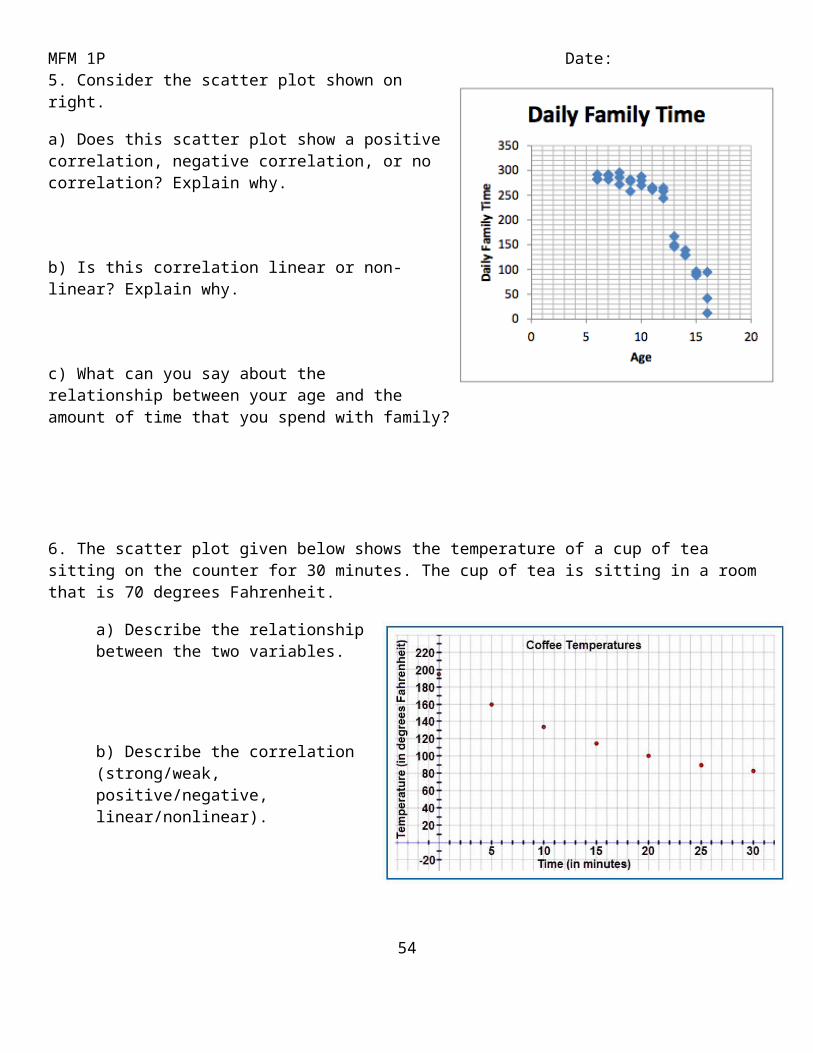
MFM 1P Date: 5. Consider the scatter plot shown on right.
a) Does this scatter plot show a positive correlation, negative correlation, or no correlation? Explain why.
b) Is this correlation linear or non-linear? Explain why.
c) What can you say about the relationship between your age and the amount of time that you spend with family?
6. The scatter plot given below shows the temperature of a cup of tea sitting on the counter for 30 minutes. The cup of tea is sitting in a room that is 70 degrees Fahrenheit.
a) Describe the relationship between the two variables.
b) Describe the correlation (strong/weak, positive/negative, linear/nonlinear).
c) Use the context to give possible explanations as to why these trends, patterns, and associations exist.
48
MFM 1P Date:
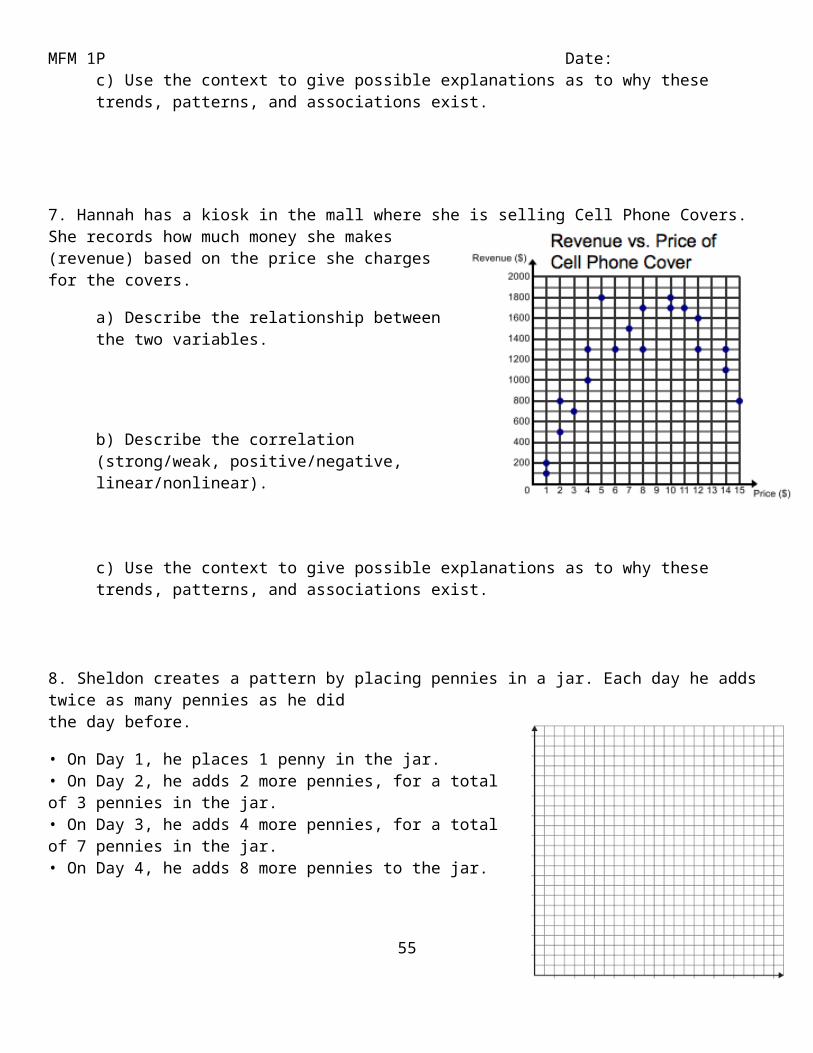
7. Hannah has a kiosk in the mall where she is selling Cell Phone Covers. She records how much money she makes (revenue) based on the price she charges for the covers.
a) Describe the relationship between the two variables.
b) Describe the correlation (strong/weak, positive/negative, linear/nonlinear).
c) Use the context to give possible explanations as to why these trends, patterns, and associations exist.
8. Sheldon creates a pattern by placing pennies in a jar. Each day he adds twice as many pennies as he didthe day before.
• On Day 1, he places 1 penny in the jar.• On Day 2, he adds 2 more pennies, for a total of 3 pennies in the jar.• On Day 3, he adds 4 more pennies, for a total of 7 pennies in the jar.• On Day 4, he adds 8 more pennies to the jar.
He continues adding pennies using this pattern.
a) Complete the table of values with the total number of pennies in Sheldon’s jar on Days 4 and 5.
49
MFM 1P Date: b) Is the relationship between the total number of pennies in Sheldon’s jar and the day number linear or non-linear? Explain how you came to your conclusion.
50

MFM 1P Date: Activity 4.6 Distance Time Graphs
Use the Computer Based Ranger (CBR) to create the following diagrams using different scenarios.
a) Walking away from b) Walking slowly away from c) Walking quickly away fromthe CBR at a constant speed the CBR at a constant speed the CBR at a constant speed
d) Walking towards e) Walking slowly towards f) Walking quickly towards the CBR at a constant speed the CBR at a constant speed the CBR at a constant speed
g) Standing still in front of h) Standing still for 5 seconds i) Standing still for 5 secondsthe CBR then moving away quickly then moving towards slowly
Reflect: a) How is the speed of the walker shown on the graph?
b) How is the direction of the walker shown on the graph?
51

MFM 1P Date: c) How is the starting position of the walker shown on the graph?
j) Walking slowly and then gradually speeding up
away from the CBR towards the CBR Reflect: What type of correlation is this?
k) Walking quickly and then gradually slowing down
away from the CBR towards the CBR Reflect: How is changing speeds shown?
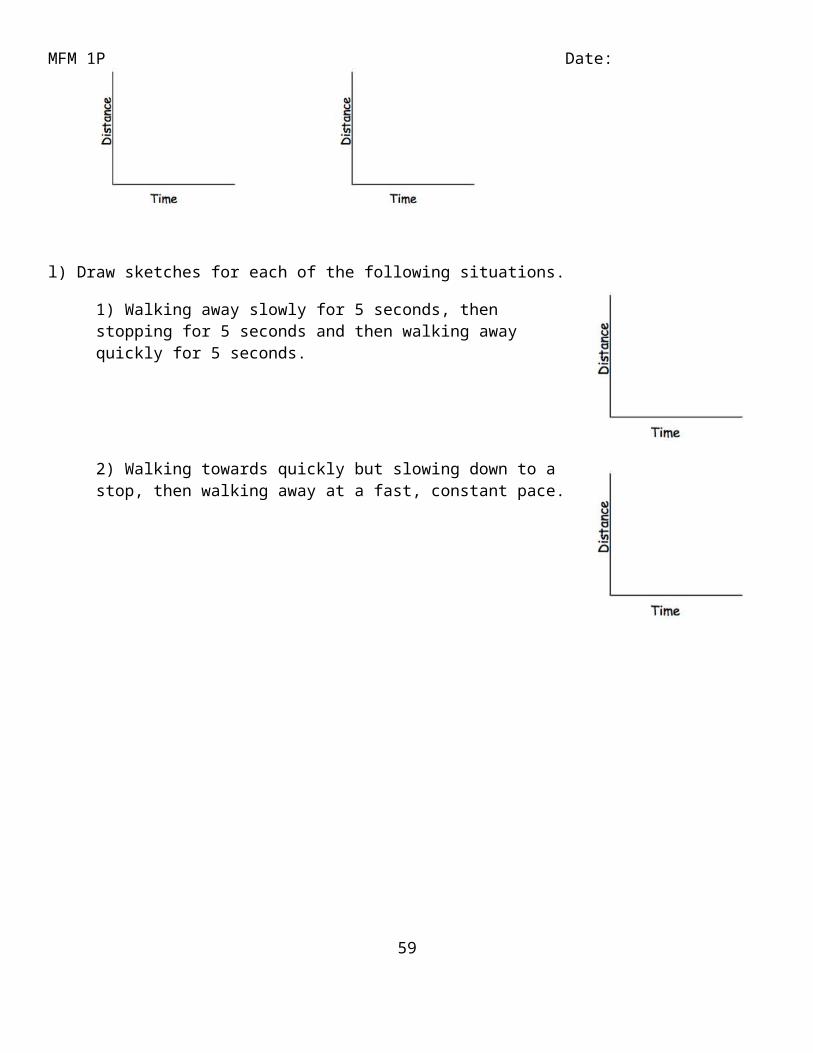
l) Draw sketches for each of the following situations.
1) Walking away slowly for 5 seconds, then stopping for 5 seconds and then walking away quickly for 5 seconds.
2) Walking towards quickly but slowing down to a stop, then walking away at a fast, constant pace.
52

MFM 1P Date: Lesson 4.6 Distance Time Graphs
Interpreting Distance Time Graphs
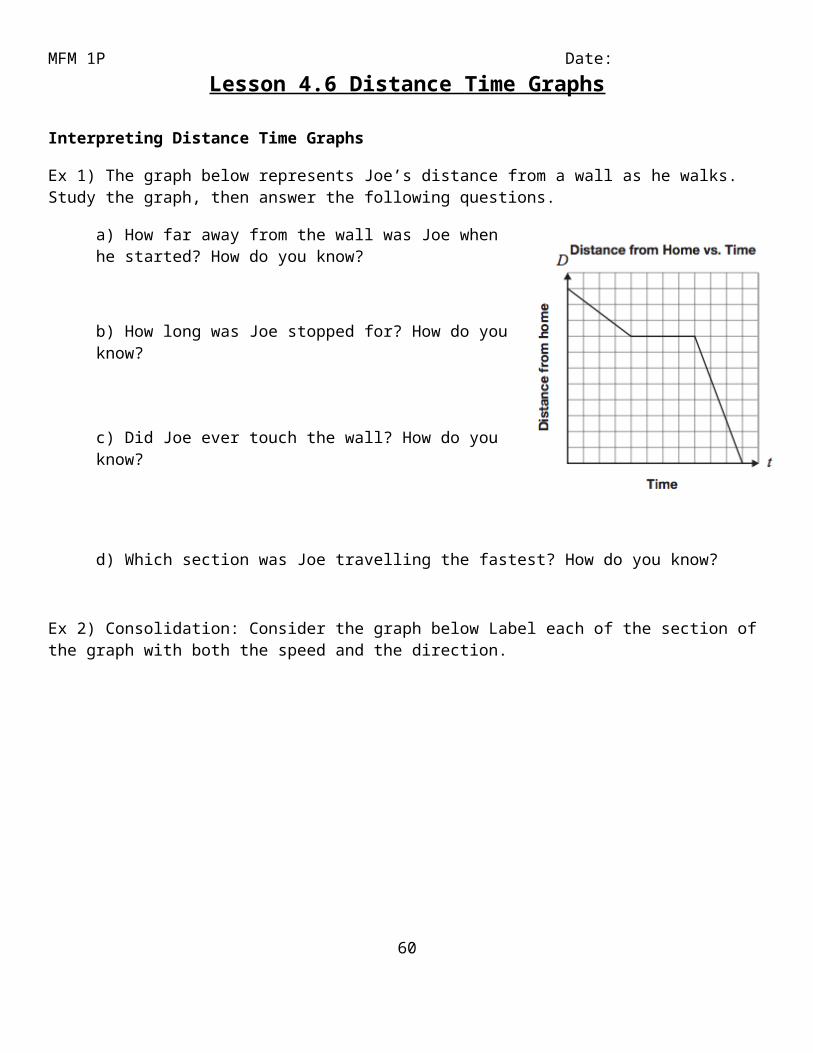
Ex 1) The graph below represents Joe’s distance from a wall as he walks. Study the graph, then answer the following questions.
a) How far away from the wall was Joe when he started? How do you know?
b) How long was Joe stopped for? How do you know?
c) Did Joe ever touch the wall? How do you know?
d) Which section was Joe travelling the fastest? How do you know?
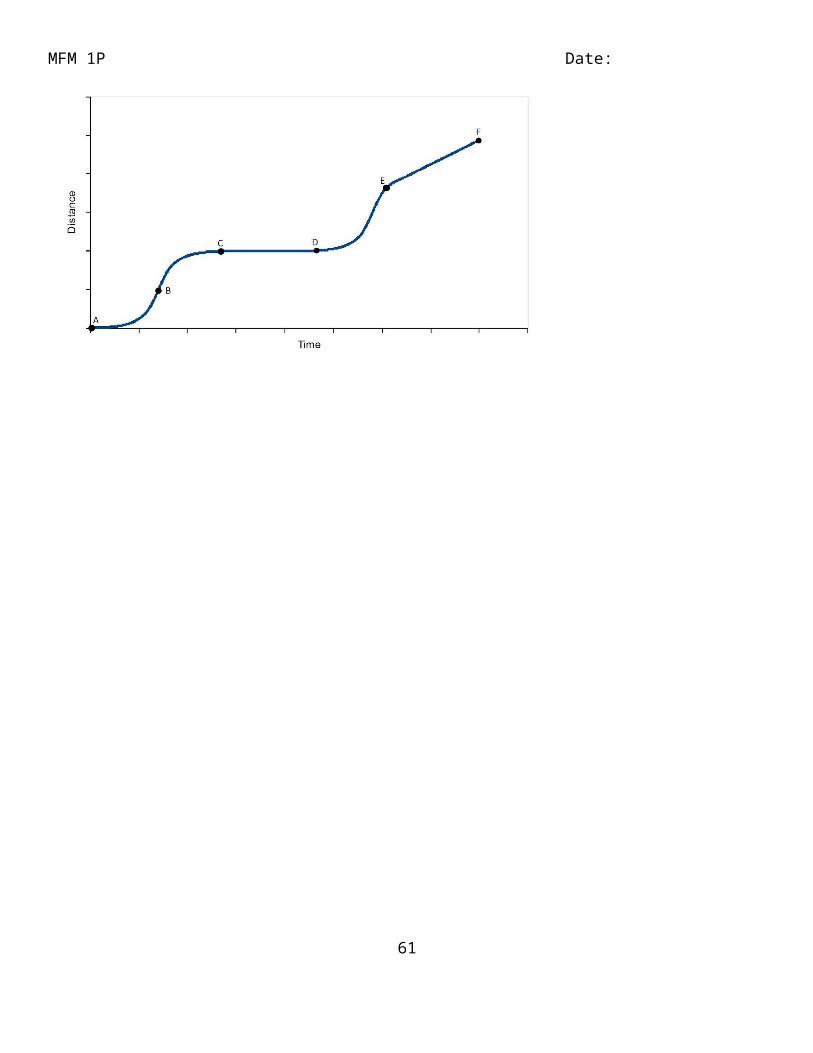
Ex 2) Consolidation: Consider the graph below Label each of the section of the graph with both the speed and the direction.
53
MFM 1P Date:
54
MFM 1P Date: Creating Distance Time Graphs
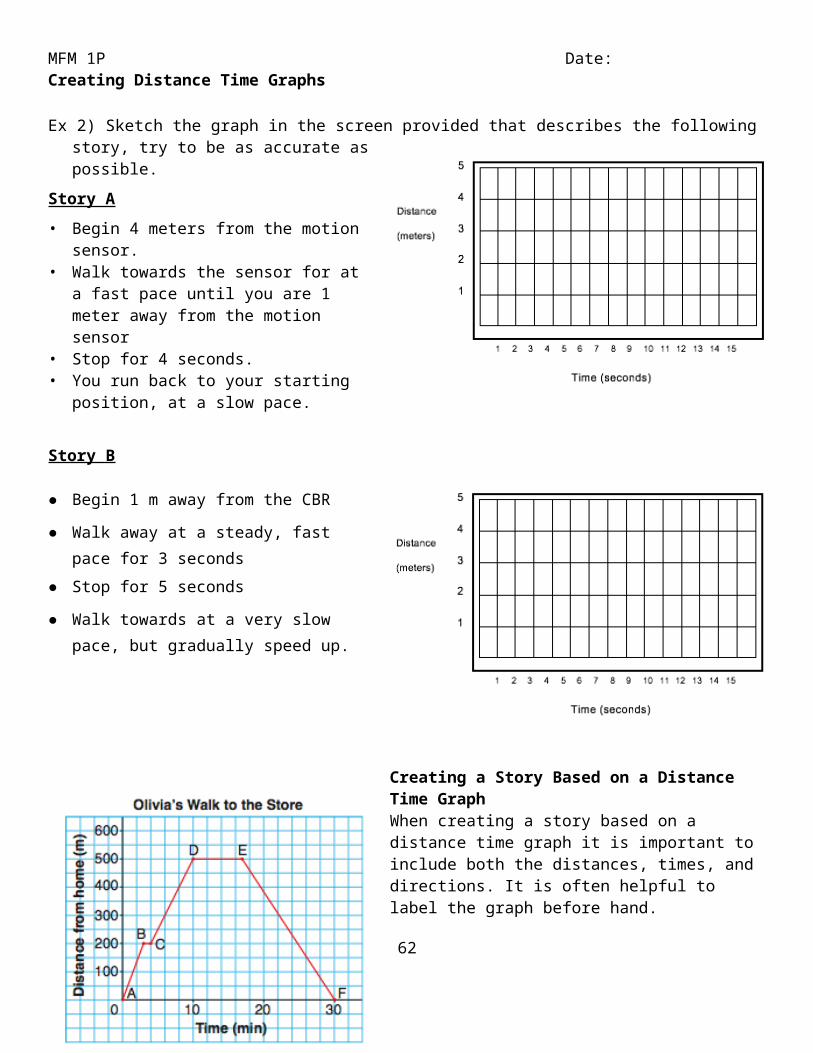
Ex 2) Sketch the graph in the screen provided that describes the following story, try to be as accurate as possible.
Story A
• Begin 4 meters from the motion sensor.• Walk towards the sensor for at a fast pace
until you are 1 meter away from the motion sensor
• Stop for 4 seconds.• You run back to your starting position, at a
slow pace.
Story B
● Begin 1 m away from the CBR
● Walk away at a steady, fast pace for 3 seconds
● Stop for 5 seconds
● Walk towards at a very slow pace, but gradually speed up.
Creating a Story Based on a Distance Time GraphWhen creating a story based on a distance time graph it is important to include both the distances, times, and directions. It is often helpful to label the graph before hand.
55

MFM 1P Date: Assignment 4.6 Distance Time Graphs
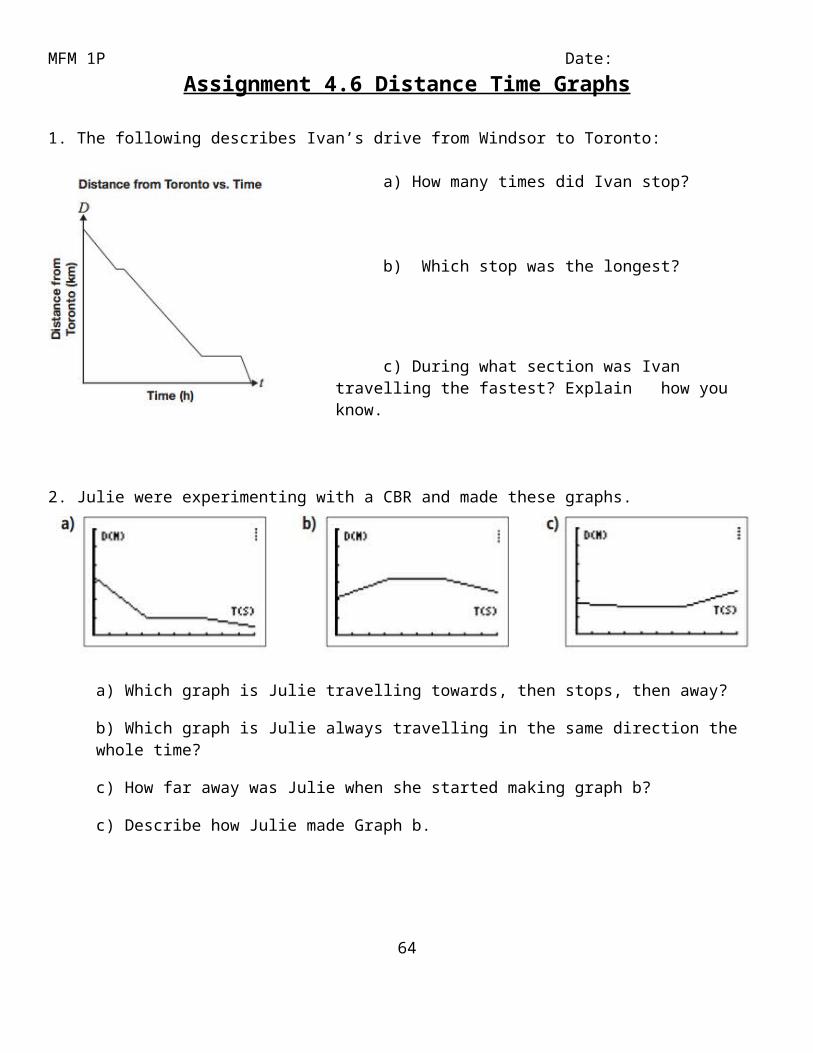
1. The following describes Ivan’s drive from Windsor to Toronto:
a) How many times did Ivan stop?
b) Which stop was the longest?
c) During what section was Ivan travelling the fastest? Explain how you know.
2. Julie were experimenting with a CBR and made these graphs.
a) Which graph is Julie travelling towards, then stops, then away?
b) Which graph is Julie always travelling in the same direction the whole time?
c) How far away was Julie when she started making graph b?
c) Describe how Julie made Graph b.
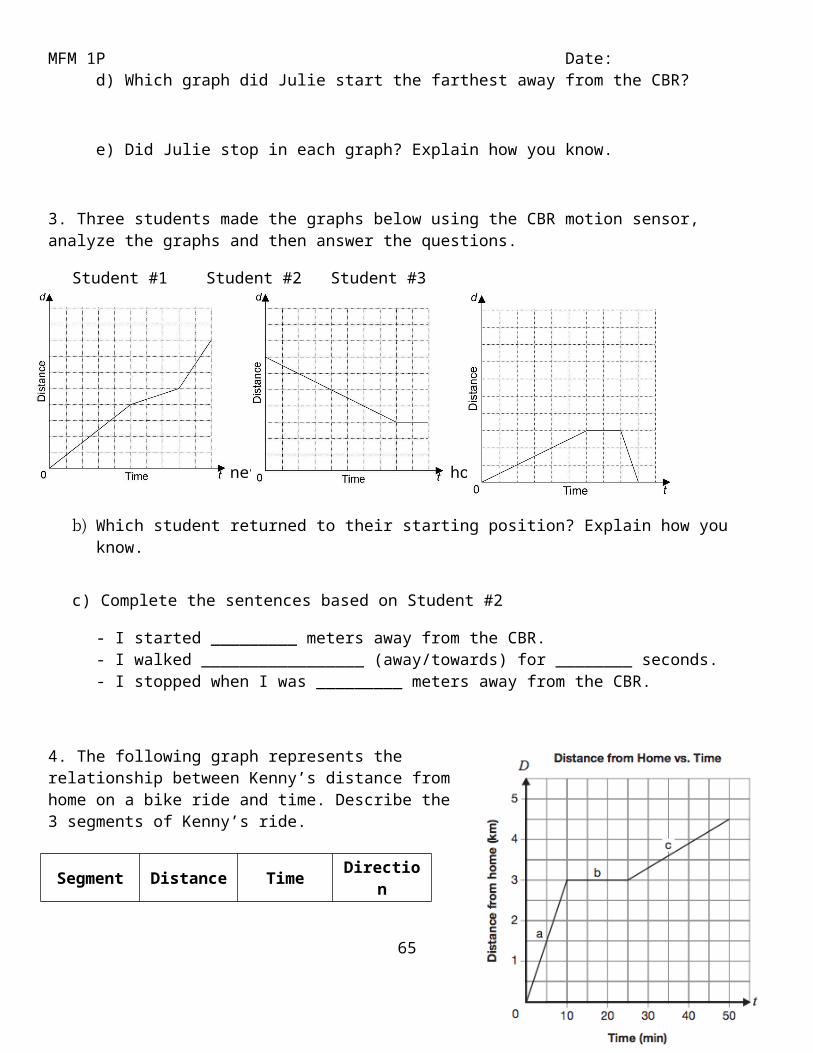
d) Which graph did Julie start the farthest away from the CBR?
56

MFM 1P Date:
e) Did Julie stop in each graph? Explain how you know.
3. Three students made the graphs below using the CBR motion sensor, analyze the graphs and then answer the questions.
Student #1 Student #2 Student #3
a) Which student never stopped? Explain how you know.
b) Which student returned to their starting position? Explain how you know.
c) Complete the sentences based on Student #2
- I started _________ meters away from the CBR.- I walked _________________ (away/towards) for ________ seconds.- I stopped when I was _________ meters away from the CBR.
4. The following graph represents the relationship between Kenny’s distance from home on a bike ride and time. Describe the 3 segments of Kenny’s ride.
Segment Distance Time Direction
a
57

MFM 1P Date:
b
c
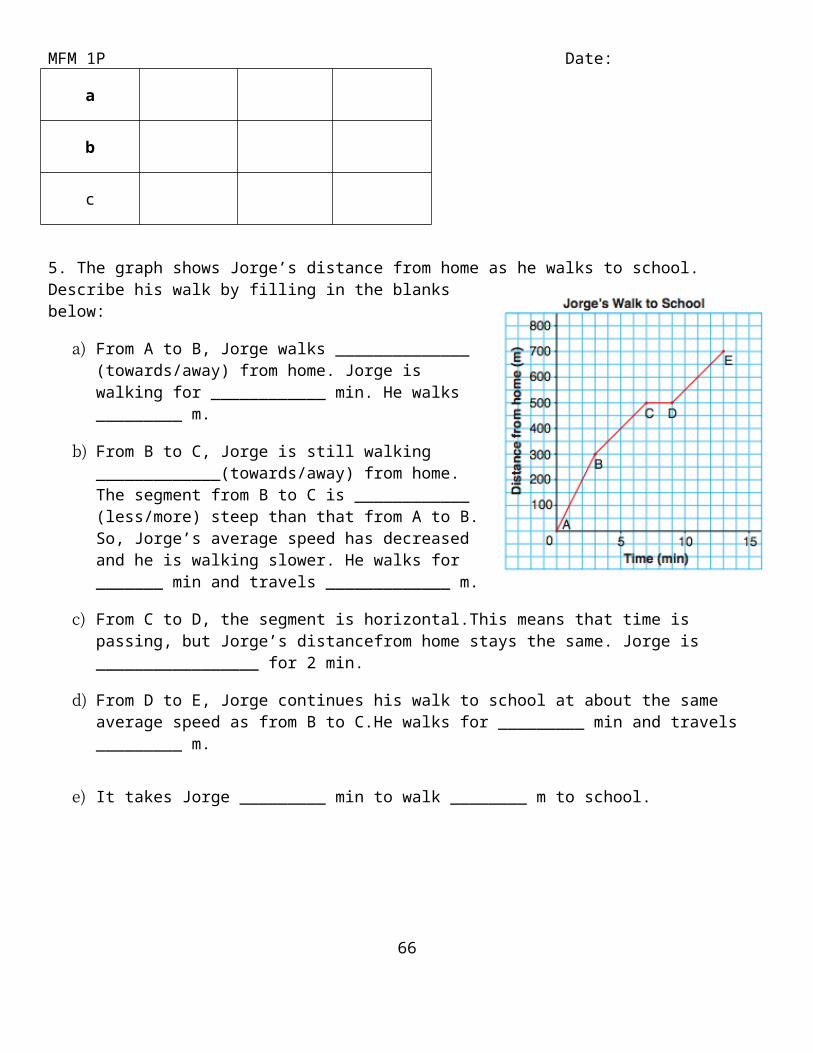
5. The graph shows Jorge’s distance from home as he walks to school. Describe his walk by filling in the blanks below:
a) From A to B, Jorge walks ______________ (towards/away) from home. Jorge is walking for ____________ min. He walks _________ m.
b) From B to C, Jorge is still walking _____________(towards/away) from home. The segment from B to C is ____________ (less/more) steep than that from A to B. So, Jorge’s average speed has decreased and he is walking slower. He walks for _______ min and travels _____________ m.
c) From C to D, the segment is horizontal.This means that time is passing, but Jorge’s distancefrom home stays the same. Jorge is _________________ for 2 min.
d) From D to E, Jorge continues his walk to school at about the same average speed as from B to C.He walks for _________ min and travels _________ m.
e) It takes Jorge _________ min to walk ________ m to school.
6. Jen left her house and drove to school in the morning, as shown in the accompanying graph. Create a story to explain what is happening during each part of the graph below.
58
MFM 1P Date: Activity 4.7 Calculating Speed
Warm Up: Complete the Distance time summary sheet with your partner.
59
MFM 1P Date: Lesson 4.7 Calculating Speed
Speed is calculated using the following formula → Speed =
We often use tables to help us calculate the speed on a distance time graph.
Ex 1) Emily participates in a 10 km charity walk, where the walkers follow a straight path from the start then return along the same path to the finish. This graph shows the relationship between Emily’s distance from the start and her time.
a) Complete the table below.
b) Which section is Emily travelling the fastest?
c) Did Emily complete the 10 km walk? Explain how you know.
d) How long did it take Emily to complete her walk? Explain how you know.
60
MFM 1P Date:
Group work: In your group, each person must choose a different graph and then complete the table below. choose
Graph A Graph B
Segment Distance Travelled Time Speed (m/s) Direction
A
B
C
Ex 2) The graph represent the distance between a squirrel and a tree, d, in metres, as a function of time, t, in seconds. Calculate the speed of each section of the graph. Show your work. (Watch you scales)
61
MFM 1P Date:
Assignment 4.7 Calculating Speed 1. The Bryant Bulldogs basketball team takes the bus to play the Jordan High Thundercats.
Use the table below to describe the three parts of the Bulldogs’ bus trip, using the information on the graph. Include information about distance, time, and direction for each section of the graph.
Segment Direction Distance Travelled (km)
Time(min)
1st
2nd
3rd
2. The graph below represents the relationship between distance and time on Javier’s walk.
a) Complete the table
Segment DirectionDistance Travelled
(m)
Time(s)
Speed(m/s)
p
q
b) How much greater is Javier’s speed in section p than in section q?62
MFM 1P Date:
63
MFM 1P Date:
3. At 11 o’clock, Micha’s mother sends him to the corner store for milk and tells him to be back in 30 minutes. Examine the graph.
a) Why are some line segments on the graph steeper than others?
b) How long did it take Micha to reach the store? How do you know?
c) How long did Micha stay at the store? How do you know?
d) Did Micha make it home in 30 minutes? How do you know?
e) Complete the table below (Watch your scales!)
Segment Direction Distance Travelled (m)
Time(min)
Speed(m/min)
AB
BC
CD
DE
EF
FG
64
MFM 1P Date:
4. Devin left his house and went for a bicycle ride. The graph below shows his trip.Note: Distance is the number of kilometres from home.
a) Calculate his speed during the first hour (AB) and the second hour (BC). Show your work.
b) Explain what segment CD tells you about Devin’s motion.
c) Which section of the graph shows that Devin was changing speeds? Explain how you know.
d) Did Devin finish his bike ride at his house? Explain how you know.
e) What was the total distance that Devin travelled?
65
MFM 1P Date: Assignment 4.1 Interpreting Scatter Plots1. a) 70% b) 6 ¼ h c) 52% d) 2 ½ h e) increases, positive f) 75% g) 30% h) answers may vary2. a) C – points are going up to the right b) A – points are going down to the right3. a) As the minutes of exercise increases the number of calories burned also increases b) strong positive correlation c) As the average temperature increases, the month heating bill decreases d) strong negative correlation4. a) Positive correlation – points are rising up to the right b) Paul – 2.8 thousand dollars c) Kory save a lot more than the others, she could be saving for a big purchase.5. a) Missed a lot of classes but still has a high mark b) As the number of classes missed increases, the student’s mark decreases c) Weak negative correlation6. a) i) D ii) A iii) B b) Watched a lot of TV and didn’t do a lot homework c) As the number of hours spend watching TV increases, the number of hours doing homework decreases.7. D is correct – As the number of customers at a clothing store increases, the amount of clothing sold also increases
1. a) no correlation b) no correlation c) negative correlation d) positive correlation e) correlation f) negative correlation g) positive correlation h) no correlation i) no correlation j) positive correlation k) positive correlation l) positive correlation m) negative correlation n) negative correlation o) positive correlation p) no correlation q) negative correlation r) no correlation 2. a) the billing amount = dependent, the quantity of electricity consumed = independentb) the number of cups of lemonade Emily sells= independent, the amount of money Emily earns = dependentc) the amount of wall space = independent, the amount of paint needed = dependentd) the amount of money Jeffrey earns = dependent, the number of visitors Jeffrey receives = independente) the number of people who have entered in the contest = independent, the number of watermelons to be purchased = dependentf) the number of apples harvested each day = dependent, the number of fruit pickers hired = independentg) the number of students Bonnie tutors = independent, the amount of money Bonnie earns = dependenth) the number of buses needed = dependent, the number of students going on the trip = independenti) the duration of the graduation ceremony = dependent, the number of students receiving diplomas = independent3. Answers may vary
Assignment 4.3 Drawing Scatter Plots and Lines of Best Fit2. a) There is a strong positive correlation between Age and Weight. There is no correlation between Age and Languages Known b) We are able to draw a line of best fit on The Age vs Weight Graph 3. a) Not accurate – should have equal number of points on either side of the line b) Not accurate – does not follow the trend b) Not accurate - – should have equal number of points on either side of the line d) Accurate4. a) Approximately 4 hours – extrapolation b) Approximately 12 hours – extrapolation c) 16 years old – interpolation d) Approximately 2 hours – extrapolation5. b) As the volume increases, the number of calories also increases. It a weak positive correlation c) Q – it is higher than the trend6. a) Height b) Shorter (152 cm tall) and small shoe size (size 5) d) X8. a) False b) True c) True d) False e) 3 L
Assignment 4.4 Linear and Nonlinear Relationships1. b – it meets all of the criteria for a line of best fit2. a) strong positive linear correlation c) 190 cones d) interpolation4. a) positive correlation b) 12 years old and studies for 75 minutes c) linear – a line of best fit can be drawn d) As you get older, the amount of daily study time increases5. a) Strong negative correlation b) Nonlinear – it curves d) As you get older, the amount of daily family time decreases quickly.6. a) As time increase, the temperature of the coffee decreases b) Strong negative nonlinear correlation c) The coffee will cool down to room temperature but will not get any cooler. 7. a) As the price of the cell phone cover increases, the revenue increases up to a certain point, then it begins to decrease b) Weak nonlinear c) There is a price point where not as many people will buy a phone cover, so the revenue at that price point starts to decrease8. Nonlinear – it curves
Assignment 4.5 Distance Time Graphs1. a) 2 times b) the second c) the last – it was the steepest
66

MFM 1P Date: 2. a) Graph c b) Graph a d) Start 2m away, then walk away slowly, stop, then walk towards slowly d) Graph a e) Yes, there is a flat line on each graph3. a) Student #1 – there are no flat lines b) Student #3 – went back to a distance of zero c) - I started 7 meters away from the CBR. I walked towards for 8 seconds. I stopped when I was 3 meters away from the CBR.4.
Segment Distance Time Direction
a 3 10 away
b 0 15 Stop
c 1.5 25 away
5. a) From A to B, Jorge walks away from home. Jorge is walking for 3 min. He walks 300 m.b) From B to C, Jorge is still walking away from home. The segment from B to C is less steep than that from A to B. So, Jorge’s average speed has decreased and he is walking slower. He walks for 4 min and travels 200 m.c) From C to D, the segment is horizontal.This means that time is passing, but Jorge’s distancefrom home stays the same. Jorge is stopped for 2 min. d) From D to E, Jorge continues his walk to school at about the same average speed as from B to C.He walks for 4 min and travels 200 m.e) It takes Jorge 13 min to walk 700 m to school.
Assignment 4.7 Calculating Speed1.
Segment Direction Distance Travelled (km)
Time(min)
1st away 25 30
2nd Stopped 0 90
3rd Towards 25 60
2.
Segment DirectionDistance Travelled
(m)
Time(s)
Speed(m/s)
p away 12m 3s 4m/s
q away 4m 4s 1m/s
b) 4 times greater3. a) Steeper lines means that he was walking faster b) 16 minutes, that is when he stopped at the score c) 4 minutes, he was stopped at the store d) No, it took him 40 minutes e)
67

MFM 1P Date:
Segment Direction Distance Travelled (m)
Time(min)
Speed(m/min)
AB Away 200 4 50
BC Away 200 8 25
CD Away 200 4 50
DE Stopped 0 4 0
EF Towards 100 8 12.5
FG Towards 500 12 41.6
4. a) AB = 10 km/h BC = 5 km/h b) Stopped c) DE – its curved d) No, he ends 5 kms away from where he started e) 25 kms
68