violent conflicts and displacement in central … entire report fa 3of7.pdf · violent conflicts...
TRANSCRIPT

6
Violent Conflicts and Displacement in Central Mindanao
3. POPULATION DISPLACEMENT This section outlines the scope and nature of population movements in the study area, including those driven by man-made and natural causes. The results provide the context of forced population movements for the analysis in subsequent sections.
Settlement Status In total, 41 percent of the households had been displaced at some point over the 10 year period prior to the survey. At the time of the survey, 29 percent had returned home after being displaced, 7 percent had resettled elsewhere, and 4 percent were currently displaced. The resettlement status of 1 percent of the displaced was not reported. 59 percent of the surveyed households had never been displaced. The proportion of households displaced at the time of the survey was highest in Maguindanao (21%), compared to 4 percent or less elsewhere. Most households who had experienced displacement tended to return home, but selecting a new location (resettled elsewhere) was relatively frequent in Lanao del Sur (14% of the population, or 29% of those displaced in that province).
Figure 2:Current settlement
i7
Violent Conflicts and Displacement in Central Mindanao
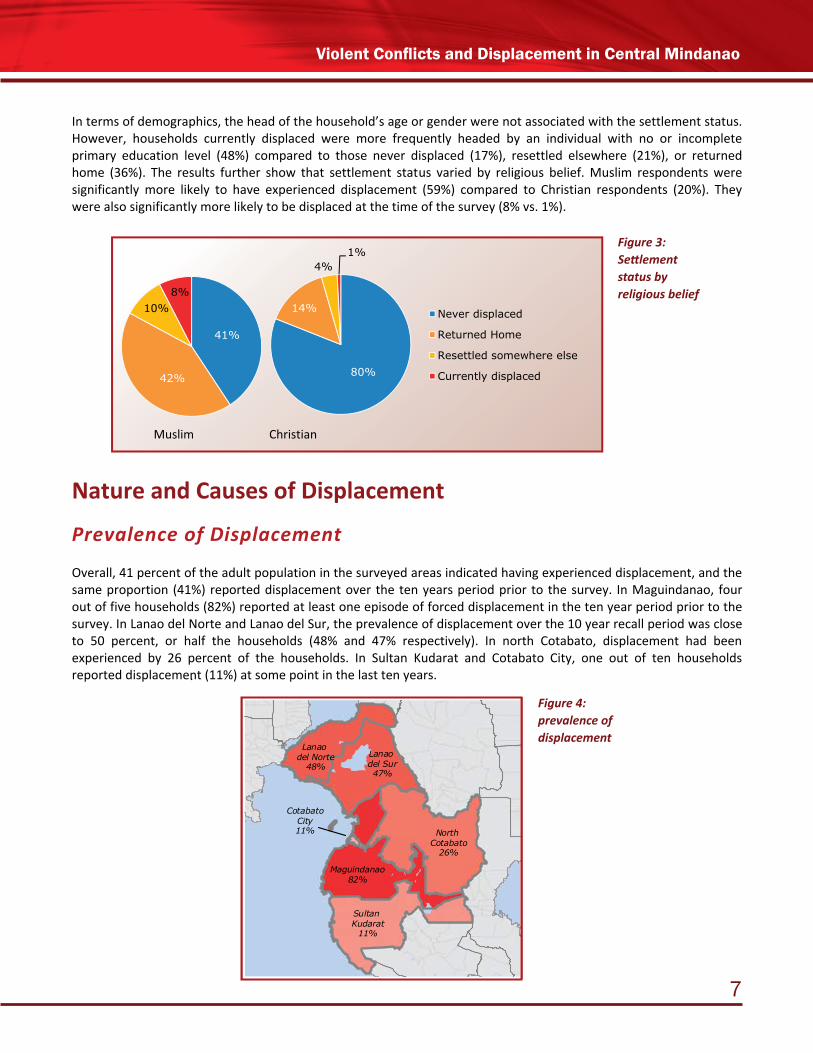
In terms of demographics, the head of the household’s age or gender were not associated with the settlement status. However, households currently displaced were more frequently headed by an individual with no or incomplete primary education level (48%) compared to those never displaced (17%), resettled elsewhere (21%), or returned home (36%). The results further show that settlement status varied by religious belief. Muslim respondents were significantly more likely to have experienced displacement (59%) compared to Christian respondents (20%). They were also significantly more likely to be displaced at the time of the survey (8% vs. 1%).
Nature and Causes of Displacement
Prevalence of Displacement Overall, 41 percent of the adult population in the surveyed areas indicated having experienced displacement, and the same proportion (41%) reported displacement over the ten years period prior to the survey. In Maguindanao, four out of five households (82%) reported at least one episode of forced displacement in the ten year period prior to the survey. In Lanao del Norte and Lanao del Sur, the prevalence of displacement over the 10 year recall period was close to 50 percent, or half the households (48% and 47% respectively). In north Cotabato, displacement had been experienced by 26 percent of the households. In Sultan Kudarat and Cotabato City, one out of ten households reported displacement (11%) at some point in the last ten years.
Figure 3:Settlement status by religious belief
Figure 4: prevalence of displacement

8
Violent Conflicts and Displacement in Central Mindanao
The periods of displacement reported by the survey respondents are aligned with the three major upsurges in violent conflict, starting with the “All Out War” of 2000, continuing in 2003 and resurging with the breakdown in the GPH-MILF peace negotiations in 2008. A short period of return in 2001 was followed by large population movements between 2002 and 2004 (affecting mainly Maguindanao), and again in 2008 to 2009. Violent clan conflict (rido) has also intermittently caused displacement of households at the local level, as have natural disasters and economic factors. Maguindanao has been the most affected by displacement throughout the decade, with nearly half the adult population being displaced at any point in time between 2000 and 2004, and again in 2008. Lanao del Norte has also been significantly affected by displacement in 2008, with 25 percent of the households reporting displacement that year. The proportion of households reporting being displaced has been decreasing since 2008, most notably in Maguindanao. The only exception is Lanao del Sur, were displacement rose between 2009 and 2010, likely as a result of localized ridos.
Frequency and Length of Displacement Forced displacement can be short term or protracted. It can also recur. Among the population under study, 19 percent reported having been displaced once, and 22 percent reported having experienced displacement twice or more. As many as one in ten displaced household (10%) reported being displaced five times or more. The length of displacement averaged 15.6 months for the longest event, with 30 percent displaced for one month or less, 24 percent displaced for one to six months, and 30 percent for over one year at a stretch. The frequency and length of displacement varied across strata. Multiple displacements were most frequent in Maguindanao (75%). However, the average length of displacement was longest in Lanao del Sur (34.7 months) and Cotabato City (24.9 months). The length of displacement was on average longest among those who resettled somewhere other than their place of origin, and those who reported being displaced at the time of the survey. Among households that resettled in a new location, the average reported length of displacement was 43 months, compared to 23.7 months for those displaced at the time of the survey, and 14.4 for those who returned home.
Figure 5:Displacement over time

i9
Violent Conflicts and Displacement in Central Mindanao
Causes and characteristics of displacement Violent conflict is the main driver of displacement in Mindanao: 29 percent of all the households reported displacement caused by the movement of armed groups, whether the Armed Forces of the Philippines (AFP), MILF, MNLF or other group. 9 percent identified rido as the cause. A further 9 percent identified other causes, such as economic factors (3%) or natural disasters (2%), as the reason that they left their home.6
6 In total 41% of the households reported displacement in the last ten years. Some households reported more than one cause of displacement. Not all respondents specified a cause.
Figure 6:Frequency and length of displacement by sampling strata
Figure 7: Displacement by cause between 2000 and 2010 (percentage of the population)

10
Violent Conflicts and Displacement in Central Mindanao
Among all households:
• Displacement caused by armed groups was most frequent in Maguindanao (81%) and affected a smaller proportion of the population in Lanao del Norte (35%), Lanao del Sur (22%), and North Cotabato (20%). Displacement due to the movements of armed groups averaged 11.9 months. Conflict-induced displacement was most likely to have affected households multiple times: over half those displaced by armed movements were displaced more than once (17% of all the households). Displacement due to armed groups was frequently associated with suffering (77%), economic losses (42%), loss of home (37%) and delayed education (30%), and loss of cattle (20%). Out of the 29 percent who were displaced by armed movements, 26 percent mentioned the AFP as one of the group involved. The same proportion (26%) mentioned the MILF.
• Displacement caused by ridos was most frequent in Maguindanao (19%) and Lanao del Sur (16%), compared to 4 percent or less elsewhere. The length of displacement due to ridos averaged 11.1 months. One third of the households displaced by ridos had been displaced more than once (3% of all the population). Displacement due to ridos had a negative impact similar to that of armed group-induced displacement, with 74 percent reporting suffering, 43 percent reporting economic losses, 34 percent reporting losing their home, and 21 percent losing cattle. The main reasons for the ridos were identified as killings (53%), fights over power (30%), and land issues (11%).
• Displacement due to other reasons, such as natural disasters, flooding, or economic conditions, was found across strata, and most frequent in Lanao del Sur (15%) and Lanao del Norte (11%). Displacements due to other reasons were the longest, averaging 23.9 months. This mainly reflects long term economic displacement reported by respondents. One third of the households displaced by reasons other than ridos and armed movements had been displaced more than once (3% of all the households). Compared to the other causes of displacement, displacements due to other reasons were less frequently associated with economic losses (19%) or other losses (home – 29%, cattle – 11%). Nevertheless, 53 percent associated it with some form of suffering, compared to 74 percent or more for displacement caused by ridos and /or armed groups.
Other forms of Violence There was a strong statistical association between experience of displacement and experience of other forms of conflict-related violence in the ten year period prior to the survey. Interviewers assessed respondents’ exposure to a series of events including direct exposure to, and witnessing of, violence, and experience of coercion. Among households that were never displaced, exposure to each item was reported by less than 1 percent of respondents. Among the 41 percent of households who had experienced displacement in the last ten years, up to 27 percent reported having their house destroyed by armed groups, 21 percent reported having their harvest or goods destroyed by armed groups, 19 percent reported witnessing the looting or destruction of their house and/or goods, and 11 percent reported having been attacked by someone with a weapon. As would be expected, experiences of other forms of violence were most frequent among households who had been displaced by the movements of armed groups. The survey did not assess whether the violence was experienced before, during or after displacement, or whether the violence caused or resulted from displacement.

i11
Violent Conflicts and Displacement in Central Mindanao
Exposure to a violent event was on average more frequent among households that were displaced at the time of the survey. Over half the households displaced at the time of the survey (56%) reported having had their house destroyed due to the conflicts, compared to 22 percent of those who returned home, 11 percent of those who resettled elsewhere, and none of the households that were never displaced. Households that were displaced at the time of the survey were also more likely to have been looted (42%), attacked by someone with a weapon (24%), or to have witnessed killings of household members (12%) or other individuals (20%). Exposure to violence over the last ten years was highest in Maguindanao. In that province, 45 percent of the total population reported the destruction of their house. Many respondents indicated exposure to other forms of violence, such as the destruction of goods (37%), being attacked by someone with a weapon (20%), witness looting (32%), and witness killing (16%). In every other stratum, exposure to any of the events was reported by 7 percent of the population or less.
Hosting Displaced Households In addition to exploring experiences of displacement, the survey asked households whether or not they had hosted any displaced individuals over the ten year period prior to the survey. Overall, 11 percent of the households had done so, with the highest proportion found in Lanao del Sur (17%), Maguindanao (13%), and North Cotabato (11%). Few households (3%) indicated hosting displaced individuals at the time of the survey. Among hosts, the main barriers to the return of those displaced were identified as the destruction of their dwelling in the site of origin (32%), fear (16%), and the lack of job / employment opportunities (15%). Hosting displaced households or individuals had impacts on the host families. These were most frequently reported as being the financial cost involved with hosting displaced individuals, (49%), the lack of space / crowding that results from the presence of additional individuals in the dwelling (30%), and the need to sell goods or assets to provide food and support to the displaced (15%).
Figure 8:Exposure to violence by displacement status

12
Violent Conflicts and Displacement in Central Mindanao
Site of Displacement For each cause of displacement, respondents were asked a series of questions about the site to which they moved upon leaving their place of origin. The results show that the majority moved within the same province: 15 percent moved to another sitio/purok but in the same barangay, one-third moved to another barangay in the same municipality (33%) and a little more than one-third moved to another municipality but in the same province (36%). A few households moved to another province (9%). Households tended to move further (i.e. other municipality) for rido-induced displacement, while they tended to stay closer (i.e. same Barangay but different sitio/purok) for other causes of displacement. For 67 percent of the displaced household, family ties were the most important factor in selecting a site of displacement. This was followed by the perceived security risk (59%). Other factors including the availability of services and assistance (27%), access to land (9%) or employment opportunities (4%) were less frequently mentioned. Disaggregated by causes of displacement, the results suggest that family ties and perceived security risk are the main factor influencing decisions for armed group-and rido-induced displacement, while access to land and employment opportunities were important criteria among those displaced for other reasons (e.g. environmental causes) of displacement.
Figure 9:Location of the site of displacement by cause.
Figure 10:Factors influencing the selection of the site of displacement