violent deaths in oklahoma 2004-2010 · violent deaths in oklahoma ... 2004-2010 suhayb anwar...
TRANSCRIPT

Violent Deaths in Oklahoma
Oklahoma Violent Death Reporting System, 2004-2010
Suhayb Anwar Student Apprentice
Shawn Chaudry Student Assistant
Brandi Woods-Littlejohn, MCJ Administrative Program Manager
Sheryll Brown, MPH Director
Injury Prevention Service Oklahoma State Department of Health
1000 N.E. 10th Street • Oklahoma City, Oklahoma 73117-1299 • (405) 271-3430 http://ips.health.ok.gov
Information Services Division Oklahoma State Bureau of Investigation
6600 N. Harvey • Oklahoma City, OK 73116-7910 • (405) 848-6724 www.ok.gov/osbi
March 2014


Violent Deaths in Oklahoma
Oklahoma Violent Death Reporting System, 2004-2010
Suhayb Anwar Student Apprentice
Shawn Chaudry Student Assistant
Brandi Woods-Littlejohn, MCJ Administrative Program Manager
Sheryll Brown, MPH Director
Injury Prevention Service Oklahoma State Department of Health
1000 N.E. 10th Street • Oklahoma City, Oklahoma 73117-1299 • (405) 271-3430 http://ips.health.ok.gov
Information Services Division Oklahoma State Bureau of Investigation
6600 N. Harvey • Oklahoma City, OK 73116-7910 • (405) 848-6724 www.ok.gov/osbi

The Oklahoma Violent Death Reporting System is supported by Grant Number U17/CE-623103 from the Centers for Disease Control and Prevention. The content is solely the responsibility of the authors and does not necessarily represent the official views of the Centers for Disease Control and Prevention.
This publication is issued by the Oklahoma State Department of Health, as authorized by Terry Cline, PhD, Commissioner of Health. Sixty (60) copies have been prepared and distributed at a cost of $430.00. Copies have been deposited with the Publications Clearinghouse of the Oklahoma Department of Libraries.
ii

Table of Contents Acknowledgements .......................................................................................................................... iv
Executive Summary ........................................................................................................................... 1
Background ........................................................................................................................................ 4
Definitions .......................................................................................................................................... 5
Violent Deaths ................................................................................................................................... 6
Geographic Distribution of Violent Deaths ................................................................................... 12
Suicides ........................................................................................................................................... 15
Homicides ....................................................................................................................................... 21
Undetermined Manner of Death ................................................................................................... 27
Unintentional Firearm Injury Deaths ............................................................................................. 31
Legal Intervention Deaths .............................................................................................................. 32
Violent Deaths of Children ............................................................................................................. 33
iii

Acknowledgements We want to acknowledge and thank all those who contributed to the project including Janice Butterfield, Dave Page, Linda DeArman, Jennifer Powell, and Angela Baker with the Oklahoma State Bureau of Investigation; Annette Riley, Tara Golden, Kari Learned, and Alicia Hanna with the Office of the Chief Medical Examiner; Derek Pate, DrPH and Kelly Baker, MPH, of the Oklahoma State Department of Health (OSDH) Center for Health Statistics; Lisa Rhoades of the Child Death Review Board; and the Oklahoma Association of Chiefs of Police. We thank Keith Lindsay, Thor Shaffer, and Janie Hollars of the Information Technology Services, OSDH. A special thank you goes to Gordy Suchy, Nancy Green, Christopher Harris, Keva Bethel, and H. Julien Kabore, DDS, MPH, Injury Prevention Service, OSDH. We would like to thank the following agencies, sheriffs’ offices and police departments for their assistance in collecting the data reported here. We apologize if we failed to acknowledge other contributors. Oklahoma Department of Public Safety Oklahoma Highway Patrol Headquarters
- Investigations Oklahoma Highway Patrol Troop C Oklahoma Highway Patrol Troop E Oklahoma Highway Patrol Troop G Oklahoma Lake Patrol Thunderbird Lake Patrol Oklahoma Scenic Rivers Commission -
Investigations Oklahoma State Fire Marshal Office -
Arson Division Ft. Sill, OK - Army Base Military Police Tinker Air Force Base Bureau of Indian Affairs - Ponca City, OK Bureau of Indian Affairs - Stillwater, OK Choctaw Nation Tribal Police Comanche Nation Police El Reno Federal Correctional Facility Great Plains Correctional Facility Joseph Harp Correctional Facility Oklahoma State Penitentiary at
McAlester Facility Oklahoma Panhandle State University
Campus Police Department OSU School of Technology Training at
Okmulgee, OK OSU Campus Police Department OU Campus Police Department Sac & Fox Nation Police Carroll County Sheriff’s Office, Arkansas Springdale, Arkansas Police Department Siloam Springs, Arkansas Police
Department Coffeyville, Kansas Police Department Independence, Kansas Police Department ParSheriff’s Office Kansas Police
Department
Springfield, Missouri Sheriff’s Office Police Department
Springfield, Tennessee Police Department
Ft. Worth, Texas Police Department Dublin, Texas Police Department United States Forestry Service Federal Bureau of Investigation – Durant
Office Federal Bureau of Investigation – Lawton
Office Federal Bureau of Investigation -
Oklahoma City, OK Office Federal Bureau of Investigation -
Stillwater, OK Office Adair County Sheriff’s Office Alfalfa County Sheriff’s Office Atoka County Sheriff’s Office Beaver County Sheriff’s Office Beckham County Sheriff’s Office Blaine County Sheriff’s Office Bryan County Sheriff’s Office Caddo County Sheriff’s Office Canadian County Sheriff’s Office Carter County Sheriff’s Office Cherokee County Sheriff’s Office Choctaw County Sheriff’s Office Cimarron County Sheriff’s Office Cleveland County Sheriff’s Office Coal County Sheriff’s Office Comanche County Sheriff’s Office Cotton County Sheriff’s Office Craig County Sheriff’s Office Creek County Sheriff’s Office Custer County Sheriff’s Office Delaware County Sheriff’s Office Dewey County Sheriff’s Office Ellis County Sheriff’s Office
Garfield County Sheriff’s Office Garvin County Sheriff’s Office Grady County Sheriff’s Office Grant County Sheriff’s Office Greer County Sheriff’s Office Harmon County Sheriff’s Office Harper County Sheriff’s Office Haskell County Sheriff’s Office Hughes County Sheriff’s Office Jackson County Sheriff’s Office Jefferson County Sheriff’s Office Johnston County Sheriff’s Office Kay County Sheriff’s Office Kingfisher County Sheriff’s Office Kiowa County Sheriff’s Office Latimer County Sheriff’s Office LeFlore County Sheriff’s Office Lincoln County Sheriff’s Office Logan County Sheriff’s Office Love County Sheriff’s Office Major County Sheriff’s Office Marshall County Sheriff’s Office Mayes County Sheriff’s Office McClain County Sheriff’s Office McCurtain County Sheriff’s Office McIntosh County Sheriff’s Office Murray County Sheriff’s Office Muskogee County Sheriff’s Office Noble County Sheriff’s Office Nowata County Sheriff’s Office Okfuskee County Sheriff’s Office Oklahoma County Sheriff’s Office Okmulgee County Sheriff’s Office Osage County Sheriff’s Office Ottawa County Sheriff’s Office Pawnee County Sheriff’s Office Payne County Sheriff’s Office Pittsburg County Sheriff’s Office Pontotoc County Sheriff’s Office
iv

Pottawatomie County Sheriff’s Office Pushmataha County Sheriff’s Office Roger Mills County Sheriff’s Office Rogers County Sheriff’s Office Seminole County Sheriff’s Office Sequoyah County Sheriff’s Office Stephens County Sheriff’s Office Texas County Sheriff’s Office Tillman County Sheriff’s Office Tulsa County Sheriff’s Office Wagoner County Sheriff’s Office Washington County Sheriff’s Office Washita County Sheriff’s Office Woods County Sheriff’s Office Woodward County Sheriff’s Office Ada Police Department Adair Police Department Alex Police Department Allen Police Department Altus Police Department Alva Police Department Anadarko Police Department Antlers Police Department Apache Police Department Ardmore Police Department Arkoma Police Department Arnett Police Department Arcadia Police Department Atoka Police Department Bartlesville Police Department Bethany Police Department Big Cabin Police Department Binger Police Department Bixby Police Department Blackwell Police Department Blanchard Police Department Bokchito Police Department Bokoshe Police Department Boley Police Department Boynton Police Department Bristow Police Department Broken Arrow Police Department Broken Bow Police Department Buffalo Police Department Burns Flat Police Department Cache Police Department Caddo Police Department Calera Police Department Canton Police Department Carnegie Police Department Carney Police Department Cashion Police Department Catoosa Police Department Chandler Police Department Checotah Police Department Chelsea Police Department
Chickasha Police Department Choctaw Police Department Chouteau Police Department Claremore Police Department Cleveland Police Department Clinton Police Department Colbert Police Department Colcord Police Department Collinsville Police Department Commerce Police Department Cordell Police Department Coweta Police Department Coyle Police Department Crescent Police Department Cushing Police Department Del City Police Department Dewar Police Department Dewey Police Department Disney Police Department Dover Police Department Drumright Police Department Duncan Police Department Durant Police Department Edmond Police Department El Reno Police Department Eldorado Police Department Elk City Police Department Elmore City Police Department Enid Police Department Eufaula Police Department Fairfax Police Department Fairland Police Department Fairview Police Department Fletcher Police Department Forest Park Police Department Fort Cobb Police Department Fort Gibson Police Department Frederick Police Department Gage Police Department Garber Police Department Geary Police Department Geronimo Police Department Glencoe Police Department Glenpool Police Department Goodwell Police Department Granite Police Department Grove Police Department Guthrie Police Department Guymon Police Department Haileyville Police Department Harrah Police Department Hartshorne Police Department Haskell Police Department Hayworth Police Department Healdton Police Department Heavener Police Department Hennessey Police Department
Henryetta Police Department Hinton Police Department Holdenville Police Department Hollis Police Department Hominy Police Department Howe Police Department Hugo Police Department Hulbert Police Department Hydro Police Department Idabel Police Department Inola Police Department Jay Police Department Jenks Police Department Jennings Police Department Jones Police Department Kellyville Police Department Keota Police Department Kiefer Police Department Kingfisher Police Department Kingston Police Department Kiowa Police Department Konawa Police Department Krebs Police Department Lahoma Police Department Lamont Police Department Langley Police Department Lavern Police Department Lawton Police Department Lexington Police Department Lindsay Police Department Locust Grove Police Department Lone Grove Police Department Lone Wolf Police Department Longdale Police Department Luther Police Department Madill Police Department Mangum Police Department Mannford Police Department Marlow Police Department Marietta Police Department Maud Police Department Maysville Police Department McAlester Police Department McLoud Police Department Meeker Police Department Miami Police Department Midwest City Police Department Moore Police Department Mounds Police Department Mountain View Police Department Muldrow Police Department Muskogee Police Department Mustang Police Department Newkirk Police Department Nicoma Park Police Department Noble Police Department Norman Police Department
v

North Enid Police Department Nowata Police Department Oilton Police Department Okemah Police Department Oklahoma City Police Department Okmulgee Police Department Oologah Police Department Owasso Police Department Panama Police Department Paoli Police Department Pauls Valley Police Department Pawhuska Police Department Pawnee Police Department Perkins Police Department Perry Police Department Piedmont Police Department Pocola Police Department Ponca City Police Department Pond Creek Police Department Porum Police Department Poteau Police Department Prague Police Department Pryor Police Department Purcell Police Department Quapaw Police Department Ralston Police Department Red Oak Police Department Ringling Police Department Roff Police Department Roland Police Department
Salina Police Department Sallisaw Police Department Sand Springs Police Department Sapulpa Police Department Sayre Police Department Seiling Police Department Seminole Police Department Sentinel Police Department Shawnee Police Department Skiatook Police Department Spavinaw Police Department Spencer Police Department Sperry Police Department Spiro Police Department Stillwater Police Department Stilwell Police Department Stigler Police Department Stonewall Police Department Stratford Police Department Sulphur Police Department Tahlequah Police Department Talihina Police Department Tecumseh Police Department Temple Police Department Thackerville Police Department Thomas Police Department Tipton Police Department Tishomingo Police Department Tonkawa Police Department Tryon Police Department
Tulsa Police Department Tupelo Police Department Tuttle Police Department Valley Brook Police Department Valliant Police Department Vian Police Department Village Police Department Vinita Police Department Wagoner Police Department Walters Police Department Warr Acres Police Department Watonga Police Department Waukomis Police Department Waurika Police Department Weatherford Police Department Webbers Falls Police Department Welch Police Department Wellston Police Department Westville Police Department Wetumka Police Department Wewoka Police Department Wilburton Police Department Wilson Police Department Woodward Police Department Wright City Police Department Wyandotte Police Department Wynnewood Police Department Wynona Police Department Yale Police Department Yukon Police Department
vi

Executive Summary Oklahoma is one of 18 states participating in the National Violent Death Reporting System. Violent deaths include homicides, suicides, deaths from legal intervention, unintentional firearm deaths, deaths of undetermined manner, and deaths from terrorism. The Oklahoma Violent Death Reporting System (OKVDRS) is a collaborative effort between the Oklahoma State Department of Health, the Office of the Chief Medical Examiner, the Oklahoma State Bureau of Investigation and the Oklahoma Child Death Review Board. OKVDRS data are collected from death certificates, medical examiner reports, police reports, and Supplementary Homicide Reports and include specific information on victims, suspects, circumstances, and weapons. Child fatality review data are also collected for violent deaths of children. Data collected in Oklahoma during 2004 to 2010 are summarized in numerous tables, figures, and bullets highlighting key findings. The report includes a section on all violent deaths combined and individual sections for each manner of violent death. An additional section is included on violent deaths of children. Violent Deaths A total of 6,282 violent death incidents occurred in Oklahoma during 2004 to 2010 resulting in 6,477 deaths (average annual rate = 25.4 per 100,000 population) of Oklahoma residents. More than half (59%) of the deaths were suicides, 24% were homicides, 15% were undetermined manner deaths, 1% were legal intervention deaths, and 1% were unintentional firearm deaths. There were no terrorism deaths in Oklahoma during this period. Seventy-five percent of the victims were male and 25%
were female. The majority of the injuries (73%) occurred on a home premises. Four percent of violent deaths occurred while the person was in custody or in the process of being arrested. Forty-six victims were homeless. Seventeen percent of violent death victims had served in the U.S. Armed Forces. Forty percent of all violent deaths in Oklahoma were among Oklahoma and Tulsa County residents. The rate of violent death per 100,000 population was generally higher in eastern Oklahoma and lower in the Panhandle and western regions of the state. Suicides Suicide was the most prevalent type of violent death, accounting for 3,836 deaths (average annual rate = 15.1 per 100,000 population), an average of 548 deaths per year. The rate of suicide increased from 14.1 in 2004 to 16.9 in 2010. Seventy-nine percent of suicide victims were male and 21% were female. In 86 of the suicide deaths, victims killed at least one other person before taking their own life resulting in 102 homicides. Males 85 years of age and older had the highest suicide rate among all ages. Among females, women 35-54 years were at greatest risk for suicide. White males and Native American males had the highest rates of suicide, 25.5 and 20.1, respectively. Firearms were used in 60% of the suicide deaths, hanging/ strangulation in 19%, poisoning in 16%, and other/unknown methods were used in 5% of suicides. A substantial number of suicides were associated with a current depressed mood, intimate partner problem, mental health problem, physical health problem, or crisis in the past two weeks. Circumstances associated with suicide varied by age. Physical health problems were more often associated with suicide among persons 65
1

years and older. Intimate partner problems were more often associated with suicides of persons less than 65 years of age. Almost one in five suicide victims had a history of suicide attempts, and 32% had stated their intent or expressed suicidal feelings to another person. Twenty-three percent of suicide victims had served in the U.S. Armed Forces. Homicides There were 1,439 homicide incidents resulting in 1,529 homicide deaths from 2004 to 2010, an average of 218 deaths per year (average annual rate = 6.0 per 100,000 population). The annual rate of homicide ranged from a high of 6.4 in 2007 to a low of 5.5 in 2010. Seventy-five percent of homicide victims were male and 25% were female. The homicide rate among blacks (22.9) was more than three times higher than the rate among Native Americans (6.9) and more than six times higher than the rate among whites (3.7). The homicide rate among Hispanics was 1.2 times higher than the rate among non-Hispanics (6.8 and 5.8, respectively). Firearms were used in 57% of the homicides, sharp or blunt instruments were used in 24%, hanging/strangulation was used in 4%, and other or unspecified weapons in 15% of homicides. Handguns were used in the majority (70%) of firearm-related homicides and semi-automatic pistols were the most common type of handgun. The victim-suspect relationship was known in 67% of the homicides. Victims were often the intimate partners (20%), acquaintances (19%), family members other than spouses (16%), other persons known by the suspect (14%), or friends or roommates (10%). In 8% of homicides the suspect was a stranger.
Females were more often killed by an intimate partner or family member than were males. Males were more often killed by an acquaintance than were females. An argument or interpersonal conflict was a precipitating factor in 39% of homicides, crime was a factor in 25%, and drug dealing or illegal drug use was suspected in 17% of homicides. Nineteen percent were related to intimate partner violence and ten percent of the homicides were gang-related. Undetermined Manner of Death For 972 deaths, the manner of death could not be determined. An average of 139 deaths of undetermined manner occurred per year (average annual rate = 3.8 per 100,000 population). The annual rate of undetermined manner of death decreased by 28% from 2004 to 2010. Forty-three percent of undetermined manner death victims were female and 57% were male. Native Americans had the highest rate of undetermined manner of death (6.3 deaths per 100,000 population). Almost one-third of all undetermined manner deaths were among infants less than one year of age. In 78% of undetermined manner deaths among infants, co-sleeping with adults or other children, overlay or possible overlay was described in the record. In 52% of undetermined manner deaths among persons 15 years of age and older, actual or possible drug toxicity, including drug combination toxicity or drug and alcohol combination toxicity, was described. Among persons 15 years of age and older, the three most common circumstances associated with deaths of undetermined manner were having physical health problems (33%), substance abuse problems (31%), or current mental health problems (28%).
2

Unintentional Firearm Injury Deaths There were 60 unintentional firearm injury deaths, an average of 9 deaths per year (average annual rate = 0.2 per 100,000 population). The rate of unintentional firearm injury deaths remained constant from 2004 to 2010. Ninety-three percent of victims were male and 7% were female. Fifty percent of unintentional firearm deaths were among males less than 25 years of age. Circumstances surrounding the deaths included playing around with a gun (22), showing/loading a gun (15), hunting/target shooting (13), and cleaning a gun (5). In 19 of the deaths, the shooter thought the gun was unloaded. Legal Intervention Deaths Eighty deaths resulted from legal intervention (i.e., the person was killed by a law enforcement officer acting in the line of duty), an average of 11 deaths per year. Sixty-three percent of legal intervention deaths were among persons 15-34 years of age. Seventy-four of the victims were male
and six were female. The rate among Hispanic males (0.8) was 1.3 times higher than the rate among non-Hispanic males (0.6). Criminal activity was associated with 70% of the legal interventions. Violent Deaths of Children There were 674 violent deaths of children (average annual rate = 10.6 per 100,000 population under 18 years of age), an average of 96 deaths per year. The rate decreased by 19% from 2004 to 2010. Sixty-five percent of victims were male and 35% were female. Forty-nine percent of the victims were infants less than one year of age. Among children 1-17 years of age, homicides accounted for 45% of deaths, followed by suicides (33%), undetermined manner deaths (14%), unintentional firearm deaths (8%), and legal interventions (1%). Firearms were used in 46% of these deaths, and males were more likely than females to be killed by firearms (55% and 23%, respectively).
3

Background The National Violent Death Reporting System (NVDRS) is a federally funded program in 18 states. Currently, Oklahoma and 17 other states (Alaska, Colorado, Georgia, Kentucky, Maryland, Massachusetts, Michigan, New Jersey, New Mexico, North Carolina, Ohio, Oregon, Rhode Island, South Carolina, Utah, Virginia, and Wisconsin) participate in the NVDRS. Violent deaths include homicide, suicide, legal intervention death, unintentional firearm death, undetermined manner death, and terrorism-related death. Data are collected from death certificates, medical examiner reports, and law enforcement reports, and entered into a standardized database. The data, with personal identifiers removed, are electronically transmitted to a national database maintained by the Centers for Disease Control and Prevention’s National Center for Injury Prevention and Control. Data are now available on a queryable website at WISQARS NVDRS (http://www.cdc.gov/injury/wisqars/) The Oklahoma State Department of Health, the Oklahoma State Bureau of Investigation, the Office of the Chief Medical Examiner, and the Oklahoma Child Death Review Board provide data for the Oklahoma Violent Death Reporting System (OKVDRS). The OKVDRS is housed at the Injury Prevention Service, Oklahoma State
Department of Health, with offsite data collection at the Oklahoma State Bureau of Investigation. OKVDRS staff collect specific information on violent death events and link all available information on victims and suspects, circumstances, weapons, and methods of death. The results presented in this report include violent deaths that occurred within Oklahoma’s borders to Oklahoma residents from January 1, 2004, to December 31, 2010. Rates were calculated per 100,000 population using 2004 – 2010 U.S. Census bridged-race population estimates for Oklahoma. A category of mixed race was assigned when more than one race was indicated on the death certificate. However, persons of mixed race with Native American as one of the races were classified as Native American. The manner of death determined by the abstractor (based on review of the death certificate and medical examiner report) was used to analyze the data. All rates are average annual rates unless specified otherwise. Rates based on less than 5 deaths have been suppressed. This report includes a section on all violent deaths combined and individual sections on suicide, homicide, undetermined manner of death, unintentional firearm deaths, and legal intervention deaths. An additional section is included on child deaths.
4

Definitions Suicide – A death resulting from the intentional use of force against oneself with a preponderance of evidence to indicate the force was intentional. Homicide – A death resulting from the intentional use of force or power, threatened, or actual, against another person, group, or community with a preponderance of evidence to indicate that the use of force was intentional. It includes deaths where the suspect only intended to injure rather than kill, intentional discharge of a weapon, justifiable homicides where the person who commits the homicide is not a police officer, child abuse, and deaths that resulted from neglect by one person against another. Homicides do not include deaths from vehicular homicide unless there is evidence to prove that the force was intentional. Hunting accidents or deaths that take place in combat under declared wars are not included as homicides. Undetermined manner of death – A death resulting from the use of force or power (including drugs/poisons) against oneself or another person for which the evidence indicating one manner of death is no more compelling than the evidence indicating another manner of death. Unintentional firearm death – A death resulting from a penetrating injury or gunshot wound from a weapon that uses a powder charge to fire a projectile when
there is a preponderance of evidence that the shooting was not intentionally directed at the victim. Legal intervention death – A death where the victim is killed by a police officer or other peace officer acting in the line of duty. Executions are excluded. Terrorism-related death – A homicide or suicide death that results from an event labeled by the Federal Bureau of Investigation as an act of terrorism. ICD-10 – The International Statistical Classification of Disease and Related Health Problems, 10th Revision (ICD-10) is the classification system used by the National Center for Health Statistics to code the underlying cause of death on the death certificate. Deaths that are assigned an ICD-10 External Cause of Death Code from the table below are included in the OKVDRS case definition. Victims – People who died by suicide, homicide, undetermined manner of death, unintentional firearm death, legal intervention, or terrorism-related death. Suspects – People who are suspected of having killed another person in an incident, whether intentionally or unintentionally. Persons who die in an incident who have also killed someone else are considered both a victim and a suspect.
ICD-10 External Cause of Death Codes for Manners of Death Meeting the NVDRS Case Definition Death ≤ 1 year after the injury Death >1 year after the injury Intentional self harm (suicide) X60-X84 Y87.0 Assault (homicide) X85-X99, Y00-Y09 Y87.1 Undetermined intent Y10-Y34 Y87.2, Y89.9 Unintentional exposure to firearms W32-W34 Y86 due to firearm “accidents” Legal intervention, excluding executions Y35.0-Y35.4, Y35.6-Y35.7 Y89.0 Terrorism U01, U03 U02
5

Violent Deaths • During 2004 to 2010, there were a total of 6,282 violent death incidents (average of 925
incidents per year or 2.5 incidents per day) that resulted in 6,477 deaths (average annual rate=25.4 per 100,000 population) (Table 1) of Oklahoma residents. Another 259 violent deaths that occurred in Oklahoma to non-residents were excluded from the analysis.
• The number of violent deaths increased by 10% from 882 deaths in 2004 to 974 in 2010.
• In 2010, the overall rate of violent deaths in Oklahoma was 39% higher than the U.S. rate (26.7 and 19.2, respectively) (Figure 1).
• Seventy-five percent (4,850) of violent death victims in Oklahoma were male and 25% (1,627) were female.
• The mean age of victims was 40 years. Violent death rates were highest among persons 25-55 years of age (35.0) and lowest among persons 5-14 years of age (2.6).
Figure 1. U.S. and Oklahoma Age-Adjusted Violent Death Rates, 2010
16.9
5.73.2
0.1 0.2
26.7
12.1
5.3
1.60.2 0.1
19.2
0
5
10
15
20
25
30
Suicide Homicide Undetermined UnintentionalFirearm
LegalIntervention
Total ViolentDeaths
Oklahoma U.S.
Table 1. Number of Victims* and Number of Incidents by Manner of Death and Type of Incident, Oklahoma, 2004-2010
Incident Type Suicide Homicide Legal Intervention
Uninten- tional
Unknown Manner
Number of Victims
Number of Incidents
Suicide only 3,750 0 0 0 0 3,750 3,746 Homicide Single homicide Multiple homicide
0 0
1,299 129
0 0
0 0
0 0
1,299 129
1,299
55 Legal intervention only 0 0 72 0 0 72 72
Homicide and suicide 86 102 0 0 0 188 86
Unintentional firearm 0 0 0 60 0 60 60
Undetermined 0 0 0 0 972 972 961
*Some data have been suppressed due to small numbers.
6

• Males had the highest rate of violent deaths at 38.6 per 100,000 population, which was three times higher than the rate for females (12.6). Among males, persons aged 25-54 years and persons aged 85 years and older had the highest rates of violent death (52.1 and 51.1, respectively). Among females, the highest rates of violent death were among children less than 5 years of age (19.1) and females 45-54 years (20.1) (Figure 2).
• The majority (74%) of victims were white, 12% were black, 10% were Native American, 4% were mixed race or other race and less than 1% were Asian. However, the rate of violent death per 100,000 population among blacks (35.3) was 33% higher than the rate among Native Americans (26.5), 50% higher than whites (23.5), and 9.8 times higher than the rate among Asians (3.6) (Table 2). Blacks 15-34 years and Native Americans 25-44 years of age had the highest rates of violent death (61.7 and 42.4, respectively).
• The violent death rate among Hispanics (15.7) was lower than non-Hispanics (26.0).
• Males in all racial and ethnic categories had higher rates of violent death than females (Figure 3).
• The rate among Black males (58.1) was 66% higher than white males (35.1), 51% higher than Native American males (38.6) and 10.8 times higher than Asian males (5.4) (Figure 3).
• Among females, Native American females less than 5 years of age had the highest rate of violent death (37.3), followed by black females less than 5 years of age (26.7).
• The rate among Hispanic males (23.2) was 3.1 times higher than the rate among Hispanic females (7.4). Among Hispanic males, the rate of violent death was highest for persons ages 15-34 years (36.8), while the highest rate among Hispanic females was among children less than 5 years of age (13.1) (Table 2).
Figure 2. Age and Gender Specific Rates of Violent Death, Oklahoma, 2004-2010*
27.2
3
40.9
52.7 53.1 50.7
3733.3
47.451.1
19.1
2.1
10.114.9
17.6 20.1
13.98.4 6.2 5
0
10
20
30
40
50
60
0-4 5-14 15-24 25-34 35-44 45-54 55-64 65-74 75-84 85+
Age Group
Male Female
Rate per 100,000 population
*Includes 6476 victims of violent death for whom age was known.
Figure 3. Gender, Race, and Ethnicity Specific Rates of Violent Death, Oklahoma, 2004-2010
35.1
58.1
38.6
5.4
23.2
12.2 12.314.6
1.97.4
0
10
20
30
40
50
60
70
White Black Native American
Asian Hispanic Ethnicity
Race/Ethnicity
Male Female
Rate per 100,000 population
7

Table 2. Violent Deaths by Age, Gender, Race,* and Ethnicity,** Oklahoma, 2004-2010 White Black Native American Hispanic Age Number Rate Number Rate Number Rate Number Rate Both Genders 0-4 224 17.3 71 35.5 86 35.1 38 13.6 5-14 55 2.2 15 3.9 14 2.8 6 1.5 15-24 540 19.1 225 57.7 128 28.2 98 25.5 25-34 726 28.0 198 65.6 143 41.9 83 22.6 35-44 885 33.5 107 39.9 135 43.2 47 18.2 45-54 1056 35.6 83 31.2 96 31.9 30 18.4 55-64 626 25.9 30 18.0 42 20.3 9 11.2 65+ 654 21.6 22 14.5 28 15.5 5 8.8 Males 0-4 141 21.2 45 44.0 41 32.9 20 14.2 5-14 35 2.7 11 5.6 § § § § 15-24 416 28.6 196 97.3 103 44.5 86 40.7 25-34 553 41.6 174 114.5 108 63.3 68 32.9 35-44 656 49.3 86 64.0 102 66.4 36 25.5 45-54 742 50.3 69 52.8 70 48.5 21 23.6 55-64 446 37.9 20 25.2 31 31.5 8 19.3 65+ 530 40.6 13 21.3 25 32.0 § § Females 0-4 83 13.1 26 26.7 45 37.3 18 13.1 5-14 20 1.6 § § 10 4.1 § § 15-24 124 9.1 27 14.3 25 11.3 12 6.9 25-34 173 13.6 24 16.0 35 20.5 15 9.3 35-44 229 17.5 20 14.9 32 20.2 11 9.4 45-54 314 21.0 14 10.3 26 16.6 9 12.1 55-64 180 14.5 9 10.3 11 10.1 § § 65+ 124 7.2 8 8.8 § § § § * Race was “mixed” for 24 persons, Asian for 18 persons, “other” for 224 persons, and
unknown for 22 persons. Age was unknown for one person. ** Hispanic ethnicity is counted separately from race and is not a racial category.
Hispanic ethnicity was not specified for 71 persons. § Some data have been suppressed due to small numbers.
8

• Suicides accounted for the majority of deaths (59%), followed by homicides (24%), undetermined manner deaths (15%), legal interventions (1%), and unintentional firearm deaths (1%) (Figure 4).
• Males were 3.8 times more likely to die from suicide, 3.1 times more likely to die from homicide, 15 times more likely to die from legal intervention, 1.3 times more likely to die from undetermined manner and over 13 times more likely to die from unintentional firearm injury death than females (Table 3).
• The majority (73%) of persons were injured on a home premises (includes house, apartment, driveway, porch, or yard), 6% were injured in motor vehicles, 4% were injured on a street or highway, 4% in natural areas or parks, 2% in parking lots, 2% in jails or prisons, 1% in hotels/motels, 1% in commercial businesses, and 7% in other or unknown locations.
• Four percent (230) of deaths occurred while the person was in custody. Of these, 121 (53%) persons died in jails or prisons, 18 persons (8%) died while under arrest but not in jail, 83 (36%) persons died prior to being arrested, and 8 (3%) of persons died in other types of custody.
– Fifty-three percent of deaths in custody were suicides, 19% were homicides, 24% were from legal intervention, and 3% were of undetermined manner of death.
– Ninety-five percent of persons who died while in custody were male and 5% were female.
• Forty-six (1%) victims of violent death were homeless including 17 suicide victims, 18 homicide victims, and 10 persons for whom the manner of death was undetermined. Thirty-seven of the homeless victims were male, and nine victims were female. (Homeless was defined as having no fixed address and living in a shelter, on the street, in a car, or in makeshift quarters in an outdoor setting.)
Figure 4. Manner of Violent Death, Oklahoma, 2004-2010
Table 3. Manner of Violent Death by Gender, Oklahoma, 2004-2010
Manner of Death Male Female Number % Rate Number % Rate
Suicide 3019 62% 24.0 817 50% 6.3 Homicide 1152 24% 9.2 382 23% 3.0 Undetermined 553 11% 4.4 419 26% 3.3 Legal Intervention 70 1% 0.6 5 <1% 0.04 Unintentional firearm injury 56 1% 0.4 § § §
§ Some data have been suppressed due to small numbers.
9

• In more than half (51%) of the deaths, a firearm was used to kill the victim. Other methods included poisoning (14%), hanging or strangulation (12%), sharp or blunt instruments (7%), and other or unspecified methods (16%).
• Firearms were involved in the majority of both male and female violent deaths; however, firearms were used in proportionally more male violent deaths than female violent deaths, 58% and 33%, respectively (Figure 5).
• Poisoning was used in a greater proportion of female violent deaths than male violent deaths, 26% and 9%, respectively.
• Eighty-four percent of all firearm death victims were males.
Figure 5. Weapons/Methods* Involved in Violent Death Incidents by Gender, Oklahoma, 2004-2010
Firearm33%
Poisoning26%
Hanging/Strangulation
11%
Sharp or Blunt
Instrument7%
Other Weapon**
7%
Unknown16%
Females
* More than one type of weapon/method may have been involved in the death. **Other weapon includes motor vehicle or other transportation (81), fire/burn (81), drowning (38), personal weapons (72), fall (36), shaking (17), and other (14).
Firearm58%
Poisoning9%
Hanging/Strangulation
12%
Sharp or Blunt
Instrument7%
Other Weapon**
5%
Unknown8%
Males
10

• Thirty-seven percent of victims were single, less than one-third of victims were married, and one-fourth of victims were divorced or separated. Six percent of victims were widowed (Table 4).
• Seventeen percent of violent death victims had served in the U.S. Armed Forces.
• Twenty-three percent of victims 25 years of age and older had not completed high school or high school equivalent (GED). Forty-one percent had completed high school and 35% of victims had some college or a college degree (Table 5).
• Thirty-five percent of violent death victims 25 years of age and older had some college or a college degree compared to 55% of Oklahoma’s population.
Table 4. Selected Socio-demographic Characteristics of Violent Death Victims, Oklahoma, 2004-2010
Marital Status Number (N=6477) Percent
Single 2396 37% Married 1980 31% Divorced/Separated 1613 25% Widowed 357 6% Unknown 131 2% Veteran Status Served in U.S. Armed Forces 1094 17%
Table 5. Educational Attainment of Victims of Violent Death and Oklahoma’s Population, 2004-2010
Educational Level Violent Death Victims Oklahoma’s
Population** Number* (N=4996) Percent Percent
8th Grade or Less 280 6% 5% 9-12th Grade 858 17% 9% High School or GED 2031 41% 32% Some College 904 18% 24% Associate Degree 265 5% 7% Bachelor Degree 375 8% 15% Graduate Degree 187 4% 8% Unknown 96 1% *Includes violent death victims 25 years of age and older. **U.S. Census Bureau, 2006-2010 American Community Survey. Includes educational attainment of Oklahoma’s population 25 years of age and older.
11

Geographic Distribution of Violent Deaths Uniform Crime Reporting Regions
• The Uniform Crime Reporting (UCR) system is a law enforcement data system maintained by the Oklahoma State Bureau of Investigation. Data are collected from 324 police and sheriff departments statewide. The state is divided into eight designated reporting regions for the purpose of collecting UCR data (Figure 6).
• Violent death rates were highest in eastern Oklahoma with UCR Region 5 having the highest rate of violent death (30.0 per 100,000 population), followed by Region 3 (28.5) and Region 4 (26.8) (Table 6). UCR Region 6 had the lowest overall rate of violent death (20.4).
• UCR Region 5 had the highest suicide rate (18.9), UCR Region 3 had the highest homicide rates at 7.2, UCR Regions 3 and 4 had the highest rate of undetermined manner of death at 4.3, UCR Region 5 had the highest unintentional firearm death rate (0.7), and UCR Regions 1 and 6 had the highest rate of death by legal intervention at 0.4.
Figure 6. Oklahoma State Bureau of Investigation Uniform Crime Reporting Regions
CimarronTexas
BeaverHarper
Ellis
Roger Mills
Beckham
Woodward
Woods Alfalfa
Major
Dewey
Custer
Washita
Greer Kiowa
Blaine
Caddo
Grant
Garfield
Kingfisher
Kay
Noble
Payne
Logan
Canadian Oklahoma
Cleveland
Grady
Pawnee
Osage
Creek
Lincoln
McClain
Jackson
Tillman
Comanche
Cotton
Stephens
Jefferson
Garvin
Carter
Murray
Love
Pontotoc
Johnston
Coal
Atoka
Bryan
Hughes
Okfuskee
Pittsburg
McIntosh
Pushmataha
Choctaw McCurtain
Le FloreLatimer
Haskell
Sequoyah
Muskogee
TulsaWagoner
Cherokee
Adair
Ottawa
Washington
Rogers
Nowata
Craig
Mayes
Marshall
Harmon
Delaware
Okmulgee
SeminolePotta-watomie
Reg 4
Reg 1Reg 2 Reg 3
Reg 5Reg 6
Reg 7
Reg 8
12

Table 6. Type of Violent Death by UCR Reporting Region, Oklahoma, 2004-2010 §
Type of Death Region 1 Region 2
2010 Population = 1,048,554 2010 Population = 118,964 Number % Rate* Number % Rate*
Suicide 983 55% 13.8 114 67% 13.8 Homicide 507 28% 7.1 29 17% 3.5 All Violent Deaths 1791 100% 25.2 170 100% 20.6
Type of Death Region 3 Region 4
2010 Population = 956,976 2010 Population = 318,129 Number % Rate* Number % Rate*
Suicide 1064 58% 16.5 358 61% 16.4 Homicide 466 25% 7.2 121 21% 5.5 All Violent Deaths 1840 100% 28.5 584 100% 26.8
Type of Death Region 5 Region 6
2010 Population = 236,678 2010 Population = 524,358 Number % Rate* Number % Rate*
Suicide 309 63% 18.9 472 66% 13.5 Homicide 103 21% 6.3 120 17% 3.4 All Violent Deaths 491 100% 30.0 714 100% 20.4
Type of Death Region 7 Region 8
2010 Population = 323,201 2010 Population = 232,622 Number % Rate* Number % Rate*
Suicide 330 60% 15.2 205 62% 13.2 Homicide 120 22% 5.5 62 19% 4.0 All Violent Deaths 553 100% 25.4 332 100% 21.4 County of residence was unknown for one person. *Average Annual Rate of violent death is based on residence of victim § Some data have been suppressed due to small numbers.
13

County Rates • Forty-five counties had a rate of violent death below the state rate (25.4 per 100,000
population). Twenty-nine counties had rates of violent death 1% to 49% higher than the state rate, and three counties had rates that were more than 50% higher than the state rate (Figure 7).
• Oklahoma and Tulsa counties ranked 23rd and 11th, respectively, among counties in the rate of violent deaths during 2004 to 2010. However, 40% of all violent deaths occurred among residents of these two counties alone. More than half (54%) of homicides, over one-third (35%) of suicides, 39% of undetermined manner deaths, 25% of unintentional firearm deaths, and 44% of legal intervention deaths were among Oklahoma or Tulsa County residents (Appendix 1).
• Choctaw County had the highest homicide rate at 12.2 per 100,000 population, while Johnston County had the highest suicide rate (26.7) and Seminole County had the highest rate of deaths with undetermined manner (8.0). The number and rate of all manners of violent death by county are found in Appendix 1.
Figure 7. Violent Death Rates by County of Residence, Oklahoma, 2004-2010
CimarronTexas
BeaverHarper
Ellis
Roger Mills
Beckham
Woodward
Woods Alfalfa
Major
Dewey
Custer
Washita
Greer Kiowa
Blaine
Caddo
Grant
Garfield
Kingfisher
Kay
Noble
Payne
Logan
Canadian Oklahoma
Cleveland
Grady
Pawnee
Osage
Creek
Lincoln
McClain
Jackson
Tillman
Comanche
Cotton
Stephens
Jefferson
Garvin
Carter
Murray
Love
Pontotoc
Johnston
Coal
Hughes
Okfuskee
Pittsburg
McIntosh
McCurtain
Latimer
Haskell
Sequoyah
Muskogee
TulsaWagoner Cherokee
Adair
Ottawa
Washington
Rogers
Nowata
Craig
Mayes
Marshall
Harmon
Delaware
Okmulgee
SeminolePotta-watomie
50+% Above State Rate25-49% Above State Rate1-24% Above State RateBelow State Rate No Deaths
Le Flore
Choctaw
Atoka
Bryan
Pushmataha
14

Suicides • Suicide was the most common manner of violent death
accounting for 3,836 deaths during 2004 to 2010, or an average of 548 deaths per year (average annual rate = 15.1 per 100,000 population).
• The annual state suicide rate increased 20% from 2004 to 2010 (Table 7).
• The mean age of suicide victims was 46 years.
• Seventy-nine percent of suicide victims were male and 21% were female.
• In 86 (2%) of the suicide deaths, the victim killed other people before taking their own life, resulting in 102 homicide deaths.
• Males 85+ years of age had the highest suicide rate among all age and gender groups (45.7 per 100,000 population) (Figure 8 and Table 8).
• The suicide rate among males was 3.8 times higher than the rate among females (24.0 and 6.3, respectively); females 35-54 years of age were at greatest risk for suicide. The suicide rate among females 35-54 years of age was almost twice the overall suicide rate among females, 11.2 and 6.3, respectively.
• The suicide rate among whites was 2.3 times higher than blacks, 27% higher than Native Americans, and 8.1 times higher than Asians.
• Males in all racial categories had higher suicide rates than females (Figure 9).
Table 7. Suicide by Year, Oklahoma, 2004 -2010
Year Number Rate 2004 496 14.1 2005 516 14.6 2006 528 14.8 2007 516 14.2 2008 580 15.8 2009 565 15.2 2010 635 16.9
1.3
20.5
30.9 35.5 35.0
27.3 27.2
41.9 45.7
0.3 5.1 7.8 9.8 12.5
8.4 5.3 4.2 1.1 0
10
20
30
40
50
5-14 15-24 25-34 35-44 45-54 55-64 65-74 75-84 85+
Rate
per
100,0
00 p
opul
atio
n
Age Group
Figure 8. Age and Gender Specific Rates of Suicide*, Oklahoma 2004-2010
Males Females
25.5 20.1
12
2.9
9.2 6.9 5.4 1.9 1.2 2.8
05
1015202530
White NativeAmerican
Black Asian HispanicEthnicityRa
te p
er 10
0,000
pop
ulat
ion
Race/Ethnicity
Figure 9. Gender, Race, and Ethnicity Specific Rates of Suicide, Oklahoma 2004-2010
Male Female
15

• The suicide rate among non-Hispanics was almost 2.5 times higher than the rate for Hispanics (15.7 and 6.2, respectively).
• Firearms were used in 60% of suicides. • Sixty-six percent of firearms used in suicides were handguns, 13% were rifles, 15% were
shotguns, and 6% were other/unknown firearms. • Hanging/strangulation were used in 19%, poisoning 16%, and other/unknown methods in
5% of suicides. – Other methods used to complete suicide were sharp/blunt instrument (68), motor
vehicle or other transportation vehicle (40), drowning (20), fire (23), fall (15), and unknown (4) methods.
Table 8. Suicide by Age, Gender, Race,* and Ethnicity,** Oklahoma, 2004-2010 White Black Native American Hispanic Age Number Rate Number Rate Number Rate Number Rate Both Genders 5-24 366 6.9 32 4.1 90 9.5 39 4.9 25-34 507 19.5 46 15.2 68 19.9 37 10.1 35-44 625 23.7 33 12.3 71 22.7 20 7.7 45-54 750 25.3 21 7.9 56 18.6 23 14.1 55-64 463 19.1 9 5.4 18 8.7 § § 65+ 546 18.1 6 4.0 18 10.0 § §
Males 5-24 296 10.8 26 6.5 71 14.7 32 15.2 25-34 408 30.7 40 26.3 51 29.9 29 14.0 35-44 487 36.6 29 21.6 57 37.1 15 10.6 45-54 548 37.2 20 15.3 41 28.4 15 16.9 55-64 348 29.6 7 8.8 15 15.3 § § 65+ 466 35.7 5 8.2 17 21.8 § §
Females 5-24 70 2.7 6 1.6 19 4.1 5 1.3 25-34 99 7.8 6 4.0 17 9.9 8 5.0 35-44 138 10.6 4 3.0 14 8.8 5 4.3 45-54 202 13.5 1 0.7 15 9.6 8 10.7 55-64 115 9.2 § § § § 0 0 65+ 80 4.7 § § § § 0 0 * Race was “mixed” for 6 persons, Asian for 10 persons, “other” for 87 persons, and unknown for 8
persons. ** Hispanic ethnicity is counted separately from race and is not a racial category.
Hispanic ethnicity was unknown for 10 persons. § Some data have been suppressed due to small numbers.
16

• Firearms were used in male suicide deaths more often than in female suicide deaths, 65% and 42%, respectively. Poisoning was used more often in female suicide than male suicide, 35% and 11%, respectively (Figure 10).
Figure 10. Method of Suicide by Gender, Oklahoma, 2004-2010
Males
Firearm65%
Hanging/ Strangulation
20%Poisoning
11% Sharp/Blunt Instrument
2%Other2%
Females
Firearm42%
Hanging/ Strangulation
18%
Poisoning35%
Sharp/Blunt Instrument
1%Other4%
Table 9. Selected Suicide Circumstances by Gender, Oklahoma, 2004-2010* Total (n=3,836) Male (n=3,019) Female (n=817) Number Percent Number Percent Number Percent Current depressed mood 1509 39 1188 39 321 39 Intimate partner problem 1305 34 1069 35 236 29 Disclosed intent to commit suicide 1226 32 958 32 268 33 Mental health problem 1260 33 873 29 387 47 Depression/dysthymia 848 22 596 20 252 31 Bipolar disorder 169 4 89 3 80 10 Schizophrenia 64 2 45 1 19 2 Anxiety disorder 65 2 45 1 20 2 Post-traumatic stress disorder 16 <1 § § § § ADD or hyperactivity disorder 12 <1 § § § § Other/unknown 237 6 172 6 65 8 Left a suicide note 1142 30 868 29 274 34 Physical health problem 1018 27 788 26 230 28 Crisis in past two weeks 871 23 726 24 145 18 History of previous suicide attempts 697 18 446 15 251 31 Alcohol 505 13 426 14 79 10 Substance abuse 492 13 356 12 136 17 Financial problem 449 12 370 12 79 10 Other relationship problem 413 11 309 10 104 13 Job problem 398 10 348 12 50 6 Recent criminal legal problem 370 10 332 11 38 5 Other death of friend or family 245 6 191 6 54 7 Non-criminal legal problem 144 4 124 4 20 2 Perpetrator of interpersonal violence within past month 60 2 55 2 5 1 Suicide of friend or family within past five years 67 2 43 1 24 3 School problem 31 1 25 1 6 1 Victim of interpersonal violence within past month 10 <1 § § § § *More than one circumstance may have been associated with the death. Percentages were calculated using the total number of persons that committed suicide. § Some data have been suppressed due to small numbers.
17

• The types of substances used in suicide deaths by poisoning were prescription drugs (65%), carbon monoxide or gas vapor (16%), over-the-counter drugs (6%), alcohol (4%), other drugs/poison (3%), street drugs (1%), and unknown poisons (1%).
• For 3,686 (96%) victims, information on circumstances associated with the suicide was available in the police report and/or medical examiner report. – The leading circumstances associated with suicide were current depressed mood (cited
in 39% of suicides), intimate partner problem (34%), current mental health problem (33%), physical health problem (27%), crisis in the past two weeks (23%), and alcohol (13%) (Table 9).
• The circumstances associated with suicide varied somewhat by life stages (Table 10). – The rate of suicide associated with physical health problems was 4.6 times higher
among persons 65 years of age and older than among persons less than 65 years of age (12.4 and 2.7, respectively).
– The rate of suicide associated with intimate partner problems was 4.6 times higher among persons less than 65 years of age than among person 65 years of age and older, 5.7 and 1.2, respectively.
– A substantial proportion of suicide deaths were associated with a current depressed mood, mental health problem, or crisis in the past two weeks for persons across all age groups.
– Seventy percent of persons who died by suicide with a current mental health problem were receiving mental health treatment, including 60% of persons 10-24 years, 70% of persons 25-44 years, 73% of persons 45-64 years, and 64% of persons 65 years and older.
Table 10. Ten Most Common Circumstances* Associated with Suicide Deaths by Rank and Age Group, Oklahoma, 2004-2010 Rank 10-24 Years 25-44 Years 45-64 Years 65+ Years
1 Intimate partner problem (37%)
Intimate partner problem (48%)
Current depressed mood (42%)
Physical health problem (73%)
2 Current depressed mood (36%)
Current depressed mood (36%)
Current mental health problem (38%)
Current depressed mood (44%)
3 Current mental health problem (27%)
Current mental health problem (34%)
Physical health problem (30%)
Current mental health problem (23%)
4 Crisis in past 2 weeks (25%)
Crisis in past 2 weeks (26%)
Intimate partner problem (30%)
Crisis in past 2 weeks (20%)
5 Relationship problem other than intimate
partner (22%)
History of suicide attempts (21%)
History of suicide attempts (21%)
Death of family or friend (11%)
6 Substance abuse problem (18%)
Substance abuse problem (18%)
Crisis in past 2 weeks (19%)
Intimate partner problem (7%)
7 History of suicide attempts (17%)
Alcohol problem (16%)
Financial problem (17%)
History of suicide attempts (6%)
8 Recent criminal/legal problem (10%)
Recent criminal/legal problem (14%)
Alcohol problem (15%)
Financial Problem (6%)
9 Job problem (9%)
Physical health problem (12%)
Job problem (14%)
Other relationship problem (5%)
10 Alcohol problem (8%)
Financial problem (12%)
Substance abuse problem (10%)
Alcohol problem (5%)
*More than one circumstance may have been associated with the suicide.
18

• Eighteen percent of suicide victims had a history of suicide attempts. • 32% of suicide victims had previously stated their intent or expressed suicidal feelings to
another person and 30% left a suicide note. • A positive blood alcohol test was documented for 1,125 persons (32% of persons tested),
and a positive drug test was documented for 733 persons (19% of persons tested) who died by suicide.
• Twenty-three percent (863) of suicide victims were veterans (persons who had served in the U.S. Armed Forces), including 839 males and 24 females. This represents 79% (863/1094) of all violent deaths among veterans.
• The mean age of veterans who died by suicide was 58 years. The youngest victim was 18 and the oldest was 93 years of age; 39% of these suicide deaths were among veterans 65 years of age and older (Table 11).
• The vast majority (74%) of suicides among veterans were completed with a firearm. Other methods of suicide among veterans were poisoning (12%), hanging/strangulation (11%), and other methods (3%).
• Circumstances were known in 830 (96%) of the suicides among veterans. The circumstances most often associated with the deaths were physical health problem (45%), current depressed mood (41%), current mental health problem (29%), intimate partner problem (24%) and crisis in the past two weeks (22%).
• Forty-one counties had suicide rates higher than the state rate, 36 counties had suicide rates at or below the state rate during 2004 to 2010 (Figure 11).
Table 11. Suicide Deaths of Veterans by Age, Oklahoma, 2004-2010 Age Number Percent 15-24 34 4% 25-34 60 7% 35-44 111 13% 45-54 146 17% 55-64 178 21% 65+ 334 39% Total 863 100%
19

Dewe
y
Cadd
o
Figu
re 1
1. S
uici
de D
eath
Rat
es b
y C
ount
y of
Res
iden
ce, O
klah
oma,
200
4-20
10
Cima
rron
Texa
sBe
aver
Harp
er
Ellis
Roge
rMills
Beck
ham
Woo
dwar
d
Woo
dsAlf
alfa
Gree
rKi
owa
Blaine
Gran
t
Garfie
ld
Kay
Noble
Payn
e
Loga
n
Oklah
oma
Clev
eland
Pawn
ee
Osag
e
Cree
k
Linco
ln
Tillm
anCo
tton
Step
hens
Jeffe
rson
Garvi
n
Murra
y
Love
John
ston
McInt
osh
McCu
rtain
Le F
lore
Latim
er
Musk
ogee
Tulsa
Wag
oner
Adair
Ottaw
a
Washington
Roge
rs
Nowa
ta
Craig
Maye
s
Marsh
all
Harm
on
Delaw
are
Okmu
lgee
Semi
nole
Potta
-wa
tomie
50+%
Abo
ve S
tate
Rat
e25
-49%
Abo
ve S
tate
Rat
e1-
24%
Abo
ve S
tate
Rat
eBe
low
Sta
te R
ate
No
Dea
ths
Hugh
es
Ponto
toc
Coal
Okfus
kee
Pitts
burg
Hask
ell
Sequ
oyah
Cher
okee
Grad
y
McCl
ain
Carte
r
Was
hita
Jack
son
Coma
nche
Major
Custe
r
King
fishe
r
Cana
dian
Choc
taw
Atok
a
Brya
n
Push
matah
a
20

Homicides • During 2004 to 2010, there were 1,439 incidents where
homicide occurred resulting in 1,529 victims, an average of 218 deaths per year (average annual rate=6.0 per 100,000 population). The annual homicide rate ranged from a high in 2007 of 6.4 to a low in 2010 of 5.5 (Table 12).
• Homicide victims were generally younger than suicide victims with a mean age of 34 years.
• Seventy-five percent of homicide victims were male and 25% were female.
• In 145 (10%) homicide incidents, more than one victim was killed, including 102 homicide victims in homicide-suicide events, 129 victims in multiple homicides.
• There were 131 homicides among persons less than 15 years of age (9% of all homicide deaths). Of these, 58 (44%) were female (representing 15% of all homicides among females), and 73 (56%) were male (representing 6% of all homicides among males).
• The homicide rate among males (9.1) was 3.1 times higher than the rate among females (3.0). Homicide rates were higher for males across all age groups except for persons 5-14 years of age (Figure 12).
• The homicide rate among blacks (22.9) was 6.2 times higher than among whites (3.7) and 3.3 times higher than among Native Americans (6.9). – The homicide rate among black
males (39.1) was 3.9 times higher than the rate among Native American males (10.1), and almost 8 times higher than the rate among white males (5.0) (Figure 13).
– Black males 15-34 years of age had the highest homicide rate in all race and gender categories at 80.4 per 100,000 population (Table 13).
• Among females, the homicide rate among black females (6.9) was 3.0 times higher than the rate among white females (2.3) and 1.8 times higher than the rate among Native American females (3.8).
Table 12. Homicide by Year, Oklahoma, 2004-2010
Year Number Rate 2004 211 6.0 2005 208 5.9 2006 212 5.9 2007 232 6.4 2008 223 6.1 2009 237 6.4 2010 206 5.5
Figure 12. Age and Gender Specific Rates of Homicide,* Oklahoma, 2004-2010
6.2
1
16.4 16.3
11.89.5
5.43.5 2.3 2.3
3.9
1.43.6 4.6 4.4
2.72 1.9
0.91.8
02468
1012141618
0-4 5-14 15-24 25-34 35-44 45-54 55-64 65-74 75-84 85+
Age Group
Male Female
Rate per 100,000 population
*Includes 1534 homicide victims.
Figure 13. Gender, Race, and Ethnicity Specific Rates of Homicide, Oklahoma, 2004-2010
39.1
10.15
1.7
10.46.93.8 2.3 2.7
05
1015202530354045
Black NativeAmerican
White Asian HispanicEthnicity
Race/Ethnicity
Male Female
Rate per 100,000 population
21

• The homicide rate among Hispanics was 1.2 times higher than the rate among non-Hispanics (6.8 and 5.8, respectively). The homicide rate among Hispanic males was 1.2 times higher than the rate among non-Hispanic males (10.4 and 8.8, respectively). Alternately, the homicide rate among non-Hispanic females was 1.1 times higher than the rate among Hispanic females (2.7 and 3.0, respectively).
Table 13. Homicide Rates by Age, Gender, Race,* and Ethnicity,** Oklahoma, 2004-2010 White Black Native American Hispanic Age Number Rate Number Rate Number Rate Number Rate Both Genders 0-14 73 1.9 28 4.8 22 3.0 11 1.6 15-24 127 4.5 179 45.9 28 6.2 56 14.6 25-34 125 4.8 138 45.7 54 15.8 39 10.6 35-44 147 5.6 63 23.5 41 13.1 21 8.1 45-54 139 4.7 54 20.3 21 7.0 § § 55-64 78 3.2 16 9.6 § § § § 65+ 56 1.9 9 5.9 5 2.8 § § Males 0.14 43 2.2 17 5.7 8 2.1 § § 15-24 90 6.2 162 80.4 21 9.1 49 23.2 25-34 85 6.4 122 80.3 41 24.0 33 15.9 35-44 99 7.4 50 37.2 32 20.8 16 11.3 45-54 103 7.0 43 32.9 18 12.5 § § 55-64 55 4.7 13 16.4 § § § § 65+ 31 2.4 6 9.8 § § § § Females 0-14 30 1.6 11 3.9 14 3.8 7 2.1 15-24 37 2.7 17 9.0 7 3.2 7 4.1 25-34 40 3.2 16 10.7 13 7.6 6 3.7 35-44 48 3.7 13 9.7 9 5.7 5 4.3 45-54 36 2.4 11 8.1 § § 0 0.0 55-64 23 1.8 § § § § 0 0.0 65+ 25 1.5 § § § § 0 0.0 * Race was “mixed” or Asian for 12 persons, “other” or unknown for 118 persons. ** Hispanic ethnicity is counted separately from race and is not a racial category.
Hispanic ethnicity was unknown for 12 persons. § Some data have been suppressed due to small numbers.
22
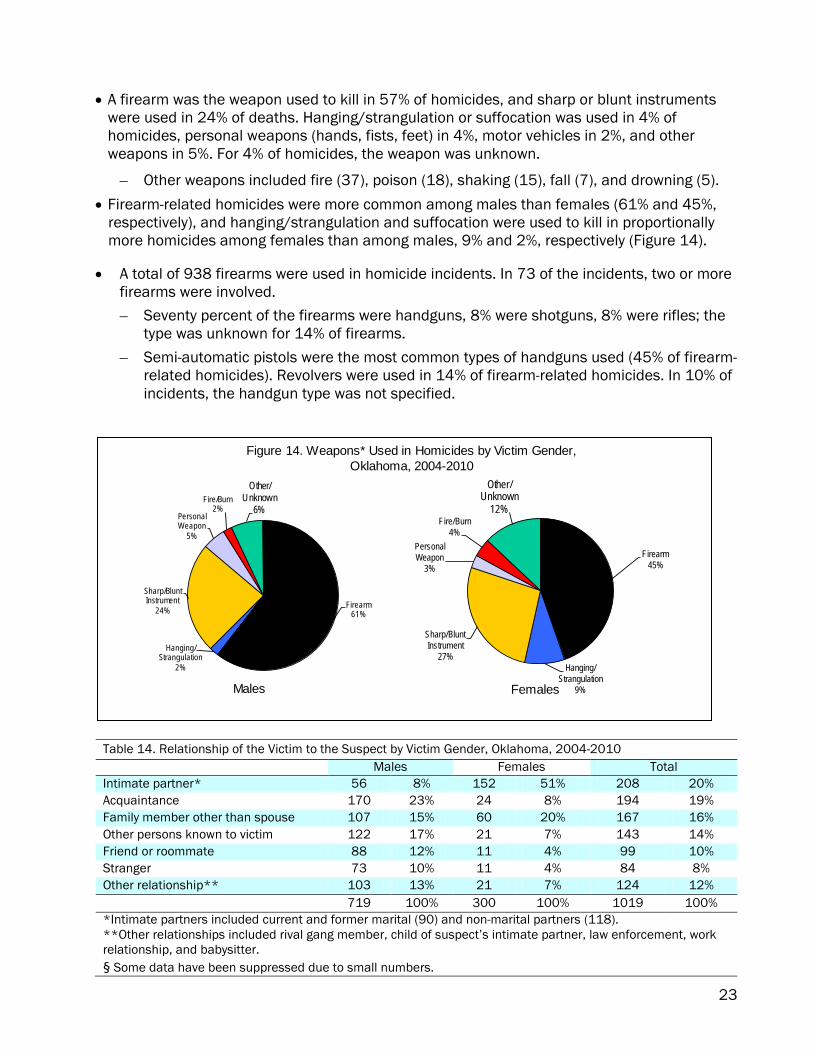
• A firearm was the weapon used to kill in 57% of homicides, and sharp or blunt instruments were used in 24% of deaths. Hanging/strangulation or suffocation was used in 4% of homicides, personal weapons (hands, fists, feet) in 4%, motor vehicles in 2%, and other weapons in 5%. For 4% of homicides, the weapon was unknown.
– Other weapons included fire (37), poison (18), shaking (15), fall (7), and drowning (5). • Firearm-related homicides were more common among males than females (61% and 45%,
respectively), and hanging/strangulation and suffocation were used to kill in proportionally more homicides among females than among males, 9% and 2%, respectively (Figure 14).
• A total of 938 firearms were used in homicide incidents. In 73 of the incidents, two or more firearms were involved. – Seventy percent of the firearms were handguns, 8% were shotguns, 8% were rifles; the
type was unknown for 14% of firearms. – Semi-automatic pistols were the most common types of handguns used (45% of firearm-
related homicides). Revolvers were used in 14% of firearm-related homicides. In 10% of incidents, the handgun type was not specified.
Firearm61%
Hanging/ Strangulation
2%
Sharp/Blunt Instrument
24%
Personal Weapon
5%
Fire/Burn2%
Other/ Unknown
6%
Firearm45%
Hanging/ Strangulation
9%
Sharp/Blunt Instrument
27%
Personal Weapon
3%
Fire/Burn4%
Other/Unknown
12%
Males Females
Figure 14. Weapons* Used in Homicides by Victim Gender, Oklahoma, 2004-2010
Table 14. Relationship of the Victim to the Suspect by Victim Gender, Oklahoma, 2004-2010 Males Females Total Intimate partner* 56 8% 152 51% 208 20% Acquaintance 170 23% 24 8% 194 19% Family member other than spouse 107 15% 60 20% 167 16% Other persons known to victim 122 17% 21 7% 143 14% Friend or roommate 88 12% 11 4% 99 10% Stranger 73 10% 11 4% 84 8% Other relationship** 103 13% 21 7% 124 12% 719 100% 300 100% 1019 100% *Intimate partners included current and former marital (90) and non-marital partners (118). **Other relationships included rival gang member, child of suspect’s intimate partner, law enforcement, work relationship, and babysitter. § Some data have been suppressed due to small numbers.
23

• The relationship between the victim and the suspect(s) was known for 1,019 (67%) homicide victims. Victims were often killed by people known to them, including intimate partners (20%), acquaintances (19%), family members (16%), and friends or roommates (10%) (Table 14). In 8% of homicides the suspect was a stranger.
• Intimate partners and family members other than spouses were the suspects in a substantially higher percentage of homicides among females than among males (51% vs. 8% and 20% vs. 15%, respectively).
• Acquaintances were the suspects in a substantially higher percentage of homicides among males than among females (23% vs. 8%).
• For 1,331 (87%) homicide deaths, circumstances surrounding the homicide were documented in the police report and/or the medical examiner report. – In 39% of homicides, an argument or interpersonal conflict was a precipitating factor
(26% of these arguments involved money or property). – Twenty-five percent (389) of homicides were precipitated by other serious crimes including
robbery (171), drug trade (48), burglary (48), assaults (93), rape (24), motor vehicle theft (5), and other crimes (25) (Table 15). In two-thirds of these incidents the crime was in progress.
– Drugs were involved in 17% (263) of the homicides, and 10% (157) of homicides were gang-related.
– Gang-related homicides were 6.2 times more common among males than females and drug-related homicides were 1.8 times more common among males than females.
– Nineteen percent (283) of homicides were related to conflict between intimate partners.
Table 15. Selected Homicide Circumstances by Gender, Oklahoma 2004-2010* Total (n=1529) Male (n=1148) Female (n=381) Percent Percent Percent Other argument, abuse, conflict 31% 36% 18% Precipitated by another crime 25% 28% 16% Robbery 11% 13% 5% Drug trade 3% 4% 1% Burglary 3% 4% 1% Assault, homicide 6% 6% 5% Rape, sexual assault 2% 1% 3% Arson 1% 1% <1% Other crime 2% 1% 3% Intimate partner violence-related 19% 10% 43% Drug involvement 17% 19% 11% Argument over money/property 10% 12% 5% Gang-related 10% 13% 2% Brawl (mutual physical fight) 5% 6% 1% Jealousy (lovers triangle) 6% 6% 6% Justifiable self defense/law enforcement 4% 5% 1% Victim was a bystander 1% 1% 1% Hate crime 1% 1% <1% Mercy killing <1% 1% Terror <1% <1% * More than one circumstance may have been associated with the death. Percentages were calculated using the number of homicide victims.
24

– Conflict between intimate partners was cited in proportionately more homicides among females than among males (43% and 10%, respectively).
• Circumstances involved in homicides varied somewhat by age; however, argument or interpersonal conflict was the leading circumstance among all age groups (Table 16). – Gang-related circumstances were cited more often in homicides of persons 10-24 years
of age (25%) (Table 16). • A positive blood alcohol test was documented for 473 homicide victims over 14 years of
age (37% of persons tested), and a positive drug test was documented for 136 homicide victims over 14 years of age (49% of persons tested).
• Twenty-four counties had homicide rates higher than the state rate; 46 counties had homicide rates below the state rate. In 7 Oklahoma counties, there were no homicide deaths (Figure 16).
Table 16. Six Most Common Circumstances* Related to Homicide Deaths by Rank and Age Group, Oklahoma, 2004-2010 Rank <10 Years 10-24 Years 25-44 Years 45-64 Years 65+ Years
1 Argument or
interpersonal conflict (46%)
Argument or interpersonal conflict (42%)
Argument or interpersonal conflict (42%)
Argument or interpersonal conflict (41%)
Argument or interpersonal conflict (36%)
2 Conflict between intimate partners
(21%)
Crime (26%)
Crime (25%)
Crime (29%)
Crime (34%)
3 Crime (7%)
Gang-related (25%)
Conflict between intimate partners
(24%)
Conflict between intimate partners
(19%)
Conflict between intimate partners
(9%)
4 Drug dealing or illegal drug use (5%)
Drug dealing or illegal drug use
(19%)
Drug dealing or illegal drug use
(23%)
Drug dealing or illegal drug use
(10%)
Drug dealing or illegal drug use
(9%)
5 Victim was a bystander (4%)
Conflict between intimate partners
(11%)
Jealousy (8%)
Jealousy (5%)
Jealousy (4%)
6 Gang-related (2%)
Brawl (8%)
Gang-related (7%)
Brawl (5%)
Justifiable, Self defense
(3%) *More than one circumstance may have been associated with the death.
25

Dewe
y
Cadd
o
Figu
re 1
6. H
omic
ide
Dea
th R
ates
by
Cou
nty
of R
esid
ence
, Okl
ahom
a, 2
004-
2010
Cima
rron
Texa
sBe
aver
Harp
er
Ellis
Roge
r Mills
Beck
ham
Woo
dwar
d
Woo
dsAlf
alfa
Gree
rKi
owa
Blaine
Gran
t
Garfie
ld
Kay
Noble
Payn
e
Loga
n
Oklah
oma
Clev
eland
Pawn
ee
Osag
e
Cree
k
Linco
ln
Tillm
anCo
tton
Step
hens
Jeffe
rson
Garvi
n
Murra
y
Love
John
ston
Atok
a
Brya
n
McInt
osh
Push
matah
a
Choc
tawMc
Curta
in
Le F
lore
Latim
er
Musk
ogee
Tulsa
Wag
oner
Adair
Ottaw
a
Washington
Roge
rs
Nowa
ta
Craig
Maye
s
Marsh
all
Harm
on
Delaw
are
Okmu
lgee
Semi
nole
Potta
-wa
tomie
50+%
Abo
ve S
tate
Rat
e25
-49%
Abo
ve S
tate
Rat
e1-
24%
Abo
ve S
tate
Rat
eBe
low
Sta
te R
ate
No
Dea
ths
Hugh
es
Ponto
toc
Coal
Okfus
kee
Pitts
burg
Hask
ell
Sequ
oyah
Cher
okee
Grad
y
McCl
ain
Carte
r
Was
hita
Jack
son
Coma
nche
Major
Custe
r
King
fishe
r
Cana
dian
26

Undetermined Manner of Death • For 972 deaths in Oklahoma during 2004 to 2010,
the manner of death could not be determined. There was an average of 139 deaths per year (average annual rate = 3.8 per 100,000 population).
• The rate of undetermined manner of death decreased by 28% from 2004 to 2010 (Table 17).
• Forty-three percent of undetermined manner of death victims were female and 57% were male.
• The highest rate of undetermined manner of death was among children less than 5 years of age (18.0 per 100,000 population less than 5) (Figure 17). Ninety-one percent (291/320) of these children were infants less than one year of age. Almost one-third (30%) of all undetermined manner deaths were among infants less than one year of age.
– Among females less than 5 years of age, Native Americans had the highest rate of undetermined manner of death (31.5), followed by blacks (19.5) and whites (10.3).
– Among males less than 5 years of age, blacks had the highest rate of undetermined manner of death (31.3), followed by Native Americans (28.9) and whites (15.8).
• Native Americans (all ages combined) had the highest rate of undetermined manner of death (6.3).
• The rate of undetermined manner of death among Native American males (7.3) was two times higher than among white males (3.7) and 1.4 times higher than among black males (5.4) (Figure 18).
• The rate of undetermined manner of death among non-Hispanics was 1.9 times higher than among Hispanics (3.9 and 2.1, respectively).
• In 78% (227/291) of undetermined manner deaths among infants, co-sleeping with adults or other children and/or overlay or possible overlay was described in the cause of death text of the death certificate or medical examiner’s narrative.
Table 17. Undetermined Manner of Death by Year, Oklahoma, 2004-2010
Year Number Rate 2004 152 4.3 2005 152 4.3 2006 134 3.7 2007 142 3.9 2008 147 4.0 2009 128 3.4 2010 117 3.1
Figure 17. Age and Gender Specific Rates of Undetermined Manner of Death,* Oklahoma, 2004-2010
20.8
0.22.1 3.4
4.7 5.63.9
1.8 3 2.3
15.1
0.4 1.32.6
3.3 4.7 3.51.2 1.1
2.1
0
5
10
15
20
25
0-4 5-14 15-24 25-34 35-44 45-54 55-64 65-74 75-84 85+
Age Group
Male Female
Rate per 100,000 population
*Includes 972 persons. Age unknown for one person.
Figure 18. Gender, Race, and Ethnicity Specific Rates of Undetermined Manner of Death, Oklahoma, 2004-2010
Rate per 100,000 population
27

• Among persons 15 years of age and older, actual or possible drug or alcohol toxicity (32%), or drug combination toxicity (20%), was described in the cause of death text of the death certificate or the medical examiner’s narrative.
• Other methods/weapons involved in these deaths were firearms (24), fire/burn (21), falls (14), drowning (13), blunt instrument (13), motor vehicle (11), hanging/strangulation (5), and other methods (20).
• For 479 (75%) persons 15 years of age and older, circumstances surrounding the death were documented in police and/or medical examiner’s reports.
• The three most common circumstances surrounding undetermined manner deaths among persons 15 years of age and older were physical health problems (27% among males and 41% among females), substance abuse problems (31% among males and 32% among females), and current mental health problems (21% among males and 38% among females) (Table 18 and Table 19).
• Among persons with a mental health problem, diagnoses included depression (94), bipolar disorder (35), schizophrenia (24), anxiety disorder (16), and other or unspecified conditions (39).
• In 12% of deaths, the person had previously stated their intent to commit suicide or expressed suicidal ideation to another person and 2% of persons had left a suicide note.
• Positive blood alcohol tests were documented for 126 persons over the age of 14 (26% of persons tested), and positive drug tests were documented for 373 persons over the age of 14 (80% of persons tested).
• Forty-five counties had undetermined manner of death rates higher than or equal to the state rate, and 26 counties had rates below the state rate. Six counties reported no undetermined manner deaths (Figure 18).
Table 18. Leading Circumstances Associated with Undetermined Manner of Death Among Persons 15 Years of Age and Older by Rank and Gender, Oklahoma, 2004-2010*
Rank Males Females Both Genders
1 Substance abuse problem (31%)
Physical health problem (41%)
Physical health problem (33%)
2 Physical health problem (27%)
Current mental health problem (38%)
Substance abuse problem (31%)
3 Current mental health problem (21%)
Substance Abuse Problem (32%)
Current mental health problem (28%)
4 Alcohol problem (18%)
Current depressed mood (15%)
Current depressed mood (15%)
5 Current Depressed Mood (15%)
History of suicide attempt (13%)
Alcohol problem (14%)
6 Intimate partner problem (11%)
Intimate Partner Problem (10%)
History of suicide attempt (11%)
7 History of suicide attempt (9%)
Alcohol Problem (9%)
Intimate Partner Problem (10%)
*More than one circumstance may have been associated with the death. Percentages were calculated using the number of persons 15 years and older for whom the manner of death was undetermined: 202 males and 171 females.
28

Table 19. Selected Undetermined Intent Death Circumstances among Persons 15 Years of Age and Older by Gender, Oklahoma, 2004-2010. Total (n=641) Male (n=360) Female (n=281) Percent Percent Percent Physical health problem 33 27 41 Substance abuse 31 31 32 Mental health problem 28 21 38 Depression/Dysthymia 14 11 19 Bipolar disorder 5 2 10 Schizophrenia 4 3 5 Anxiety disorder 2 1 4 Post-traumatic stress disorder 1 1 0 ADD or hyperactivity disorder <1 0 <1 Other/unknown 5 5 6 Current depressed mood 15 15 15 Alcohol 14 18 9 Disclosed intent to commit suicide 12 11 13 History of previous suicide attempts 11 9 13 Intimate partner problem 10 11 10 Crisis in past two weeks 4 4 4 Other death of friend or family 4 2 6 Other relationship problem 3 3 4 Recent criminal legal problem 3 6 <1 Job problem 2 3 1 Financial problem 2 3 2 Left a suicide note 2 1 3 Victim of interpersonal violence within past month 1 0 1 Non-criminal legal problem 1 1 1 * More than one circumstance may have been associated with the death. Percentages were calculated using the number of undetermined manner of deaths: 641 overall, 360 for male and 281 for female.
29

Jeffe
rson
Figu
re 1
9. U
ndet
erm
ined
Dea
th R
ates
by
Cou
nty
of R
esid
ence
, Okl
ahom
a, 2
004-
2010
Cima
rron
Texa
sBe
aver
Harp
er
Ellis
Roge
r Mills
Dewe
y
Was
hita
Gran
tKa
y
Noble
Payn
e
Loga
n
Oklah
oma
Clev
eland
Grad
y
Pawn
ee
Cree
k
Linco
ln
McCl
ain
Jack
son
Tillm
an
Coma
nche
Cotto
nAt
oka
Brya
n
Push
matah
a
Choc
taw
Latim
er
Sequ
oyah
Tulsa
Wag
oner
Cher
okee
Adair
Ottaw
a
Was
hingt
on
Craig
Maye
s
Harm
on
Delaw
are
Semi
nole
Potta
-wa
tomie
50+%
Abo
ve S
tate
Rat
e25
-49%
Abo
ve S
tate
Rat
e1-
24%
Abo
ve S
tate
Rat
eA
t or B
elow
Sta
te R
ate
No
Dea
ths
Ponto
toc
Coal
Osag
e
Roge
rs
Okmu
lgee
Gree
rKi
owa
Beck
ham
LeFlo
re
McCu
rtain
John
ston
Major Bla
ine
Woo
dwar
d
Woo
dsAlf
alfa
Custe
r
Cadd
o
Garfie
ld
King
fishe
r
Cana
dian
McInt
osh
Hugh
es
Okfus
kee
Musk
ogee
Pitts
burg
Hask
ell
Carte
r
Love
Murra
y
Marsh
all
Garvi
n
Step
hens
Nowa
ta
30
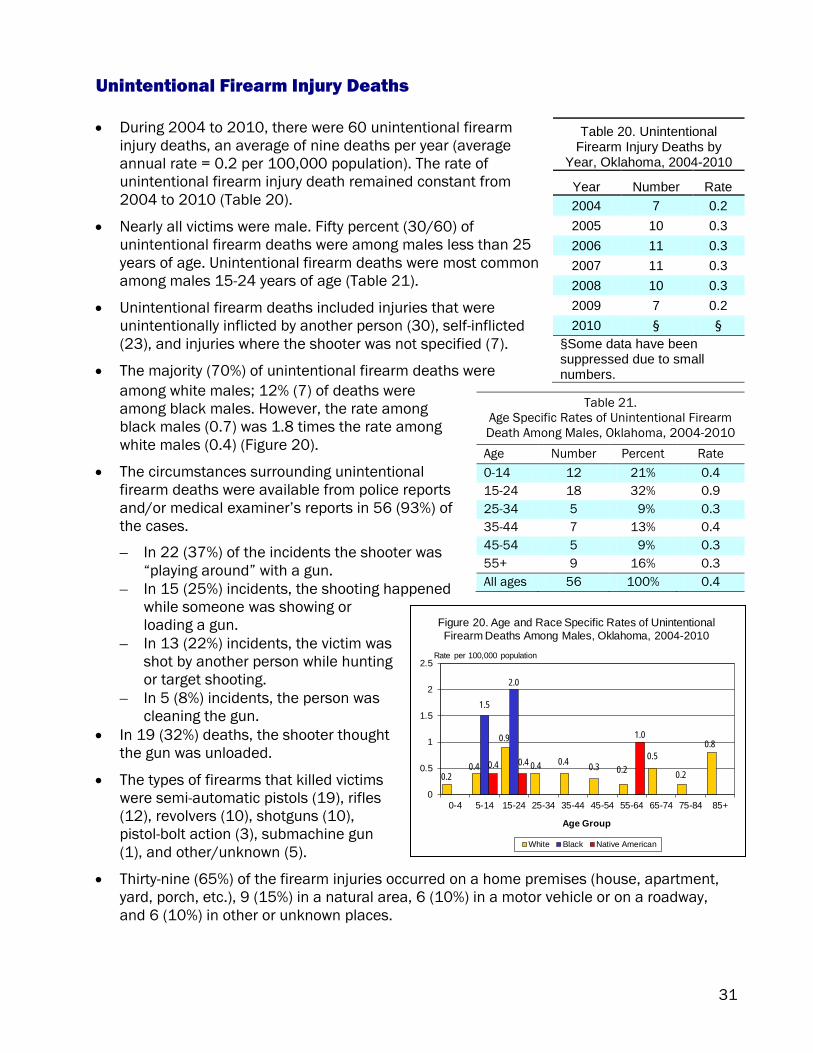
Unintentional Firearm Injury Deaths • During 2004 to 2010, there were 60 unintentional firearm
injury deaths, an average of nine deaths per year (average annual rate = 0.2 per 100,000 population). The rate of unintentional firearm injury death remained constant from 2004 to 2010 (Table 20).
• Nearly all victims were male. Fifty percent (30/60) of unintentional firearm deaths were among males less than 25 years of age. Unintentional firearm deaths were most common among males 15-24 years of age (Table 21).
• Unintentional firearm deaths included injuries that were unintentionally inflicted by another person (30), self-inflicted (23), and injuries where the shooter was not specified (7).
• The majority (70%) of unintentional firearm deaths were among white males; 12% (7) of deaths were among black males. However, the rate among black males (0.7) was 1.8 times the rate among white males (0.4) (Figure 20).
• The circumstances surrounding unintentional firearm deaths were available from police reports and/or medical examiner’s reports in 56 (93%) of the cases.
– In 22 (37%) of the incidents the shooter was “playing around” with a gun.
– In 15 (25%) incidents, the shooting happened while someone was showing or loading a gun.
– In 13 (22%) incidents, the victim was shot by another person while hunting or target shooting.
– In 5 (8%) incidents, the person was cleaning the gun.
• In 19 (32%) deaths, the shooter thought the gun was unloaded.
• The types of firearms that killed victims were semi-automatic pistols (19), rifles (12), revolvers (10), shotguns (10), pistol-bolt action (3), submachine gun (1), and other/unknown (5).
• Thirty-nine (65%) of the firearm injuries occurred on a home premises (house, apartment, yard, porch, etc.), 9 (15%) in a natural area, 6 (10%) in a motor vehicle or on a roadway, and 6 (10%) in other or unknown places.
Table 20. Unintentional Firearm Injury Deaths by
Year, Oklahoma, 2004-2010
Year Number Rate 2004 7 0.2 2005 10 0.3 2006 11 0.3 2007 11 0.3 2008 10 0.3 2009 7 0.2 2010 § §
§Some data have been suppressed due to small numbers.
Table 21. Age Specific Rates of Unintentional Firearm Death Among Males, Oklahoma, 2004-2010 Age Number Percent Rate 0-14 12 21% 0.4 15-24 18 32% 0.9 25-34 5 9% 0.3 35-44 7 13% 0.4 45-54 5 9% 0.3 55+ 9 16% 0.3 All ages 56 100% 0.4
Figure 20. Age and Race Specific Rates of Unintentional Firearm Deaths Among Males, Oklahoma, 2004-2010
Rate per 100,000 population
0.20.4
0.9
0.4 0.4 0.3 0.20.5
0.2
0.8
1.5
2.0
0.4 0.4
1.0
0
0.5
1
1.5
2
2.5
0-4 5-14 15-24 25-34 35-44 45-54 55-64 65-74 75-84 85+
Age Group
White Black Native American
31

Legal Intervention Deaths • During 2004 to 2010, 80 deaths, an average of 11 deaths
per year (0.3 per 100,000 population) resulted from legal intervention (i.e., person killed by law enforcement officers in the line of duty).
• The mean age of victims was 34 years. • Ninety-three percent of legal intervention victims were male
and 7% were female. The rate of legal intervention deaths among males was 12 times higher than the rate for females (0.6 and 0.05, respectively).
• Legal intervention death rates were highest among persons 15-34 years of age (Figure 21). Sixty-three percent of all legal intervention deaths were among persons in this age group.
• Fifty-nine percent of victims were white, 20% were black, 15% were Native American, and 7% were other/unknown races. The rate of legal intervention death was highest among black males (1.4) (Figure 22).
• The rate among Hispanic males (0.8) was 1.3 times higher than the rate among non-Hispanic males (0.6).
• Black males 25-34 years of age had the highest rate of legal intervention death at 5.3 per 100,000 population.
• There were five legal intervention deaths among white females. There were no legal intervention deaths among Native American or Asian females.
• Criminal activity was associated with 56 (70%) legal intervention deaths. – The types of crimes included assaults,
robbery, motor vehicle theft, burglary, drug trade, rape, and arson. In 61% of these cases the crime was in progress at the time of the shooting.
• In incidents where a crime was not involved, circumstances included drug involvement, arguments or conflict between intimate partners, arguments, a physical fight or brawl, gang involvement, and jealousy.
• Toxicological tests were conducted in almost all cases. Thirty-eight percent (30/78) of persons tested positive for alcohol and/or drugs.
• In all but seven of the deaths, a firearm was used to kill the victim. Victims also died from sharp instruments, blunt instruments, personal weapons, killed by a motor vehicle, and other weapon.
Table 22. Legal Intervention by Year, Oklahoma, 2004-2010
Year Number Rate per 100,000
population 2004 16 0.5 2005 13 0.4 2006 7 0.2 2007 14 0.4 2008 12 0.3 2009 6 0.2 2010 12 0.3
Figure 21. Age and Gender Specific Rates of Legal Intervention Deaths, Oklahoma, 2004-2010
0.9
1.8
0.8
0.40.2
0.40.1 0.1 0.2
0
0.5
1
1.5
2
2.5
15-24 25-34 35-44 45-54 55-64 65-74
Age Group
Male Female
Rate per 100,000 population
Figure 22. Gender, Race, and Ethnicity Specific Rates of Legal Intervention Deaths, Oklahoma, 2004-2010
0.4
1
1.4
0.75
0.05 0.10
0.5
1
1.5
2
White Native American Black Hispanic Ethnicity
Race/Ethnicity
Male Female
Rate per 100,000 population
32

Violent Deaths of Children • In 2004 to 2010, there were 674 violent deaths of children
less than 18 years of age (average annual rate = 10.6 per 100,000 population under 18 years of age), an average of 96 deaths per year. The rate of child violent death decreased by 19% from 2004 to 2010 (Table 23).
• Sixty-five percent of victims were male and 35% were female.
• Forty-nine percent (328/674) of victims were infants less than one year of age and 51% of victims were 1-17 years of age (Figure 23).
• Undetermined manner of death accounted for the majority (51%) of deaths among children, followed by homicide (28%), suicide (17%), unintentional firearm deaths (4%), and legal intervention (<1%).
– Among infants less than one year of age, 89% (291/328) of deaths were of undetermined manner and 11% (37/328) were homicides.
– Among children 1-17 years of age, homicides accounted for 45% of deaths, followed by suicides (33%), undetermined manner deaths (14%), unintentional firearm deaths (8%), and legal interventions (1%).
• The rate of violent deaths among males less than 18 years of age (13.5) was 78% higher than the rate among females (7.6).
– The rate of undetermined manner death among males (6.1) was 30% higher than the rate among females (4.7).
– The homicide rate among males (3.9) was 1.9 times higher than the rate among females (2.1).
– The suicide rate among males (2.8) was 4 times higher than the suicide rate among females (0.7) (Figure 24).
• Fifty-six percent of child victims of violent death were white, 20% were black, 17% were Native American, 2% were mixed race, and 6% were other or unknown race. Eight percent of child victims were Hispanic (Figure 25).
Table 23. Annual Number of Child Violent Deaths,
Oklahoma, 2004-2010
Year Number Rate 2004 95 10.8 2005 92 10.3 2006 100 11.2 2007 106 11.8 2008 104 11.4 2009 95 10.3 2010 82 8.8
Figure 23. Age and Gender Distribution of Child Violent Deaths,* Oklahoma, 2004-2010
189
58 54
138139
27 36 33
0
50
100
150
200
250
Less than 1 1-4 5-14 15-17
Age
Male Female
*Includes 674 persons less than 18 years of age.
Number of Deaths
Figure 24. Child Violent Death Rates by Manner, Oklahoma, 2004-2010
6.1
2.8
0.1
4.7
2.1
0.70.1 0.10.7
3.9
0
2
4
6
8
10
UndeterminedManner
Homicide Suicide UnintentionalFirearm
LegalIntervention
Manner
Male Female
*Rates were calculated per 100,000 population less than 18 years of age.
Rate per 100,000 population*
33

• Eighteen children 15-17 years of agetested positive for alcohol; 21 testedpositive for drugs.
• Among children 1-17 years of age,firearms were the most commonweapon/method used to kill (46% ofdeaths). Other methods used to killincluded hanging/strangulation (17%of deaths), sharp/blunt instruments(7%), poisoning (6%), fire (2%),personal weapons (3%), andother/unknown methods (19%).
• Among children 1-17 years of age,the types of weapons/methods usedto kill differed by gender (Figure 26).
• Males were more likely to be killed by firearms than were females (55% and 23%).
Figure 25. Gender, Race, and Ethnic Distribution of Violent Deaths Among Persons Less than 18 Years of Age,*
Oklahoma, 2004-2010
*Includes 674 persons less than 18 years of age. For 52 children race was mixed (14), other (32), or unknown (6).
Figure 26. Method/Weapons Used in Violent Deaths of Children Ages 1 - 17 Years by Gender, Oklahoma, 2004-2010
Firearm55%
Personal Weapons
4%
Hanging/ Strangulation
15%
Poisoning3%
Sharp/Blunt Instrument
7%
Other/ Unspecified
16%
Males
Firearm23%
Fire/Burn6%
Hanging/ Strangulation
22%Poisoning
12%
Sharp/Blunt Instrument
8%
Other/ Unspecified
29%
Females
34