viral v. acharya, john biggs, matthew richardson and stephen ryan
TRANSCRIPT

On the Financial Regulation of Insurance Companies
Viral V. Acharya, John Biggs, Matthew Richardson and Stephen Ryan1
NYU Stern School of Business August 2009
1 Viral Acharya is a professor of finance at the NYU Stern School of Business and London Business School; John Biggs is an executive‐in‐residence at the NYU Stern School of Business and former Chairman and Chief Executive Officer of TIAA‐CREF; Matthew Richardson is the Charles E. Simon Professor of Applied Financial Economics at the NYU Stern School of Business; and Stephen Ryan is a professor of accounting at the NYU Stern School of Business.

Executive Summary
The insurance sector, notably the monoline insurers and A.I.G., played a crucial role
during the boom of 2004-2007 by guaranteeing a variety of credit risks using both insurance policies and significantly substitutable credit derivatives. These guarantees yielded huge losses and liquidity requirements for these insurers when the guaranteed assets declined in value. The large losses recorded by and diminished solvency or even failure of insurers contributed significantly to the severity of the financial crisis and the need for governmental support. In fact, A.I.G. remains under government receivership, and several other large life insurers have received significant capital infusions from the government. Given these facts, it is surprising that regulatory reform plans have not focused to any significant extent on the insurance sector.
This paper presents a discussion of the key issues facing the financial regulation of
insurance companies in the post-crisis era. While the moral hazard created in the financial sector by provision of financial guarantee insurance is difficult to overstate, we focus on the issues concerning insurers’ excessive provision of insurance, under-capitalization, and related systemic risks. We argue that these systemic risks stem from a too-interconnected-to-fail problem, manifested most perversely in the case of A.I.G. We provide a way to measure the systemic risk contributions of insurers based on market data and calculate this measure (called Marginal Expected Shortfall or MES) for insurers in the United States during the period 2004-2007. We show that several insurers ranked highly on this measure compared to systemically risky banks over this period.
We examine possible reasons for the emergence of insurers’ too-interconnected-to-fail
problem. Under the current regulatory structure, when an insurer operating in a state defaults, state guarantee funds insure losses to the policyholders by charging premiums to other insurers operating in the state. Because these premiums are imposed after the fact and are not based on insurers’ risks, they provide no incentives for insurers to avoid systemic risks. Moreover, the absence of a federal regulator that can assess the systemic risk of insurers operating across states, charge them upfront premiums for their systemic risk contributions, and suitably manage their resolution in case of default is a significant problem. We propose therefore a federal insurance regulator and discuss its appropriate powers and relationship to federal banking regulator. We compare existing Treasury Department proposals to our recommendations and identify several areas for improvement.

Specific Proposals
1. A national insurance regulator for financial institutions with a significant presence in the insurance industry. This regulator would develop deep expertise in insurance and in the institutions which have a focus on insurance. Most important, the regulator would have equal status with existing regulators in the commercial banking, securities and asset management industries.
2. A dedicated regulator for those financial institutions viewed as imposing systemic risk exposure to the financial system. While this regulator would cover all functional areas of the financial system (commercial banking, securities, asset management and insurance), a primary focus would be to understand the consequences and interconnectedness of all the activities of these institutions that could lead to systemic risk.
3. We argue that a case can be made that some institutions generally considered to be insurance companies are contributors to systemic risk. These companies need to internalize the costs they impose externally on the financial system. These costs may take the form of an insurance cost or premium, or enhanced regulation such as increased capital requirements. The idea is that if insurance companies choose to still create systemic risk, then they will have to pay for the implicit guarantee of being too-interconnected-to-fail.
4. With respect to specific regulation of insurance companies related to systemic risk: a. Insurance companies should not be able to offer "insurance"/protection against
macroeconomic events that yield systemic risk unless the insurance is fully capitalized. This would cover CDS on AAA-tranche CDOs, insurance against a nuclear attack, the systematic portion of insurance on municipal bonds, and so forth.
b. A reworking of the accounting system for insurance companies to better aid the regulator and investors:
i. The accounting for insurance policies should be made more/reasonably consistent with the accounting for substitutable risk-transferring financial instruments, such as derivatives. Fair value accounting, the usual accounting approach for these other financial instruments, is the best way to do this, but a not-too-distant alternative such as fulfillment value accounting may be adequate.
ii. The income smoothing mechanisms in statutory accounting principles (SAP) should be eliminated.
iii. Better financial report disclosures are needed for insurance policies that are written put options on macroeconomic variables. These disclosures should clearly indicate concentrations of risk, how historical data is used to value the positions, and other important estimation assumptions.

I. Introduction
The social welfare created by insurance2 is unquestionable. Insurers can pool and
diversify large idiosyncratic risks that have potentially catastrophic consequences for individuals and businesses. In competitive markets, insurance is priced on an actuarial basis, leaving tremendous utility gains to the previously exposed individuals and businesses.
The breadth of the role of insurance in the global economy is therefore not surprising. For
example, in the United States premiums paid by families and companies each year for financial security and for business risk reduction are a significant proportion of GDP. According to the National Association of Insurance Commissioners, in 2008, Life and Health insurers collected $788 billion in premiums (although a significant portion of this reflects investment rather than insurance), while Property Casualty companies received $495 billion, for a total of $1.28 trillion or 9.0% of 2008’s nominal GDP of $14.29 trillion.3 Table 1 summarizes this information.
The last year has led to considerable analysis of the regulation of the core institutions of
the global financial system, especially the commercial banks, investment banks, and brokers. In the United States the regulators of these institutions include the Federal Reserve, the CFTC, the SEC and the Office of the Comptroller of the Currency. Given that the financial crisis has revealed several crucial weaknesses in the regulation of insurance entities, it is surprising that their regulation has been largely omitted from this discussion. Yet as mentioned above, American insurers are a fundamental part of the financial structure, played a significant role in the breakdown of the structure, and as the ultimate “risk-management agents” in the economy have significant potential to restore strength to the currently broken structure.
It is commonly agreed in economics that there is an important role for public sector
involvement and regulation even in a competitive insurance industry. Insurance markets are exposed to the two fundamental problems of asymmetric information: adverse selection and moral hazard.4 Adverse selection arises because those seeking insurance are more likely to suffer
2 We do not attempt the inevitably arbitrary task of defining insurance policies as distinct from other, potentially substitutable, financial instruments used for risk management. We note, however, that any restricted definition of insurance policies can yield a high degree of substitutability between insurance policies and these other financial instruments. This is particularly true for financial guarantees, where the insurance products offered by insurers compete with credit derivatives and other products offered by other financial institutions. It is also true for investment‐oriented life insurance, which competes with bank accounts and mutual funds, among other investment products. As discussed in Section VI, problems arise for insurance regulation when the accounting for the substitutable products is inconsistent. 3 This high proportion of GDP is not unique to the United States. For example, in 2004, the percentages were 12.6%, 11.1% and 9.5% respectively in the UK, Japan and France. (See J. David Cummins and Bertrand Venard, “International Insurance Markets: Between Global Dynamics and Local Contingencies – An Introduction” in the Handbook of International Insurance, edited by J. David Cummins and Bertrand Venard, 2007, Springer.) 4 See, for example, the seminal papers by Kenneth J. Arrow, 1963, “Uncertainty and the Welfare Economics of Medical Care,” The American Economic Review, vol. 53 (5), pp. 941‐973; George A. Ackerlof, 1970, “The Market for lemons: Quality Uncertainty and the Market Mechanism,” The Quarterly Journal of Economics, vol. 84 (3), pp. 488‐500; and Michael Rothschild and Joseph Stiglitz, 1976, “Equilibrium in Competitive Insurance Markets: An Essay on the Economics of Imperfect Information,” The Quarterly Journal of Economics, vol. 90 (4), pp. 630‐649.

losses, leading to a breakdown of the aforementioned pooling equilibrium. Moral hazard arises because the insured, when insulated from risk or the consequences of their actions, take on more risk than is socially optimal or otherwise act in a dysfunctional fashion. Much of insurance mechanism design and government regulation deals with these problems.
In fact, it is hard to overstate the effects of that adverse selection and moral hazard
associated with insurance played during the financial crisis. Academics, policymakers and regulators have focused on excessive risk taking by banks, partly due to the existence of moral hazard via government guarantees and its too-big-to-fail policy. But the guarantees of credit risk provided by the monolines and A.I.G. also created a moral hazard problem.5 In particular, purchasing guarantees from the monoline insurers and A.I.G. was one of the major routes that commercial and investment banks took to avoid regulatory capital requirements, a primary factor in the crisis.6 Put simply, banks obtainedcapital relief if they purchased a credit guarantee to hedge a risk, in part because there was no capital charge associated with the counterparty risk of the insurer. The freed-up capital allowed banks to take on further risks.
When credit losses began to appear on banks’ balance sheets leading up to and during the
financial crisis, banks became increasingly undercapitalized and unable to survive without government backing. As these credit losses materialized, insurers had to honor the guarantees they had written on these assets (or at least these guarantees became more “in the money”). It became clear over time that the affected insurers had also become under-capitalized, thereby endangering the quality of outstanding guarantees. As an illustration of this credit risk transfer from banks to insurance companies, Figure 1 graphs the credit default swap spreads for the largest monoline insurers – AMBAC, MBIA, MGIC and Radian – as well as A.I.G. As depicted in this figure, the credit spreads of these institutions suggested a high likelihood of default as the crisis emerged. In the case of the monolines, this likelihood rose steadily from the inception of the crisis in summer 2007 and then surged in June 2008; in the case of A.I.G. this likelihood jumped in September 2008.
Further, the likelihood of default of a number of insurance companies helped propagate the crisis. If the failure of a large or interconnected financial institution leads to the possible failure of other financial institutions or the freezing of financial markets, then the financial
5 Monoline insurers refer to insurance companies that guarantee the payment of bond principal and interest when an issuer defaults. Since regulations generally prevent property/casualty and life insurance companies from offering financial guaranty insurance (but not somewhat substitutable surety insurance), monolines get their name from this being their sole form of insurance. Historically, these companies insured municipal bonds which were considered to face mostly idiosyncratic and therefore diversifiable risk. However, through time, the monoline insurance companies have expanded their business to insure structured products. 6 The typical description of the main cause of the crisis is that securitization without skin‐in‐the‐game led to the issuance of low quality loans (subprime, commercial and corporate) due to under‐collateralization and/or poor borrowers. Unsuspecting buyers of these securitized products in turn suffered significant investor losses. The fact of the matter is that securitization did not pass the credit risk onto capital investors. Rather, financial institutions ignored their own business model and held the risk by exploiting loopholes in capital regulatory requirements – through the creation of off‐balance sheet vehicles that housed these loans, the buying of protection via credit derivatives from monoline insurance companies and A.I.G., or the outright purchase of so‐called super senior tranche of loan portfolios. (See Viral V. Acharya and Matthew Richardson, ”Causes of the Financial Crisis,” Critical Review, 21(2‐3), 195‐210.

institution poses systemic risk. This risk imposes a negative externality on the system as a whole and would suggest a public sector role either via regulation or a systemic risk premium/tax.
As a brief summary, consider first the interconnectedness7 of A.I.G. and the monoline
insurers. By providing financial guaranty insurance, the failure of these insurance companies would immediately impact their counterparties and their creditworthiness as some portion of the insured risk would come back to their balance sheets. In fact, the bailout of A.I.G. and, in particular, the controversial full payout by the government of the required collateral to its counter-parties, some of whom were the much maligned financial institutions at the heart of the crisis, was a direct result of the systemic risk that would result from A.I.G.’s collapse. But it can be argued that the much smaller monolines also posed systemic risk. For example, in January 2008, the downgrading of Ambac Financial Group’s credit rating from AAA to AA due to its worsening balance sheet caused the immediate downgrade of thousands upon thousands of bonds of municipalities and institutions, causing havoc in financial markets.
Systemic problems don’t end, however, with the degree of interconnectedness of
financial institutions. Forced asset sales and bank-like runs due to institutional failure can also cause massive problems in the financial sector. Arguably the most critical entity in the financial crisis has been A.I.G., the largest and by far most complex insurance entity in the world, and unfortunately for U.S. taxpayers, a U.S. based and regulated company.8 Fannie Mae and Freddie Mac aside, A.I.G.’s failure is comparable in systemic damage to that caused by any of the large banking failures anywhere in the world. Deemed too-interconnected-to-fail (TITF), A.I.G. was prevented from failing only through a massive federal infusion of funds. The federal government now has control of the company, after commiting over $170 billion.
It is now well-known that the holding company of A.I.G. had an unregulated
noninsurance entity, A.I.G. Capital Markets (AIGCM). AIGCM took on extraordinary risks involving credit derivatives tied to asset-backed subprime and other positions that were a primary cause of A.I.G.’s collapse. The company also had severe problems with aggressive investment of collateral funds for its securities lending business, which also led to a need for federal government support. These funds were subject to state regulation. However the basic insurance entities, subject to state regulation, are still sound and have investment grade ratings from the insurance rating agencies.
While A.I.G.’s interconnectedness to the financial sector was unique among large multiline insurance company, federal capital infusions were also required for several large life insurers: Prudential, Principal Life, Hartford, and Lincoln, among some other smaller companies. (Metropolitan Life, the biggest life insurer in terms of assets, withdrew its filing for a capital infusion but was close to requiring one.) These capital infusions were needed primarily because
7 A.I.G. may have been too big as well as too interconnected to fail. We focus on its interconnectedness rather than its size for two reasons. First, the government’s primary (though by no means only) concern with A.I.G. appears to have been the solvency of its commercial and investment bank counterparties, not of A.I.G. itself. Second, and of more general importance, smaller insurers than A.I.G. that provide significant amounts of financial guarantees to banks and other financial institutions, notably the monolines, also tend to be too interconnected to fail. 8 The appendix of the paper describes in detail the A.I.G. case.

of the minimum guarantees and other contract features of these insurers’ investment-oriented life insurance policies, as well as due to related declines in their asset-under-management based fee revenue. The scale of their problems would have overwhelmed the State Guaranty Funds, and the problems themselves were not structurally part of the State Guaranty mandate. No thought has been given to a role for these funds in the crisis. No insurance regulatory entity analogous to the FDIC existed that could anticipate insurer failure and act immediately, although the NAIC had set up several mechanisms along these lines.
Thus, the financial crisis of 2007 to 2009 has made it clear that important agency
problems affected insurance providers too, and not just the policyholders emphasized in the economics literature on insurance. This fact leads to many questions relevant to insurance regulation, such as: Were cheaper insurance contracts offered by worse-capitalized insurance providers? Once insurance providers sold contracts and collected premia, did they exploit their limited liability and increase their default risk (e.g., through excessive growth and undercapitalization), diminishing the value of existing contracts? Did the insurance sector become too large, yielding systemic problems in the event of a macroeconomic crisis? These questions point to significant agency problems relating to the behavior of insurance providers, as well as to deficiencies in their regulation. We discuss these issues and propose a possible blueprint for reform of the insurance sector regulation going forward.
The paper is organized as follows. Section II describes current regulation of the insurance
industry in the United States. Section III discusses systemic risk of the financial sector and in particular how it relates to insurance companies. A subsection analyzes the issue of State Guaranty Funds. Section IV argues for the need for a federal insurance regulator in the United States. Section V presents an analysis of the current proposals at the federal level. Section VI discusses insurance accounting issues raised by the financial crisis, problems in existing insurance accounting relevant to insurance regulation, and current proposals to rewrite insurance accounting essentially from scratch. Section VII concludes. An appendix provides a description of circumstances relating to A.I.G. and its immense systemic risk contributions as a classic case study of things gone awry with an insurance provider.
II. Current Structure and Regulation of the U.S. Insurance Industry There are two broad types of insurance―life and health and property-casualty―that
exhibit substantial differences in how insurers are operated and regulated.
Life and Health Insurers (hereafter called Life Companies) provide benefits related to human life contingencies: life insurance to protect against unexpected death; annuities providing “longevity insurance” against living longer than expected, and health insurance for coverage of health expenses such as basic medical care, disability and long-term-care. Many types of life insurance, notably variable annuities, include substantial investment aspects. Personal lines of business involve individual policyholders. There are also employer-provided and other commercial types of insurance such as group insurance. As seen from Table 1, in 2008 life insurance accounted for 19.5% of premiums, annuity considerations for 33.5% and the remainder, including health, for 47%. Table 2 shows the top 25 Life companies by premiums. Of

some note, this top 25 captures almost three-quarters of the industry total, and just three companies – Met Life, A.I.G. and Prudential – capture almost 23%. It takes eleven companies to cover 50% of all premiums in the Life business.
Property Casualty companies (hereafter called PC companies) cover a very wide and
mostly familiar set of risks, such as auto, fire and homeowners insurance. Other major lines of business include tort liability, flood, hurricane and earthquake, medical malpractice, workers’ compensation, officers and directors’ liability, marine coverage, and reinsurance. As seen from Table 1, in 2008 homeowners accounted for 13.2% of premiums, private passenger auto for 33.2%, commercial auto for 5.4%, worker’s compensation for 9.2%, other liability insurance for 10.6%, and the remainder, including catastrophe insurance, for 28%. Table 3 shows the top 25 PC companies by premiums. Of some note, this top 25 captures almost two-thirds of the industry total, and just three companies –State Farm, A.I.G. and Zurich Insurance – capture around 22%. Similar to Life companies, it takes eleven companies to cover 50% of all premiums in the PC business.
Unlike other financial regulation, most insurance regulation is carried out by the states since the 19th century. Several legal attempts were made to bring insurance regulation under the federal government as part of interstate commerce. A Supreme Court ruling in 1869 declared insurance to be subject to state regulation and in 1945 another challenge produced an opinion that it was a federal responsibility. Congress then passed the McCarron-Ferguson Act which deferred to the states for insurance regulation, but reserved the right to oversee, and to take greater responsibility, if deemed necessary.
Insurance regulation encompasses major activities. These include not just financial regulation, the subject of this paper, but also: the formation and licensing of companies, the affiliations and holding company considerations, the licensing of agents and brokers, product approval, marketing methods, disclosure requirements, on-site examinations, investment restrictions, and rehabilitation and liquidation of companies. Another important function of the states is to establish and manage the State Guarantee Funds, which provide after-the-fact assessments to pay policyholders of insolvent insurers. Every state has such funds, usually one for Life and another for Property companies. When a company fails, the state of domicile takes over and liquidates or rehabilitates the company. Policy owners in the state are guaranteed benefits up to a cap, and the cost of providing such benefits are assessed against other companies licensed in that state. The share of each company is based on various complex formulas. No ex ante premiums are paid and no pre-existing fund exists before assessment. With considerable variation among states, insurers are permitted to pay their assessments over time and frequently achieve credits against their state premium taxes, thereby ultimately shifting the cost to state taxpayers.
While the State Guarantee Funds have some similarities to the Federal Deposit Insurance Corporation which insures depositors of a commercial bank up to a threshold level, there are also important differences. First, the FDIC charges premiums ex ante (even though it provides a rebate when its overall reserves exceeds a target rate of insured deposits). The ex-ante premiums reduce the burden of collecting premiums ex post when failures take place, even though they

invariably still have to be collected when a systemic crisis materializes such as the Savings and Loans crisis or the crisis of 2007-09. Second, there is no function of taking “prompt corrective action” by state Guarantee Funds in the case of a failing company comparable to the authority of the FDIC. Prompt corrective action is valuable as it preserves asset/capital depletion much earlier than a complete failing of the company and this reduces liquidation costs to the FDIC.
Returning to the details of insurance regulation, each state has an Insurance department and a Commissioner of Insurance appointed usually by the Governor. 10 states have an elected Commissioner. An important institution for the effective performance of state regulation is the National Association of Insurance Commissioners (NAIC), which has developed model state laws on a number of topics and runs an investment bureau that rates investments for regulatory approval. The NAIC efforts have done much to reduce, but not eliminate, the obvious frictions that exist in the 50 states regulation of insurers who are primarily interstate operators.
The Federal government has intervened in insurance regulation in a number of ways. ERISA preempted state supervision in a number of areas regarding pensions, health and welfare plans when administered by an insurance company. The SEC has broad reach into the administration of variable products based on investment performance, as well as the financial reporting of shareholder owned companies. Also, when capacity of the insurance industry is challenged by large unexpected shocks, the industry has had to go to the Federal Government for help. For example the impact of the terrorist attacks on September 11, 2001 created havoc with property liability claims and expectations. The direct losses were $31.7 billion but the companies needed protection from a potential flood of liability suits. The Air Transportation Safety and System Stabilization Act resolved that crisis and it was followed by the Terrorism Risk Insurance Act (TRIA) which solved the availability of insurance problem, which had caused the property insurance market to seize up. In particular, TRIA instituted government reinsurance for qualifying losses from a terrorist attack wherein the government insurance would kick in when the industry’s aggregate losses reach a certain level. To be precise, the insurer pays all losses up to a deductible and pays coinsurance (15%) for losses above the deductible up to an aggregate event limit ($100 billion). Above the event limit, the government covers all losses at no charge.
There have been criticisms and doubts about the adequacy and high cost of the state system, especially from large national companies who see the 50 state requirements as a costly and awkward way to do business and would prefer a National Charter and regulation to meet the new competitive forces of the 21st Century. Nevertheless Congress has resisted any new arrangements except when faced with “force majeure” issues like terrorism and Katrina and similar one-off events. The states have vigorously defended their performance in regulation of local issues (consumer protection, complaints etc.) and point out the far fewer financial collapses among insurers compared to banks with their federal or state regulation.
The current financial crisis has opened up the debate again about the need for federal
regulation as it is clear that it will be difficult for the states to address issues related to systemic risk of the insurance industry. Part of the reason is simply mechanical – the state regulators may not have access to all information and thus will not be able to see the “big picture.” Other reasons may have to do with financial resources of state regulators, lack of any explicit measurement of systemic risk contributions of individual players and “tax” for such

contributions, and regulatory arbitrage (e.g., the firm can move its operations to other states to lessen the ability of the state regulator to impose costs on the institution).
The section below discusses in detail the degree of systemic risk produced by insurance
companies.
III. Are Some Insurance Companies Too-Interconnected-to-Fail?
Systemic risk can be broadly thought of as the failure of a significant part of the financial sector – one large institution or many smaller ones – leading to a reduction in credit availability that has the potential to adversely affect the real economy. Given the interconnectedness of the modern financial sector, and for the purposes of systemic regulation, one should think of a “financial firm” as not just the commercial bank taking deposits and making loans, but also include investment banks, money-market funds, mutual funds, insurance firms, and potentially even hedge funds and private equity funds.
Too-interconnected-to-fail companies can generally be defined as financial intermediaries engaged in the above activities, whose failure poses a systemic risk or “externality” to the financial system as a whole.9 This externality can come through multiple forms including an informationally contagious effect on other financial institutions, a depressing effect on asset prices and/or reduction in overall market liquidity.
More specifically, there are several types of systemic risk that can be generated from the
insurance sector.
The first is counterparty risk. If a financial institution is highly interconnected to many other financial institutions, then its failure can have a ripple effect throughout the system. For example, consider the over-the-counter derivatives market. The main reason for systemic risk in OTC markets is that bilaterally set collateral and margin requirements in OTC trading do not take account of the “counterparty risk externality” that each trade imposes on the rest of the system, allowing systemically important exposures to be built up without sufficient capital to mitigate associated risks.10 The prime example in the current crisis is A.I.G., which built up $450 billion of written credit default swap exposure on the so-called AAA-tranches of securitized products. These positions were built up with little or no capital support. Because all the trades were in the same direction and highly correlated, once the trades lost value, the cost of these trades and of A.I.G.’s failure were passed on throughout the financial system. The appendix discusses this issue in detail as it relates to A.I.G.
9 For a general analysis of the regulation of these companies, see Ingo Walter, Roy Smith and Anthony Saunders, “Enhanced Regulation of Large, Complex, Financial Institutions,” in Restoring Financial Stability: How to Repair a Failed System, edited by Viral V. Acharya and Matthew Richardson, 2009, John Wiley & Sons. 10 For the introduction and formal discussion of the concept of “counterparty risk externality,” see respectively, Viral V. Acharya and Robert Engle, “Derivative Traders Should All Be Transparent,” Wall Street Journal, 15 May 2009, and Viral V. Acharya and Alberto Bisin, 2009, “Centralized versus Over‐the‐counter Markets,” Working Paper, NYU‐Stern.

Another example was the rating downgrade of monoline insurers that took place in the first six months of 2008. Figure 1 shows a deterioration of credit quality of some of the major monoline insurers, starting with a jump in CDS spreads at the start of the crisis in July 2007, with a gradual increase in spreads through the first half of 2008, ending with a huge spike in June 2008. As the major rating agencies began to downgrade all the monoline insurers during 2008, the monolines’ guarantees lost their AAA-backing, and thousands of municipal bonds and structured products were downgraded. The downgrade of these bonds in turn caused financial institutions to increase capital requirements as the losses on the insured securities were forced back onto their balance sheets. Furthermore, institutions had to rebalance portfolios now that some of their underlying bonds were no longer AAA-rated, putting additional downward pressure on pricing.
While the current crisis showed weakness in the financial system, and yielded systemic outcomes in part due to insurance companies offering excessive and concentrated financial guaranty insurance, the interconnectedness of some insurance companies could manifest themselves in other ways. Specifically, similar to the benefits of financial derivatives for risk management in helping to reveal price information, the reinsurance business also serves many purposes. As the current crisis has only shown, however, an increasing network of relationships can be problematic, especially when they are bilateral in nature and lacking in adequate risk controls due to the opacity of bilateral markets. The reinsurance market increases the interconnectedness of the system exponentially and therefore might increase the systemic risk in the overall market. This would suggest possible solutions, for example, a centralized clearinghouse for standardized insurance products, along the lines being considered for the OTC derivatives market, and, at the very least, might call for a federal regulator to have access to all the contracts (e.g., through a national registry).
The above discussion also points to the second way systemic risk can enter the market, namely spillover risk that arises as one institution’s trouble triggers liquidity spirals, leading to depressed asset prices and a hostile funding environment, pulling others down and thus leading to further price drops and funding illiquidity, etc.11 Indeed, the probability of asset fire sales was one of the reasons the government intervened and put into conservatorship both Freddie Mae and Fannie Mac. Between them, the institutions held over $1.4 trillion of mortgage-backed securities, $250 billion of which were in the less liquid non-prime mortgage area.
Insurance companies, as one of the major holders of illiquid long-term securities, pose a similar threat to the system. For example, according to the National Association of Insurance Commissioners and American Council of Life Insurers, Life companies hold assets on the order of $5.1 trillion at the end of 2007. These assets were distributed across all areas of financial markets, 38% in corporate bonds, 33% in stocks, 11% in government bonds, 6% in commercial mortgages and 12% across a variety of assets. Furthermore, Life companies are the largest source of corporate bond financing, providing even further evidence of their overall importance to the financial system. Table 4 provides a list of the top 25 Life insurance companies by total assets as
11 See, for example, Markus Brunnermeier and Lasse Pedersen, 2008, “Market Liquidity and Funding Liquidity,” Review of Financial Studies, vol. 22 (6), pp. 2201‐2238.

of the end of 2007. Almost 24% of the assets are concentrated in just 3 names – Met Life, A.I.G. and Prudential – and the largest 25 Life Insurance companies cover 79% of all the assets.
Containment of this second type of systemic risk requires not just ex-post regulatory interventions (as they generate moral hazard) but also ex-ante measurement of systemic risk and some “tax” for systemic risk contributions, as we discuss in detail below.
The third type of systemic risk is that many financial institutions have fragile capital structures in that they hold assets with long duration or low liquidity but their liabilities are very short-term in nature. For example, the collapse of Lehman Brothers and the value of its short-term debt caused the largest money market fund, the Prime Reserve Fund, to “break the buck,” leading to a run on the entire system. Only the government’s 100% backstop reversed the slide. And, importantly, commercial banks too are subject to localized runs in the wholesale funding and inter-bank markets if they are perceived to have exposure to institutions experiencing large-scale runs. Many cite this issue for the near collapse of the financial system when Lehman Brothers failed in September 2008.
While the liability of insurance companies are not as subject to large-scale runs due to the stickiness of the majority of their funding (i.e., their premiums), it is not beyond the realm of possibility that there could be a run on insurance companies. Insurance companies are generally required to hold reserves to back its obligations to policyholders and their beneficiaries as they come due on an actuarial basis. However, cancellation or withdrawal penalties aside, a large number of insurance contracts (even long-term ones based on life insurance) can be “cashed-in” or simply closed and reopened elsewhere. This is true for both Life and PC companies albeit through different mechanisms.
If policyholders do not have adequate faith in State Guaranty Funds because they do not collect upfront premiums, then it is likely policyholders would move their policies elsewhere when insurers become less solvent. This is especially true given that many types of insurance are in effect commodities in a highly competitive industry. A run on a major insurance company would lead to the types of systemic problems mentioned above, and, with enough opacity in the system, could lead to runs on other similar insurance companies. This point, for example, was one of the primary reasons cited by A.I.G. for not letting them fail during the Fall of 2008. (See the A.I.G. case study in the Appendix and analysis of dimensions along which A.I.G. was systemic.)
The above description of the types of systemic risk suggests a need for regulation. By its very nature, systemic risk is a negative externality imposed by each financial firm on the system. While each individual firm is clearly motivated – or can be motivated by its stakeholders – to prevent its own collapse, each firm is unlikely to act to prevent a collapse of the system as a whole. So when a firm considers holding large amounts of illiquid securities (e.g., bespoke securitized contracts), or concentrates its risk into particular ones (e.g., subprime-based assets), or puts high amounts of leverage or holds little collateral or capital on its books (as a way to drive up excess returns), its incentive is to manage its own risk/return tradeoff and not take into account the spillover risk it imposes on other financial institutions.

A. Systemic Risk Measurement: An Example12
Can we quantify and measure the systemic risk of financial institutions? In this section, we argue that significant progress can be made even by relying exclusively on market information.
Specifically, we propose a measured called the Marginal Expected Shortfall (MES). Suppose that the economy incurs a systemic cost (a negative externality of the financial sector) whenever there is a "crisis,” measured as the return to the financial sector or overall economy being sufficiently bad, say in the 5% left tail of the market return distribution. Suppose further that the cost is proportional to the extent of loss incurred below the 5% cutoff. Then the contribution of each individual financial institution to this cost is proportional to its size, and to its MES, defined as the percentage loss or negative return it suffers when the market is in its left 5% tail. The "tax" to be imposed on each institution could thus be the average of this contribution, or in other words, its MES multiplied by its (dollar) weight in the economy and multiplied by the likelihood of the “crisis” (in our example, 5%). To summarize, MES of a financial institution can be interpreted as the per dollar systemic risk contribution of that institution when a systemic crisis materializes.
The idea behind MES is that one calculates the losses experienced by each firm when aggregate losses are large. The MES is the contribution of each firm to the aggregate losses. For the example to follow, we calculate the losses of the market value of equity of financial firms in the prior year’s 5% worst-case periods of aggregate stock market losses (measured on a daily basis). We focus on financial firms with at least $5 billion in market capitalization (as of June 2007), leaving us with 102 financial firms. Of these 102 financial firms, 36 are considered insurance companies based on their 2-digit SIC classification in CRSP-Compustat database.
Table 5 presents the dollar MES of these insurance companies as well as their MES as a % of their market value of equity. In addition, various accounting data are also provided. The leftmost column gives the within-insurance-sector systemic risk ranking by $MES5 whereas the rightmost column gives the ranking within the 102 US financial firms. The second panel shows the summary statistics for the entire insurance sector. The top five most systemic firms in order were A.I.G., Metlife, Prudential, Berkshire Hathaway and Unitedhealth, respectively achieving ranks of 10, 13, 17, 19 and 22, respectively amongst the 102 largest financial firms.
Table 6 presents the insurance companies which fall into the top 20 of the above list based on their dollar MES each year from June 2004 to June 2007, just prior to the crisis. Given over one-third of the top 100 financial firms are insurance companies, generally a smaller percentage show up in the top 20 most systemic list. For example, there are just 3 firms in 2004, 7 in 2005, 5 in 2006, and 4 in 2007. Of these firms, A.I.G. is always most systemic with rankings of 2, 2, 3 and 10 amongst all financial institutions over the years 2004 to 2007, respectively. But Prudential 12 The methodology proposed in this subsection and resulting calculations are based on chapter 13, “Regulating Systemic Risk” by Viral V. Acharya, Lasse Pedersen, Thomas Philippon and Matthew Richardson, in Restoring Financial Stability: How to Repair a Failed System, edited by Viral V. Acharya and Matthew Richardson, 2009, John Wiley & Sons.

Financial is ranked in 3 of the four years, and Berkshire Hathaway, Metropolitan Life and United Health are present half the time. In total, nine insurance companies show up as being among the top 20 systemic financial firms at some point over this four-year period.
To compare across different types of institutions, Figures 2a and 2b graph the MES across depository institutions, broker dealers, non-depository institutions and insurance companies over the period 1963 to 2009. To adjust for different sizes across these financial entities, we divide each dollar MES by the firm’s market capitalization to scale it the same as returns, and present findings for both value-weighted and equal-weighted averages of the MES return. Three observations are in order. First, while securities firms clearly have the highest MES amongst the different type of financial institutions, insurance companies do not stand out as being the least systemic. In fact, insurance companies are generally at least as systemic as depository institutions (commercial banks). Second, there are clear fluctuations in the degree of systemic risk through time, reaching its highest point during the current crisis but also spiking during periods in the 70’s, the market crash of ’87 and the LTCM crisis in 1998. Third, while recessions are clearly an important factor, it is neither a necessary nor a sufficient condition for systemic risk to be present.
As an additional comparison of insurance companies alone, Figures 3A-3D graphs the relation between the systemic risk measure, the MES as a percent of market value of equity, and various accounting characteristics of the insurance company, including assets, market equity capitalization, book equity to assets, and long term debt to assets. One implication of these figures is that leverage, irrespective of the way it is measured, has a negative impact on systemic risk.
B. Too Interconnected to Fail, Systemic Risk and the State Guarantee Funds
As discussed in Section II, the current way to deal with the potential failure of an insurance company in the United States is through state guarantee funds. These funds have been strengthened and extended in response to Federal threats to create federal charters, regulation or actual federal guarantee funds for insurance companies (as in the Dingell bills of 1992 and 1993.) They have coped with numerous insurance failures, mostly small companies in the property casualty business, and a few large ones in the life insurance category—Mutual Benefit in 1992, and, the largest, Executive Life, in the late 1980’s. The life Guarantee funds have disbursed over $6 billion between 1988 and 2007 to purchasers of contracts from failed companies.
Questions about the guarantee funds have existed since well before the current financial crisis. Clearly, the state funds misprice risk in not assessing upfront risk-based premiums. How serious is this economic distortion? A similar mispricing exists in large part for the federal FDIC and PBGC, although Congress has partially addressed the issue.
The practice of assessing the insurers in each state for the costs for that state’s insured institutions, and then granting premium tax credits for those assessments, moves much of the cost onto the states’ taxpayers. Is this the right way to finance such guarantees? Shouldn’t the

industry price its products to cover guarantee costs? The answer is undoubtedly yes, because otherwise insurance companies will not internalize the systemic costs they impose on markets. The fact that these systemic costs cut across state, and even international, lines makes it even more troubling that these types of risk would be handled at the state level.
The financial crisis of 2007-2009 raises other questions about the adequacy of the state guarantee funds. First off, they neither could nor did play any role in the A.I.G. collapse. In their defense, the losses of A.I.G. Capital Management were not losses the guarantee funds were designed to cover. However, as described in the appendix, A.I.G.’s $40 billion in insurance company losses, and the earlier security lending liquidity problems, could only be solved by a federal government response. (The maximum 1 year capacity of the Life Insurance Guarantee Fund is about $9 billion, way smaller than what would have been necessary to deal with A.I.G.). Furthermore, the major Life companies’ request for, and receipt of, TARP funds reduced the threat of failure of those companies, a role the state guarantee funds could not play.
As laid out above, many large insurance companies are now deemed to be too-interconnected-to-fail, or to represent systemic risks due to their connectedness to other financial and business organizations (especially in the property casualty business) and state-level regulation through guarantee funds is inadequate to deal with these risks. How then should the regulation of systemic risk in the insurance sector be designed?
C. Regulatory Approaches
To better understand the required regulation, it is useful to consider the market failures that took place during the crisis. As a first pass, consider the four principles laid out in the prologue chapter of the NYU Stern book project.13
1. Risk taking incentives at banks and financial institutions.
Were the problems of insurers influenced by inappropriate financial incentives? Did the lack, for instance, of stock award compensation lead several of the troubled companies to abandon their mutual organization form, in order to compete with the generous stock options prevalent during the nineties at stock companies? Note that there are no mutual companies applying or considering federal support funds.
The executive leadership of A.I.G. Capital Markets, for instance, was compensated on standards widely used in the investment banking world and not the more staid and conventional insurance community. Did those incentives lead to excessive risk taking? Was there a large differential in compensation systems within A.I.G. itself?
2. Mispriced guarantees awarded to the financial sector
13 See Viral V. Acharya, Thomas Philippon, Matthew Richardson and Nouriel Roubini, “A Bird’s Eye View – The Financial Crisis of 2007‐2009: Causes and Remedies” in Restoring Financial Stability: How to Repair a Failed System, edited by Viral V. Acharya and Matthew Richardson, 2009, John Wiley & Sons.
When companies become too interconnected to fail, they gain an implicit government guarantee of their business that others do not have. They pay nothing for this guarantee. Certainly the insurance companies that have applied for federal aid have been judged too interconnected to fail.
The state run Insurance Guarantee Funds totally disregard risk in their commitment to bail out any company that defaults on its obligations. No ex ante costs are involved in this guarantee, so that the defaulting insurer itself has not even paid into a fund for the purpose of insuring its risk.
3. Increasing opaqueness of the financial sector and resulting counterparty risk externality.
Do statutory accounting principles (SAP) required by the states obscure the true values in an insurance company’s balance sheet? As discussed in Section VI, SAP is considerably more conservative than GAAP, reducing book value for all insurers and net income for growing insurers. SAP also smoothes book value and income more than GAAP.
Are the 50 state insurance departments able to monitor and regulate risks related to complex products such as finite risk insurance, credit default swaps, and securities lending programs?
4. Focus of regulation on institution-level risk rather than on aggregate or systemic risk.
Do the 50 states have the capacity to monitor and regulate systemic risk?
Do they have or can they recruit professionals who can use tools like Marginal Expected Shortfall (MES), stress testing or macroeconomic scenario analysis? The primary tool used by the states has been the fundamental actuarial tool of expected value, with appropriate capital levels derived from it.
Finally, there is clearly a need for international cooperation. This seems particularly important as applied to insurers like A.I.G., AXA (the giant French institution that has significant insurance assets worldwide), SwissRe, and other companies with global reach. As discussed in the Appendix, A.I.G.’s impairment had the potential to damage foreign companies as well as U.S. ones. Yet the entire cost of the bail-out fell on the U. S. taxpayers.
IV. Optional Federal Regulation
The issues raised above suggest the need for federal regulation of the insurance sector. Proposals for optional (not mandatory) federal chartering for insurance companies have a significant history in the post McCarran-Ferguson Act period (see the discussion above in

Section II). The proposals have come in response to perceived failures of state regulation, and are usually followed with progressive effort by the states to mitigate the concern.
In the 1960’s, Senator Brooke of Massachusetts, with a number of co-sponsors in the Senate, sponsored an alternate Federal Charter bill, motivated primarily by the states’ continuing to assess premium taxes on annuity premiums. The additional 2% premium tax made it virtually impossible for insurers to compete against new non-insurance companies entering the pension business. TIAA-CREF was the principal company supporting the bill since the company engaged primarily in the pension annuity business. The rest of the insurance industry vigorously opposed the bill. Subsequently, the states imposing the taxes relented, removing the bill’s motivation.
In 1992 and 1993, Representative John Dingell introduced a bill entitled the Federal Insurance Solvency Act (HR1290 in 1993) in response to a spate of insurer insolvencies in the 1970’s and 1980’s, with the assumption that the federal government was ultimately liable for the industry losses. Since a Federal Insurance Guaranty ultimately requires full regulation of the companies, the insurance industry opposed the legislation and successfully blocked it. Once the threat was removed, the states responded with a strengthening and broadening of state guarantee funds.
During the several years of negotiation for the Gramm-Leach-Bliley bill prior to is passage in 1999, the insurance industry changed its position on having an optional federal charter, advocating a bill akin to the banking regulation framework of co-existing federal and state banks, and arguably offering the benefits of healthy “regulator competition.” This bill introduced in 2001, was rejected by Congress, which was dominated by an anti-regulation view that opposed creating another federal regulatory agency.
The argument’s pros and cons were discussed thoroughly in an AEI Conference in June 1999, with papers published the following year.14 The interests of the insurance industry and of supporters of the bill were, in brief summary:
1. The Balkanization of 50 state regulators was extremely inefficient. The extra costs of the regulators themselves, the costly compliance with the many variations in the fifty states and the related market related inefficiencies were explored. The first two costs were large but did not seem sufficient in themselves to dictate a major regulatory change. On the other hand, the market related inefficiencies were impossible to measure but loomed as very large as new non-insurance competitors entered the insurance business with the simplicity of a single regulator.
2. Optional chartering for companies would not eliminate the states’ role since only the large multi-state insurers were likely to opt for a federal charter. Advocates noted the benefits and successes of the dual regulation format in the banking
14 See Optional Federal Chartering and Regulation of Insurance Companies, edited by Peter J. Wallison,
2000, the AEI Press.

system, and the regulatory progress embodied in healthy “regulatory competition.”
3. Proponents expected the federal regulator would abandon many state features such as policy form approvals (substantial delays in coming to market occur when 50 states must approve a new product), rate setting (primarily in the property casualty business), and possibly the requirement to produce two complex and very different sets of financial statements, under GAAP for investors and under state-defined SAP for state safety-and-soundness regulation.
4. Another common concern was that no agency in the federal government had an in-depth knowledge of the insurance business. “In a time of economic difficulty or crisis, a federal insurance agency may be a critical player.” (Op.cit. C.F. Muckenfuss.)
Rebuttal from the state authorities related to the success in safety and soundness regulation of the state system, with its multitude of “50 eyes” on the companies, the progress made by the states and the NAIC on meeting industry concerns, and the local nature of consumer protection. Some academics also noted the fundamental theoretical proposition in public finance that regulatory functions are best implemented at the lowest level of government possible, in order to be closer to the people and firms affected.
These were the fundamental arguments made in 1999. Ten years later, we have significant new issues. Those expressed in 1999 have not gone away and some of the predictions of danger have come true with alarming force.
The A.I.G. case study presented in the Appendix illustrates a number of serious regulatory problems, some of which are being address currently in mid 2009 (e.g., bringing derivatives under the jurisdiction of the CFTC by reversing the 2000 statute exempting them from any form of regulation.). For instance, there would seem to be no plausible hope that the state guarantee system could have dealt with the magnitude of the A.I.G. collapse nor responded in the swift and dramatic way that the Federal Reserve did. There was no federal regulatory agency in existence that could have properly overseen the A.I.G. conglomeration of insurance businesses and complex financial entities like A.I.G. Financial Products and the largest airplane leasing business in the world. None had the technical staff—actuarial and legal—necessary to comprehend the company. Also the losses in A.I.G.’s insurance businesses were as large as those in A.I.G. Capital Markets and probably beyond the capacity of the New York and Pennsylvania State Guarantee Funds.
Systemic risks were words not often used in 1999 and were not a concern of the insurance industry nor their regulators. Section III.A above notwithstanding, how to measure systemic risk is still not fully understood, yet, in the case of A.I.G., the existence of systemic risks from its collapse could not be in doubt. Too-interconnected-to-fail was considered an issue for the major banks in 1999, but not for insurance entities. In fact, regulators were generally supportive of the wide-spread consolidation in insurance that was proceeding rapidly. Also, the need for major life insurance companies to seek, and get, “bail-out” protection from the federal TARP program suggests the federal government is responsible for insurance company failures,

but has no formal FDIC-like program in place, no regulatory authority, and no understanding of the insurance business.
Hence, we believe a federal regulator for the insurance sector, with strong expertise in insurance and in the institutions which have a focus on insurance, is natural. This regulator would most likely be in addition to a systemic risk regulator for those financial institutions viewed as imposing systemic risk exposure to the financial system which most likely would include some insurance companies.15 The creation of a national insurance regulator automatically will raise a host of other issues that the policy-makers would have to address:
1. Should the federal regulator identify important insurance firms and require them to be regulated by the federal charter, or should insurance firms be given a Federal Charter Option? Given the jurisdictional shopping risk, we prefer the first alternative.
2. Would the Federal Charter lead to a Federal FDIC like guarantee – with ex-ante premiums that are sensitive to systemic risk – for federally chartered insurers or perhaps to all insurers, replacing the state guarantee mechanism?
3. How would consumer protection issues be dealt with? Currently the Supreme Court is hearing testimony on a conflict between the national and state banks on exactly this issue.
4. What model of regulation would be adopted—“prescriptive” like the present state system where every new policy form must be approved, or “prudential,” more like the British FSA’s system of safety and soundness orientation?
5. And finally, a seemingly minor issue but a very controversial one, how should a new insurance regulator be set up in the federal world—should its systemic risk responsibilities simply be assigned to the Federal Reserve or the proposed Council of Regulators that will have systemic risk resolution authority, or should the new regulator be like the SEC as a separate agency with commissioners or like the Comptroller of Currency in the Treasury Department?
V. 2009 TREASURY PROPOSAL FOR INSURANCE REGULATION
The United States Treasury has made some progress on some of these issues. The 88-page Treasury Recommendations have a section proposing new federal regulatory requirements for insurance. The fundamental recommendations are two:
(1) Creation of an Office of National Insurance (ONI) within Treasury “to gather, information, develop expertise, negotiate international agreements and coordinate policy in the insurance sector.” The proposed ONI would have no direct regulatory role. ONI would “recommend to the Federal Reserve any insurance companies that the Office believes should be supervised as Tier 1 Financial Holding Companies.” (See below.)
15 For a discussion of what the regulatory structure would look like, see Ingo Walter, Roy Smith and Anthony Saunders, “Enhanced Regulation of Large, Complex, Financial Institutions,” in Restoring Financial Stability: How to Repair a Failed System, edited by Viral V. Acharya and Matthew Richardson, 2009, John Wiley & Sons.

The report also notes that the “current crisis highlighted the lack of expertise within the federal government regarding the insurance industry,” and also notes that although A.I.G.’s main problem were outside its traditional insurance business, significant losses arose inside its state-regulated insurance companies as well. (See A.I.G. case study provided in the Appendix).
Somewhat troublingly, the proposed Financial Services Oversight Council would “include the heads of the principal federal financial regulation,” but the ONI head was not included. There are 8 “heads” included, none of which have insurance expertise.
(2) The second major indirect proposal is the Tier 1 mechanism which brings strong federal regulatory authority over any holding company, whether banking (BHC) or financial (FHC), which has major systemic risk. This would presumably include “A.I.G.-like” entities. There is no reference in the report to the State Guarantee Funds. (See Section II and Section III.B for details on such funds.). Accordingly, there is an implicit federal guarantee and strong resolution authority for Tier 1 Insurance entities, but no apparent funding mechanism like the FDIC.
In terms of the proposal as it pertains to insurance companies, there are some significant omissions:
(i) There is no proposal for an option for a Federal Charter, although there is reference to increasing “national uniformity through either a federal charter or effective action by the states.” The report acknowledges that “our current insurance regulatory system is highly fragmented, inconsistent and inefficient.” And that “steps to increase uniformity have been insufficient.”
(ii) In another section of the Report, there is recommendation on improving GAAP accounting, particularly relating to fair value accounting. There is no reference however, to the 50-state SAP for insurance companies.
(iii) The proposal includes recommendations to strengthen holding company firewalls but only so as to protect depository institutions, not insurance entities.
(iv) The proposed Consumer Protection Agency does not have explicit authority for insurance products, but defers to state protections.
(v) There are several references to protecting against “A.I.G.-like” entities, but no significant means for regulation of them at federal level.
(vi) The report notes the European Union legislation that requires authority to operate in the Union countries is subject to “supervision in the company’s home country is comparable to supervision required in the EU.” The ONI would not meet their criteria, since it has no supervisory authority and the 50-state system is not at all comparable to the EU regulatory authority over the entire EU.
The report also states the need to “develop a modern regulatory framework for insurance” but makes no recommendations for developing it beyond the “information gathering and monitoring” of the ONI. Accordingly, the Federal Charter option and a comprehensive FDIC entity are not yet recommended.
VI. Insurance Accounting
The purpose of financial accounting is to provide information about a firm’s performance and prospects not just to investors but also to regulators. Given the lessons learned from the current crisis, and what we believe to be the need for a federal insurance regulator, is the current accounting system adequate for this purpose? This section discusses the crucial issues related to insurance accounting. As a preview, our main suggestions that are directly related to the insurance regulatory issues arising in the financial crisis are: 1) Despite the nontransferability of insurance policies, to mitigate incentives for contract structuring and to promote the usefulness and comparability of insurers' financial statements, the accounting for these policies should be made more/reasonably consistent with the accounting for substitutable risk-transferring financial instruments, such as derivatives. Fair value accounting, the usual accounting approach for these other financial instruments, is the best way to do this, but a not-too-distant alternative such as fulfillment value accounting may be adequate. This proposal is particularly important for financial guarantees, given their substitutability with credit derivatives and other credit risk transfer products, but it is also important for (contract features in) investment-oriented insurance policies. 2) Relatedly, to promote timely regulatory response to emerging solvency problems, SAP preferably should reflect fair value accounting or a not-too-untimely alternative such as fulfillment value accounting. At a minimum, the income smoothing mechanisms in SAP should be eliminated. 3) Better financial report disclosures are needed for insurance policies and other financial instruments that are written put options on macroeconomic variables, including financial guarantees tied to asset-backed securities and minimum guarantees in investment-oriented life insurance policies. These disclosures should clearly indicate concentrations of risk, how historical data is used to value the positions, and other important estimation assumptions. While less directly related to the financial crisis, two additional suggestions are: 1) Accounting for different types of insurance policies should be made more consistent. Again, fair value accounting is the best way to do this, but a not-too-distant alternative such as fulfillment value accounting may be adequate. 2) Accounting for insurance policies currently governed by FAS 60 (property-casualty and traditional life insurance) should not reflect the illusion that insurance policies are not financial instruments for which the time value of money and other critical economic factors are irrelevant.
A. The Accounting Implications of Differences between Insurance Policies and Other Financial Instruments
Insurance policies exhibit three characteristics that may imply these policies should be accounted for differently from other financial instruments. First, insurance policies generally are non-transferable by the insurer. For example, when an insurer reinsures an insurance policy, the insurer remains on the hook to the policyholder if the reinsurer defaults. This lack of transferability creates a sort of market illiquidity that makes exit value, the measure of fair value applied in the accounting for other financial instruments, a largely hypothetical notion even under normal market conditions. As discussed below, in ongoing projects the Financial Accounting Standards Board (FASB) and International Accounting Standards Board (IASB) are considering requiring insurance policies to be measured at an insurer-specific measure referred to as “fulfillment value,” rather than at exit value.
Second, the initial sale of insurance policies often involves large commissions and other
acquisition costs. Insurers are willing to bear large acquisition costs because many insurance policies renew with high probability, thereby yielding an internally developed intangible (i.e., non-contractual) asset. While GAAP for insurance in the U.S. require this intangible asset to be recognized (as “deferred acquisition costs”), the recognition of this asset is hard to reconcile with accounting concepts and practices outside of insurance, and as discussed below both the FASB and IASB propose to eliminate this asset. Relatedly, a high policy renewal probability implies that the “boundaries” of insurance policies differ economically and contractually.
Third, investment-oriented life insurance policies often contain minimum guarantees and
various other contract features that typically are inseparable from the host policy, cannot be obtained separately in insurance or other markets, exhibit significant joint value, and are marketed by insurers and purchased by policyholders as a package. While some of these contract features meet the accounting definition of a derivative, and so are required under FAS 133 to be bifurcated from the host policy and accounted for at fair value, for the reasons just listed such bifurcation is even more problematic for insurance policies than for other financial instruments. A simpler and perhaps more attractive alternative to bifurcating the embedded derivatives in an insurance policy would be to account for the entire policy at fair value or an alternative such as fulfillment value.
B. Accounting and its Role in Insurance Regulation Currently
In the U.S., capital requirements and other aspects of insurance regulation are based on SAP, not GAAP. The two accounting systems have jointly evolved over time and as a result overlap in many respects. For example, GAAP for property-casualty insurance and term and whole life insurance was based substantially on SAP, whereas SAP for investment-oriented life insurance and reinsurance was based substantially on GAAP. Compared to banks’ regulatory accounting principles, which are primarily based on GAAP with a limited number of deviations,16 SAP contains more numerous and significant deviations from GAAP.
16 Section 121 of the Federal Deposit Insurance Corporation Improvement Act of 1991 requires that the reports filed by insured depository institutions with bank regulators be “consistent with generally accepted accounting principles…[unless bank regulators determine that] the application of any generally accepted accounting principle to any insured depository institution is inconsistent with the objectives described in paragraph (1), [in which case

Where they differ, SAP generally is more conservative than GAAP, yielding lower
capital for all insurers and lower net income for growing insurers. The most important ways in which SAP is more conservative than GAAP are:
1. Policy acquisition costs are expensed immediately under SAP but capitalized and amortized under GAAP.
2. Insurance liabilities are calculated under SAP using statutory assumptions that generally are conservative.
3. An asset valuation reserve is recorded under SAP based on statutory assumptions that
generally are conservative.
4. Various illiquid assets are not admitted as assets under SAP. This conservatism reflects insurance regulators’ focus on insurers’ solvency and the fact that excessive growth by insurers can threaten their solvency.
The following aspects of SAP yield lower capital and income volatility than GAAP: 1. Unrealized gains and losses on available-for-sale securities are excluded from SAP
capital (as is the case for banks’ regulatory accounting principles). 2. Realized gains and losses arising from changes in the level of interest rates are
recorded in an interest maintenance reserve and amortized into interest income over time under SAP.
Why insurance regulators prefer less volatile net income than GAAP provides is unclear; perhaps it is to allow insurers some time to replenish their capital when investment losses occur.
SAP generally is consistent across states, because the National Association of Insurance Commissioners (NAIC) worked to codify SAP in its Accounting Practices and Procedures Manual.17 This manual first became effective in January 1, 2001, and is reissued annually. Although all states have accepted the manual for implementation, it does not override state laws and regulations, and so differences in the implementation of SAP across states remain. The biggest change in SAP brought about by the NAIC’s codification project was to recognize deferred taxes. Because most insurers have deferred tax assets, this change worked to increase their capital.
C. Problems with Current Insurance Accounting
they] may…prescribe an accounting principle…which is no less stringent than generally accepted accounting principles.” 17 National Association of Insurance Commissioners, Kansas City, MO.
Insurance GAAP is almost non-existent internationally. The IASB issued the minimalistic IFRS 4 in 2004 simply to satisfy the European Union Accounting Regulation requirement that European companies listed in a European securities market use IFRSs to prepare their consolidated financial statements starting in 2005. This standard provides few restrictions on insurers’ financial reporting.
In contrast, U.S. insurance GAAP is extensively specified but exhibits various significant
problems. Four of the more significant of these problems for insurance regulation are briefly described below.
1. Different Types of Insurance Policies Are Accounted for Inconsistently
U.S. GAAP requires very different accounting measurements, financial statement classifications, and footnote disclosures for each of the following broad types of policies or policy features: (1) short-duration property-casualty, accident and health, non-renewal term life, and group life policies governed by FAS 60; (2) long-duration renewable term life and whole life policies governed by FAS 60; (3) investment-oriented life insurance policies (universal life and annuities) governed by FAS 97; (4) financial guarantees governed by FAS 163; (5) embedded derivatives and other contract features in investment oriented life insurance policies governed by FAS 133 and SOP 03-1, respectively; (6) ceded reinsurance policies governed by FAS 113; and (7) assumed reinsurance policies governed by SOP 93-6 and SOP 98-7.
These different approaches make it difficult for regulators to understand the aggregate positions, performance, and risks of insurers offering diversified sets of policies. One of the attractive features of an insurance accounting model based on fair value or an alternative like fulfillment value it is would require insurers to account consistently for different types of insurance policies.
2. Financial Guarantees Accounted for as Insurance versus Other
Financial Instruments are Substitutable but Accounted for Inconsistently
Financial guarantees may or may not meet the accounting definition of an insurance policy. If financial guarantees are not insurance policies for accounting purposes, then they are either derivatives or loss contingencies. Under FAS 163, financial guarantees that meet the definition of an insurance policy yield gross recognized assets equal to expected future premiums discounted at the risk-free rate and gross recognized liabilities equal to expected future claim payments discounted at the risk-free rate under FAS 163. In contrast, financial guarantees that are deemed derivatives are measured at a net fair value amount under FAS 133. Gross presentation bulks up insurers’ balance sheets compared to net presentation, thereby reducing their capital ratios. While gross presentation highlights the expected payments that insurers have to make, it ignores the fact that in many cases insurers will not have to make any payments if policyholders cease paying premiums.

If financial guarantees are neither insurance contracts nor derivatives, they are loss contingencies that are measured initially at fair value under FIN 45 and subsequently at probable and reasonable estimable losses under FAS 5. This standard’s “probable and reasonably estimable” threshold for recognition often yields understated or even zero liabilities for financial guarantees.
3. The Time Value of Money is Accounted for Problematically and Inconsistently
FAS 60 accounting for short-duration insurance policies ignores the time value of money
altogether. FAS 60 accounting for long-duration traditional insurance policies incorporates the time value of money in measuring claim liabilities but classifies the economic interest on those liabilities as insurance expense, not interest. FAS 97 accounting for investment-oriented life insurance policies properly accounts for and classifies the time value of money.
This problematic and inconsistent treatment of the time value of money is difficult to
fathom given that the upfront receipt of premiums is a fundamental aspect of insurance.
4. FAS 60’s “Lock in” Assumption Ignores Changes in Expected Cash Flows
FAS 60 requires insurance liabilities for long-duration contracts to be based on original
assumptions unless actual experience is sufficiently unfavorable that the contract becomes unprofitable to the insurer (i.e., a “premium deficiency” exists). In this case, the original assumptions are “unlocked” and the liability is reestimated using new assumptions.
This requirement artificially smoothes insurers’ book value and net income in the absence
of an unlock, and yields artificially volatile book value and net income in the period of an unlock.
D. Proposed Changes in Insurance Accounting
The FASB and the IASB have joint but separate projects underway to develop new approaches for insurance accounting. All of their decisions to date are tentative and can be reversed or otherwise altered. Both standard setters have considered but jettisoned the idea that insurance policies should be measured at fair value defined as exit value, reflecting the aforementioned fact that insurance policies generally cannot be transferred by the insurer.
Instead, both standard setters are considering measuring insurance policies at fulfillment
value, an insurer-specific value that allows for no initial profit on policies. Initial profit is eliminated by discounting expected cash flows at the internal rate of return, which equals the appropriate economic discount rate plus (or perhaps minus) the abnormal profit margin expected at inception. Fulfillment value exhibits some of the attractive features of fair value—most

notably, the use of current expected rather than probable and reasonably estimable or “locked in” cash flows―but unlike exit value fulfillment value is unaffected by changes in market illiquidity or discount rates over time.
Both standard setters have decided to expense acquisition costs as incurred, and so do not
propose to use deferred acquisition costs to capture the aforementioned intangible asset created by the sale of insurance policies. (Conceivably this intangible asset could be captured through some other means the accounting standard setters have not yet specified.) The IASB proposes allowing a portion of the premium to be recorded as revenue to offset the expensing of acquisition costs, effectively treating this portion as compensation for acquisition costs. Under this proposal, income would not be reduced when insurance policies are sold. In contrast, the FASB has rejected the initial recognition of revenue, stating that revenue should be recognized when the insurer subsequently performs on the insurance policy.
E. Two Insurance Accounting Issues Raised by the Financial Crisis
1. Is it Possible to Define Insurance Policies in a Way That Clearly Distinguishes them from Substitutable Financial Products? Should Insurance Policies be Accounted for Differently from Other Financial Instruments?
Oddly, given its extensive nature, U.S. GAAP does not include an explicit definition of
an insurance policy. However, IFRS 4 contains such a definition along with guidance distinguishing insurance risk from (other types of) financial risk. Under IFRS 4’s definition of an insurance policy, the insured party must be exposed to the insured risk, not speculating, and the insured event specified in the contract must pertain directly to, not simply be correlated with, that exposure. IFRS 4’s definition encompasses various credit-risk-transfer products that are structured as derivatives or other financial instruments, up to the limit of the insured party’s exposure.
For example, a written credit derivative swap that pays off in the event of default on a
financial asset held by the purchaser of the CDS is an insurance policy under this definition. The same swap would not be an insurance policy if the purchaser did not hold the financial asset. A swap that pays off based on an index correlated with the default on the financial asset would also not be in an insurance policy under this definition, regardless of the correlation of default on the financial asset and the index.
It is inherently difficult to distinguish insurance policies from substitutable financial
products. Accordingly, similar accounting for insurance policies and substitutable financial products is necessary to avoid providing insurers and other firms with incentives to structure contracts to achieve desired accounting outcomes.
2. Can the Accounting for Insurance Policies that Pay Off in Highly
Correlated Fashion in Rare Circumstances Be Made More Robust?

The financial crisis led to large write-downs being recorded by AIG Capital Markets on its credit default swaps (which it accounted for as derivatives, not insurance policies), by the monoline financial guarantors on their financial guarantees, and by a number of large life insurers (including AIG) on their minimum guarantees and other contract features on investment-oriented life insurance policies. Each of these positions can be viewed as an initially out-of-the-money written put option tied directly or indirectly to a macroeconomic variable, specifically, house price or equity price indices. In the cases listed above, insurers accumulated very sizeable concentrations of these positions.
The insurers’ initial valuations of these put options and the large losses they subsequently
recorded on these positions during the crisis all reflect the following statistical issue. These put options pay off rarely, but when they pay off, they pay off in highly correlated fashion, since they are tied to the same or similar indices. In the absence of good market information about the value of these positions, accounting for these positions is prone to large ex post errors, especially when the historical data inevitably used to value these positions has been accumulated during a prolonged favorable period in which these indices have risen, suggesting that these put options are less valuable than in fact they are. When insurers rely too heavily on such favorable historical data in accounting for these positions, they will record large losses when the favorable period ends. Insurance regulators need to be aware of this fact. Disclosures of insurers’ concentrations of such put options and the assumptions they use to value those put options are of critical importance.
VII. CONCLUDING REMARKS
In the traditional economics literature, the focus is on moral hazard arising from insurance. In equilibrium, this leads to under-provision of insurance, excessive precautionary hoardings and under-investment in growth of economies. In contrast, the financial crisis of 2007-09 revealed that during the period of 2004-07, there was in fact excessive provision of insurance on financial products, under-capitalization of insurers and financial firms, and over-investment in aggregate risk. We argued in this paper that these were manifestations of agency problems affecting the insurers, and not just those affecting the insured, in both cases the primary problem being the too-interconnected-to-fail problem. Since the current state guarantee funds based regulation is inadequate to assess and manage the systemic risk of large insurers, we advocate a federal regulator who will manage, ex ante as well as ex post, the risk of systemically large insurers. We propose one possible measure of systemic risk based on market data and how to impose a tax for the systemic risk contributions of insurers. These proposals, if implemented, would ensure that going forward the provision of insurance is not effectively back-stopped by taxpayer funds and instead enable markets to price appropriately the risks insured and the insurance, and in turn, ensure efficient allocation of resources to profitable investments.

APPENDIX: The Case of A.I.G.
Was A.I.G. too-big-to-fail, and what does their de facto failure tell us about insurance regulation going forward?
A.I.G. is often called the largest insurance entity in the world. Depending on how “large” is defined, it was the largest under most definitions, but was only number two or three in some specific categories of insurance (say, in terms of assets as a life insurance company). But no other company had the combination of life, property casualty, global reach, and non-insurance product lines.
A.I.G.’s total assets were $860 billion on 12/31/2008 (dwarfing any other insurance entity) with 116,000 employees, operating in 130 countries, with 71 U.S. based insurance companies, and 176 other companies representing non U.S. insurers and other financial services.18
Many regulatory issues are raised by A.I.G.’s structure: regulatory arbitrage in its multitude of companies and countries and its selection of a Gramm-Leach-Bliley regulator; its extreme unregulated systemic risk; and its complete lack of regulation of certain “insurance-like” components.
In this appendix, we first look at A.I.G.’s line of businesses, and then evaluate their systemic risk using the three criteria outlined in Section III of the paper – interconnectedness, spillover risk, and causing system-wide “runs.”
A. Summary of Lines of Business
It is useful to break down the analysis of A.I.G. into the four major components, as A.I.G. describes itself in its 10-K presentation (see the 349 page 10-K for the year ended December 31, 2008).
i. General Insurance
General insurance encompasses a large number of property casualty businesses – both commercial and personal lines, international reinsurance, a mortgage guarantee business and operations in virtually all global markets. The Company’s founding in 1916 in Shanghai as an Asian insurance agency grew significantly after World War II to cover the rest of the world. Acquisitions in the last decade led it to further dominance. The 10-K lists ten principal companies through which A.I.G. conducts its general businesses segment.
The state of Pennsylvania takes the lead in regulating A.I.G.’s U.S. general insurance companies, of which eleven are based in Pennsylvania (no A.I.G. life insurance companies are
18 Note 3 of the 10‐K outlines the operating segments of A.I.G. in considerable detail.

regulated in Pennsylvania). Many other companies are domiciled in other states, and many in foreign countries.
As A.I.G. or other insurers write certain special types of insurance policy, they can pick a state or country that permits or is favorable to writing that type of contract. For example, the controversial finite insurance contract, written by General Reinsurance Company to accommodate A.I.G., was written through General Re’s Irish subsidiary. This was the contract that led to prison terms for several General Re officers and the forced resignation of Chairman Greenberg of A.I.G. in 2005.
No major issues of solvency have been raised by the groups of General Insurance Companies in A.I.G., but overall coordination and regulatory arbitrage remain concerns. Joel Ario, the Insurance Commissioner of Pennsylvania, in his testimony on March 13, 2009, before the House Subcommittee on Capital Markets defended the multiple state regulation of A.I.G.’s general insurance segment stated:
“Our critics may question the efficiency of having multiple eyes on a complex enterprise such as A.I.G., but the reality is that these multiple eyes have served policyholders well by probating the solvency of the A.I.G. insurance companies deposits turmoil at the A.I.G. holding company level.”
Other critics of the multi-state and multi-country have credited the regulation success to the strong personal control that Chairman Greenberg had over all activities of the company, and particularly the A.I.G.CM entities, for “protecting their solvency.”
The operating loss in 2008 for A.I.G.’s General Insurance segment was $5.7 billion.
ii. .Life Insurance and Retirement Services
A.I.G.’s Life Insurance and Retirement Services segment had serious losses in 2008, of 37.5 billion dollars, almost as much as A.I.G. Financial Services loss of $40.8 billion. These losses came from their failed securities lending businesses, aggressive variable annuity death benefit provisions and investment losses on their over $500 billion asset portfolio (at $489.6 billion at 12/31/2008).
Securities lending is typically not considered a very risky business as the collateral is invested in safe shot-term assets. Other life insurance companies, such as MetLife, also run similar businesses. In A.I.G.’s case, however, state filing show that roughly two-thirds of its cash collateral was invested in mortgage-backed securities very similar to the AAA-rated tranches they were insuring in their financial products group. Moreover, over one-half of the collateral was invested in assets that had maturities ranging from three to 10 years, a much different duration than the short-term loans provided by A.I.G. via their debt securities. This opened up A.I.G. for a maturity mismatch if the borrowers of A.I.G’s securities did not rollover their loans.

The A.I.G. 10-K lists eight “financial” life companies for their foreign businesses, and ten “principal” companies for their U.S. business.
Eric Dinallo, in his testimony on March 5, 2009 to the Senate Banking Committee, describes the New York Department as primary regulator of ten of A.I.G.’s 71 U.S. Insurance companies. Other states are primary for all others.
iii. Asset Management
A.I.G.’s Asset Management business is not regulated by states but is overseen by the federal agencies: primarily the SEC, and the Office of Thrift Supervision. It has four principal companies related to its major life insurance acquisitions and the varied products (including mutual funds) offered to individuals and institutions.
No regulatory problems have developed under those businesses, but its operating loss in 2008 was 9.2 billion dollars.
iv. Financial Services
What A.I.G. calls its “Financial Services” business includes three primary entities: the International Lease Financing Company (ILFC), the world’s largest airplane leasing business; a consumer finance business, and a capital markets operations business called A.I.G. Capital Markets (A.I.G.CM.)
ILFC was profitable in 2008 with operating income of $1.2 billion. Consumer Finance lost $1.3 billion.
A major factor in A.I.G.’s collapse was the losses on A.I.G.CM which came to $40.5 billion, out of the total loss of over $100 billion (see page 116 of the 10K).
Federal Chairman Bernanke, in Congressional testimony said: “A.I.G. had a financial products division which was very lightly regulated and was a source of a great deal of systemic trouble.” He further called the Financial Products unit “a hedge fund basically that was attached to a large and stable insurance company that made large numbers of irresponsible bets, and took huge losses.”
It is true that A.I.G.CM had an operating loss of $40.8 billion in 2008, but the other businesses of A.I.G. had losses of $67.9 billion, for a total of $108.8 billion. The “large and stable insurance companies” had losses of $43.2 billion (see page 71 of the 10K). Clearly A.I.G. would have needed to join the other insurance companies (Prudential, Hartford, Principal, Lincoln National et.al.) for federal TARP support, even without the “hedge fund” losses.
A.I.G., in its 10-K, reports that the loss related “primarily” due to its “super senior multi-sector CDO credit default swap portfolio.” Downgrades of A.I.G.’s credit ratings and “extreme Market conditions”” drove the losses.” (p. 117 of 10-K). This “very lightly regulated” part of Chairman Bernanke’s quote arose mainly from two causes:

(1) Credit Default swaps were exempted from regulation under the Commodities Future
Modernzation Act of 2000, which prevented the SEC or the New York Insurance Department from regulating the instruments.
Both regulators had tried to assert authority. Brooksby Born, the head of the Commodity Futures Trading Commission testified before Congress 17 times, arguing that such derivatives posed an unknown and growing risk to the world’s financial system. She was vigorously opposed by Federal Reserve Chairman Alan Greenspan, ex-Treasury Secretary Robert Rubin and ex-SEC Chairman Arthur Levitt.
(2) A.I.G. purchased a savings and loan company in 1999, enabling A.I.G. to select as the “consolidated supervisor,” under Gramm-Leach-Bliley, the Office of Thrift Supervision (OTS). A.I.G. Financial Products is not a licensed insurance company , based primarily in London and escaped regulation by the British Financial Service Authority since A.I.G. had an equivalent regulator,” the OTS.
Accordingly, a “large and stable insurance entity,” combined with a sophisticated hedge fund, “making huge numbers of irresponsible bets,” was ultimately regulated by the regulatory agency for U.S. home loan companies.
Briefly, the company started business with A.I.G. in 1987 and offered complex hedge products successfully for 10 years.19 The founders left in 1993 and the first credit default swap was written in 1998. The product relied heavily on the support of A.I.G.’s triple A credit rating.
An extraordinary amount of highly visible management turmoil occurred from 1998 on, with Chairman Greenberg’s firing, driven by Attorney General Spitzer’s charges, in 2005. The credit default swap business accelerated after 1998 when JP Morgan introduced, jointly with A.I.G.CM, a CDO product that relied on the insurance provided by an A.I.G. credit default swap.
Finally in October 2008 SEC Chairman Cox stated “the regulatory black hole for credit-default swaps is one of the most significant issues we are confronting in the current credit crisis.”
B. The Systemic Risk of A.I.G.
Section III outlined three ways systemic risk can materialize in the financial sector. It seems worthwhile exploring each of these possibilities as it pertains to A.I.G. i. Interconnectedness By far, the degree of A.I.G.’s interconnectedness to the financial system was its greatest contributor to systemic risk. Through its Financial Products unit, A.I.G. had $1.6 trillion in 19 The history of A.I.G. Financial Product is outlined in a 3 part series, written by Robert O’Harrow and Brady Dennis for the Washington Post in December 2008 and January 2009.

notional derivatives exposures, linking itself to over 1,500 corporations, governments and institutional investors. And, as widely reported, A.I.G. had $450 billion of one-sided credit default swap exposure on the so-called AAA-tranches of securitized products. The problem with OTC derivatives markets, like the ones A.I.G. participated in, is that bilateral collateral and margin requirements in OTC trading do not take account of the counterparty risk externality that each trade imposes on the rest of the system, allowing systemically important exposures to be built up without sufficient capital to mitigate the risks. The AAA-tranches of the securitized products would only be impacted by a very rare market event, but, if the event occurred, most of the AAA-tranches would be hit. In other words, the risk underlying these tranches was almost all systematic, and therefore none of it was idiosyncratic and diversifiable.20 It is therefore not surprising that the event, the massive drop in housing prices and collapse of the credit market, caused (i) widespread losses at A.I.G., (ii) the failure of A.I.G. due to its undercapitalization at the parent level from its exposure to its financial products unit, and (iii) these losses to be passed back to the counterparties of A.I.G. (without government support). Systemic risk arises because the losses passed back to the counterparties may cause those counterparties to sell assets, leading to a rapid downward spiral in the value of these assets, which leads to further losses and funding difficulties, causing more asset sales, and so forth. In the most extreme case, if A.I.G.’s failure leads to the failure of another financial institution, and that institution has counterparties, then those counterparties are put at risk. In effect, A.I.G.’s counterparty risk extends way beyond the 1,500 institutions it had arrangements with.
To get an idea of the magnitude of the losses and the depth of the counterparties, Table 7 provides the ten largest payments of A.I.G. to its various counterparties from September 16, 2008 to December 31, 2008 as a result of government aid. The payments are broken down into (i) collateral postings under credit default swap contracts21, (ii) the outright purchase of collateralized debt obligations that A.I.G. had written CDS contracts on via Maiden Lane III22, and (iii) guaranteed investment agreements held by municipalities.23 As can be seen from the table, without the government support, the losses across the financial community from just these three sources alone during this 3-month period would have been staggering, reaching a total of $61.6 billion.
ii.Spillover Risk
20 See Jacob Jurek, Joshua Coval and Erik Stafford, “The Economics of Structured Finance,” forthcoming Journal of Economic Perspectives. 21 Collateral postings were required by a number of the credit default swap contracts as the underlying collateralized debt obligations lost value and/or A.I.G. themselves suffered a ratings downgrade. 22 Maiden Lane III was an investment company designed to purchase the underlying collateralized debt obligations that A.I.G. had written credit default swap contracts on, effectively closing out the credit default swaps. It was created in September 2008 when A.I.G. was effectively taken over by the U.S. government. 23 Guaranteed Investment Agreements are investments with a guaranteed rate of return which municipalities use to invest the proceeds from their bond issues, and are effectively used to cement high ratings at the issuance level.

Whether the realization of these losses by all of A.I.G’s counterparties would have caused the unraveling of the global financial system remains an open question. However, even without these losses, A.I.G.’s failure or, in fact, rating downgrade had the potential to cause a system-wide collapse. Similar to the LTCM crisis a decade earlier, A.I.G.’s holdings of $1.6 trillion in derivatives would have led to an unwind of positions that could have created a death-like spiral where asset values decline in response to liquidity pressure which in turn leads to funding liquidity issues which in turn lead to further declines in asset prices, and so forth. An additional question is whether A.I.G.’s failure at the parent level could lead to fire sales on its vast holdings of assets beyond the derivative products mentioned above. Going into the crisis, A.I.G. was the fifth largest institutional asset manager worldwide. If one were to include all of A.I.G.’s investments described in A.i-iv above, A.I.G. was the largest investor in corporate bonds in the United States, and second largest holder of U.S. municipal bonds through its commercial insurance (A.I.G.CI) business with $50 billion worth. Any significant forced sale of these bond portfolios would have put substantive stress on the respective financial markets. Since the assets of A.I.G.’s insurance companies were legally separated from A.I.G.CM, however, it is not clear that a failure at the parent level would indeed have caused a fire sale of its asset holdings elsewhere in the organization. In case of default, the A.I.G. parent company had guaranteed the contracts at A.I.G.CM which effectively meant the counterparties had a claim on the underlying businesses owned by A.I.G. though not ahead of the policyholders. It is quite possible that the businesses would have continued as normal. As mentioned in A.ii above though, there were significant losses from their investments in the cash collateral derived from their securities lending business in which they lent out securities held in their life insurance and retirement service businesses. These losses were mostly attributable to AA- and AAA-tranches of non-prime mortgage-backed securities. The losses from 9/16/2008 to 12/31/2008 were $43.7 billion, and included a number of systemically important counterparties, the top ten in order of their losses: Barclays ($7 billion), Deutsche Bank ($6.4 billion), BNP Paribas ($4.9 billion), Goldman Sachs ($4.8 billion), Bank of America ($4.5 billion), HSBC ($$3.3 billion), Citigroup ($2.3 billion), Dresdner Kleiwort ($2.2 billion), Merrill Lynch ($1.9 billion) and UBS ($1.7 billion). In addition, AIG offered investment-oriented life insurance policies with minimum guarantees and other contract features that yielded losses for A.I.G. when equity and bond markets fell as a result of the financial crisis It is quite likely that, like other life insurance companies, A.I.G. would have required capital infusions from the government even without A.I.G.CM. as a result of these investment losses. A failure of A.I.G. at the core business level would have resulted in a massive fire sale of its assets and a possible run by policyholders on some of its operations. Either of these could have systemic consequences. iii.A “Bank” Run Even if A.I.G were not failing at the individual insurance company level, it is possible that its failure at the parent level, and weaknesses described above at the insurance company level, could cause a classic run on the bank. Since A.I.G. has more than 81 million life insurance policies worldwide with a face value of $1.9 trillion, a large-scale run could have wide-scale effects.

For example, in one scenario, policyholders would cash in their policies, forcing A.I.G to raise cash, primarily through asset sales, leading to the type of spillover risk described above. The only protection A.I.G. would have in this case is the surrender charges or cancellation penalties, or untapped value of the policies. In another scenario, the sudden jump in uninsured would put temporary pressure at least on the ability of other life insurance companies to meet the insurance demands of these potential new customers. Of course, the largest concern of a “bank” run is that it leads to a system-wide run on the sector. System-wide runs are catastrophic as they lead to a freezing of the market these institutions operate in, and cause severe externalities towards related individuals and businesses. Given the importance of the life insurance sector to the overall economy, a system run would be very damaging. In the current financial crisis, system-wide runs have occurred in many parts of the shadow banking sector, starting with subprime lenders, moving onto asset-backed paper conduits, and then investment banks and money market funds, and ending with hedge funds. The two criteria for a run are that (i) similar institutions operate in the same space, and (ii) there is opacity (or information asymmetry) about each institution’s operations. This can lead to healthy institutions also facing runs on their liabilities. A run on a failing institution, assuming it is not systemic in its own right, is only bad to the extent it leads to runs on healthy institutions. It remains an open question whether a run on some of A.I.G.’s insurance businesses would lead to a run on other insurance companies. To many analysts, A.I.G. was a unique company, so its troubles may be seen as specific to its circumstances – the failure of A.I.G.CM and the collateral investments of its securities lending business – and not a more endemic characteristic of life insurance companies such as investment-oriented life insurance policies with minimum guarantees.
C. Analysis of A.I.G.
The A.I.G. case ctudy raises, at least, the following regulatory questions and issues: (1) How can the systemic risks imposed by a company like A.I.G. be regulated? (2) Was Gramm-Leach-Bliley poorly conceived, or administered, to permit the “regulatory arbitrage” of A.I.G. selecting the OTS as its consolidated regulator?
(3) Can a very large, “too big to fail” insurance entity be adequately regulated by any existing federal regulator?
(4) Should the scale and reach of an A.I.G. type entity be limited by regulation? (5) Could the state guaranty associations have coped with the insurance losses incurred
by A.I.G. in 2008? (6) Credit default swaps are essentially “insurance.” Is some form of insurance
regulation need for such products?
To answer question (6), what is clear, however, is that A.I.G.’s capital markets group did not offer typical insurance. As described in the opening paragraph of this paper, insurance works

because insurers pool and diversify large idiosyncratic risks faced by individuals and businesses. But there is no diversifiable risk on the AAA-tranche of credit portfolios; it is all systematic. In practice, this means that if the systematic event occurs, then all policies written on this event require a payout. Or, in A.I.G’s case, $450 billion worth in the highly unlikely case that the underlying bonds are worth nothing.24 This reasoning suggests that insurance companies should not be able to offer "insurance"/protection against systemic events unless the insurance is fully capitalized. This would cover CDS on AAA-tranche CDOs, insurance against a nuclear attack, the systematic portion of insurance on municipal bonds, and so forth.
24 One could argue that the possibility all bonds have a recovery rate of zero is in fact zero, so the amount at risk is less than $450 billion. It is clear, however, that because the probability of a AAA‐tranche being affected is very low, the actual dollars at risk may have been quite high given the level of CDS premiums. For the product to be considered insurance, this amount would need to be covered.

TABLE 1: Insurance Premiums in $mm, United States, 2008 Property/Casualty Insurance Direct Premiums Homeowners Multiple Peril $65,682,086,696 Medical Malpractice $11,136,796,122 Workers Compensation $45,571,879,791 Other Liability $52,695,252,309 Total Private Passenger Auto $164,254,746,128 Total Commercial Auto $26,986,027,510 All Business Lines (including those not shown above) $495,171,362,005 Life and Fraternal Insurance Direct Premiums Life Insurance $153,849,638,239 Annuity Considerations $264,122,255,361 Totals for Life Ins, Annuity Considerations, Deposit Type Contract Funds, Other Considerations, and Accident and Health $787,748,498,852
Source: National Association of Insurance Commissioners

TABLE 2: LIFE AND FRATERNAL INSURANCE INDUSTRY, 2008 TOP 25 COMPANIES BY COUNTRYWIDE PREMIUM
Totals for Life Ins, Annuity Considerations, Deposit Type Contract Funds, Other Considerations, and Accident and Health COMPANY NAME PREMIUMS ($) Mkt
Share Cum. Share
METROPOLITAN GRP 85,412,088,151 10.84 10.84 AMERICAN INTL GRP 54,180,274,203 6.88 17.72 PRUDENTIAL OF AMER GRP 40,073,876,394 5.09 22.81 ING AMER INS HOLDING GRP 35,142,085,489 4.46 27.27 AEGON US HOLDING GRP 32,184,994,461 4.09 31.35 JOHN HANCOCK GRP 31,506,631,544 4.00 35.35 UNITEDHEALTH GRP 31,432,339,997 3.99 39.34 NEW YORK LIFE GRP 27,941,620,703 3.55 42.89 PRINCIPAL FIN GRP 25,472,023,815 3.23 46.12 HARTFORD FIRE & CAS GRP 24,669,677,233 3.13 49.26 LINCOLN NATL GRP 21,071,574,017 2.67 51.93 AXA INS GRP 18,612,297,406 2.36 54.29 AETNA GRP 15,820,347,491 2.01 56.30 AMERICAN FAMILY CORP GRP 15,369,985,151 1.95 58.25 JACKSON NATL GRP 14,368,161,503 1.82 60.08 MASS MUT LIFE INS GRP 14,220,222,781 1.81 61.88 HUMANA GRP 13,879,154,337 1.76 63.64 TIAA FAMILY GRP 13,798,508,923 1.75 65.40 PACIFIC LIFE GRP 12,882,759,966 1.64 67.03 ALLSTATE INS GRP 11,115,233,740 1.41 68.84 GENWORTH FIN GRP 10,983,637,992 1.39 69.84 NATIONWIDE CORP GRP 10,833,330,409 1.38 71.21 AMERIPRISE FIN GRP 10,670,739,020 1.35 72.57 NORTHWESTERN MUT GRP 10,414,519,410 1.32 73.89 AVIVA GRP 9,490,647,446 1.20 75.09 INDUSTRY TOTAL 787,748,498,852 100.00 100.00
Source: National Association of Insurance Commissioners

TABLE 3: PROPERTY AND CASUALTY INSURANCE INDUSTRY 2008 TOP 25 COMPANIES BY COUNTRYWIDE PREMIUM
COMPANY NAME PREMIUMS ($) Mkt
Share Cum. Share
STATE FARM GRP 49,944,110,234 10.09 10.09 AMERICAN INTL GRP 31,947,476,41 6.45 16.54 ZURICH INS GRP 28,157,387,522 5.69 22.22 ALLSTATE INS GRP 26,880,105,440 5.43 27.65 LIBERTY MUT GRP 26,331,557,661 5.32 32.97 TRAVELERS GRP 21,807,760,469 4.40 37.37 BERKSHIRE HATHAWAY GRP 16,225,291,933 3.28 40.65 NATIONWIDE CORP GRP 15,826,371,498 3.20 43.85 PROGRESSIVE GRP 13,776,834,518 2.78 36.63 HARTFORD FIRE & CAS GRP 11,049,580,528 2.23 48.86 CHUBB & SON INC GRP 9,836,727,259 1.99 50.85 UNITED SERV AUTOMOBILE ASSN GRP
9,575,491,347 1.93 52.78
ACE LTD GRP 8,656,266,131 1.75 54.53 CNA INS GRP 8,528,226,320 1.72 56.25 ALLIANZ INS GRP 6,093,099,134 1.23 57.48 AMERICAN FAMILY INS GRP 5,835,203,659 1.18 58.66 AUTO OWNERS GRP 4,409,410,913 0.89 59.55 AMERICAN FINANCIAL GRP 4,091,749,579 0.83 60.38 ASSURANT INC GRP 3,853,077,113 0.78 61.16 ERIE INS GRP 3,799,901,584 0.77 61.92 WR BERKLEY CORP GRP 3,579,386,081 0.72 62.65 OLD REPUBLIC GRP 3,219,625,816 0.65 63.30 CINCINNATI FIN GRP 3,180,460,976 0.64 63.94 METROPOLITAN GRP 3,050,105,058 0.62 64.55 XL AMER GRP 3,035,011,919 0.61 65.17 INDUSTRY TOTAL 100.00 100.00
Source: National Association of Insurance Commissioners

TABLE 4: LARGEST LIFE INSURANCE ENTITITIES
BY TOTAL ASSETS, 12-31-2007
COMPANY NAME ASSETS ($billions)
Share Cumulative
METROPOLITAN LIFE 457 8.9 8.9 PRUDENTIAL FINANCIAL 387 7.6 16.5 AMERICAN INTL GRP 364 7.1 23.6 HARTFORD LIFE 264 5.2 28.8 MANULIFE FINANCIAL 218 4.3 33.0 TIAA-CREF 199 3.9 36.9 AEGON USA 198 3.9 40.8 NEW YORK LIFE 193 3.8 44.6 ING NORTH AMERICA 191 3.7 48.3 AXA FINANCIAL 159 3.1 51.4 NORTHWESTERN MUTUAL 157 3.1 54.5 LINCOLN FINANCIAL 155 3.0 57.5 PRINCIPAL FINANCIAL 136 2.7 60.2 MASSACHUSETTS MUTUAL 132 2.6 62.8 NATIONWIDE 111 2.2 64.9 PACIFIC LIFE 99 1.9 66.9 ALLSTATE 89 1.7 68.6 RIVER SOURCE INSURANCE 85 1.7 70.3 JACKSON NATIONAL 77 1.5 71.8 ALLIANZ 70 1.4 73.2 GENWORTH FIN GRP 68 1.3 74.5 SUN LIFE ASSURANCE 62 1.2 75.7 THRIVENT FINANCIAL FOR LUTHERANS
57 1.1 76.8
AFLAC 56 11 77.9 STATE FARM 45 09 78.8 INDUSTRY TOTAL 5,114 100.00 100.00
Source: National Association of Insurance Commissioners, American Council of Life Insurers

Table 5: Systemic risk and balance-sheet characteristics of insurance firms in the one year prior to July 2007. The 36 insurance firms considered are in the list of 102 US financial firms based on a market cap in excess of 5 bln dollars as of June 2007. MES5 is the marginal expected shortfall of a stock given that the market return is below its 5th-percentile. It was measured for each individual company’s stock using the period July 2006 till June 2007. $MES5 is MES5 multiplied by the Market cap, the product of outstanding shares and stock price as of end of June 2007. The accounting data are: Book value of Assets, Book equity divided by total assets (BEA), and total long-term debt divided by total assets (LDA). All balance sheet data are based on latest available quarterly "CRSP-Compustat merged" data as of end of June 2007. The leftmost column gives the within-insurance-sector systemic risk ranking by $MES5 whereas the rightmost column gives the ranking within the 102 US financial firms. The second panel shows the summary statistics for the entire insurance sector.
Ranking Company
$ MES
5 MES5
Assets(blns)
Market Cap(blns) BEA LDA
Ranking in top 102
financials (by
$MES5)
1 AMERICAN INTERNATIONAL GROUP INC
1.044 0.57%
1033.87 181.67 0.101
0.138
10
2 METLIFE INC 0.741 1.55%
552.56 47.82 0.061 0.030 13
3 PRUDENTIAL FINANCIAL INC
0.575 1.28%
461.81 45.02 0.050 0.024 17
4 BERKSHIRE HATHAWAY INC DEL
0.546 0.46%
269.05 119.00 0.428 0.118 19
5 UNITEDHEALTH GROUP INC 0.485 0.71%
53.15 68.53 0.396 0.131 22
6 COUNTRYWIDE FINANCIAL CORP
0.453 2.10%
216.82 21.57 0.066 0.358 26
7 LOEWS CORP 0.386 1.41%
79.54 27.38 0.215 0.062 28
8 WELLPOINT INC 0.383 0.78%
54.19 48.99 0.461 0.141 29
9 TRAVELERS COMPANIES INC
0.372 1.05%
115.36 35.52 0.218 0.050 31
10 HARTFORD FINANCIAL SVCS GROUP IN
0.350 1.12%
345.65 31.19 0.054 0.014 33
11 AETNA INC NEW 0.339 1.34%
49.57 25.31 0.195 0.049 34
12 ALLSTATE CORP 0.284 0.76%
160.54 37.36 0.134 0.035 43
13 LINCOLN NATIONAL CORP IN
0.252 1.31%
187.65 19.21 0.063 0.022 51
14 PRINCIPAL FINANCIAL GROUP INC
0.252 1.61%
150.76 15.61 0.053 0.010 52
15 CHUBB CORP 0.233 1.07%
51.73 21.74 0.267 0.080 55
16 BERKSHIRE HATHAWAY INC DEL
0.220 0.45%
269.05 49.29 0.428 0.118 57

17 GENWORTH FINANCIAL INC 0.216 1.44%
111.94 14.96 0.116 0.066 59
18 A F L A C INC 0.213 0.85%
60.11 25.14 0.136 0.023 60
19 PROGRESSIVE CORP OH 0.207 1.19%
21.07 17.42 0.261 0.103 61
20 MARSH & MCLENNAN COS INC
0.195 1.14%
17.19 17.15 0.329 0.210 63
21 C I G N A CORP 0.171 1.14%
41.53 15.03 0.097 0.043 66
22 AON CORP 0.149 1.19%
24.79 12.51 0.216 0.088 71
23 HUMANA INC 0.142 1.39%
13.33 10.24 0.253 0.089 72
24 M B I A INC 0.136 1.67%
43.15 8.14 0.157 0.690 73
25 UNUM GROUP 0.134 1.50%
52.07 8.95 0.142 0.044 75
26 C N A FINANCIAL CORP 0.127 0.98%
60.74 12.95 0.165 0.033 77
27 AMBAC FINANCIAL GROUP INC
0.115 1.29%
21.06 8.89 0.287 0.484 79
28 BERKLEY W R CORP 0.112 1.78%
16.63 6.32 0.215 0.082 81
29 LOEWS CORP 0.096 1.15%
2.84 8.38 0.138 0.344 85
30 CINCINNATI FINANCIAL CORP
0.091 1.22%
18.26 7.46 0.374 0.043 89
31 SAFECO CORP 0.078 1.18%
13.97 6.61 0.287 0.061 92
32 HEALTH NET INC 0.071 1.19%
4.73 5.93 0.412 0.084 94
33 ASSURANT INC 0.065 0.92%
25.77 7.13 0.148 0.039 96
34 COVENTRY HEALTH CARE INC
0.059 0.66%
6.41 9.01 0.457 0.151 98
35 TORCHMARK CORP 0.058 0.91%
15.10 6.40 0.215 0.048 99
36 FIDELITY NATIONAL FINL INC NEW
0.050 0.95%
7.37 5.25 0.483 0.069 101
$ MES5 MES5 Assets(blns) Market Cap(blns) BEA LDA mean 0.261 1.15% 128.59 28.03 0.224 0.116
median 0.210 1.16% 51.90 16.38 0.215 0.067 std 0.214 0.37% 203.37 34.67 0.134 0.142
min 0.050 0.45% 2.84 5.25 0.050 0.010 max 1.044 2.10% 1033.87 181.67 0.483 0.690
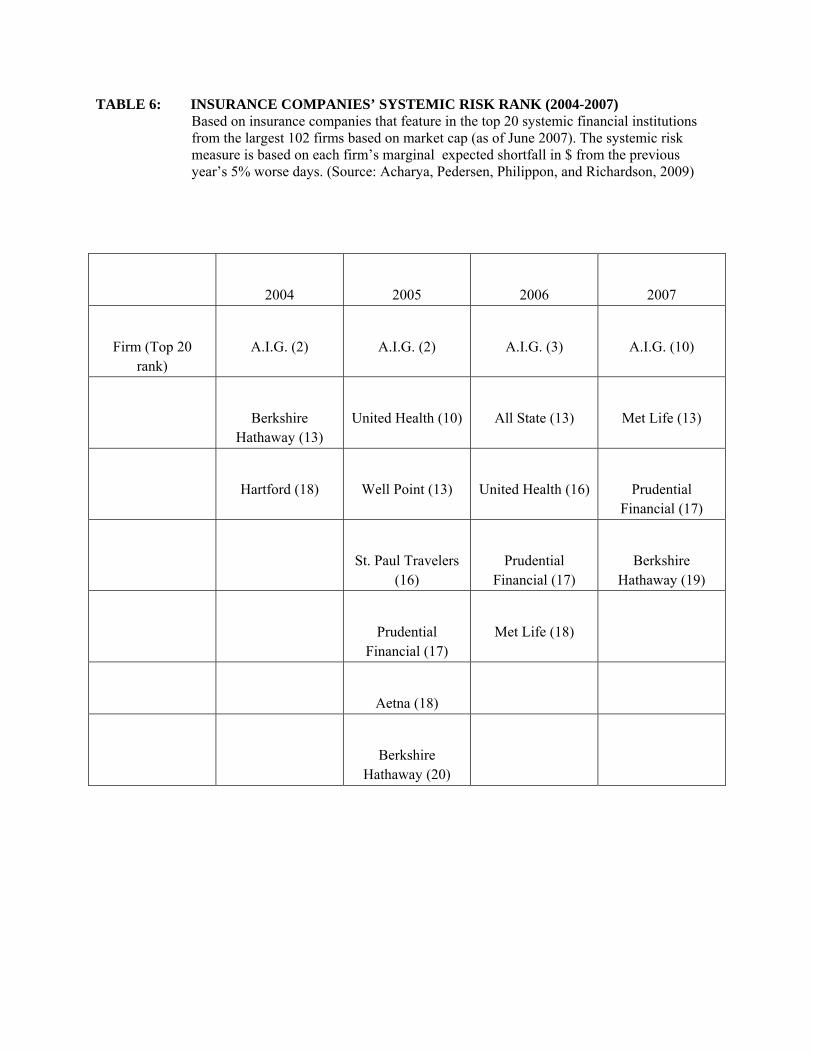
TABLE 6: INSURANCE COMPANIES’ SYSTEMIC RISK RANK (2004-2007) Based on insurance companies that feature in the top 20 systemic financial institutions from the largest 102 firms based on market cap (as of June 2007). The systemic risk measure is based on each firm’s marginal expected shortfall in $ from the previous year’s 5% worse days. (Source: Acharya, Pedersen, Philippon, and Richardson, 2009)
2004 2005 2006 2007
Firm (Top 20 rank)
A.I.G. (2) A.I.G. (2) A.I.G. (3) A.I.G. (10)
Berkshire Hathaway (13)
United Health (10) All State (13) Met Life (13)
Hartford (18) Well Point (13) United Health (16) Prudential Financial (17)
St. Paul Travelers (16)
Prudential Financial (17)
Berkshire Hathaway (19)
Prudential Financial (17)
Met Life (18)
Aetna (18)
Berkshire Hathaway (20)
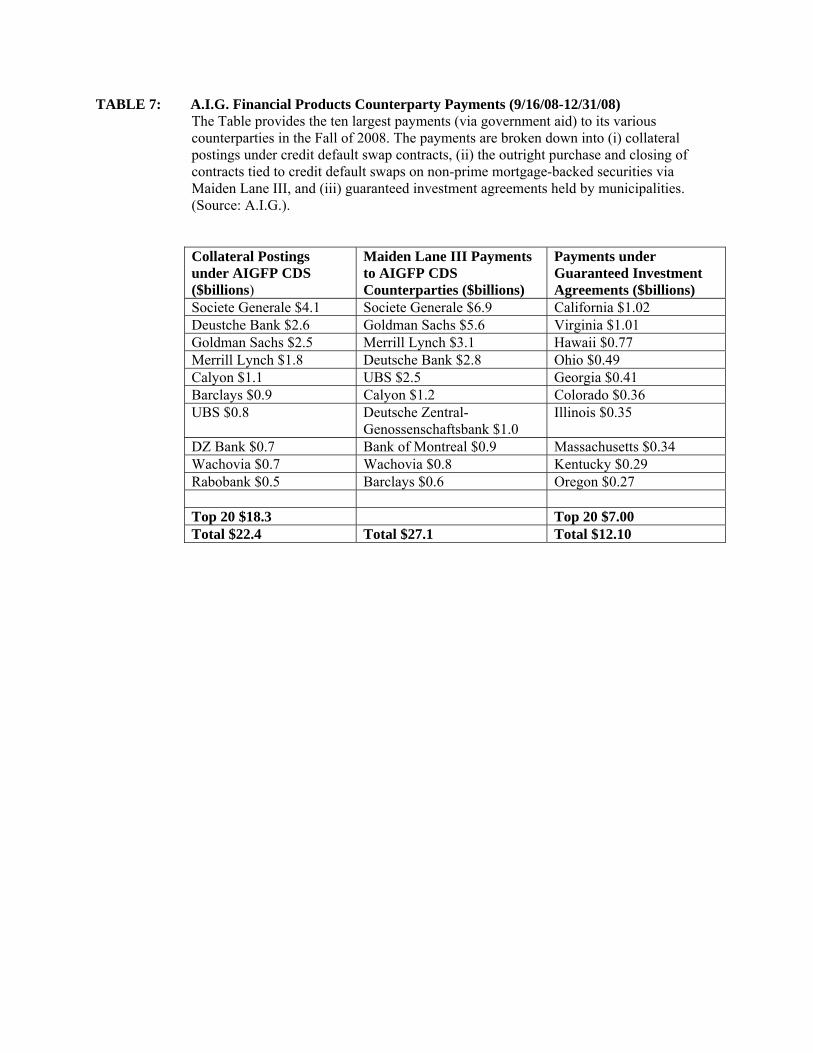
TABLE 7: A.I.G. Financial Products Counterparty Payments (9/16/08-12/31/08) The Table provides the ten largest payments (via government aid) to its various counterparties in the Fall of 2008. The payments are broken down into (i) collateral postings under credit default swap contracts, (ii) the outright purchase and closing of contracts tied to credit default swaps on non-prime mortgage-backed securities via Maiden Lane III, and (iii) guaranteed investment agreements held by municipalities. (Source: A.I.G.). Collateral Postings under AIGFP CDS ($billions)
Maiden Lane III Payments to AIGFP CDS Counterparties ($billions)
Payments under Guaranteed Investment Agreements ($billions)
Societe Generale $4.1 Societe Generale $6.9 California $1.02 Deustche Bank $2.6 Goldman Sachs $5.6 Virginia $1.01 Goldman Sachs $2.5 Merrill Lynch $3.1 Hawaii $0.77 Merrill Lynch $1.8 Deutsche Bank $2.8 Ohio $0.49 Calyon $1.1 UBS $2.5 Georgia $0.41 Barclays $0.9 Calyon $1.2 Colorado $0.36 UBS $0.8 Deutsche Zentral-
Genossenschaftsbank $1.0 Illinois $0.35
DZ Bank $0.7 Bank of Montreal $0.9 Massachusetts $0.34 Wachovia $0.7 Wachovia $0.8 Kentucky $0.29 Rabobank $0.5 Barclays $0.6 Oregon $0.27 Top 20 $18.3 Top 20 $7.00 Total $22.4 Total $27.1 Total $12.10

FIGURE 1: The 5-year credit default swap (CDS) spreads on monolines and A.I.G. (Source: Bloomberg)

FIGURE 2a: The graph depicts for each year from 1963 until 2008 the market-cap weighted Marginal ES(5%) for each of the four categories of financial institutions conditioned on at least 22 days of trading within a year. (Source: Acharya, Pedersen, Philippon, and Richardson, 2009)
Annual Value-Weighted Marginal ES(5%) by groups.
-0.01
0.01
0.03
0.05
0.07
0.09
0.11
1963 1968 1973 1978 1983 1988 1993 1998 2003 2008
NBER Recession Depositories Others Insurance Sec. and Comm.
FIGURE 2b: The graph depicts for each year from 1963 until 2008 the equally weighted Marginal ES(5%) for each of the four categories of financial institutions conditioned on at least 22 days of trading within a year. (Source: Acharya, Pedersen, Philippon, and Richardson, 2009)
Annual Equally-Weighted Marginal ES(5%) by groups.
-0.005
0.015
0.035
0.055
0.075
0.095
1963 1968 1973 1978 1983 1988 1993 1998 2003 2008
NBER Recession Depositories Others Insurance Sec. and Comm.

Figure 3A-D: Systemic risk per dollar (MES) and balance-sheet characteristics of insurance firms in the one year prior to July 2007.
AIG
MET
PRU
BRK
UNH
CFC
LTR
WLP
TRVHIG
AET
ALL
LNC
PFG
CB
BRK
GNW
AFL
PGRMMC CI
AOC
HUM
MBI
UNM
CNA
ABK
BER
CGCINF
SAFHNT
AIZ
CVH
TMKFNF
.00
5.0
1.0
15
.02
ME
S5
me
asu
red
Jul
y06
till
Jun
e07
0 2 4 6 8Log(Assets)
AIG
MET
PRU
BRK
UNH
CFC
LTR
WLP
TRVHIG
AET
ALL
LNC
PFG
CB
BRK
GNW
AFL
PGRMMCCI
AOC
HUM
MBI
UNM
CNA
ABK
BER
CGCINFSAFHNT
AIZ
CVH
TMKFNF
.00
5.0
1.0
15
.02
ME
S5
me
asu
red
Jul
y06
till
Jun
e07
0 50 100 150 200Market Cap

AIG
MET
PRU
BRK
UNH
CFC
LTR
WLP
TRVHIG
AET
ALL
LNC
PFG
CB
BRK
GNW
AFL
PGRMMCCI
AOC
HUM
MBI
UNM
CNA
ABK
BER
CGCINF
SAF HNT
AIZ
CVH
TMKFNF
.00
5.0
1.0
15
.02
ME
S5
me
asu
red
Jul
y06
till
Jun
e07
0 .1 .2 .3 .4 .5Book Equity to Assets
AIG
MET
PRU
BRK
UNH
CFC
LTR
WLP
TRVHIG
AET
ALL
LNC
PFG
CB
BRK
GNW
AFL
PGRMMCCI
AOC
HUM
MBI
UNM
CNA
ABK
BER
CGCINF
SAFHNT
AIZ
CVH
TMKFNF
.00
5.0
1.0
15
.02
ME
S5
me
asu
red
Jul
y06
till
Jun
e07
0 .2 .4 .6 .8Long Term Debt to Assets