virgile calcination-cofe suppinfo · esi 1 — evidence by infra-red spectroscopy of a...
TRANSCRIPT

Towards the synthesis of mixed oxides with controlled stoichiometry from Prussian Blue analogues Virgile Trannoy,a‡ Amélie Bordage,*a Jordan Dezalay,a Romuald Saint Martin,a Eric Rivière,a Patricia Beaunier,b Cédric Baumier,c Camille La Fontaine,d Giulia Fornasieri,a and Anne Bleuzena
a ICMMO, Université Paris-Sud, Université Paris-Saclay, CNRS, Rue du doyen Georges Poitou, 91405 Orsay Cedex, France. Tel: +33 1 69 15 32 07; E-mail: [email protected] b Sorbonne Université, CNRS, Laboratoire de Réactivité de Surface, LRS, F-75005 Paris, France c Centre des Sciences Nucléaires et de la Matière, Université Paris-Sud, CNRS/IN2P3, Université Paris-Saclay, 91405 Orsay Cedex, France d Synchrotron SOLEIL, Saint Aubin, 91190 Gif-sur-Yvette, France ‡ Present address : ILV, Université Versailles Saint-Quentin en Yvelines, UMR CNRS 8180, 45 avenue des Etats-Unis, 78035 Versailles Cedex, France
SUPPLEMENTARY INFORMATION
Electronic Supplementary Material (ESI) for CrystEngComm.This journal is © The Royal Society of Chemistry 2019
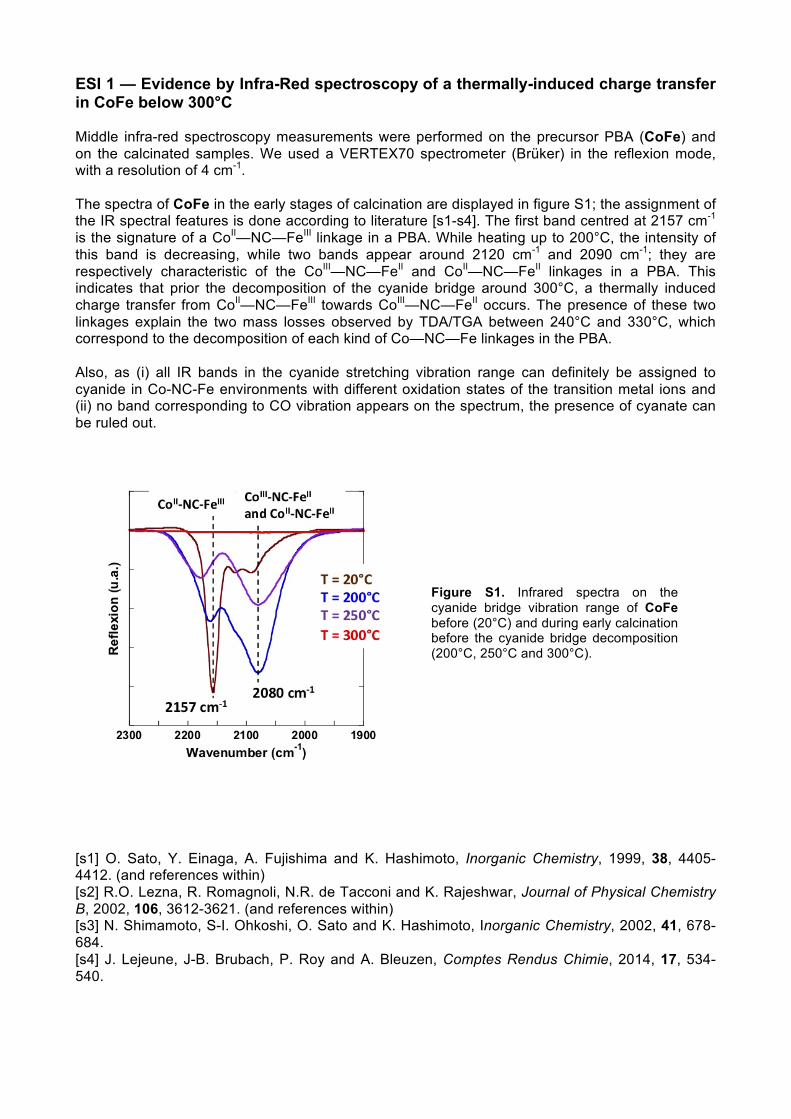
ESI 1 — Evidence by Infra-Red spectroscopy of a thermally-induced charge transfer in CoFe below 300°C Middle infra-red spectroscopy measurements were performed on the precursor PBA (CoFe) and on the calcinated samples. We used a VERTEX70 spectrometer (Brüker) in the reflexion mode, with a resolution of 4 cm-1. The spectra of CoFe in the early stages of calcination are displayed in figure S1; the assignment of the IR spectral features is done according to literature [s1-s4]. The first band centred at 2157 cm-1 is the signature of a CoII—NC—FeIII linkage in a PBA. While heating up to 200°C, the intensity of this band is decreasing, while two bands appear around 2120 cm-1 and 2090 cm-1; they are respectively characteristic of the CoIII—NC—FeII and CoII—NC—FeII linkages in a PBA. This indicates that prior the decomposition of the cyanide bridge around 300°C, a thermally induced charge transfer from CoII—NC—FeIII towards CoIII—NC—FeII occurs. The presence of these two linkages explain the two mass losses observed by TDA/TGA between 240°C and 330°C, which correspond to the decomposition of each kind of Co—NC—Fe linkages in the PBA. Also, as (i) all IR bands in the cyanide stretching vibration range can definitely be assigned to cyanide in Co-NC-Fe environments with different oxidation states of the transition metal ions and (ii) no band corresponding to CO vibration appears on the spectrum, the presence of cyanate can be ruled out.
Figure S1. Infrared spectra on the cyanide bridge vibration range of CoFe before (20°C) and during early calcination before the cyanide bridge decomposition (200°C, 250°C and 300°C).
[s1] O. Sato, Y. Einaga, A. Fujishima and K. Hashimoto, Inorganic Chemistry, 1999, 38, 4405-4412. (and references within) [s2] R.O. Lezna, R. Romagnoli, N.R. de Tacconi and K. Rajeshwar, Journal of Physical Chemistry B, 2002, 106, 3612-3621. (and references within) [s3] N. Shimamoto, S-I. Ohkoshi, O. Sato and K. Hashimoto, Inorganic Chemistry, 2002, 41, 678-684. [s4] J. Lejeune, J-B. Brubach, P. Roy and A. Bleuzen, Comptes Rendus Chimie, 2014, 17, 534-540.

ESI 2 — Complete set of X-ray diffraction patterns between 300°C and 900°C The CoFe-TTXXX samples (TT = Thermal Treatment; XXX= calcination temperature) were obtained after the calcination of CoFe at different temperatures in order to investigate in details the calcination process. The whole set of XRD patterns are displayed in Figure S2.
Figure S2. XRD patterns of the CoFe-TTXXX samples between 300°C and 900°C