virginia council
TRANSCRIPT

VIRGINIA COUNCIL

1. Report No.FHWANTRC 97-R16
4. Title and Subtitle
2. Government Accession No.Technical Report DocumentatIon Page
3. Recipient's Catalog No.
5. Report DateJune 1997
Exclusive Lanes for Trucks and Passenger Vehicles on InterstateHighways in Virginia: An Economic Evaluation
7. Author(s)
Lester A. Hoel and Joseph E. Vidunas
9. Performing Organization Name and Address
Virginia Transportation Research Council530 Edgemont RoadCharlottesville, VA 22903-0817
6. Performing Organization Code
8. Performing Organization Report No.VTRC 97-R16
10. Work Unit No. (TRAIS)
11. Contract or Grant No.SPR 0547-040-940
12. Sponsoring Agency Name and Address
Virginia Department of Transportation1401 E. Broad StreetRichmond, VA 23219
15. Supplementary Notes
13. Type of Report and Period CoveredFinal Report
Federal Highway AdministrationThe Dale Building 14. Sponsoring Agency Code1504 Santa Rosa RoadRichmond VA 23229
16. AbstractIncreases in heavy truck traffic on Virginia's highways in recent years have raised concerns about both safety and capacity, particularly on
the interstate system. Transportation agencies have developed a number of strategies for dealing with the impacts on safety and capacity of a truckpopulation that has been increasing in volume and in the percentage of large tractor-trailers. One strategy that has been suggested is separate lanesfor trucks and passenger vehicles.
A reliable methodology to determine when separate lanes for trucks and passenger vehicles are economically feasible would enabletransportation officials to make informed decisions concerning when this approach should be considered and used. This study evaluated a computerprogram, Exclusive Vehicles Facilities (EVFS), developed by the Federal Highway Administration for determining the economic feasibility ofseparating trucks and other vehicles on freeway segments. A 50.7-km (31.5-mi) segment of 1-81 in Virginia was selected to demonstrate theapplication of the program.
A number of factors contribute to the feasibility of exclusive lanes. Although no single factor predominates, traffic volume, vehicle mixpercentage, accident rates, and maintenance and construction costs are given more weight than other factors in the program. Among the program'sstrengths are its ability to analyze a number of alternatives for a variety of different conditions, its ease of use, and the fact that it can beinexpensively applied. Its weaknesses include its inability to differentiate between the lane(s) (i.e., inside, middle, outside) to which restrictions areapplied and its unsuitability for analyzing exclusive lane alternatives in which a barrier is used to separate vehicle types.
With respect to 1-81, several exclusive lane strategies produced a benefit-cost ratio greater than 1.0 and a net present worth in the millionsof dollars. Should 1-81 or another high-volume interstate corridor with a large truck percentage be considered for improvement, VDOT should applyEVFS to assist in evaluating the feasibility of exclusive lane alternatives. Since EVFS is designed to perform economic analyses, operational andgeometric implications of any exclusive lane strategy should also be considered.
17. Key WordsExclusive vehicle facilities, benefit-cost analysis, barrierseparation, heavy vehicle traffic, truck restrictions
18. Distribution StatementNo restrictions. This document is available to the publicthrough NTIS, Springfield, VA 22161.
19. Security Classif. (of this report) 20. Security Classif. (of this page) 21. No. of Pages 22. Price
UnclassifiedForm DOT F 1700.7 (8-72)
Unclassified 97Reproduction of completed page authorized

FINAL REPORT
EXCLUSIVE LANES FOR TRUCKS AND PASSENGER VEHICLESON INTERSTATE HIGHWAYS IN VIRGINIA:
AN ECONOMIC EVALUATION
Lester A. HoelFaculty Research Scientist
Hamilton Professor of Civil Engineering
Joseph E. VidunasGraduate Research Assistant
(The opinions, findings, and conclusions expressed in thisreport are those of the authors and not necessarily those of
the sponsoring agencies.)
Virginia Transportation Research Council(A Cooperative Organization Sponsored Jointly by the
Virginia Department of Transportation andthe University of Virginia)
In Cooperation with the U.S. Department of TransportationFederal Highway Administration
Charlottesville, Virginia
June 1997VTRC 97-R16
Copyright 1997, Virginia Department of Transportation.
11

ABSTRACT
Increases in heavy truck traffic on Virginia's highways in recent years have raisedconcerns about both safety and capacity, particularly on the interstate system. Transportationagencies have developed a number of strategies for dealing with the impacts on safety andcapacity of a truck population in which the volume and percentage of large tractor-trailers areincreasing. One strategy is separate lanes for trucks and passenger vehicles.
A reliable method for determining when separate lanes for trucks and passenger vehiclesare economically feasible would enable transportation officials to make informed decisionsconcerning when this approach should be considered and used. This study evaluated a computerprogram, Exclusive Vehicles Facilities, developed by the Federal Highway Administration fordetermining the economic feasibility of separating trucks and other vehicles on freewaysegments. A 50.7-km (31.5-mi) segment of Interstate 81 in Virginia was selected to demonstratethe application of the program.
A number of factors contribute to the feasibility of exclusive lanes. Although no singlefactor predominates, traffic volume, vehicle mix percentage, crash rates, and maintenance andconstruction costs are given more weight than other factors in the program. Among theprogram's strengths are its ability to analyze a number of alternatives for a variety of conditions,its ease of use, and the fact that it can be inexpensively applied. Its weaknesses include itsinability to differentiate between the lane(s) (i.e., inside, middle, outside) to which restrictionsare applied and its unsuitability for analyzing exclusive lane alternatives in which a barrier isused to separate types of vehicles.
With respect to 1-81, several exclusive lane strategies produced a benefit-cost ratio greaterthan 1.0 and a net present worth in the millions of dollars. Should 1-81 or another high-volumeinterstate corridor with a large percentage of trucks be considered for improvement, VDOTshould use this computer program to assist them in evaluating the feasibility of exclusive lanealternatives. Since the program is designed to perform economic analyses, the operational andgeometric implications of any exclusive lane strategy should also be considered.
111

FINAL REPORT
EXCLUSIVE LANES FOR TRUCKS AND PASSENGER VEHICLESON INTERSTATE HIGHWAYS IN VIRGINIA:
AN ECONOMIC EVALUATION
Lester A. HoelFaculty Research Scientist
Hamilton Professor of Civil Engineering
Joseph E. VidunasGraduate Research Assistant
INTRODUCTION
In recent years, increases in heavy truck traffic on Virginia's highways have raisedconcerns about both highway safety and capacity, particularly on the interstate system. Highlypublicized incidents involving conflicts between passenger vehicles and trucks over the past fewyears have heightened the awareness of transportation officials and the traveling public.Basically, much attention centers on conflicts between passenger vehicle travel and themovement of freight over the same highway.
Differences in the operating characteristics of passenger vehicles and large trucks mayincrease the likelihood of a crash. When crashes involving passenger vehicles and trucks occur,the difference in mass between the two vehicle types is such that occupants of the lighter vehiclesare at greater risk. Also, crashes causing blockages result in travel delays and monetary losses,particularly in congested areas.
The Surface Transportation Assistance Act (STAA) of 1982 specified truck weight limitsof 36,320 kg (80,000 lb) overall, with single-vehicle loads of 9,080 kg (20,000 lb) and tandemweights of 15,436 kg (34,000 lb). Further, the act specified that states could no longer prohibitthe use of twin-trailer trucks or enact any overall length limit. In addition, the Tandem TruckSafety Act of 1984 required that states allow travel to points of loading for single trailers 6.1 m(20 ft) long and 2.6 m (8 ft, 6 in) wide used in local pickup and delivery. Since these acts werepassed, there have been no further changes in size or weight limits. The vehicle dimensionsauthorized by the STAA, and now common in Virginia, are illustrated in Figure 1.

I~ 14.64 m ~I
Tractor-Semitrailer
I~ 8.54 - 8.69 m ----.~I 1--'"--- 8.54 - 8.69 m --~~I
Twin-Trailer Truck
Figure 1. Vehicle dimensions authorized by STAA
PROBLEM STATEMENT
Large truck vehicle miles of travel (VMT) and truck size have increased steadily sincetrucks were first used for intercity freight transport. Between 1936 and 1983, large truck VMT inthe United States increased 13 fold. I Over the same period, the percentage of total VMTaccounted for by large trucks doubled to approximately 4 percent. I An additional 29 percentgrowth in large truck VMT is expected to occur between 1994 and 2004.2 Because of aprogressive increase in legal size and weight limits over the years, the distribution of largercombination vehicles has increased to the point where five-axle tractor-semitrailers nowpredominate in the trucking industry. I
Since the enactment of the STAA, transportation agencies have attempted to developbroad strategies for dealing with the impacts on safety and highway capacity of a truckpopulation that has been increasing in the volume and percentage of large tractor-semitrailers.Strategies that have been proposed or tried include (1) increasing enforcement of weightviolations; (2) imposing a speed limit of 88 kmlh (55 mph) for heavy trucks; (3) providing morestringent control of driver licensing, training, and substance abuse; (4) improving truckcontrollability; (5) upgrading the geometric design of highways; (6) having trucking firms initiatecomprehensive safety management systems; (7) restricting use by trucks of certain roads duringspecified time periods; and (8) providing separate lanes for trucks and passenger vehicles.3
2

In Virginia, the Capital Beltway Safety Team evaluated 53 initiatives that focused on thefollowing priority areas: enforcement, incident management, construction and maintenance workzone safety, traffic management systems, operations and design enhancements, education andpublic information, and regional initiatives. Focus groups representing regular users of theBeltway suggested five actions to correct the problems associated with Beltway travel. One ofthe actions was "segregating roadways for trucks and vehicles," a strategy the focus groupbelieved "would be well received by both motorists and truckers."4 Similar approaches are beingconsidered for other highway corridors in Virginia (particularly 1-81 and 1-95) and in other states.
Officials of the Virginia Department of Transportation (VDOT) have indicated a stronginterest in examining the option of dedicating one or more lanes for the exclusive use of truckswhen widening occurs in these corridors. Dedicating lanes is not new, particularly highoccupancy vehicle (HOV) lanes, but Virginia has never dedicated lanes for trucks.
The Federal Highway Administration (FHWA), in cooperation with the states, hassponsored research on issues associated with heavy trucks. In 1990, FHWA developed amethodology and computer program called EVFS (Exclusive Vehicle Facilities).5 The purposeof this program was to assist in determining the economic feasibility of separating light andheavy vehicles on interstate or other controlled-access highways. EVFS is designed to calculatethe net present worth (NPW), benefit-cost ratio (BCR), and other facility performance measuresfor various lane configurations that designate existing lanes or provide additional lanesexclusively for trucks or passenger vehicles. For exclusive lanes to be provided, three or morelanes in one direction must be available.
PURPOSE AND SCOPE
The purpose of this research was to apply the EVFS analysis format to evaluate theeconomic feasibility of separating trucks and other vehicles on Virginia's interstate highwaysystem. The research attempted to validate the FHWA procedure and develop guidelines for itsuse in evaluating candidate freeway sections in Virginia. To test the model for Virginiaconditions, a 50.7-km (31.5-mi) segment of 1-81 in Virginia, located between Hollins andChristiansburg, was evaluated.
METHODS
The research approach adopted in this study involved the following tasks:
1. Review of the exclusive vehicle facility (EVF) concept. Relevant literature wasreviewed to gain insight into concepts and issues related to EVFs and other similar strategies thataddress heavy vehicle travel factors. Information was obtained through an extensive examination
3

of studies of special lane treatments for large trucks. An extensive search of the publishedliterature addressing exclusive vehicle facilities, truck lane restrictions, and truck operationcharacteristics was performed through a computerized search using the Transportation ResearchInformation Service (TRIS), the DIALOG data base, and a manual search of the University ofVirginia and Virginia Transportation Research Council (VTRC) libraries.
2. Comprehensive survey of the states. A survey of current practices in other states wasconducted to determine national experience with truck travel restrictions. Data regarding thetype of lane/route restriction/designation, its purpose, the manner of implementation, and overallexperience were assembled for use in assessing the utility of each strategy.
A telephone survey of state highway and transportation agencies was conducted. Aquestionnaire (Appendix A) was sent to a representative of each state before the interview toprovide the respondent an opportunity to review the questions and assemble necessaryinformation beforehand. Direct conversation by telephone provided an opportunity forclarification of both the questions and responses. In some cases, responses were returned viamail or fax. In these instances, a follow-up telephone call was usually placed to obtain additionalinformation. All 50 states were contacted with a 100 percent response rate.
3. Sensitivity testing ofEVFS. Sensitivity testing was undertaken to gain a betterunderstanding of the theory and assumptions underlying the EVFS analysis format. Reasonablehypothetical data were entered into the program to test the sensitivity of the program to changesin specific input variables. The purpose behind this effort was to validate the method beforeperforming the analysis on 1-81.
4. EVFS analysis of the 1-81 corridor. An analysis of the 1-81 test site using EVFS wasperformed to demonstrate the application of the model for conditions in Virginia. Cost tablesreferenced in the program were updated to current (1995) dollar values in this step.
5. Synthesis of the analysis results. The major outputs of the analysis were BCR andNPW. The results of the analysis were synthesized into various tables and graphs, and the resultswere discussed.
6. Development ofconclusions. Various lane strategies were evaluated based on theresults of the analysis. Conclusions with respect to the utility of the model and the feasibility ofexclusive lane strategies on 1-81 were developed.
7. Development of recommendations. Recommendations were suggested concerningfuture use of the model, ways in which the model could be enhanced, and the development ofEVFs in the 1-81 corridor.
8. Identification ofareas needing additional research. Areas in which additionalresearch is needed were identified.
4

LITERATURE REVIEW
Although a wide range of information is available on various truck lane strategies andtheir implementation, the effect of these strategies on vehicle operations or safety has not beenextensively reported. Few "before and after" studies have been conducted to determine effectson safety, traffic flow, and pavement degradation. Although positive results have beenspeculated, little quantitative data have been furnished to justify conclusions.
Heavy Vehicle Classifications
The term truck usually refers to one or more of the following vehicle classifications:pickups, single units (straight trucks), bobtails (tractor without trailer), and combinations (tractorpulling a semitrailer or multiple trailers). Throughout the literature, the terms large truck andheavy vehicle are either undefined or used inconsistently. For instance, Garber and Joshuadefined a large truck as "any truck that has six or more wheels in contact with the road,"6whereas Janson and Rathi considered heavy vehicles to include (1) single-unit trucks weighingmore than 4,540 kg (10,000 lb), and (2) combination-unit trucks.5
The definition of truck for the purpose of traffic enforcement varies among the states.Some states use gross vehicle weight (GVW) to define a truck (e.g., in lllinois, any vehicleweighing more than 7,264 kg [16,000 lb]; in Maryland, any vehicle weighing more than 4,540 kg[10,000 lb]). Several other states define truck in terms of physical dimensions (e.g., Kentucky)or the number of wheels in contact with the road (e.g., Georgia). Other definitions include "anyvehicle pulling a trailer or capable of carrying a load" or are stated in terms of the number ofaxles. Some states (e.g., Idaho and Nebraska) have no formal definition yet impose restrictionson this "undefined" vehicle.
In this report, the terms truck, large truck, and heavy vehicle are used interchangeably torefer to (1) single-unit trucks weighing more than 4,540 kg (10,000 lb), and (2) all combinationunit trucks, unless otherwise noted. This definition was selected to be consistent with the FHWAreport by Janson and Rathi.5
Adverse Effects of Mixed Vehicle Travel
Passenger vehicle and truck travel are often considered incompatible, especially bymotorists who view large trucks with trepidation. Although necessary for the movement offreight, truck traffic affects the safety, operation, and physical condition of the highway system.Large trucks tend to travel at slower speeds, create maneuverability problems, and consume alarger proportion of highway capacity than passenger vehicles.
5

Since the completion of the interstate highway system, total traffic and large truckvolumes have steadily increased. During certain periods on some freeway corridors, large truckvolume may approach or exceed that of passenger vehicles. Increases in total traffic andpercentage of trucks in the traffic mix increase the probability and severity of adverse impactsrelated to mixed vehicle travel.
According to Seiff, greater traffic volume, along with a larger percentage of trucks in thevehicle mix, is responsible for an increase in vehicle hours of delay for motorists.? Long delaysand traffic jams are caused by crashes and cargo spills involving large trucks; even minor crashesinvolving large trucks can produce major traffic jams in congested areas. Total travel time forpassenger vehicles is lengthened on upgrades by slower moving trucks. Media coverage ofcrashes involving heavy vehicles and corresponding delays is likely responsible for the increasedpublic perception that truck safety is worsening.?
Physical characteristics of heavy vehicles are different from those of passenger vehicles.The sheer difference in mass between light and heavy vehicles increases the severity of crashconsequences for passenger vehicle occupants when the vehicles collide. Differences inoperating characteristics between the two vehicle types such as braking, maneuverability, andtravel speed in mixed traffic flow increase the danger for passenger vehicle occupants.? A recentstudy by the Insurance Institute for Highway Safety found that in fatal two-vehicle crashesinvolving passenger vehicles and large trucks, 98 percent of the fatalities were occupants of thepassenger vehicles.8
In a study of large truck crashes on interstate and primary highways in Virginia, Garberand Joshua found that when a large truck was involved in a two-vehicle crash, there was a94 percent chance that the other vehicle was not a large truck.6 They further concluded that theproportion of large truck/non-large truck crashes was slightly higher than should have beenexpected. In terms of fatal crashes, their findings indicated that the highest percentage (60.1 %)of fatal large truck crashes involved two vehicles. Further, non-large truck/non-large truck andlarge truck/large truck fatal crashes were underrepresented, and large truck/non-large truck fatalcrashes were significantly overrepresented.6
Truck crash characteristics are different for rural and urban roadways. In rural crashes,trucks are more often the striking vehicle, whereas in urban areas, trucks are less often thestriking vehicle.9 According to O'Day and Kostyniuk, truck crashes involving head-on collisionand opposite-direction sideswipe crashes typically occur in rural areas, whereas angle collisionand same-direction sideswipe crashes typically occur in urban settings. The percentage of ruraltruck crashes resulting in at least one fatality is relatively low (4%); the percentage isconsiderably higher than that for urban crashes (0.6%).9
In summary, the findings of these studies provide evidence that mixed vehicle travel isdangerous, particularly for occupants of lighter vehicles. The incompatibility of passengervehicle and truck travel appears to be a contributing factor in many crashes. These findings
6

provide a rational basis for investigating the benefits and costs of separating light and heavyvehicle travel.
Objectives of EVFs
Lane restrictions have been provided and evaluated in several states as a means tominimize the interaction between light and heavy vehicles. Although increased safety andimproved highway operation are typically cited as the primary motivations for theirimplementation, these strategies have been used in some cases to achieve other goals, such asreducing pavement deterioration.
Several studies have identified potential benefits of facilities designed exclusively fortrucks. Stokes and Albert suggested that separating trucks from passenger vehicles will have thefollowing positive results: (1) improved traffic safety, (2) reduced conflicts, (3) adequatepavement and bridge structures, and (4) reduced maintenance costs. IO Likewise, Mannering et al.identified improvements in one or more of the following areas achieved by truck lanerestrictions: (1) highway operations, (2) safety, (3) pavement wear, and (4) operation and safetythrough construction zones. 11
Potential Economic Benefits and Costs of EVFs
The potential benefits, or cost savings, attributable to EVFs must be weighed against thecost of providing and maintaining such facilities. The basic premise underlying the concept ofseparating light and heavy vehicles is that highway operations will be improved and the numberand severity of crashes reduced. As a result, cost savings occur in travel time, vehicle operatingcost, lives saved, medical expenses, and property damage. In addition, energy consumption andenvironmental impacts are reduced. In calculating expenses, only those costs (engineering,construction, right of way, operation, and maintenance) directly attributable to the provision of aparticular separation strategy are normally included. Although very difficult to quantify,aesthetic impacts should also be considered. Decisions to provide additional capacity are notusually based on a benefit-cost analysis, and, therefore, one is typically not included. Certaincosts may increase or decrease as the result of the particular separation strategy implemented andshould be accounted for accordingly.
Factors Influencing the Feasibility of EVFs
No single factor appears to predominate in determining the economic feasibility ofseparating vehicle types. In identifying candidate highway segments where separation strategiesmight be appropriate, a number of factors are considered. These include average daily traffic(ADT), expected annual increase in traffic, vehicle mix percentage, and number and frequency of
7

crashes involving passenger vehicles and trucks. Based on test analyses, EVFs appear to be mostwarranted for congested highways where truck volumes exceed 30 percent of the vehicle mix.5
Human factors such as driver expectancy, perspective, and opinion are important as theywill dictate compliance with and the effectiveness of separating passenger vehicles and trucks.Cost, constructability, and maintainability are also factors in any decision regarding EVFfeasibility. Legal issues concerning lane restrictions must be addressed, and support from theenforcing agency is also necessary.
States' Experience with EVFs
Truck lane restrictions have been widely used throughout the United States, butdedicating lanes for the exclusive use of heavy vehicles is relatively novel. In several states inwhich a comprehensive study concerning the effectiveness of truck lane restrictions wasconducted (Florida, Nevada, Texas, and Virginia), the change in operation or safety wasnegligible. 11 However, lane restrictions did receive positive public reaction and high compliancefrom truck drivers. The potential effect on pavement deterioration rates seemed very positive,and no change in capacity was expected due to truck lane restrictions.
The Four Basic EVF Strategies
Four basic strategies have been used for EVFs: (1) inside lane, light vehicles only(ILLVO), (2) inside lane, heavy vehicles only (ILHVO), (3) outside lane, light vehicles only(OLLVO), and (4) outside lane, heavy vehicles only (OLHVO).
Inside Lane: Light Vehicles Only (ILLVO)
A common vehicle separation strategy is to designate the inside (far left) lane(s) for theexclusive use of light vehicles without using barriers (see Figure 2). Heavy and light vehicles arepermitted to use the remaining lanes. The advantages of this arrangement are that large trucksare not precluded from using the middle lane(s) for passing and enough room is typicallyprovided on the outside shoulder to accommodate emergency stops. Additionally, wide loadsand slow trucks are better accommodated in the slower outside lanes, which helps minimize theimpact on traffic flow, particularly on grades.
Limiting large truck travel to the outside lanes minimizes truck weaving nearinterchanges with right exits, particularly in urban areas where exits tend to be closely spaced. 12
Should median barriers be required, a comparative cost savings may be realized through the useof standard "Jersey" barriers in lieu of the more substantial barriers needed when heavy vehiclesare traveling in the inside lanes. 12
8

S LVL MVL MVL S
,i.i!~,S MVL MVL LVL S S LVL MVL MVL S
S MVL MVL S S LVL LVL S S LVL LVL S S MVL MVL S
till - Barrier S - Shoulder LVL - Light Vehicle Lane MVL - Mixed Vehicle Lane
Figure 2. Inside lane: Light vehicles only (nonbarrier and barrier separated)
Dedicating a lane exclusively for passenger vehicles is popular with drivers of light vehicles, as itreduces the large truck intimidation factor and is perceived as a safety improvement. However,several concerns exist with this separation strategy. Restricting trucks from the inside lane(s)will concentrate trucks in the outer lanes. As heavy vehicle volumes increase, gaps betweenheavy vehicles traveling in the outside lanes will be reduced, in effect forming a moving barrierand making it difficult and unsafe for other vehicles to merge or exit on the right. Given thathighway sign placement is typically above or to the right of the outside travel lanes, this laneassignment may cause visual impairment and sign blockage for smaller vehicles traveling in theinside lanes.
The concentration of repetitive heavy loading on the outside lanes will produceaccelerated deterioration, particularly if the existing pavement structure is not designed for thetotal truck traffic. 12 Middleton and Mason contended that this strategy provides a smallimprovement in highway operations. 13 They pointed out that in addition to operational concerns,enforcement of lane restriction violators is difficult because inside shoulder widths are often toonarrow to accommodate large vehicles and requiring stopping on the outside shouldersnecessitates multiple lane changes. Enforcement is further complicated near left exits whereheavy vehicles may enter the exclusive lane prematurely when preparing to exit.
9

Inside lanes for the exclusive use of light vehicles have been implemented in many states,often on grades where truck climbing lanes are provided. In most cases, studies were notperformed before or after implementation of the exclusive lanes. Therefore, the effect of thisstrategy on safety and traffic operations is difficult to determine, although the effect of truckclimbing lanes on grades is known. The 1994 Highway Capacity Manual (HCM) providesadditional information related to the effect of trucks on grades.
In 1984, lane restrictions were implemented on the Capital Beltway (1-495) in Marylandand Virginia to improve highway operations and reduce truck crashes. Along sections of theBeltway with a minimum of four lanes in one direction, large trucks were restricted from theinside lane. The restriction was originally applied to 9.48 km (5.89 mi) of the Beltway inVirginia and 50 km (31 mi) in Maryland but has since been extended to include the entire lengthof the Beltway. Before and after comparative studies conducted by both states indicated a highcompliance rate, but the apparent effect this change had on safety was disappointing. The truckcrash rate for the restricted section in Virginia increased from 139 crashes per 100 millionvehicle miles (MVM) of travel for the 2-year before period to 152 crashes per 100 MVM for the2-year after period. 14 In Maryland, the truck crash rate increased from 195 to 207 for the sameperiods. 15 Further, crash severity significantly increased in Maryland (injury rate increased by21 %), but virtually no change in injury rate occurred in Virginia. 14, 15
Although overall crash rates increased in both states, they were not significant and weremost likely attributable to increases in traffic volume and subsequent congestion. Interestingly,sideswipe crashes increased significantly in Maryland from 96 crashes per 100 MVM before therestriction to 119 crashes per 100 MVM after its implementation. 15 This may be explained inpart by an increase in large through trucks using the outside lanes, which must also be used byother vehicles for weaving near interchanges. 15
Inside Lane: Heavy Vehicles Only (ILHVO)
Another method of separating heavy and light vehicles is to designate the inside lane(s)for the exclusive use of heavy vehicles (see Figure 3). Outside lanes are reserved for mixedtraffic use. Inside lane exclusive truck facilities may be appropriate in rural areas where exits arewidely spaced and their use by through trucks is rare. If highway widening is required to provideadditional lanes, this method can best use the existing median right of way. New lanes may thenbe specifically designed to carry the greater load of trucks rather than having all lanes designed tothe same standard. 13
A disadvantage of this method is that trucks traveling in the exclusive lane must pass onthe right when only one exclusive lane for trucks exists. Also, oversized and/or slow movingtrucks traveling in this lane will impede the flow of traffic. Therefore, it may be necessary toprovide two exclusive heavy vehicle lanes to avoid having these slower vehicles traveling in the
10

S MVL MVL HVL HVL MVL MVL S
S HVL MVL MVL S
,~ liil_,fj~;I~!'~ IW-----.....'S MVL MVL HVL S
S
_________I~...........CDI ....I ~IooliiiiiiCD....CD ......' ~f0 rUI ~MVL MVL S S HVL HVL S S HVL HVL S S MVL MVL S
fJj - Barrier S - Shoulder HVL - Heavy Vehicle Lane MVL - Mixed Vehicle Lane
Figure 3. Inside lane: Heavy vehicles only (nonbarrier and barrier separated)
mixed vehicle lanes. Further, assigning heavy vehicles to the passing lane is contrary to normalpractice and might be unsettling to some drivers. Last, where interchanges are closely spaced,trucks will be forced to make multiple lane changes, creating a possible safety hazard. 16
This strategy of designating the inside lane(s) exclusively for trucks has not been tried inthe United States. A joint project was proposed by the Florida and Georgia departments oftransportation on 1-75/I-475 between Tampa and Atlanta to study, in part, the use of the insidelane as an exclusive truck lane through the middle portion of the 715-km (444-mi) project. I7
Apparently, this proposal never advanced because of a lack of funding to pay for this costlyinitiativee
Outside Lane: Light Vehicles Only (OLLVO)
Another vehicle separation strategy often employed to reduce pavement wear is toexclude trucks from using the outside lane(s), except near interchanges (see Figure 4). On mostmultilane facilities, heavy vehicles tend to travel in the slower outside lanes, thereby subjectingthese lanes to accelerated pavement deterioration from repetitive heavy 10ading. II One method ofpavement management is to restrict heavy vehicles from the outside lane(s), causing a shift of
11

S LVL MVL MVL S MVL MVL LVL S
S LVL MVL MVL S S MVL MVL LVL S
S LVL LVL S S MVL MVL S S LVL LVL S
till - Barrier S - Shoulder LVL - Light Vehicle Lane MVL - Mixed Vehicle Lane
Figure 4. Outside lane: Light vehicles only (nonbarrier and barrier separated)
loading to the less heavily traveled inside lanes, thus evening out pavement wear. Only lightvehicles would use the outside lane(s), with mixed traffic in the remaining lane(s). This strategyhas similar safety and operational advantages and disadvantages as ILHVO.
This method of decreasing and evening out pavement wear has been implemented inseveral states but only as a temporary measure until pavement rehabilitation was completed.Idaho, Nevada, North Carolina, and Wisconsin have used it on a voluntary, unenforced basis.Pavement improvements in some areas were postponed for several years as a result of therestrictions.
Outside Lane: Heavy Vehicles Only (OLHVO)
The fourth option for separating passenger vehicles and trucks is to designate the outsidelane(s) for the exclusive use of heavy vehicles with the remaining lanes available for mixedvehicle travel (see Figure 5). This strategy is very similar to ILLVO in that it results in a largeconcentration of heavy vehicles in the outside lane(s). Light vehicles are restricted fromtraveling in the outside lane(s) except to exit and merge. ILLVO and OLHVO have similaradvantages and disadvantages. An additional benefit of OLHVO is that less weaving occurswhen trucks are not restricted to the exclusive lane(s) and, accordingly, may travel in inside lanes
12

-----,~!~!S HVL MVL MVL
~~~___---'-'W '~ ,~ ,S HVL MVL MVL S
S MVL MVL HVL S
,~ ,ULW_____......S MVL MVL HVL S
S
~""'IU_!fJ,_::_,i,~L Ij I~I~IHVL HVL S S MVL MVL S S MVL MVL S S HVL HVL S
{jj - Barrier S - Shoulder HVL - Heavy Vehicle Lane MVL - Mixed Vehicle Lane
Figure 5. Outside lane: Heavy vehicles only (nonbarrier and barrier separated)
when preparing for an inside exit or when first approaching the lane restriction. However,enforcement of the restrictions for light vehicles in the exclusive lane(s) is difficult nearinterchanges because passenger vehicles weave to the outside lane for exiting or when attemptingto merge.
The use of OLHVO was not referenced in the literature. However, the previously citedFlorida/Georgia proposal included several highway sections in which the outside lanes were to bedesignated exclusively for trucks.
Exclusive Lanes with Barrier Separation
In the previously described traffic separation strategies, highway signage and/or pavementmarkings are typically used to control the separation of light and heavy vehicles. However, fixedor moveable concrete barriers may be used to provide more positive separation. Barriers arethought to enhance safety, as heavy and light vehicles are physically separated, significantlyreducing the probability of a collision between the two. The use of barriers may be especiallybeneficial in rural areas, where incidents of drivers falling asleep and drifting into another laneare more common.9 In addition, barrier-separated lanes ensure total control over entering andexiting maneuvers. 13
13

Figure 6. Variable passing lane for barrier-separated facilities
Aside from the additional right-of-way and construction costs, providing barrier-separated travellanes poses several operational problems. Barrier-separated segments through interchange areasrequire either (1) special interchange designs to allow all vehicles the opportunity to exit ormerge, or (2) gaps in the barrier in the vicinity of interchanges. To maintain proper traffic flow, aminimum of two travel lanes are needed on either side of the barrier to allow the opportunity forpassing. To maximize the use of a narrow existing median where four lanes do not exist andright-of-way availability is limited, a variable passing lane may be used (see Figure 6); however,this configuration may contribute to crashes where the left lane ends. In designing a cross sectionto accommodate the addition of a barrier-separated lane(s), greater lane and shoulder width istypically required compared with providing a nonbarrier-separated lane(s).
Barrier-separated facilities create an enforcement problem since they essentially requirethat patrols be doubled in segments in which lanes are physically separated to maintain the samelevel of enforcement that existed prior to separation. Providing a means for adequate access toall lanes in the case of an emergency is also a legitimate concern.
Separate Roadways for Light and Heavy Vehicles
Separate roadways for light and heavy vehicles is a variation of the concept of separatingspecific vehicle types on the same highway section. Separate roadways may be either parallel orisolated. As with barrier-separated travel lanes, separate roadways are intended to eliminateconflicts between vehicle types, with the result being improved operations and safety.
Separate facilities avoid some of the operational problems associated with barrierseparated lanes but require more right of way, separate sign structures, and special designtreatments to allow interchanges to be shared and thus tend to be significantly more costly. At
14

times, parallel separate facilities may need to be shared by all vehicles, such as when a crashcloses one roadway and all traffic must be diverted to the other. Therefore, it is prudent that alllanes be designed to withstand heavy vehicle loads, therefore eliminating possible savingsbecause of thinner pavement designs for the lanes designated for light vehicles. However,pavement may be specially designed for the heavy vehicle segment to withstand heavier loading,thereby reducing the frequency of resurfacing in those lanes.
The separate roadway concept is in effect for 53 km (33 mi) of the New Jersey Turnpike.The majority of the section has six lanes in each direction, with the interior three-lane sectiondesignated for light vehicles and the exterior three-lane section designated for local traffic, buses,and heavy vehicles. Of the section, 14.5 km (9 mi) has two lanes on the exterior section withthree lanes on the interior. 18 Directional flow is separated by a concrete median barrier, withmetal beam guardrail and shoulders between the interior and exterior sections.
The distribution of light vehicle traffic across the facility is 40 percent in the exteriorlanes and 60 percent in the interior lanes, and the truck compliance rate is high. 18 The purpose ofproviding separate roadways was to improve traffic management through automated trafficcontrol and increased flexibility when parts of the Turnpike had to be closed because of crashesand maintenance. However, this design is also believed to enhance safety; the truck crash ratesfor this section and other portions of the Turnpike are significantly lower. 18
Separate truck facilities exist on 1-5 in Los Angeles, California, and Portland, Oregon.Both facilities require trucks to leave the main roadway yet permit passenger vehicles to travel onthe main roadway or the separate facility for trucks. The facility in Los Angeles was constructedto reduce weaving-related conflicts involving heavy vehicles. The facility in Portland was builtto reduce weaving and minimize delays created by slower moving trucks on significant grades. 18
Designated Truck Routes
Designated truck routes are implemented mainly in urban areas. "Through truck routes"and highway "business" or "bypass" routes exist in several states. In some locations, they areimposed to circumvent heavy vehicle traffic around congested city roadways or prevent trucksfrom traveling on routes with inadequate geometric design. Other route restrictions ban vehiclescarrying hazardous materials and reroute them through low-population areas. To reduce theadverse impacts of heavy vehicles in the traffic mix, through trucks approaching Atlanta,Georgia, are restricted from freeways within the 1-285 loop and must remain on 1-285. Similardesignations have been imposed on a voluntary basis in Minneapolis/St. Paul and on 1-710 in LosAngeles. Both jurisdictions report nominal effects as a result of these voluntary bans. 18
15

Time-or-Day Restrictions
The specific implications of time-of-day restrictions are not well known. The results of a1975 Urban Mass Transit Administration study suggested that a complete ban of truck traffic onurban freeways during daylight hours could increase average network speeds by about 16 km/h(10 mph) during peak hours. 16 This estimate assumes that additional capacity created through theremoval of trucks would not be consumed by latent travel demand. Safety benefits of time-ofday restrictions are also questionable. For example, fewer and less frequent delays attributable totruck crashes and less impedance of traffic attributable to slow trucks have been speculated. II
However, truck crashes (like truck travel) tend to peak during off-peak hours. The fact thatoperating speeds are much higher during off-peak periods suggests that operating speed and nottime of day could be the problem. 16
Another concern with restricting trucks from using certain routes or lanes duringspecified time periods is that some trucks may be forced to travel on parallel auxiliary routes,insufficiently designed for the increased truck volume, resulting in subsequent crashes and/ordelay. Also, time-of-day restrictions raise legal issues, may be difficult to enforce, and may beopposed by the public if they adversely affect delivery schedules.
Although there are potential benefits associated with imposing traffic regulations duringspecified hours, this is not usually done for legal loads. Time-of-day restrictions usually apply tooversized or overweight trucks; they are restricted during nighttime hours from traveling onspecific roadways to increase safety or during peak periods to prevent traffic flow impedimentattributable to slower travel speeds. 11
In 1988, Florida conducted a 6-month experiment that involved the restriction of trucksfrom the leftmost lane of 1-95 in Broward County between 7 A.M. and 7 P.M. For this study, atruck was defined as any vehicle having three or more axles. A high level of truck drivercompliance (98%) was achieved. Although crashes for all vehicles decreased 2.5 percent for a24-hour period, the crash rate during the prohibition period rose 6.3 percent. I8 However, theproportion of crashes involving trucks decreased 3.3 percent during the hours of the restriction. I8
Despite an overall increase in the crash rate during the prohibition period, drivers reportedly feltsafer with the truck lane restriction.
Reduced Pavement Wear Strategies
The primary objective of truck lane restrictions is to improve highway safety andoperations. Truck lane restrictions have also been found to be an effective means of extendingthe life of highway pavements. The greatest proportion of trucks traveling on interstate andprimary highways travel in the outside lane. Given that trucks do the greatest damage to highwaypavements, pavement performance can be improved by redistributing trucks more evenly acrossthe highway cross section, thus reducing the frequency of pavement rehabilitation.
16

Some jurisdictions with a high percentage of truck traffic design pavement to withstandhigher loads and thereby increase time between resurfacing. Improved pavement mixes andthicker pavement sections may contribute to decreased pavement wear, and roads may be initiallydesigned dependent on expected truck volumes per lane. In this manner, a new lane(s) designedfor the exclusive use of trucks can help extend the life of the entire roadway section.
Advantages and Disadvantages of EVFs
The four basic vehicle separation strategies (ILLva, ILHVO, OLLva, and OLHVO) arethought to improve traffic operations and safety by minimizing the interaction between heavy andlight vehicles. Concrete barriers provide more positive separation. However, each strategy hasadvantages and disadvantages that should be considered, as summarized in Table 1.
Table 1. Advantages and disadvantages of exclusive vehicle facility strategies
Option Advantages Disadvantages
Nonbarrier Separated
ILLVO Trucks better accommodated in outside Truck concentration creates moving barrierlanes Accelerated pavement wear in outside lanesTrucks can pass Signs blocked by large trucksLess truck weaving near interchangesReduced truck intimidation factor
ILHVO Through trucks better accommodated More truck weaving near interchangesReduced pavement wear in outside lanes
OLLVO Reduced truck intimidation factor More truck weaving near interchangesReduced pavement wear in outside lanes
OLHVO Trucks better accommodated in outside Truck concentration creates moving barrierlanes Accelerated pavement wear in outside lanesTrucks can pass Signs blocked by large trucksLess truck weaving near interchanges
Barrier Separated
ILLVO/OLHVO More positive separation Need minimum of 4 lanes in one directionReduced truck intimidation factor Requires special treatment near
interchangesDoubles enforcement requirements
ILHVO/OLLVO More positive separation Need minimum of 4 four lanes in oneReduced truck intimidation factor directionReduced pavement wear in outside lanes Requires special treatment near
interchangesDoubles enforcement requirements
17

SURVEY OF STATE TRANSPORTATION AGENCIES
Truck Travel Strategies
Truck travel strategies designed to improve traffic operations and safety can besubdivided into four categories: (1) lane restrictions, (2) route designations, (3) routerestrictions, and (4) time-of-day restrictions. The survey found that 29 of 50 states (58%) haveimplemented one or more of these strategies. Table 2 summarizes the practices used in eachstate.
Truck Lane Restrictions
Lane restrictions for trucks have been implemented on freeways in many states to addressthe problems of safety, traffic delays, and pavement deterioration. Two general types of lanerestrictions exist. Trucks are restricted to the outside lane(s) usually to improve traffic operationsand/or increase the level of safety. Restrictions of this sort are typically mandatory, but the levelof enforcement varies from state to state. Trucks are restricted to the inside lane(s), usually on atemporary, voluntary basis, to decrease the rate of pavement deterioration on the more heavilytraveled outer lanes. Most lane restrictions are implemented on a site-specific basis, but somestatewide policies exist (e.g., California and Georgia). Half of the states impose lane restrictionson trucks on at least some of their highways. Table 3 summarizes the truck travel practices usedin each state.
Designated Truck Routes and Lanes
Nine states (18%) designate specific routes or lanes for use by trucks. Though most truckroutes may be used by other traffic, only California designates routes to be used exclusively bytrucks. Oregon is the only state that designates a lane for the exclusive use of heavy vehicles.Truck routes are usually designated to prevent through traffic from entering urban areas and aretypically selected based on their ability to carry heavier loads. Table 4 provides a summarydescription of designated truck routes and lanes throughout the United States. This list may beincomplete as a result of respondents failing to consider freeway bypasses as truck routes.
Restricted Truck Routes
Only nine states (18%) prohibit truck travel on certain freeway sections. Routerestrictions are typically imposed in urban areas to reduce congestion, although route restrictionshave also been imposed for safety enhancement on routes with steep downgrades or inadequatestructures. States imposing truck route restrictions are summarized in Table 5.
18

Table 2. Summary of U.S. truck travel strategies
Lane Truck Route Route Time-of-DayState Restriction Designation Restriction Restriction
Alabama
Alaska
Arizona X
Arkansas
California X X
Colorado X
Connecticut X
Delaware
Florida X X
Georgia X X
Hawaii X
Idaho X
Illinois X
Indiana X X
Iowa
Kansas
Kentucky X X
Louisiana
Maine
Maryland X X X
Massachusetts
Michigan X
Minnesota
Mississippi
Missouri
Montana
Nebraska X
Nevada X
New Hampshire
New Jersey X X
New Mexico
New York X X
North Carolina X
North Dakota
Ohio
Oklahoma
19

Lane Truck Route Route Time-of-DayState Restriction Designation Restriction Restriction
Oregon X X
Pennsylvania X X X
Rhode Island X X
South Carolina
South Dakota
Tennessee X
Texas X X
Utah X
Vermont X
Virginia X X
Washington X
West Virginia
Wisconsin X X
Wyoming X
Total 25 9 9 2
20

Table 3. Summary of U.S. truck travel practices
Restricted Restriction Location of Purpose of Mandatory or Compliance &State Vehicles Type Restriction Restriction Voluntary Enforcement Notes
Calif. Vehicles Restricted to Statewide Improve traffic Mandatory Medium Right lanes designed for heavier loadstowing trailer rightmost lane operations (move compliance and
except for slower vehicles enforcementpassing into right lane)
Colo. Trucks l Restricted Site specific: Reduce concrete Voluntary High In effect on short-term basis untilfrom very short pavement compliance rehabilitation completed (no changerightmost lane interstate deterioration noticed in pavement condition)
segments
Conn. Commercial Restricted Site specific: Increase safety; Mandatory Highvehicles from leftmost 1-91 (approx. reduce heavy compliance
lane 24 km); 1-95 vehicleintimidation;maintain hightravel speeds inleft lane
Ga. Vehicles with 2 directional Statewide Mandatory Low compliance6 or more lanes,tires restricted
from left laneexcept topass; 3 lanes,restricted to 2right lanes
Idaho Trucks, 1 buses Restricted to Site specific Reduce pavement Voluntary Medium In effect less than 2 yearsleftmost lane deterioration compliance
(postponeresurfacing)
21

Restricted Restriction Location of Purpose of Mandatory or Compliance &State Vehicles Type Restriction Restriction Voluntary Enforcement Notes
111. Vehicles over Restricted to 2 Site specific: Improve traffic Mandatory High Restriction reduced delays especially7,264 kg rightmost near Chicago operations; except near left compliance; low during peak hours; improved traffic
lanes increase safety exits enforcement operations by reducing gaps caused byslower trucks; apparent increase insafety by reduced weaving (not proven)
Restricted to Site specific: Reduce pavement Voluntary Medium In effect approximately 1 yearleftmost lane south of deterioration compliance
Springfield
Ind. Trucks, 1 truck Restricted Statewide: Improve traffic Mandatorytractors, semi- from leftmost where 3 or operations;trailers, truck lane more lanes in increase safetytractor- one directionsemitrailers
Ky. Trucks l Restricted to Site specific: Improve traffic Mandatory Highrightmost lane 1-75 S. out of operations; compliance and
Cincinnati increase safety on enforcementsteep grades
Md. Vehicles over Restricted to 2 Site specific: Improve traffic Mandatory High4,540 kg rightmost Baltimore operations; compliance andGVW lanes Beltway and increase safety enforcement
CapitolBeltway
Mich. Vehicles over Restricted to 2 Statewide Improve traffic Mandatory High Implemented circa 19864,540 kg rightmost when 3 or operations; except complianceGVW lanes more increase safety reasonable
directional distance fromlanes left exit
22

Restricted Restriction Location of Purpose of Mandatory or Compliance &State Vehicles Type Restriction Restriction Voluntary Enforcement Notes
Neb. Trucks! Restricted Site specific: Reduce pavement Voluntary High 13-16 km lane restriction in effect infrom no current deterioration compliance east-central Nebraska for 18 morightmost lane restrictions (asphalt rutting was main concern)
imposed
Nev. Trucks! Restricted Site specific: Reduce pavement Voluntary High Duration of restriction dependent onfrom 19-32 km deterioration compliance time required to restore pavementrightmost lane segments of
interstate withasphalt rutting
N.J. Vehicles over Restricted Statewide: Improve traffic Mandatory High In effect for very long time4,540 kg from leftmost any divided operations; complianceGVW (buses lane highway with increase safetyexcluded) 3 or more
directionallanes
N.Y. Vehicles Restricted Site specific: Increase safety; Mandatory In effect several miles before 1-90/1-878,172 kg from leftmost New York keep through interchange to improve exitingGVWor lane Thruway, trucks away from maneuver of passenger vehiclesgreater 1-90/1-87 major interchanges
interchange
N.C. Trucks! Restricted to Site specific: Improve traffic Mandatoryrightmost lane 1-40WB from operations;
US 276 to increase safetyTenn. stateline
Ohio Voluntary climbing lanes provided onsome grades
23

Restricted Restriction Location of Purpose of Mandatory or Compliance &State Vehicles Type Restriction Restriction Voluntary Enforcement Notes
Ore. Motor trucks Restricted to Site specific: Increase safety Mandatory High Due to heavy truck travel in right lane,greater than rightmost lane 1-5 where compliance section of highway changed to concrete3,632 kg steep and widened from 3.66 to 4.27 mGVW that can upgradescarry a load exist; other
routes
Pa. Trucks! Restricted to Site specific: Improve traffic Mandatory High Turnpike signed: "Slower Trucks Rightrightmost lane long, steep operations compliance and Lane" or "No Trucks Left Lane"
uphill grades enforcement
R.I. Buses (10 or Restricted to 2 1-95, 1-195, Improve traffic Mandatory Medium Citations issued where restrictionsmore passen- rightmost 1-295 operations; compliance posted (fines do not exceed $25); policygers), lanes (except increase safety revised 6 times in past 65 yearscampers, 1.61 kmtrailers, before leftvehicles with exit)camper ortrailer,commercialvehicles
Tenn. Commercial Restricted to 2 Site specific: Increase safety Mandatory High 1-24 has stopping lane (trucks must stopvehicles rightmost 1-24 in compliance; low before descending); runaway truck
lanes mountainous enforcement ramps provided adjacent to inside lanesareas; 1-75 on (runaway trucks must weave to inside)downgrades
Tex. Trucks! Restricted to Site specific: Increase safety Mandatory Mediumrightmost lane 1-10 east of compliance
Katy
24

Restricted Restriction Location of Purpose of Mandatory or Compliance &State Vehicles Type Restriction Restriction Voluntary Enforcement Notes
Utah Trucksl Restricted to Site specific: Improve traffic Mandatory Low Restriction had positive effect in onerightmost lane 8 km section operations enforcement location (too early to draw conclusion
of 1-80 near of overall effectiveness)Salt Lake City
Va. Vehicles Restricted Site specific: Improve traffic Mandatory Low compliance3,405 kg from leftmost 1-81,1-495 operations andGVWor lane safetygreater
Wash. Vehicles over Restricted to Site specific: Improve traffic Mandatory High Pavement markings used to denote4,540 kg rightmost or 1-5, 1-90, operations compliance restrictionGVW leftmost lane 1-405
(usuallyrightmost)
Wis. Vehicles over Restricted to Site specific: Reduce pavement Voluntary High Site was rehabilitated2,724 kg leftmost lane marshy areas deterioration complianceGVW
Wyo. Trucks,l Restricted to 2 Site specific: Improve traffic Mandatory Mediumrecreational rightmost 1-80 near operations compliance andvehicles lanes Rock Springs enforcement
and Evanston(3.22 km)
lThese states do not provide a definition of truck for the purpose of imposing lane restrictions.
25

Table 4. Designated U.S. truck routes and lanes
Location of Exclusive forState Policy Purpose Restriction Trucks? Notes
Calif. Truck routes Reduce North of Trucks only, Mandatory truckdesignated in weaving near Los Angeles mandatory routes enforced;urban areas interchanges pavement
Downtown Recommended designed forLos Angeles for trucks heavier loads
Ind. Roads Truck routes Northwest Not exclusiveclassified as recommended industrial"heavy duty" or based on corridor"extra heavy highwayduty" geometrics
Md. Truck routes Route 40 near Not exclusivedesignated Aberdeen and
other routes
N.J. Separate Improve traffic N.J. Turnpike Not exclusive, Approx. 40% offacility operations (separate mandatory cars use separateprovided facility parallel facility
to main route)
N.Y. Short bypasses Reduce traffic Urban areas Not exclusive,around urban congestion mandatoryareasdesignated
Ore. Truck lane Reduce delays 1-5 on steep Trucks only, Truck laneprovided on steep upgrades mandatory separated from
upgrades other traffic bypavementmarkings
Pa. Truck routes Site specific Pavement notdesignated specially designed
for heavierloading
Tex. Truck routes Reduce Urban areas Not exclusive Truck routesdesignated congestion designated by
local jurisdiction
Wis. Truck routes Reduce Urban areas Not exclusive,recommended congestion mandatory in
larger cities
26

Table 5. Summary of U.S. truck route restrictions
State Policy Purpose Location Notes
Ariz. Trucks restricted Prevent heavy loadings Site specificfrom specific on inadequateinterstate routes structures
Fla. Trucks restricted Prevent heavy loadings Site specificfrom specific on inadequateinterstate routes structures
Ga. Trucks restricted Improve traffic 1-285 in Tickets written forexcept for operations Atlanta violationspickup/delivery
Ky. Trucks restricted Improve traffic Statewide Route restrictions imposedfrom interstates operations, increase based on road geometrics,based on size and safety, reduce structures, etc.weight pavement deterioration
Md. Trucks restricted Improve traffic Baltimore-from specific operations, increase Washingtonfreeway routes safety Expressway
Pa. Trucks restricted Improve traffic Site specific:from sections of operations, increase long, steepspecific routes safety downgrades
R.I. Twin 16.2-m trailers Increase safetyrestricted fromspecific freeways
Va. Trucks restricted Improve traffic Site specific:from sections of operations 1-66,1-264specific interstateroutes
Vt. Trucks restricted Prevent truck traffic Route 105from specific through main street of through St.section of freeway town Johnsburg
Truck Time-of-Day Restrictions
Two states (4%) reported the use of time-of-day restrictions to regulate heavy vehicleoperation. Florida uses them during peak traffic hours in urban areas with high ADTs. Hawaiirequested and has received the voluntary compliance of trucking companies to refrain from usingspecified highways during the morning peak travel hours. Additional time-of-day restrictionsmay exist, especially in urban areas, as respondents to the survey representing state agencies maybe unaware of local practices.
27

Summary
Among the truck travel strategies addressed in this survey, restricting trucks from usingspecified lanes is the most widely used, with more than half of the states imposing some type oflane restriction. When truck lane restrictions are imposed, trucks are usually directed to travel inthe outside lane(s). Two states, California and Oregon, provide exclusive truck facilities.California designates a mandatory truck-only route to improve safety. Oregon designates amandatory truck-only lane to reduce delays for other motorist on steep grades. Strategies beingused in other states include designated truck routes, route restrictions, and time-of-dayrestrictions.
EVFS ANALYSIS OF VIRGINIA'S INTERSTATE 81
An analysis of 1-81 using the EVFS format was conducted. The major steps involved (1)sensitivity testing, (2) site selection, (3) data collection, (4) program updating, and (5) applicationof the program to 1-81.
Exclusive Vehicle Facilities (EVFS) Program
EVFS is an analysis format for determining the economic feasibility of separatingpassenger vehicles and trucks on limited-access facilities either by designating existing lanesand/or constructing additional ones.5 The program, written in Basic, offers the user the choice oftwo analysis formats called Levell and Level 2. A complete listing of Levelland Level 2 datainput parameters is presented in Appendix B.
Level 1 is a quick analysis format that requires few user inputs and is used to obtain asketch evaluation of many alternatives. Level 1 outputs provide guidance as to whichalternatives may warrant further examination in Level 2.5
Level 2 is a detailed approach requiring 57 data inputs. Default values are provided for41 of the 57 input variables, but users may substitute their own values for any of the inputs.Default cost are in 1985 dollars, as are the vehicle operating cost tables referenced by theprogram. Input variables are subdivided into five categories: (1) General Site Information, (2)Traffic Characteristics, (3) Other Factors, (4) Facility Construction and 4R Work Cost, and (5)Value-of-Time and Accident Costs.
EVFS calculates the NPW and BCR for each alternative being considered. Potentialbenefits or cost savings accounted for in the program includes:
• travel time savings due to faster traffic flow
28

• vehicle operating cost savings due to improved traffic flow
• injury and property damage savings due to fewer severe accidents
• travel delay savings due to fewer blockages causing accidents.
The analysis format also accounts for the following project costs:
• engineering and construction
• right-of-way acquisition and demolition
• periodic pavement resurfacing (which may be less frequent for light vehicle lanes).
Several lane assignment configurations for light, heavy, and mixed vehicle travel areconsidered in the analysis format. Light vehicle lanes can be used by motorcycles, automobiles,pickup trucks, light vans, buses, and trucks weighing less than 4,540 kg (10,000 lb) GVW. Onlysingle-unit trucks weighing more than 4,540 kg (10,000 lb) GVW and all combination-unittrucks can travel in heavy vehicle lanes. Mixed vehicle lanes can be used by both light and heavyvehicles. The analysis format is designed to evaluate the following scenarios:
• Case 0: two or more existing lanes, no restrictions
• Case 1: three or more existing lanes, restrict one or more lanes to light and/or heavyvehicles
• Case 2: two existing lanes, add one or more lanes (no lane restrictions)
• Case 3: two existing lanes, add one or more lanes (impose nonbarrier-separated lanerestrictions)
• Case 4: two existing lanes, add one or more lanes (impose barrier-separated lanerestrictions).
The purpose of the base case (Case 0) is to establish existing conditions for comparisonwith other scenarios. Case 1 is appropriate for evaluating highway segments with three or moreexisting lanes in one direction. For two lanes in each direction, Cases 2, 3, and 4 are appropriate.Case 2 examines the option of allowing use of all lanes by both light and heavy vehicles after oneor more additional lanes have been provided. Cases 3 and 4 involve the addition of eithernonbarrier- or barrier-separated lanes, of which lane restrictions (for either light or heavyvehicles) are imposed. The analysis format is described in the decision tree diagram shown inFigure 7.
29

Do three or morelanes exist?
----yES------1---- NO ---
I"- ~....~.I Case 0: Base Case 11........1-------1
r"1 (No Lane Restrictions) 1""I
____----.......1 Case 1: Impose Lane I.... 1 Restrictions on Existing Lanes
-----....~I Add Lanes l'·~------,1-_-------_----11
"Case 2: Add Lane(s)(No Lane Restrictions)
Case 3: Add Lane(s)and Impose Lane
Restrictions(Nonbarrier Separated)
Figure 7. EVFS alternatives decision tree
Case 4: Add Lane(s)and Impose Lane
Restrictions(Barrier Separated)
The EVFS program has several limitations. It cannot be used to evaluate the costeffectiveness of HOV lanes or toll facilities. Also, EVFS is not designed to evaluate the need forhill climbing lanes. Further, EVFS does not include demand forecasting in its calculationsthough future demand is considered in the analysis. On the other hand, EVFS can be used toevaluate reversible lanes options.
Sensitivity Analysis
BCR and NPW for alternative lane strategies are calculated in Level 2 based on thevalues provided for the 57 user inputs. Different input values yield different results. Forinstance, a discount rate of 4 percent produces higher BCRs than does a discount rate of10 percent, assuming all other inputs are held constant, since lower interest rates reflect lowerconstruction and maintenance costs. Figure 8 shows how BCR varies with discount rate for threehypothetical scenarios (Scenarios A, B, and C). The results are consistent with the known effectsof discount rates. A description of each scenario is provided in Appendix C.
An attempt was made to determine if other general relationships exist. Data for ScenariosA, B, and C were input into the program to produce initial results. Next, one or several inputs
30

3.5
3
0~ 2.5asa:...U)0 2uI...
ij:Q)c:
1.5Q)
m
1
0.5
O---'--.,...-t-----+-......,.--.,..--+--....- .....~-.......- ........- .......- ......-~- .......0.01 0.03 0.05 0.07 0.09
Discount Rate
0.11 0.13 0.15
1 Case A -¥= Case B ...... Case C
Figure 8. BeR vs. discount rate
were then examined to reveal relationships between changes in inputs and the results. For likechanges in inputs, the three scenarios were compared to determine if the outputs were consistentrelative to each other.
Although it was impractical to consider all possible data combinations, a number of inputcombinations were evaluated for each scenario. In nearly all cases, the model produced resultsthat were interpreted to be reasonable. In rare instances, the results could not be easilyunderstood. For example, in testing the sensitivity of the results to changes in vehicle mixpercentage, questionable outputs were produced for Scenario B when a vehicle mix of 30 percentlight vehicles (LV), 7 percent single-unit vehicles (SU), and 63 percent combination vehicles(CV) was designated. Likewise, no output was generated when a vehicle mix of 30 percent LV,35 percent SU, and 35 percent CV was assigned (see Figure 9). These results might be explainedby the fact that these mix percentages are not reasonable and fall outside the scope of theprogram's capability to produce legitimate resllits.
31

30-,--------------------------------..
564928 35 42
Single-Unit Percentage
211470.1
--------------~}<--------------------------------------------------------
//\\5 .:ioo
.::\: -----------------------------------------------------
0/ \~:.
7· '~.~
0-'---+---+-----+---0+------+----+-----+----+0----+----+---.0;--.....63 69.9
.....en8 15 ----------------------------------------------- -----------------------------------------------------------------------------I.....~Q)c~ 10
o 20~a:
25 ----- -----------------------------------------------------------------------------------------------------------------------
I..... Case A ~~ CaseS ... CaseC
Figure 9. HeR vs. 30% light vehicle and variable single-unit vehicle and combination vehicle percentages
Site Selection Process
To demonstrate the application of the program, a test section was selected. Using theselection criteria described, the 50.7-km (31.5-mi) segment of 1-81 in Virginia, located betweenU.s. Routes 460 and 220, was used.
Selection Criteria
The selection of a test site was based on eight selection criteria: (1) facility accesscontrol; (2) ADT; (3) percentage of large trucks in the vehicle mix; (4) number of collisionsinvolving light and heavy vehicles; (5) inclusion in VDOT's Six-Year Improvement Program;(6) number of lanes; (7) topography; and (8) practical considerations (e.g., availability of data,distance from VTRC).
The first criterion was used to identify controlled-access sites (an EVFS programrequirement). The next three criteria were used to locate sites with a relatively high trafficvolume, percentage of large trucks, and number of crashes involving passenger vehicles and
32

trucks, as facilities with these characteristics are more likely to benefit from exclusive lanetreatments. Inclusion in VDOT's Six-Year Improvement Program was used as a criterionbecause it lists high-priority locations in the corridor. Variable number of lanes andtopographical diversity were used as criteria because of the opportunity to evaluate alternativesunder various geometric operating conditions. Last, factors such as availability of data andproximity to VTRC were used as criteria for practical reasons.
The search for candidate sites was limited to 1-81 because of the large percentage oftrucks that use this facility relative to other controlled-access facilities in Virginia. On 1-81, fivecandidate sites were identified. Table 6 lists the sites and provides descriptive informationconcerning each segment.
Table 6. I-81 candidate analysis test sites
TotalLength 1993 % Large LVIHV 6-Yr
Site Location (km) ADT Trucks Collisions Plan Other
1 Fr: U.S. Rte. 460 50.7 39,500 24 52 Yes 4- and 6-lane sectionsTo: U.S. Rte. 220 Extensive accurate data
2 Fr: U.S. Rte. 220 66.8 28,000 31 36 NoTo: 1-64 West
3 Fr: 1-64 West 48.3 31,300 31 29 Yes Near CharlottesvilleTo: 1-64 East
4 Fr: Va. Rte. 211 54.7 25,000 35 26 NoTo: U.S. Rte. 11
5 Fr: U.S. Rte. 11 41.9 31,100 29 33 YesTo: W.Va. State Line
LV/HV = light vehicle/heavy vehicle.
Site Selection
Although EVFS could have been easily applied to any of the five sites, Site 1 was chosenbecause in addition to having the highest ADT and number of LVIHV collisions and anacceptable percentage of large trucks in the vehicle mix, it is included in VDOT's Six-Year Plan,was diverse in terms of topography, had sections with both two and three lanes in one direction,and much of the needed data were readily available. In addition, Site 1 is a moderate drivingdistance from VTRC; contains several sections with an exclusive light vehicle lane; has a leftexit, a truck weigh facility, and a rest area facility; and intersects the proposed "Smart Road" and1-73. The Smart Road is a proposed 9.2-km (5.7-mi) automated highway that would provide adirect link between Blacksburg and 1-81.
33

Site Description
Interstate 81 is a major north-south interstate corridor that links Canada in the north to thesoutheastern United States in the south through the states of New York, Pennsylvania, Maryland,Virginia, and Tennessee. In Virginia, 1-81 is classified as a rural freeway, with four lanesthroughout. The portion of 1-81 that incorporates the study site traverses the rugged terrain ofsouthwestern Virginia. This section was constructed in the early to mid-1960s and was designedto carry 6 percent large trucks. Today, of the 40,000 vehicles that travel this section daily,approximately 25 percent are large trucks.
Figure 10 depicts 1-81 through Botetourt, Roanoke, and Montgomery counties. Theanalysis site is bounded by U.S. Route 460 (south end) and U.S. Route 220 (north end). On twoshort stretches near Christiansburg, a climbing lane is provided to compensate for steep grades(+4%). Southbound, heavy trucks are also restricted from traveling in the inside lane on thesesections.
N
~
Figure 10. Location of study site
Data Requirements and Categories
Requirements
EVFS was designed to evaluate highway sections by direction. Analysis sections aregenerally not greater than 8 km (5 mi) long. Longer sections are permitted if characteristics aresimilar throughout. To meet these conditions, the 1-81 test site was subdivided into 15 sections:8 southbound and 7 northbound. A description of each section is provided in Appendix D. To
34

evaluate the 50.7-km (31.5-mi) corridor, a weighted average BCR and a total NPW, based on thelength of each subsection, were determined from the results.
Five general categories and 57 input parameters are used to conduct Level 2 analyses.The majority of the data required was made available by various divisions in VDOT or, if notattainable, were developed from other sources. A compilation of the data collected for each ofthe 15 sections is presented in Appendix E. Values are based on 1995 costs and conditions.
Categories
Five categories of data were collected to perform Level 2 analyses:
1. general site information
2. traffic characteristics
3. other factors
4. facility construction and 4R work cost
5. value-of-time and accident costs.
General Site Information (Items 1-11)
Items 1 and 2 are related to classification and the number of lanes that allow bothpassenger vehicles and trucks. Items 3-7 are used to specify future conditions with regard to lightand heavy vehicle restrictions. Items 8-11 describe geometric characteristics (length, number ofinterchanges, grade, and curvature). The average road gradient and average curvature weredetermined by calculating the weighted average of the horizontal and vertical curvature of theroad as shown on VDOT highway construction plan and profile sheets.
Traffic Characteristics (Items 12-25)
Items 12-17 are related to present and future traffic conditions. The ADT for 1995 andaverage annual increase in ADT were estimated through trend analysis. These values assume aneven split between northbound and southbound traffic and that the Smart Road and 1-73 will notbe open to through traffic within the next 10 years. Current peak and off-peak volumes wereestimated by applying average peak and off-peak ratios from 24-hour counts taken south of thestudy site in July and August 1995. This ratio was assumed unchanged in estimating future peakand off-peak volumes. Items 18-19 list the speed limit for light and heavy vehicles. Items 20-25
35

concern the percentage of vehicles by classification, current and in the future. The percentage ofLV, SU, and CV was obtained from VDOT's 1990 Average Daily Traffic Volumes on Interstate,Arterial, and Primary Routes, which was the last edition in which classification counts wererecorded. Between 1980 and 1990, the data reflect insignificant fluctuations in the mixpercentages, which is the rationale for holding the projected mix percentages constant.
Other Factors (Items 26-28)
Items 26-27 are required for an economic analysis. Item 26 is the number of years of theanalysis period. Twenty years was used because it is a reasonable period to evaluate theperformance of significant highway improvements. Construction time period (Item 27) wasestimated based on the length of the section and number of structures that would need to bewidened. The program requires that a minimum period of 1 year be used. The period ofconstruction may be shortened or lengthened depending on seasonal variations and incentive/disincentive clauses in the contract. Item 28 is the discount rate.
Facility Construction and 4R Work Cost (Items 29-42)
Items 29-35 concern construction cost. In this analysis, base cases of three and four lanesin one direction were assumed since the desire was to evaluate exclusive lane alternatives withrespect to three and four travel lanes with no restrictions. Therefore, it was not appropriate toinclude construction and right-of-way costs related to lane widening since they have theoreticallybeen committed. Typically, the decision to widen a facility is based on highway capacity andlevel of service, not benefit-cost analyses. Only costs directly related to the implementation ofspecific exclusive lane alternatives need to be included (e.g., barrier separation, additionalpavement markings and signing, special interchange designs). In some instances, one might wanta benefit-cost analysis relative to existing conditions (in this case, two lanes in one direction), inwhich case construction and right-of-way costs for lane widening should be included.
Items 36-42 concern pavement design factors. Pavement serviceability index (PSI)parameters delta and beta, and minimum allowable PSI, influence the shape of PSI deteriorationcurves used to predict the frequency of pavement resurfacing. The program default values forthese variables were used in the analysis. Although VDOT does not use PSI to determine whenresurfacing should occur, a PSI of 2.5 was estimated to correspond with the threshold conditionat which pavement resurfacing is typically desired. Equivalent single-axle loading (ESAL)values for SU and CV were taken from a study by Sadek, Freeman, and Demetsky.19 Theprogram default value for ESALs was used for LV.
36

Value-of-Time and Accident Costs (Items 43-57)
Items 43-57 relate to values required in an economic analysis: value-of-time (Items 4345), accident rates (Items 46-48), accident costs (Items 49-51), and accident delay (Items 52-57).Values for LV, SU, and CV value-of-time were obtained by updating the default values to 1995dollars using the Consumer Price Index (CPI). CPI indices for 1970 through 1995 are presentedin Appendix F.
Crash rates for the three vehicle classification types were calculated from VDOT crashsummary statistics for 1992 through 1994. Fatal, injury, and property damage only (PDO) crashcosts were obtained from VDOT's 1995 study Justifying a Safety Service Patrol in theFredericksburg District that provided these estimates for 1-95.20 The fatal crash cost of$2,450,000 used in the analysis is lower than the 1994 comprehensive cost estimate of$2,890,000 recommended by the National Safety Council for use in benefit-cost analyses.21
The percentage of crashes blocking none, one, and two lanes and the average minutes toclear truck and nontruck involvements were obtained from VDOT's 1995 study Justifying aSafety Service Patrol in the Salem District.22 Last, maximum queue length before diversion(Item 57) is the maximum distance between an incident and the nearest upstream interchange oropportunity to divert traffic to other routes.
Program Updating
The Levelland 2 analysis formats reference six tables that provide vehicle operatingcosts in 1985 dollars and also apply the 1985 HCM method in computing results. Therefore,before the analysis could be conducted, the program had to be updated. Using the CPI index(Appendix F), the vehicle operating cost tables were converted to 1995 dollars and revised in theprogram through the system's DOS editor.
Impedance is a function of a highway section's free-flow travel, as well as its capacity,and is one of the factors used by the program to calculate travel times. Lane capacities arecalculated in the program according to the 1985 HCM. The formula for capacity is:
c =2,000(W)(Tsu)(Tcv)
where
c =lane capacity (in vehicles per lane-hour)
W =lane width and clearance adjustment factor
Tsu =truck adjustment factor for single-unit vehicles
37

Tcv = truck adjustment factor for combination vehicles.
In 1994, the HCM was revised. One of the revisions was to increase the equivalent lanecapacity from 2,000 passenger vehicles per hour per lane (pcphpl) to 2,200 pcphpl for four-lanefreeways and 2,300 pcphpl for six-lane freeways. This change theoretically increases thecapacity on any given freeway segment. With respect to EVFS, the effect of this change wouldbe to lower the values for NPW and BCR. It is not known if this effect would be statisticallysignificant. A revision of EVFS was contemplated but was not pursued because the objectives ofthis research could be accomplished without expending the significant effort needed toincorporate the 1994 HCM method.
Analysis and Results
EVFS Analysis Outputs
Using EVFS to analyze a given section of highway is relatively simple, once all requireddata are compiled. Data are input through a Lotus 123 spreadsheet user interface. A short seriesof commands execute the program and generate an output. The program produces two reports:Benefit/Cost Summary and Statistics Summary. Samples of each are shown in Appendix G.
The Benefit/Cost Summary provides the estimated BCR and NPW (both with andwithout vehicle operating cost) for the lane strategy being analyzed. In addition, computed costsand benefits are summarized under the headings Cost Summary and Benefit Summary. UnderCost Summary, net estimated resurfacing, vehicle operation, construction, and right-of-way costsare listed. Under Benefit Summary, net estimated travel time, accident, and accident delay costsare shown. The sums of the costs and benefits are then used by the program to determine BCRand NPW.
The Statistics Summary provides the net difference in total VMT, total accidents, averageaccident cost, average delay cost, and average travel speed between the base case and thealternative case being investigated. General site information, including the exclusive lanestrategy being analyzed, is also listed in this report.
Summary of Results
The EVFS analysis format can be used to analyze many exclusive lane configurations.For 1-81, 10 were considered: 4 for three-lane sections and 6 for four-lane sections.
Three-lane sections:
1. 2 unrestricted lanes (UL), 1 light vehicle lane (LVL)
38

2.1 UL,2LVL
3. 2 LVL, 1 heavy vehicle lane (HVL)
4. 2 LVL, 1 HVL (barrier separated [Bar.]).
Four-lane sections:
1. 3 UL, 1 LVL
2.2 UL, 2LVL
3. 1 UL, 3 LVL
4. 3 LVL, 1 HVL
5. 2 LVL, 2 HVL
6. 2 LVL, 2 HVL (Bar.).
Other lane combinations exist, such as 1 LVL, 2 HVL (Bar.) and 1 LVL, 3 HVL but werenot analyzed because they were considered unlikely to produce favorable results. Strategies thatdesignate any combination of unrestricted and heavy vehicle lanes are not considered validoptions in EVFS and, therefore, could not be analyzed.
The EVFS model is not designed to analyze highway sections in which lane restrictionsare in effect. On Sections 6 and 8 of the study site, trucks are restricted from traveling in theinside lane of these three-lane sections. To analyze alternative strategies for each section, it wasassumed that three unrestricted lanes were available.
BCR Results
The objective in applying EVFS is to determine which lane strategy is the most costeffective. One economic measure computed in the model is BCR. BCR for a particularalternative is the proportion of the total estimated savings divided by the total estimated costsrelative to existing conditions. A BCR equal to 1.0 indicates that the net incremental benefits areequal to the net incremental costs at a stated rate-of-return. A value of 1.0 is break-even.Accordingly, for values less than 1.0, net costs outweigh net benefits, and for values greater than1.0, net benefits outweigh net costs. Table 7 presents the corresponding BCRs for the 10alternatives considered in this study. The BCRs are given with respect to the base cases, whichfor the purpose of this study were assumed to be three- and four-lane sections in which no lanerestrictions are imposed.
39

Table 7. BeR for alternative exclusive lane strategies by section
3-Lane Sections 4-Lane Sections
2 LVL, 1 HVL 2LVL,2HVLDir. Sect. 2UL,ILVL lUL,2LVL 2 LVL, 1 HVL (Bar. Separated) 3UL,ILVL 2UL,2LVL 1 UL,3LVL 3 LVL, 1 HVL 2 LVL,2 HVL (Bar. Separated)
1 0.514 0.640 1.421 1.242 0.517 0.524 0.682 0.930 2.413 0.638
S 2 0.489 0.443 1.189 1.033 0.286 0.410 0.478 0.760 2.367 0.5220U 3 1.396 0.977 1.680 1.362 0.873 1.201 1.119 1.118 4.436 0.712TH 4 0.998 1.483 2.319 1.878 1.150 1.076 - -1 1.518 3.593 0.957B0 5 1.658 1.221 1.947 1.663 0.948 1.371 - -1 1.275 4.680 0.892UN 6 3.847 2.782 3.105 3.679 1.321 2.444 2.350 1.887 5.902 1.825D
7 3.098 2.213 2.515 2.784 1.065 1.961 1.820 1.524 4.781 2.212
8 7.474 5.441 6.089 5.544 2.566 4.753 4.345 3.703 11.580 2.755
9 3.242 2.473 2.909 3.232 1.112 2.074 0.546 1.768 5.529 1.604N0 10 1.943 1.421 1.636 1.939 0.667 1.235 0.853 0.994 3.109 0.961RT 11 3.112 2.234 3.359 2.851 1.782 2.558 - -1 2.200 8.081 1.531HB 12 1.112 1.630 2.497 2.022 1.282 1.195 - -1 1.634 3.870 1.0320U 13 3.002 2.060 3.375 2.905 1.883 2.577 2.248 2.245 8.939 1.537ND 14 1.562 1.371 3.199 2.424 0.914 1.298 1.411 2.036 6.423 1.236
15 1.260 1.560 3.302 2.893 1.270 1.284 1.637 2.160 5.633 1.495
UL = unrestricted lane; LVL = light vehicle lane; HVL = heavy vehicle lane.1 No values could be produced for these sections through the EVFS analysis format because of an apparent glitch in the program.
40

BCRs for Three-Lane Sections. In the southbound direction, for alternatives that usethree lanes, BCRs greater than 1.0 were determined for many strategies. For Sections 1-5, thestrategy 2 LVL, 1 HVL produced the best BCRs. For Sections 6-8, the strategy 2 UL, 1 LVLproduced the best BCRs. BCRs for the northbound sections were slightly more favorable thanthose for the southbound sections. Every northbound alternative analyzed had a BCR greaterthan 1.0. For Sections 9 and 10, the strategy 2 UL, 1 LVL had the best BCRs among northboundalternatives. For Sections 11-15, the strategy 2 LVL, 1 HVL had the best BCRs.
BCRs for Four-Lane Sections. These results were more variable. In both thenorthbound and southbound directions, the strategy 2 LVL, 2 HVL had significantly higherBCRs than other alternatives. For the strategy 1 UL, 3 LVL, no results could be calculated forSections 4, 5, 11, and 12. When attempting this analysis, the program displayed the message"Overflow in module LEVEL2 at address 18A3: lCDE." The reason for this message and itsmeaning are unknown, but when new values for vehicle mix percentage were substituted for theactual values, outputs were generated. Substituting for other input variables had no effect.
Overall, for each of the 10 strategies analyzed (with the exception of 2 LVL, 2 HVL[Bar.]), BCRs were best for Sections 6 and 8, probably because of their steep grades.
Variability in HCRs. Another way to consider these results would be to examine theprofile formed by plotting the BCR for each strategy over the length of the study site. Figures 11through 14 show how BCR varies by milepost for alternatives that use three and four lanes.
In the southbound direction, as demonstrated in Figures 11 and 12, the BCRs for eachalternative trend upward from milepost 150 to milepost 118. This might be explained in part byan increase in the horizontal and vertical curvature in this direction. Also, the results for thevarious alternatives tend to mirror one another. For adjacent sections, an increase or decrease inBCR for one alternative is usually reflected by a similar change in another alternative. In someinstances, for reasons that are not apparent, the change is opposite that for other alternatives. Forexample, in Figure 11, the BCR for the strategy 2 UL, 1 LVL is less than for adjacent sections,whereas other alternatives have higher BCRs relative to adjacent sections.
In Figures 13 and 14, BCRs are seen to increase and decrease alternatively over the lengthof the study site. With the exception of a few alternatives, changes in one alternative over the50.7-km (31.5-mi) segment are usually reflected by similar changes in other alternatives.
When exclusive lane strategies are being considered for a highway corridor, it is generallyrecommended that only a single strategy be used, rather than a combination of strategies, forseveral reasons. First, it may be difficult if not impossible to connect or transition different lanestrategies safely. Second, the use of several lane strategies within a corridor would be confusingto most drivers. Therefore, to determine which single strategy will generate the greatest rate ofreturn, one could take a weighted average of the BCRs over the entire length of the corridor
41

8.....,.....--------------------------------.
7 -------- --------------------------------------------------------------------------------------------------------------------------------------------
6 ~-~-~------------------------------------------------- -------------------------------------------------------------------------------------------,.=;.;:;.:,
.Q 5 ---------: -------------------------------------------------------------------------------------------------------------------------------------------Cii ~~a:
145130
4 ---------~~: ------------------------------------------------------------------------------------------------------------------------------------------
:::.:.:.:.:.:.:.:.:.:;~:7:~:.~.:.:~:.;.;.;.:.;.;.;7:.: .:.:.:~:.:.:.:.:.:.:.:.:.:.l· ::: - - - - -
2 ~~uu~~~~~u_~~~~~~~~~~~~-u~uu-u-u~~~~~~uu-\:~"~:~"~~~::<~=~~:='"~:~~:=~~~:~~~~~O-''T-~~....,....,...,....,...,...,.''''T'''''T'..,....,..""'T""''''I''''_r_T"'''T'"'''I''''~''T'''''''I-'''I''''''''T''~T'"''''l''''""~~....,....,...,....,...,...,.''''T'''''T'..,....,.._r_T"'_r_T"'''T'"'''I''''~......,...,....,...,....,..~.,...,..,
118
3
1;)o2'a3cQ)m
Milepost
-2NR,1LV .:.:.:.:.:.:.:.:.:.:.:.:. 1 NR, 2 LV - - 2 LV, 1 HV - - 2 LV, 1 HV (Bar.)
Figure 11. HCR by milepost for three-lane sections (southbound)
--':.:.:.:.:.:.:.:.:.:.:.:.:.:.:.:.:.:.:.:.:.:.:.:.:.:.:.:.:.:.:.:.:.:.:.:.:.:.:.:.::.:.::.:...•...•......•.•..............................•........•.......
12
11
10
9
0 8~a: 71;)0
2 6
~5c
Q)m
4
3
2
I,I
I,I,
--I \
, . , . . 'I - - - ~....=.....=....~.\..... /- --\.:.:.:.:.:.:.:.:.:.:.:.:.:.:.:.:.:.j - - - \
....................'J............................................................................................. . .
- - - ':~I ..·.. ·· ..····r·=·..·=..··=....=....=....=....=·'-:;.;~:~~7~~= __ .., ':,
o I118
I130
I I I I I I I I I I I I I I I I I I I I I I I I I I I
145Milepost
- 3 NR, 1 LV 2 NR, 2 LV ..... ,. 1 NR, 3 LV
3 LV, 1 HV - - 2 LV, 2 HV - - - - 2 LV, 2 HV (Bar.)
Figure 12. HCR by milepost for four-lane sections (southbound)
42


Table 8. Weighted average of BCRs by direction
Strategy Southbound (Sections 1-8) Northbound (Sections 9-15)
2 UL, 1 LVL 2.069 2.186
1 UL, 2 LVL 1.605 1.817
2 LVL, 1 HVL 2.252 2.868
2 LVL, 1 HVL (Bar.) 2.112 2.590
3 UL, 1 LVL 0.974 1.261
2 UL, 2LVL 1.468 1.744
1 UL, 3 LVL 1.512 1.326
3 LVL, 1 HVL 1.424 1.842
2 LVL, 2 HVL 4.463 5.903
2 LVL, 2 HVL (Bar.) 1.181 1.331
UL =unrestricted lane; LVL =light vehicle lane; HVL =heavy vehicle lane.
being investigated. Table 8 provides the weighted average BCR by direction for each strategy inthe study corridor.
With the exception of the strategy 3 UL, 1 LVL in the southbound direction, the weightedaverage BCR is greater than 1.0 for all strategies. For three-lane sections, the strategy 2 LVL,1 HVL produced the highest average BCR in both the southbound and northbound direction.Likewise, for four-lane sections, the strategy 2 LVL, 2 HVL resulted in significantly higheraverage BCRs in both directions compared with other alternatives.
NPW Results
BCR represents an estimate of the rate of return of an alternative with respect to existingconditions. A more useful economic performance indicator is NPW, which permits economiccomparisons between alternatives. NPW provides an estimate of the present worth of the netincremental benefits (or costs) expected to accrue over the life of the project, which for thepurpose of this study is 20 years. NPW is found by taking the difference between the presentworth of the net incremental benefits and net incremental costs. In cases where costs exceedbenefits, a negative value for NPW will be determined. In applying NPW as an evaluationcriterion, the project with the greatest NPW is considered the best. However, in evaluatingalternative projects, the project with the highest NPW will not necessarily have the highest BCR.Table 9 presents the NPW for the corresponding alternatives investigated for the study site.
44

Table 9. NPW for various lane strategies by section (in thousands of dollars)
3-Lane Sections 4-Lane Sections
2 LVL, 1 HVL 2LVL,2HVLDir. Sect. 2 UL, lLVL 1 UL,2LVL 2 LVL, 1 HVL (Bar. Separated) 3UL,ILVL 2UL,2LVL lUL,3LVL 3 LVL, 1 HVL 2LVL,2HVL (Bar. Separated)
1 -521 -1,311 1,530 1,007 -340 -1,015 -1,767 -388 3,002 -2,912
S 2 -405 -2,175 733 146 -639 -1,151 -3,185 -1,467 2,624 -4,1620U 3 293 -110 3,178 2,097 -99 355 839 826 6,038 -3,160TH 4 -3 2,010 5,492 4,514 121 204 - -1 3,292 6,953 -429B0 5 461 928 3,971 3,254 -42 645 - -1 1,762 6,405 -984UN 6 1,490 5,774 6,819 7,324 323 2,460 7,188 4,725 8,348 4,542D
7 1,487 5,326 6,651 7,075 88 2,218 5,913 3,816 8,722 6,043
8 2,405 10,209 11,700 11,473 1,117 4,537 12,641 10,214 12,785 8,913
9 1,704 6,928 8,975 9,444 163 2,656 -3,511 5,937 11,195 5,144N0 10 796 2,201 3,325 4,139 -540 644 -1,266 -50 5,791 -348RT 11 1,444 5,058 9,667 8,936 618 2,652 - -1 7,507 12,044 4,768HB 12 158 2,622 6,234 5,253 228 524 - -1 4,035 7,695 3230U 13 1,548 5,183 11,588 10,788 719 2,910 9,154 9,132 14,575 5,731ND 14 427 1,389 8,175 6,970 -73 557 2,406 6,065 9,989 2,256
15 279 2,040 8,372 7,844 190 606 3,542 6,454 9,844 3,965
UL =unrestricted lane; LVL =light vehicle lane; HVL =heavy vehicle lane.INo values could be produced for these sections through the EVFS analysis format because of an apparent glitch in the program.
45
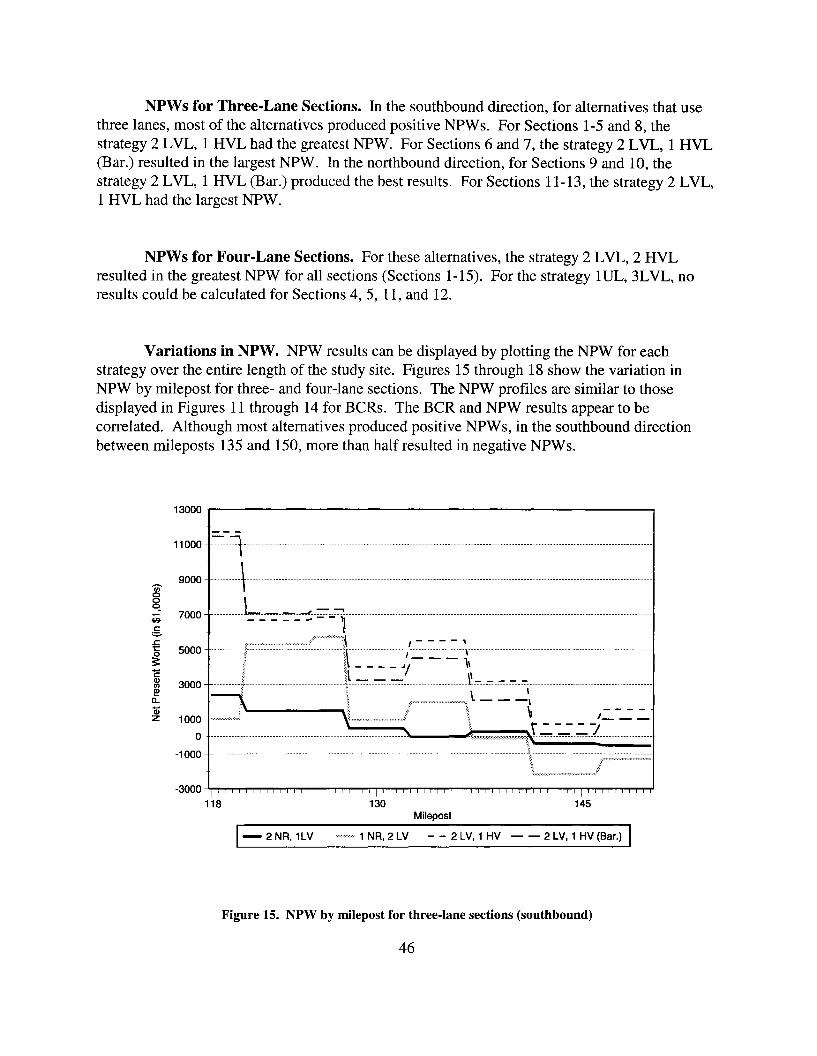
NPWs for Three-Lane Sections. In the southbound direction, for alternatives that usethree lanes, most of the alternatives produced positive NPWs. For Sections 1-5 and 8, thestrategy 2 LVL, 1 HVL had the greatest NPW. For Sections 6 and 7, the strategy 2 LVL, 1 HVL(Bar.) resulted in the largest NPW. In the northbound direction, for Sections 9 and 10, thestrategy 2 LVL, 1 HVL (Bar.) produced the best results. For Sections 11-13, the strategy 2 LVL,1 HVL had the largest NPW.
NPWs for Four-Lane Sections. For these alternatives, the strategy 2 LVL, 2 HVLresulted in the greatest NPW for all sections (Sections 1-15). For the strategy 1UL, 3LVL, noresults could be calculated for Sections 4,5, 11, and 12.
Variations in NPW. NPW results can be displayed by plotting the NPW for eachstrategy over the entire length of the study site. Figures 15 through 18 show the variation inNPW by milepost for three- and four-lane sections. The NPW profiles are similar to thosedisplayed in Figures 11 through 14 for BCRs. The BCR and NPW results appear to becorrelated. Although most alternatives produced positive NPWs, in the southbound directionbetween mileposts 135 and 150, more than half resulted in negative NPWs.
13000
11000
9000'000q
7000~§,.c1:: 500003:1::Q)
3000CJ)
~0-
mz 1000
0
-1000
=--1-------------------------------------------------------------------------------------------------------------------------------------------
---------\-------------------------------------------------------------------------------------------------------------------------------------------
__________l~ ~__=__='_ _
--------'~
::::::::L~»»»::»~'"~:~\:=:=-=:=:~~:~::~_:~::~:-~i,~:~:~:~_~:::::::::: :::::_::::::::-::::_::::::::
2::::::::::::::::::::::::::::::::~~~:~_=~~,~=C-=~~=~=:\ ~»:~==:~~:~:~:~:~;~=:=:--------------------------- --- ---- ---------------------------- ------------------------- ---------------------r-------------------- --~::.~:::::~.;,.;,.~:.~:::~.:~.;,.~:::::~
\:.:.:.:.:.:.:.:.:.:..;::.:.;.:.:.:.:.:.:.;.:.;.,,:::::::.:.:.:.:.:.:.:.:.:.:./:::.
-3000 I I I I I I I I I I I I I I I
11811 I Til
130I
Milepost
I I I I I I
145
- 2NR,1LV 1 NR, 2 LV - - 2 LV, 1 HV - - 2 LV, 1 HV (Bar.)
Figure 15. NPW by milepost for three-lane sections (southbound)
46

14000
12000
10000
en0 80000q; 6000g.£:.t 40000
==C 2000Q)UJ£!?a.. 0a;z
-2000
-4000
---------\-------------------------------------------------------------------------------------------------------------------------------------------
:.:~.=::.=::.~:::::~.:~.=::.::?~\--------- ----- ------- --- ------- --- -------- ----- -------- --- ----- --- ------------ ------ --- ----- -- --- -- ----- ---- --- --- -------- -- -- ----- --- -----
-_~_~\~-.---:~:.=~:-.~.:::::::~~::::_-:::::::-:_-->-:__::__::_:::_::::~_=:=:=::_:-::::_::-::_-_:_:_::-::_-_::_::-::_:_-\
--------Tk,-",,-""'O,-:;;;«~~::=:l---------------------~::,=:-:~:o:::::::~=--------------------\----------------------------------------
~~::~--~__~--~--~3:~:~~~~::---~:~:~::~~"~i~~::":~:~~;.:L "": :~----
------------------------------------------------------------------------------------------------------------\-.;;.--.:.;.;-;,;-;:;.;.--.;;.--~------------------
-6000 -""I,...,I...,...,"""T""T'..,...,."'T""'T""..,....,..~I"'""'I'"""~...,...,.""T"""T"".,...,..I.,....I~,...,lli""""Il~...,...,...,..,...,...,...~~~..,...,....,...,."'T""'T""~.....,..I~...,...,..,...............
118 130 145Milepost
- 3 NR, 1 LV 2 NR, 2 LV 1 NR, 3 LV
3 LV, 1 HV - - 2 LV, 2 HV - - - - 2 LV, 2 HV (Bar.)
Figure 16. NPW by milepost for four-lane sections (southbound)
:.:.:.:.:.:.:.:.:.:.:.:.:.:.:.:.:.:.:=;.
12000
10000
en 800000q;c:: 6000:.=,...r:.t0
=="E 4000Q)UJ£!?a..a; 2000z
0
,- - --,,----,'-----------------------------------------------------------------------------------------------------------\1------------------------------------------
---- -----, J "- - - - - -l 1- __ , "1 ,----
::~:rt:.;.;.:~:.;.;.:.;.;.;------------------------------------------------------------------------------------------------------------~:~---------------------~l:·:·:·:·:·:·:·:·:·:·:·:.:.:.:.:.:.:.:.:.:.:.:.:.:.:.:.:.:.:.:-
__m mm__m__~_mm m/__m__m__mm\m__mm I nmm \==~"_=~"-~ mm nm _
-2000 I I I I I I 1 I
118I 1 I
130Milepost
I145
- 2NR, 1LV 1 NR,2 LV - - 2 LV, 1 HV - ·2 LV, 1 HV (Bar.)
Figure 17. NPW by milepost for three-lane sections (northbound)
47

16000--r------------------------------.14000
12000
en8 10000qo§, 8000.r::.t::~ 6000
Cm 4000~0-m 2000z
------------------------------------------------------------------------------------------L.--=--=--1--------------------------------------- _
I \------------------------------------------------r------------------------------f-----------------\-----------------------------------------
---- \
:- ::-:--:-: ::-j\-::::--::__::__ :-:::_111.::::.~.::::~::.~""~",~~:~;L:---::::---::::::f'~:·~~~:~:~'=~\\-=-=:=:=::-::::--::-::~..~::::.: {::~~~. ·.··N:·:·:·.···:·.·•• .........:.: 00:•••
.:.:.:.:.:.:.:.:.:.:.:.:.:.:.:.:.:.:.:.:.:.:.:.:.:.:.:.:.:.:.:.: :--~--.:.:.;.;--.:.:.;.;--~-:.:._-------------------------------------_ ------------------ :;-::.:_-----------------
-2000 ------------------------&-----------------------------------------------------------------------------------------------------------------------------
-4000 ~1~"T""T""":r_r_T"..,.._r_T"""T""_r""'T""'T"""T"""'I""_r"T"'~r_r_T"I..,..-r-,...,...,...,...,...,....,...,....,....,...,....,...,I""""I""'..,...,...,...,...,...,...,...,...,...,...,....,...,..1 'I"""'r""'~""""'~
118 130 145Milepost
- 3 NR, 1 LV - - - 2 NR, 2 LV 1 NR, 3 LV
3 LV, 1 HV - - 2 LV, 2 HV - - - - 2 LV, 2 HV (Bar.)
Figure 18. NPW by milepost for four-lane sections (northbound)
Another way to evaluate alternative strategies is to consider the total NPW for each alternative inthe southbound and northbound direction. Table 10 shows the total NPW for each alternative.The strategy that is estimated to produce the greatest cost savings is 2 LVL, 2 HVL. Totalsavings are estimated in excess of $125 million.
CONCLUSIONS
• BCR and NPW are two of the four basic methods commonly employed in economicevaluations of transportation improvements, the other two being equivalent uniform annualworth and internal rate of return. 23 Each method will produce similar results, and the reasonfor selecting one over the other is typically a matter ofconvenience or preference concerninghow the results will be presented. The most difficult part in performing an economicevaluation of a transportation system improvement is accounting for all costs and savings thatwill accrue over the life span of the improvement. Assuming all costs and savings can beknown with a satisfactory degree of confidence, calculating the BCR or NPW is a relativelystraightforward procedure. The EVFS analysis format facilitates the calculation of these twoeconomic performance measures through the application of prediction models. Thereliability of the results is a function of the accllracy of the model and the quality of the datasupplied to the program.
48

Table 10. Total NPW for each strategy by direction (in thousands of dollars)
Strategy Southbound (Sections 1-8) Northbound (Sections 9-15)
2 UL, 1 LVL 5,207 6,356
1 UL, 2 LVL 20,651 25,421
2 LVL, 1 HVL 40,074 56,336
2 LVL, 1 HVL (Bar.) 36,890 53,374
3 UL, 1 LVL 529 1,305
2 UL, 2LVL 8,253 10,549
1 UL, 3 LVL 21,629 10,325
3 LVL, 1 HVL 22,780 39,080
2 LVL, 2 HVL 54,877 71,133
2 LVL, 2 HVL (Bar.) 7,851 21,839
UL =unrestricted lane; LVL =light vehicle lane; HVL =heavy vehicle lane.
• The EVFS model is a useful analytical tool. Given the shrinking pool of resources and thedemand for greater financial accountability from the public, the importance of using costanalysis in project decision making should not be underestimated. It should also beunderstood that no economic analysis is perfect, since it is dependent on estimated costs andpredictions of future conditions. Nevertheless, cost analysis is a valuable tool when usedproperly. Despite its shortcomings, EVFS is a valuable analytical tool.
• The EVFS model does have shortcomings.
One of the main weaknesses in the analysis format concerns the assignment of lanerestrictions. The program does not require the analyst to indicate to which lane(s) (i.e.,inside, middle, outside) a restriction is to be imposed. Based on the literature, there isstrong evidence that the particular lane(s) to which vehicle types are'assigned will affectsafety, traffic flow, and pavement performance. For example, when truck lanerestrictions are imposed, there are distinct advantages and disadvantages relative towhether or not trucks are relegated to travel in the inside or outside lanes. Apparently, theprogram assumes the best case scenario, although this is not clear.
- Determination of BCR and NPW for alternatives in which the only physical improvementwas the addition of a barrier required some hand calculations because the program wasnot designed to consider this condition. Another weakness includes the manyassumptions that are needed to simplify the many site-specific complexities of a freeway
49

system. Also, the analyst has the ability to influence the results greatly depending on theinput values supplied to the program. Therefore, estimates of costs and benefits shouldbe viewed with caution. Relatively small differences between alternative cases may notbe statistically significant. Rather than consider results in absolute terms, the model maybe better used simply to rank alternatives.
- The analysis format could be improved in several ways. The Levell analysis format,which provides a quick sketch evaluation of a number of alternatives, relies heavily ondefault values imbedded in the program for computing results. A comparison of thedefault values with actual input values for 1-81 revealed much disparity, thus calling intoquestion the value of the Level 1 format. The program could be improved by providingdefault values more representative of actual conditions. In addition, models for freewaysimulation, route assignment, and elastic demand could be embedded within itsframework. This expansion of the analysis format would enable an improved modelingof route diversion alternatives during incidents and of traffic attracted from alternateroutes because of additional capacity. Unfortunately, this change would also increase thedata collection demands placed upon the user.
• In the 1-81 study site, several alternatives appear to warrant further investigation. Forstrategies that use three lanes, the strategies 2 LVL, 1 HVL and 2 LVL, 1 HVL (Bar.) had thegreatest NPWs; however the latter strategy should be eliminated from consideration becauseof operational problems created by a single barrier-separated lane. For strategies that use fourlanes, the strategy 2 LVL, 2 HVL clearly produced the most favorable results in terms ofNPW.
RECOMMENDATIONS
The EVFS analysis format is primarily intended for use by transportation planners toprovide additional information to decision makers concerning the overall feasibility of variousexclusive lane strategies. This research has shown EVFS to be a useful analytical tool in thisrespect. With this in mind, the following general recommendations and guidelines are offered:
General Recommendations
• For interstate facilities being considered for widening and/or for which problems related toheavy vehicle travel exist, investigate the economic feasibility ofexclusive lane alternativesby incorporating the EVFS methodology into the planning process.
• On 1-81, construct exclusive lanes for passenger vehicles and trucks as part ofa pilot study.If three lanes are available, 2 LVL, 1 HVL should be tested. For four available lanes, 2 LVL,
50

2 HVL should be tested. Data should be collected before and after implementation to assessthe effects of the strategy on safety, traffic operations, and pavement performance. Ifpossible, actual benefits and costs should be compared with the results generated by themodel to assess its reliability.
• Develop a user's manual to assist analysts in applying the model.
• Improve data collection efforts, particularly with respect to volumes and vehicle mixpercentages and delays caused by incidents, among other data needed to apply the EVFSmodel.
Recommended Guidelines
• Use EVFS only for analyzing controlled-access facilities.
• Ensure that a minimum of three lanes are available to implement exclusive lane alternatives.
• Use EVFS to perform an analysis in only one direction.
• Use EVFS only for site-specific analysis. Analysis sections should not normally exceed?km (5 mi), though longer sections can be evaluated by combining the results from shortersections.
• Ensure that the most accurate data available are being used, as the reliability of the results is adirect function of the accuracy of the data used.
• Do not use EVFS to determine the need to add a lane(s).
• Since EVFS is designed to estimate the economic performance of various exclusive lanestrategies, in deciding whether to implement a particular exclusive lane alternative, considerother factors such as the operational and geometric implications of a particular strategy.
• Consider a variety of alternatives in any EVFS feasibility analysis.
FUTURE RESEARCH NEEDS
EVFs .are presumed to improve safety, traffic operations, and pavement performance,particularly on heavily traveled truck corridors. However, there is little actual experience tosupport many of the apparent benefits of this strategy. Given the potential benefits, additionalresearch is needed and justified.
51

Further research is needed in the following areas:
• the effects of assigning large trucks to the inside or outside lanes on level of serviceand the requirements for the use of barriers
• the effects on safety of concentrating large volumes of trucks traveling at high speedsin restricted lanes or roadways
• the differential design of pavements on six-lane highways.
REFERENCES
1. Transportation Research Board. 1986. Twin Trailer Trucks: Effects on Highways andHighway Safety. Special Report 211. National Research Council, Washington, D.C.
2. American Trucking Associations Foundation. 1986. U.S. Freight Transportation Forecastto 2004. Second Annual Report. Alexandria, Va.
3. International Symposium on Motor Carrier Transportation. 1994. In TransportationResearch Board Conference Proceedings 3. National Academy Press, Washington, D.C.
4. Comprehensive Approach to Reduce Accidents on Capitol Beltway Initiated. 1994. TheUrban Transportation Monitor, Vol. 8, No. 19.
5. Janson, B.N. and A. Rathi. 1990. Feasibility ofExclusive Facilitiesfor Cars and Trucks.Oak Ridge National Laboratory, Oak Ridge, Tenn.
6. Garber, N.J. and S. Joshua. 1989. Characteristics of Large-Truck Crashes in Virginia.Transportation Quarterly, Vol. 43, No.1.
7. Seiff, H.E. 1990. Status Report on Large-Truck Safety. Transportation Quarterly, Vol. 44,No.1.
8. Insurance Institute for Highway Safety. 1995. Large Trucks. Arlington, Va.
9. O'Day, J., and L.P. Kostyniuk. 1985. Large Trucks in Urban Areas: A Safety Problem?Journal of Transportation Engineering, Vol. Ill, No.3.
10. Stokes, R.W. and S. Albert. 1986. Preliminary Assessment of the Feasibility ofanExclusive Truck Facility for Beaumont-Houston Corridor. Report No. FHWAffX-86/+393-2. Texas Transportation Institute, College Station.
52

11. Mannering, F.L., J. L. Koehne, and J. Araucto. 1993. Truck Restriction Evaluation: ThePuget Sound Experience. Report No. WA-RD 307.1. Washington State TransportationCenter, Seattle.
12. Mason, J.M., D.R. Middleton, and H.C. Petersen. 1986. Operational and GeometricEvaluation ofExclusive Truck Lal1~es. Report No. FHWAlTX-86/49+331-3F. TexasTransportation Institute, College Station.
13. Middleton, D.R. and J.M. Mason, Jr. Operational and Geometric Evaluation of ExclusiveTruck Facilities. Transportation Research Record No. 1122. Washington, D.C.
14. Virginia Department of Transportation, Traffic Engineering Division. 1987. CapitalBeltway TrucklTractor Trailer Restriction Study. Richmond.
15. Maryland State Highway Administration, Office of Traffic. 1987. 1-95 and 1-495 TruckLane Restriction Study Before/After Accident Summary. Baltimore.
16. McCasland, W.R. and R.W. Stokes. 1984. Truck Operations and Regulations on UrbanFreeways. Report No. FHWAlTX-85/28 +338-1F. Texas Transportation Institute, CollegeStation.
17. Georgia Department of Transportation, Office of Road and Airport Design, and FloridaDepartment of Transportation, Division of Transportation Planning. 1979. Interstate 75Preferential Heavy Vehicle Lanes Evaluation Project.
18. Middleton, D. R., K. Fitzpatrick, D. Jasek, and D. Woods. 1994. TruckAccidentCountermeasures on Urban Freeways. Report No. FHWA-RD-92-059. TexasTransportation Institute, College Station.
19. Sadek, A.W., T.E. Freeman, and M.J. Demetsky. 1995. The Development ofPerformancePrediction Modelsfor Virginia's Interstate Highway System. Vol. I: Data BasePreparation. VTRC 96-R7. Virginia Transportation Research Council, Charlottesville.
20. Virginia Department of Transportation, Management Services Division. 1995. Justifying aSafety Service Patrol in the Fredericksburg District. Richmond.
21. National Safety Council. Accident Facts, 1995 Edition. Itasca, TIL
22. Virginia Department of Transportation, Management Services Division. 1995. Justifying aSafety Service Patrol in the Salem District. Richmond.
23. Garber, N.J. and L.A. Hoe!. 1997. Traffic and Highway Engineering. PWS PublishingCompany, Boston.
53

APPENDIX A
QUESTIONNAIRE:EXCLUSIVE FREEWAY LANES FOR HEAVY VEHICLES

QuestionnaireExclusive Freeway Lanes for Heavy Vehicles
August 1995
The Virginia Transportation Research Council and the University of Virginia are conductinga study of the potential benefits of exclusive highway facilities for cars and trucks. In order tobetter understand the feasibility of this approach we are attempting to determine practicalexperiences of other states. We would appreciate it if you could answer the following questionsconcerning your state's experiences.
Shortly after you receive this survey we will be calling you to answer any questions youmay have and to obtain responses to these questions. This survey is provided to give youan opportunity to consider the issues raised. Thank you again for your help.
1. How does your state define a "heavy vehicle" for purposes of truck lane restrictions?
2. Does your state currently restrict heavy vehicles from using specific lane(s) on interstatehighways (i.e., Do you have exclusive passenger vehicle lanes)?
Yes No
If yes, are these restrictions mandatory or voluntary? _
What is the compliance experience?
_ High _ Medium _ Low _ Don't know
What is the primary purpose of these restrictions?
_ Improve traffic operations _ Increase Safety_ Reduce pavement deterioration Other
3. If the answer to question 2 is yes, please answer the following:
Are the restrictions: _ Statewide _ Site specific
If site-specific, please provide the location(s) and approximate length(s):
Are lane restrictions in the: _ Left lane(s) _ Right lanes(s)
57

4. Does your state currently restrict heavy vehicles from using specific interstate (freeway)routes?
Yes No
If yes, which route(s)?
Why are these restrictions imposed? _ Improve traffic operations
_ Increase safety _ Reduce pavement deterioration _ Other
5. Does your state designate specific freeway truck routes?
Yes No
If yes, please specify which route(s)?
Are they exclusively for trucks? _ Yes _ No
6. Does your state provide exclusive lanes for trucks?
Yes No
If yes, which lane(s)? _ Left lanes(s) _ Right lane(s)
Please specify freeway name and location:
Why were these exclusive lanes provided? _ Improve traffic operations_ Increase safety _ Reduce pavement deterioration _ Other
7. Does your state impose time of day restrictions for trucks on any freeway lanes?
Yes No
If yes, for each facility please describe what restrictions are in place:
58

8. Does your state have separate speed limits for passenger vehicles and trucks?
Yes No
If yes, where are these applied?
What is the speed limit for cars? _
What is the speed limit for trucks? _
Why were different limits established?
_ Increase safety _ Improve highway operations _ Other
Are any changes in legislation expected?
9. Do you have any data or experience regarding the success of truck or passenger vehiclerestrictions in your state?
10. Do you have any additional comments concerning your state's experience with strategies fordealing with heavy and light vehicles?
Thank you very much for your time and assistance in completing this survey. If we can beof assistance, please contact Joe Vidunas or Heather Wishart at:
Virginia Transportation Research Council530 Edgemont RoadCharlottesville, VA 22903Phone: (804) 293-1903Fax: (804) 293-1990
Would you like a copy of the final report? _ Yes _ No
59

APPENDIXB
LEVEL 1 AND LEVEL 2 DATA INPUT PARAMETERS

Level 1 Sketch Analysis Inputs
General Site Characteristics:1. Is this a rural, suburban, or urban highway section?2. What is the approximate length of this section in miles?3. How many interchanges are located along this section?4. How many lanes are there currently in each direction?5. How many lanes are to be added in each direction?6. Number of new lanes of right-of-way to acquire?7. Current average daily traffic (ADT) (one direction)?8. Average annual increase in ADT (one direction)?9. Current heavy vehicle percentage of total ADT in 10 years?10. Heavy vehicle percentage of total ADT in 10 years?11. Length of the analysis period (number of years)?12. Present value discount rate?
63
R/SIU
(1-4)(1-4)(0-4)

Level 2 Detailed Analysis Inputs
General Site Information:1. Is this a rural, suburban, or urban highway section R/S/U?2. Current mixed-vehicle lanes in each direction (0-6)?3. Future mixed-vehicle lanes in each direction (0-6)?4. Future light-vehicle lanes in each direction (0-6)?5. Future heavy-vehicle lanes in each direction (0-4)?6. Number of new lanes of right-of-way to acquire (0-4)?7. Will exclusive vehicle lanes be barrier separated (YIN)?8. Length of section in miles (including decimal places)?9. Number of interchanges along this section?10. Average road gradient along section (typical value =O%)?11. Average curvature along section (typical value =2 deg.)?
Traffic Characteristics:12. Current average daily traffic (ADT) (one direction)?13. Average annual increase in ADT (one direction)?14. Current peak-period volume/hr (3 hours/day)?15. Future peak-period volume/hr in 10 years?16. Current off-peak volume/hr (15 hours/day)?17. Future off-peak volume/hr in 10 years?18. Speed limit for LV along this section (mph)?19. Speed limit for SU and CV along this section (mph)?20. Current LV percentage of total ADT?21. Future LV percentage of ADT in 10 years?22. Current SU percentage of total ADT?23. Future SU percentage of total ADT in 10 years?24. Current CV percentage of total ADT?25. Future CV percentage of ADT in 10 years?
Defaults:
(calculated)(calculated)(calculated)(calculated)
6555
(calculated)(calculated)(calculated)(calculated)(calculated)(calculated)
ADT - Average Daily TrafficLV - Light Vehicle
SU - Single-Unit VehicleCV - Combination Vehicle
Other Factors:26. Length of the analysis period (number of years)?27. How many years of this period are construction?28. Present value discount rate?
64

Facility Construction and 4R Work Cost (in 103 dollars):29. Construction cost per lane mile (unseparated)?30. Construction cost per interchange (unseparated)?31. Right-of-way acquisition cost/mile (unseparated)?32. Construction cost per lane mile (w/barriers)?33. Construction cost per interchange (w/barriers)?34. Right-of-way acquisition cost/mile (w/barriers)?35. Average cost per lane mile for major resurfacing?36. PSI parameter (delta) (in million 18-kip ESALs)?37. PSI parameter (beta) used as the power exponent?38. Minimum allowable PSI (lower bound on PSI curve)?39. PSI at which resurfacing is desired (0-5 scale)?40. Average ESALs per light vehicle?41. Average ESALs per single-unit vehicle?42. Average ESALs per combination vehicle?
PSI - Pavement Serviceabilty IndexESAL - Equivalent Single Axle Loads
Value-of-Time and Accident Costs (in dollars):43. Light vehicle value-of-time per hour?44. Single-unit vehicle value-of-time per hour?45. Combination vehicle value-of-time per hour?46. Light vehicle accident rate per LV MVM?47. Single-unit vehicle accident rate per SU MVM?48. Combination vehicle accident rate per CV MVM?49. Accident costs per fatality accident?50. Accident costs per injury accident?51. Accident costs per PDO accident?52. Percent of total accidents blocking no lanes?53. Percent of total accidents blocking one lane?54. Percent of total accidents blocking two lanes?55. Average minutes to clear non-truck involvements?56. Average minutes to clear truck involvements?57. Maximum queue length before diversion (miles)?
MVM - Million Vehicle MilesPDO - Property Damage Only
65
Defaults:$ 1,900$ 500$ 810$ 2,660$ 700$ 1,134$ 108
2.01.21.52.5
0.00030.06
1.5
Defaults:$ 5.00$ 10.00$ 15.00
0.9861.6971.555
$226,800$ 9,288$ 1,242
59%28%13%
39633.0

APPENDIXC
DATA INPUTS FOR HYPOTHETICAL SCENARIOS A, B, & C

LOCATION: SCENARIO A
DETAILED ANALYSIS INPUTS - LEVEL 2
General Site Information:
1. Is this a rural, suburban, or urban highway section?2. Current mixed-vehicle lanes in each direction?3. Future mixed-vehicle lanes in each direction?4. Future light-vehicle lanes in each direction?5. Future heavy-vehicle lanes in each direction?6. Number of new lanes of right-of-way to acquire?7. Will exclusive vehicle lanes be barrier-separated?8. Section length in miles (including decimal places)?9. Number of interchanges along this section?10. Average road gradient along section (typical value =O%)?11. Average curvature along section (typical value =2 deg.)?
DETAILED ANALYSIS INPUTS - LEVEL 2
Traffic Characteristics:
12. Current average daily traffic (ADT) (one direction)?13. Average annual increase in ADT (one direction)?14. Current peak-period volume/hr (3 hours/day)?15. Future peak-period volume/hr in 10 years?16. Current off-peak volume/hr (15 hours/day)?17. Future off-peak volume/hr in 10 years?18. Speed limit for LV along this section (mph)?19. Speed limit for SU and CV along this section (mph)?20. Current LV percent of total ADT?21. Future LV percentage of total ADT in 10 years?22. Current SU percent of total ADT?23. Future SU percentage of ADT in 10 years?24. Current CV percent of total ADT?25. Future CV percentage of ADT in 10 years?
R/SIU(1-6)(0-6)(0-4)(0-4)(0-4)(YIN)
Defaults
6667916740005500655564.2%56.3%28.6%35.8%
7.2%7.9%
R3o221
y30.0
70%
2
800003000
oooo
6565
70.0%65.0%
8.0%9.0%
22.0%26.0%
ADT - Average Daily TrafficLV - Light Vehicle
SU - Single-Unit VehicleCV - Combination Vehicle Press Enter
DETAILED ANALYSIS INPUTS - LEVEL 2
Other Factors:
26. Length of the analysis period (number of years)?
69
20

27. How many years of this period are construction? 328. Present value discount rate? 10.0%
DETAILED ANALYSIS INPUTS - LEVEL 2
Facility Construction and 4R Work Cost (in 1000 dollars):Defaults
29. Construction cost per lane mile (unseparated)? $1,500 $1,50030. Construction cost per interchange (unseparated)? $400 $45031. Right-of-way acquisition cost/mile (unseparated)? $390 $40032. Construction cost per lane mile (w/barriers)? $2,100 $2,05033. Construction cost per interchange (w/barriers)? $560 $56034. Right-of-way acquisition cost/mile (w/barriers)? $546 $60035. Average cost per lane mile for major resurfacing? $108 $11036. PSI parameter (delta) (in million 18-kip ESALs)? 2.0 037. PSI parameter (beta) used as the power exponent? 1.2 038. Minimum allowable PSI (lower bound on PSI curve)? 1.5 039. PSI at which resurfacing is desired (0-5 scale)? 2.5 °40. Average ESALs per light vehicle? 0.0003 041. Average ESALs per single-unit vehicle? 0.06 042. Average ESALs per combination vehicle? 1.5 0
DETAILED ANALYSIS INPUTS - LEVEL 2
Value of Time and Accident Costs (in dollars):Defaults
43. Light vehicle value-of-time per hour? $5.00 $0.0044. Single-unit vehicle value-of-time per hour? $10.00 $0.0045. Combination vehicle value-of-time per hour? $15.00 $0.0046. Light vehicle accident rate per LV MVM? 0.728 0.95047. Single-Unit vehicle accident rate per SU MVM? 1.253 1.55048. Combination vehicle accident rate per CV MVM? 1.148 1.65049. Accident cost per fatality accident? $226,800 $225,00050. Accident cost per injury accident? $9,288 $10,00051. Accident cost per PD~ accident? $1,242 $3,50052. Percent of total accidents blocking no lanes? 59% 60%53. Percent of total accidents blocking one lane? 28% 25%54. Percent of total accidents blocking two lanes? 13% 15%55. Average minutes to clear non-truck involvements? 39 4556. Average minutes to clear truck involvements? 63 7057. Maximum queue length before diversion (miles)? 2.1 3.0
70

LOCATION: SCENARIO B
DETAILED ANALYSIS INPUTS - LEVEL 2
General Site Information:
1. Is this a rural, suburban, or urban highway section?2. Current mixed-vehicle lanes in each direction?3. Future mixed-vehicle lanes in each direction?4. Future light-vehicle lanes in each direction?5. Future heavy-vehicle lanes in each direction?6. Number of new lanes of right-of-way to acquire?7. Will exclusive vehicle lanes be barrier-separated?8. Section length in miles (including decimal places)?9. Number of interchanges along this section?10. Average road gradient along section (typical value =O%)?11. Average curvature along section (typical value =2 deg.)?
DETAILED ANALYSIS INPUTS - LEVEL 2
Traffic Characteristics:
12. Current average daily traffic (ADT) (one direction)?13. Average annual increase in ADT (one direction)?14. Current peak-period volume/hr (3 hours/day)?15. Future peak-period volume/hr in 10 years?16. Current off-peak volume/hr (15 hours/day)?17. Future off-peak volume/hr in 10 years?18. Speed limit for LV along this section (mph)?19. Speed limit for SU and CV along this section (mph)?20. Current LV percent of total ADT?21. Future LV percentage of total ADT in 10 years?22. Current SU percent of total ADT?23. Future SU percentage of ADT in 10 years?24. Current CV percent of total ADT?25. Future CV percentage of ADT in 10 years?
R/S/U(1-6)(0-6)(0-4)(0-4)(0-4)(YIN)
0%3
Defaults
2167279213001675655575.0%69.7%19.0%23.8%6.0%6.6%
U221o1
N17.0
4
26000750
oooo
6565
81.0%77.5%
6.0%7.5%
13.0%15.0%
ADT - Average Daily TrafficLV - Light Vehicle
SU - Single-Unit VehicleCV - Combination Vehicle Press Enter
DETAILED ANALYSIS INPUTS - LEVEL 2
Other Factors:
26. Length of the analysis period (number of years)?
71
25

27. How many years of this period are construction?28. Present value discount rate?
DETAILED ANALYSIS INPUTS - LEVEL 2
Facility Construction and 4R Work Cost (in 1000 dollars):
29. Construction cost per lane mile (unseparated)?30. Construction cost per interchange (unseparated)?31. Right-of-way acquisition cost/mile (unseparated)?32. Construction cost per lane mile (wlbarriers)?33. Construction cost per interchange (wlbarriers)?34. Right-of-way acquisition cost/mile (wlbarriers)?35. Average cost per lane mile for major resurfacing?36. PSI parameter (delta) (in million 18-kip ESALs)?37. PSI parameter (beta) used as the power exponent?38. Minimum allowable PSI (lower bound on PSI curve)?39. PSI at which resurfacing is desired (0-5 scale)?40. Average ESALs per light vehicle?41. Average ESALs per single-unit vehicle?42. Average ESALs per combination vehicle?
DETAILED ANALYSIS INPUTS - LEVEL 2
Value of Time and Accident Costs (in dollars):
43. Light vehicle value-of-time per hour?44. Single-unit vehicle value-of-time per hour?45. Combination vehicle value-of-time per hour?46. Light vehicle accident rate per LV MVM?47. Single-Unit vehicle accident rate per SU MVM?48. Combination vehicle accident rate per CV MVM?49. Accident cost per fatality accident?50. Accident cost per injury accident?51. Accident cost per PD~ accident?52. Percent of total accidents blocking no lanes?53. Percent of total accidents blocking one lane?54. Percent of total accidents blocking two lanes?55. Average minutes to clear non-truck involvements?56. Average minutes to clear truck involvements?57. Maximum queue length before diversion (miles)?
72
Defaults$2,300$600$420$3,220$840$588$1082.01.21.52.50.00030.061.5
Defaults$5.00$10.00$15.001.3182.2682.078$226,800$9,288$1,24259%28%13%39632.1
24.0%
$2,100$650$800
$2,050$700
$1,100$95
ooo
2.20.0004
0.051.7
$0.00$0.00$0.000.6201.1001.590
$225,000$10,000
$3,50064%32%4%31571.6
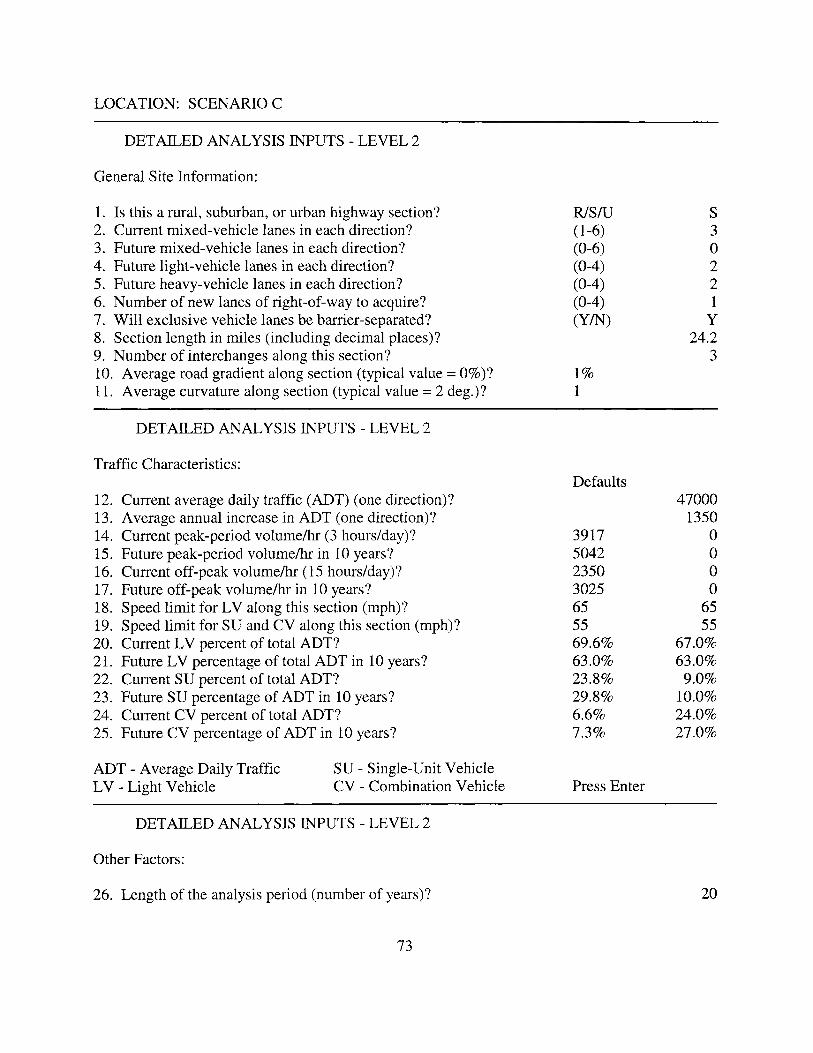
LOCATION: SCENARIO C
DETAILED ANALYSIS INPUTS - LEVEL 2
General Site Information:
1. Is this a rural, suburban, or urban highway section?2. Current mixed-vehicle lanes in each direction?3. Future mixed-vehicle lanes in each direction?4. Future light-vehicle lanes in each direction?5. Future heavy-vehicle lanes in each direction?6. Number of new lanes of right-of-way to acquire?7. Will exclusive vehicle lanes be barrier-separated?8. Section length in miles (including decimal places)?9. Number of interchanges along this section?10. Average road gradient along section (typical value =O%)?11. Average curvature along section (typical value =2 deg.)?
DETAILED ANALYSIS INPUTS - LEVEL 2
Traffic Characteristics:
12. Current average daily traffic (ADT) (one direction)?13. Average annual increase in ADT (one direction)?14. Current peak-period volume/hr (3 hours/day)?15. Future peak-period volume/hr in 10 years?16. Current off-peak volume/hr (15 hours/day)?17. Future off-peak volume/hr in 10 years?18. Speed limit for LV along this section (mph)?19. Speed limit for SU and CV along this section (mph)?20. Current LV percent of total ADT?21. Future LV percentage of total ADT in 10 years?22. Current SU percent of total ADT?23. Future SU percentage of ADT in 10 years?24. Current CV percent of total ADT?25. Future CV percentage of ADT in 10 years?
R1S/u(1-6)(0-6)(0-4)(0-4)(0-4)(YIN)
1%1
Defaults
3917504223503025655569.6%63.0%23.8%29.8%6.6%7.3%
S3o221
y
24.23
470001350
oooo
6555
67.0%63.0%
9.0%10.0%24.0%27.0%
ADT - Average Daily TrafficLV - Light Vehicle
SU - Single-Unit VehicleCV - Combination Vehicle Press Enter
DETAILED ANALYSIS INPUTS - LEVEL 2
Other Factors:
26. Length of the analysis period (number of years)?
73
20

27. How many years of this period are construction? 328. Present value discount rate? 7.5%
DETAILED ANALYSIS INPUTS - LEVEL 2
Facility Construction and 4R Work Cost (in 1000 dollars):Defaults
29. Construction cost per lane mile (unseparated)? $1,900 $1,85030. Construction cost per interchange (unseparated)? $500 $60031. Right-of-way acquisition cost/mile (unseparated)? $405 $55032. Construction cost per lane mile (w/barriers)? $2,660 $2,30033. Construction cost per interchange (w/barriers)? $700 $75034. Right-of-way acquisition cost/mile (w/barriers)? $567 $75035. Average cost per lane mile for major resurfacing? $108 $9036. PSI parameter (delta) (in million 18-kip ESALs)? 2.0 2.237. PSI parameter (beta) used as the power exponent? 1.2 1.138. Minimum allowable PSI (lower bound on PSI curve)? 1.5 1.839. PSI at which resurfacing is desired (0-5 scale)? 2.5 2.740. Average ESALs per light vehicle? 0.0003 0.000841. Average ESALs per single-unit vehicle? 0.06 0.0942. Average ESALs per combination vehicle? 1.5 1.9
DETAILED ANALYSIS INPUTS - LEVEL 2
Value of Time and Accident Costs (in dollars):Defaults
43. Light vehicle value-of-time per hour? $5.00 $6.5044. Single-unit vehicle value-of-time per hour? $10.00 $12.0045. Combination vehicle value-of-time per hour? $15.00 $19.5046. Light vehicle accident rate per LV MVM? 0.986 1.74247. Single-Unit vehicle accident rate per SU MVM? 1.697 1.22148. Combination vehicle accident rate per CV MVM? 1.555 1.25949. Accident cost per fatality accident? $226,800 $195,00050. Accident cost per injury accident? $9,288 $17,90051. Accident cost per PD~ accident? $1,242 $3,80052. Percent of total accidents blocking no lanes? 59% 63%53. Percent of total accidents blocking one lane? 28% 26%54. Percent of total accidents blocking two lanes? 13% 11%55. Average minutes to clear non-truck involvements? 39 2956. Average minutes to clear truck involvements? 63 6757. Maximum queue length before diversion (miles)? 4.0 2.2
74

APPENDIXD
INTERSTATE 81 SECTION DESCRIPTIONS

Southbound 1-81
Section Description Exit Milepost Length
1 Fr: End of Ramp from U.S. Rte. 220 150 150.02 5.91 kInTo: End of Ramp from Rte. 815 146 146.35 (3.67 mi)
2 Fr: End of Ramp from Rte. 815 146 146.35 7.89 kInTo: Beginning of Ramp to Rte. 419 141 141.45 (4.90 mi)
3 Fr: Beginning of Ramp to Rte. 419 141 141.45 7.26 kmTo: End of Ramp from Rte. 112 137 136.94 (4.51 mi)
4 Fr: End Ramp from Rte. 112 137 136.94 7.31 kmTo: Beginning of Ramp to Rte. 647 132 132.40 (4.54 mi)
5 Fr: Beginning of Ramp to Rte. 647 132 132.40 7.10 kmTo: End of Ramp from Rte. 603 128 127.99 (4.41 mi)
6 Fr: End of Ramp from Rte. 603 128 127.99 4.93 kmTo: Rte. 636 Underpass No Exit 124.93 (3.06 mi)
7 Fr: Rte. 636 Underpass No Exit 124.93 6.75 kInTo: Rte. 641 Overpass No Exit 120.74 (4.19 mi)
8 Fr: Rte. 641 Overpass No Exit 120.74 3.57 kInTo: Beginning of Ramp to U.S. Rte. 11/460 118 118.52 (2.22 mi)
Northbound 1-81
9 Fr: End of Ramp from U.S. Rte. 11/460 118 118.64 7.29 kInTo: 0.6 Mile North of Rte. 636 Underpass No Exit 123.17 (4.53 mi)
10 Fr: 0.6 Mile North of Rte. 636 Underpass No Exit 123.17 8.05 kmTo: Beginning of Ramp to Rte. 603 128 128.17 (5.00 mi)
11 Fr: Beginning of Ramp to Rte. 603 128 128.17 6.86 kmTo: End of Ramp from Rte. 647 132 132.43 (4.26 mi)
12 Fr: End of Ramp from Rte. 647 132 132.43 7.34 kInTo: Beginning of Ramp to Rte. 112 137 136.99 (4.56 mi)
13 Fr: Beginning of Ramp to Rte. 112 137 136.99 7.53 kInTo: End of Ramp from Rte. 419 141 141.67 (4.68 mi)
14 Fr: End of Ramp from Rte. 419 141 141.67 7.58 kInTo: Beginning of Ramp to Rte. 115 146 146.38 (4.71 mi)
15 Fr: Beginning of Ramp to Rte. 115 146 146.38 5.91 kmTo: Beginning of Ramp to U.S. Rte. 220 150 150.14 (3.76 mi)
77

APPENDIXE
LEVEL 2 ANALYSIS INPUT DATA

81

Southbound SectionsFacility Construction and 4R Work Cost (in 1000's dollars)
1 2 3 4 5 6 7 8
29. Construction cost per lane mile (unseparated)? $0 $0 $0 $0 $0 $0 $0 $0
30. Construction cost per interchange (unseparated)? increase in $0 $0 $0 $0 $0 $0 $0 $0
31. Right-of-way acquisition cost/nlile (unseparated)? $0 $0 $0 $0 $0 $0 $0 $0
32. Construction cost per lane ,nile (w/barriers)? $1,053 $892 $1,285 $1,075 $1,046 $855 $921 $1,137
33. Construction cost per interchange (w/barriers)? $0 $0 $0 $0 $0 $0 $0 $0
34. Right-of-way acquisition cost/mile (w/barriers)? $0 $0 $0 $0 $0 $0 $0 $0
35. Ave. cost per lane mile for major resuifacing? $39.9 $39.9 $39.9 $39.9 $39.9 $39.9 $39.9 $39.9
36. PSI parameter (delta) (in million 18-kip ESAL's)? 2.0 2.0 2.0 2.0 2.0 2.0 2.0 2.0
37. PSI parameter (beta) used as the power exponent? 1.2 1.2 1.2 1.2 1.2 1.2 1.2 1.2
38. Minimum allowable PSI (lower bound on PSI curve)? 1.5 1.5 1.5 1.5 1.5 1.5 1.5 1.5
39. PSI at which resuifacing is desired (0-5) scale? 2.5 2.5 2.5 2.5 2.5 2.5 2.5 2.5
40. Ave. ESAL's per light vehicle? 0.0003 0.0003 0.0003 0.0003 0.0003 0.0003 0.0003 0.0003
41. Ave. ESAL's per single-unit vehicle? 0.37 0.37 0.37 0.37 0.37 0.37 0.37 0.37
42. Ave. ESAL's per combination vehicle? 1.28 1.28 1.28 1.28 1.28 1.28 1.28 1.28
Southbound SectionsValue-of-Time and Accident Costs (in dollars)
1 2 3 4 5 6 7 8
43. Light vehicle value-of:time per hour? 6.70 6.70 6.70 6.70 6.70 6.70 6.70 6.70
44. Single-unit vehicle value-of:time per hour? 14.66 14.66 14.66 14.66 14.66 14.66 14.66 14.66
45. Combination vehicle value-of-time per hour? 20.94 20.94 20.94 20.94 20.94 20.94 20.94 20.94
46. Light vehicle accident rate per LV MVM? 0.525 0.561 0.763 0.404 0.698 0.681 0.715 0.720
47. Single-unit vehicle accident rate per SU MVM? 1.799 1.023 0.762 0.765 0.829 0.306 0.224 0.844
48. Combination vehicle accident rate per CV MVM? 0.191 0.111 0.238 0.365 0.309 0.565 0.455 1.108
49. Accident costs per fatality accident? $2,450,0 $2,450,0 $2,450,0 $2,450,0 $2,450,0 $2,450,0 $2,450,0 $2,450,0
50. Accident costs per injury accident? $19,862 $19,862 $19,862 $19,862 $19,862 $19,862 $19,862 $19,862
51. Accident costs per PD~ accident? $4,427 $4,427 $4,427 $4,427 $4,427 $4,427 $4,427 $4,427
52. Percent of total accidents blocking no lanes? 90% 90% 90% 90% 90% 90% 900/0 90%
53. Percent oftotal accidents blocking one lane? 5% 5% 5% 5% 5% 5% 5% 5%
54. Percent of total accidents blocking two lanes? 5% 5% 5% 5% 5% 5% 5% 5%
55. Ave. minutes to clear non-truck involvements? 89 81 68 39 112 108 54 102
56. Ave. minutes to clear truck involvements? 75 35 99 78 55 78 194 31
57. Maximum queue length before diversion (miles)? 3.37 2.80 3.01 4.54 4.07 3.40 7.59 9.81
NOTE: Values for the shaded blocks varied consistent with the four exclusive lane alternatives analyzed.
82

LEVEL 2 ANALYSIS INPUT DATA - 1-81 (3-Lane Sections)
Northbound SectionsGeneral Site Information
9 10 11 12 13 14 15
1. Rural, suburban, or urban highway R/S/U? R R R R R R R
2. Current mixed-vehicle lanes in each direction (0-6)? 3 3 3 3 3 3 3
3. Future mixed-vehicle lanes in each direction (0-6)?
4. Future light-vehicle lanes in each direction (0-6)?
5. Future heavy-vehicle lanes in each direction (0-4)?
6. Number ofnew lanes of right-of-way to acquire (0-4)?
7. Will exclusive vehicle lanes be barrier separated? (YIN)? (yIN)?
8. Length ofsection in miles (including decimal places)? 4.53 5.00 4.26 4.54 4.68 4.71 3.67
9. Number of interchanges along this section? 0 0 2 0 3
10. Ave. road gradient along section (typ. value =0 %)? -1.92 -1.80 0.37 -0.89 -0.20 -0.15 0.40
11. Ave. curvature along section (typ. value =2 deg.)? 0.68 1.39 0.75 0.32 0.40 0.44 0.48
Northbound SectionsTraffic Characteristics
9 10 11 12 13 14 15
12. Current ave. daily traffic (ADT) (one direction)? 20,000 20,000 20,045 21,2404 22,970 24,273 21,546
13. Ave. annual increase in ADT (one direction)? 500 500 545 482 778 663 795
14. Current peak-period volume/hr. (3 hours/day)? 1,328 1,328 1,331 1,410 1,524 1,611 1,430
15. Future peak-period volume/hr. in 10 years? 1,660 1,660 1,693 1,746 2,041 2,051 1,959
16. Current off-peak volume/hr. (15 hours/day)? 1,068 1,068 1,070 1,134 1,229 1,296 1,150
17. Future off-peak volume/hr. in 10 years? 1,335 1,335 1,361 1,404 1,642 1,650 1,575
18. Speed limitfor LV along this section (mph)? 65 65 65 65 65 65 65
19. Speed limit for SU and CValong this section (mph)? 65 65 65 65 65 65 65
20. Current LV percentage of total ADT? 69 69 74 74 75 79.5 78
21. Future LV percentage ofADT in 10 years? 69 69 74 74 75 79.5 78
22. Current SU percentage oftotal ADT? 5 5 4 4 4 3.5 2
23. Future SU percentage ofADT in 10 years? 5 5 4 4 4 3.5 2
24. Current CV percentage of total ADT? 26 26 22 22 21 17 20
25. Future CV percentage ofADT in 10 years? 26 26 22 22 21 17 20
Northbound SectionsOther Factors
9 10 11 12 13 14 15
26. Length ofanalysis period (number ofyears)? 20 20 20 20 20 20 20
27. How many years o.fthis period are construction?
28. Present value discount rate? 6.0 6.0 6.0 6.0 6.0 6.0 6.0
83

Northbound SectionsFacility Construction and 4R Work Cost (in 1000's dollars)
9 10 11 12 13 14 15
29. Construction cost per lane mile (unseparated)? $0 $0 $0 $0 $0 $0 $0
30. Construction cost per interchange (unseparated)? increase in $0 $0 $0 $0 $0 $0 $0
31. Right-o.f~way acquisition cost/mile (ullseparated)? $0 $0 $0 $0 $0 $0 $0
32. Construction cost per lane ,nile (wlbarriers)? $917 $855 $1,053 $1,074 $1,199 $1,030 $1,048
33. Construction cost per interchange (wlbarriers)? $0 $0 $0 $0 $0 $0 $0
34. Right-of-way acquisition cost/mile (wlbarriers)? $0 $0 $0 $0 $0 $0 $0
35. Ave. cost per lane mile for major resuifacing? $39.9 $39.9 $39.9 $39.9 $39.9 $39.9 $39.9
36. PSI parameter (delta) (in million 18-kip ESAL's)? 2.0 2.0 2.0 2.0 2.0 2.0 2.0
37. PSI parameter (beta) used as the power exponent? 1.2 1.2 1.2 1.2 1.2 1.2 1.2
38. Minimum allowable PSI (lower bound on PSI curve)? 1.5 1.5 1.5 1.5 1.5 1.5 1.5
39. PSI at which resuifacing is desired (0-5) scale? 2.5 2.5 2.5 2.5 2.5 2.5 2.5
40. Ave. ESAL's per light vehicle? 0.0003 0.0003 0.0003 0.0003 0.0003 0.0003 0.0003
41. Ave. ESAL's per single-unit vehicle? 0.37 0.37 0.37 0.37 0.37 0.37 0.37
42. Ave. ESAL's per combination vehicle? 1.28 1.28 1.28 1.28 1.28 1.28 1.28
Northbound SectionsValue-of-Time and Accident Costs (in dollars)
9 10 11 12 13 14 15
43. Light vehicle value-of-titne per hour? 6.70 6.70 6.70 6.70 6.70 6.70 6.70
44. Single-unit vehicle value-oftime per hour? 14.66 14.66 14.66 14.66 14.66 14.66 14.66
45. Combination vehicle value-of-time per hour? 20.94 20.94 20.94 20.94 20.94 20.94 20.94
46. Light vehicle accident rate per LV MVM? 0.881 0.436 0.513 0.267 0.456 0.525 0.658
47. Single-unit vehicle accident rate per SU MVM? 1.358 0.380 0.315 0.486 0.708 1.258 3.211
48. Combination vehicle accident rate per CV MVM? 0.451 0.281 0.619 0.418 0.558 0.420 0.490
49. Accident costs per fatality accident? $2,450,0 $2,450,0 $2,450,0 $2,450,0 $2,450,0 $2,450,0 $2,450,0
50. Accident costs per injury accident? $19,862 $19,862 $19,862 $19,862 $19,862 $19,862 $19,862
51. Accident costs per PD~ accident? $4,427 $4,427 $4,427 $4,427 $4,427 $4,427 $4,427
52. Percent of total accidents blocking no lanes? 87% 87% 87% 87% 87% 87% 870/0
53. Percent of total accidents blocking one lane? 11% 11% 11% 11% 11% 11% 11%
54. Percent of total accidents blocking two lanes? 2% 2% 2% 2% 2% 2% 2%
55. Ave. minutes to clear non-truck involvements? 67 155 105 145 52 52 116
56. Ave. minutes to clear truck involvements? 182 154 54 182 73 132 77
57. Maximum queue length before diversion (miles)? 4.99 9.99 3.84 4.96 2.93 2.79 3.67
NOTE: Values for the shaded blocks varied consistent with the four exclusive lane alternatives analyzed.
84

85

Southbound SectionsFacility Construction and 4R Work Cost (in 1000's dollars)
1 2 3 4 5 6 7 8
29. Construction cost per lane mile (unseparated)? $0 $0 $0 $0 $0 $0 $0 $0
30. Construction cost per interchange (unseparated)? increase in $0 $0 $0 $0 $0 $0 $0 $0
31. Right-of-way acquisition cost/tnile (unseparated)? $0 $0 $0 $0 $0 $0 $0 $0
32. Construction cost per lane mile (wlbarriers)? $1,053 $892 $1,285 $1,075 $1,046 $855 $921 $1,137
33. Construction cost per interchange (wlbarriers)? $0 $0 $0 $0 $0 $0 $0 $0
34. Right-of-way acquisition cost/mile (w/barriers)? $0 $0 $0 $0 $0 $0 $0 $0
35. Ave. cost per lane mile for major resurfacing? $39.9 $39.9 $39.9 $39.9 $39.9 $39.9 $39.9 $39.9
36. PSI parameter (delta) (in million 18-kip ESAL's)? 2.0 2.0 2.0 2.0 2.0 2.0 2.0 2.0
37. PSI parameter (beta) used as the power exponent? 1.2 1.2 1.2 1.2 1.2 1.2 1.2 1.2
38. Minimum allowable PSI (lower bound on PSI curve)? 1.5 1.5 1.5 1.5 1.5 1.5 1.5 1.5
39. PSI at which resurfacing is desired (0-5) scale? 2.5 2.5 2.5 2.5 2.5 2.5 2.5 2.5
40. Ave. ESAL's per light vehicle? 0.0003 0.0003 0.0003 0.0003 0.0003 0.0003 0.0003 0.0003
41. Ave. ESAL's per single-unit vehicle? 0.37 0.37 0.37 0.37 0.37 0.37 0.37 0.37
42. Ave. ESAL's per combination vehicle? 1.28 1.28 1.28 1.28 1.28 1.28 1.28 1.28
Southbound SectionsValue-of-Time and Accident Costs (in dollars)
1 2 3 4 5 6 7 8
43. Light vehicle value-of-time per hour? 6.70 6.70 6.70 6.70 6.70 6.70 6.70 6.70
44. Single-unit vehicle value-of-time per hour? 14.66 14.66 14.66 14.66 14.66 14.66 14.66 14.66
45. Combination vehicle value-oj~time per hour? 20.94 20.94 20.94 20.94 20.94 20.94 20.94 20.94
46. Light vehicle accident rate per LV MVM? 0.525 0.561 0.763 0.404 0.698 0.681 0.715 0.720
47. Single-unit vehicle accident rate per SU MVM? 1.799 1.023 0.762 0.765 0.829 0.306 0.224 0.844
48. Combination vehicle accident rate per CV MVM? 0.191 0.111 0.238 0.365 0.309 0.565 0.455 1.108
49. Accident costs per fatality accident? $2,450,0 $2,450,0 $2,450,0 $2,450,0 $2,450,0 $2,450,0 $2,450,0 $2,450,0
50. Accident costs per injury accident? $19,862 $19,862 $19,862 $19,862 $19,862 $19,862 $19,862 $19,862
51. Accident costs per PD~ accident? $4,427 $4,427 $4,427 $4,427 $4,427 $4,427 $4,427 $4,427
52. Percent of total accidents blocking no lanes? 90% 900/0 90% 90% 90% 900/0 90% 90%
53. Percent of total accidents blocking one lane? 5% 5% 5% 5% 5% 5% 5% 5%
54. Percent oftotal accidents blocking two lanes? 5% 5% 5% 5% 5% 5% 5% 5%
55. Ave. minutes to clear non-truck involvements? 89 81 68 39 112 108 54 102
56. Ave. minutes to clear truck involvements? 75 35 99 78 55 78 194 31
57. Maximum queue length before diversion (miles)? 3.37 2.80 3.01 4.54 4.07 3.40 7.59 9.81
NOTE: Values for the shaded blocks varied consistent with the six exclusive lane alternatives analyzed.
86

LEVEL 2 ANALYSIS INPUT DATA - 1-81 (4-Lane Sections)
Northbound SectionsGeneral Site Information
9 10 11 12 13 14 15
1. Rural, suburban, or urban highway RlS/U? R R R R R R R
2. Current mixed-vehicle lanes in each direction (0-6)? 4 4 4 4 4 4 4
3. Future mixed-vehicle lanes in each direction (0-6)?
4. Future light-vehicle lanes in each direction (0-6)?
5. Future heavy-vehicle lanes in each direction (0-4)?
6. Number ofnew lanes of right-of-way to acquire (0-4)?
7. Will exclusive vehicle lanes be barrier separated? (YIN)? (yIN)?
8. Length ofsection in miles (including decimal places)? 4.53 5.00 4.26 4.54 4.68 4.71 3.67
9. Number of interchanges along this section? 0 0 2 0 3
10. Ave. road gradient along section (typ. value =O%)? -1.92 -1.80 0.37 -0.89 -0.20 -0.15 0.40
11. Ave. curvature along section (typ. value =2 deg.)? 0.68 1.39 0.75 0.32 0.40 0.44 0.48
Northbound SectionsTraffic Characteristics
9 10 11 12 13 14 15
12. Current ave. daily traffic (ADT) (one direction)? 20,000 20,000 20,045 21,2404 22,970 24,273 21,546
13. Ave. annual increase in ADT (one direction)? 500 500 545 482 778 663 795
14. Current peak-period volume/hr. (3 hours/day)? 1,328 1,328 1,331 1,410 1,524 1,611 1,430
15. Future peak-period volume/hr. in 10 years? 1,660 1,660 1,693 1,746 2,041 2,051 1,959
16. Current off-peak volume/hr. (15 hours/day)? 1,068 1,068 1,070 1,134 1,229 1,296 1,150
17. Future off-peak volume/hr. in 10 years? 1,335 1,335 1,361 1,404 1,642 1,650 1,575
18. Speed limitfor LV along this section (mph)? 65 65 65 65 65 65 65
19. Speed limitfor SU and CValong this section (mph)? 65 65 65 65 65 65 65
20. Current LV percentage oftotal ADT? 69 69 74 74 75 79.5 78
21. Future LV percentage ofADT in 10 years? 69 69 74 74 75 79.5 78
22. Current SU percentage oftotal ADT? 5 5 4 4 4 3.5 2
23. Future SU percentage ofADT in 10 years? 5 5 4 4 4 3.5 2
24. Current CV percentage of total ADT? 26 26 22 22 21 17 20
25. Future CV percentage ofADT in 10 years? 26 26 22 22 21 17 20
Northbound SectionsOther Factors
9 10 11 12 13 14 15
26. Length ofanalysis period (number ofyears)? 20 20 20 20 20 20 20
27. How many years of this period are construction?
28. Present value discount rate? 6.0 6.0 6.0 6.0 6.0 6.0 6.0
87

Northbound SectionsFacility Construction and 4R Work Cost (in 1000's dollars)
9 10 11 12 13 14 15
29. Construction cost per lane mile (unseparated)? $0 $0 $0 $0 $0 $0 $0
30. Construction cost per interchange (unseparated)? increase in $0 $0 $0 $0 $0 $0 $0
31. Right-of-way acquisition cost/mile (unseparated)? $0 $0 $0 $0 $0 $0 $0
32. Construction cost per lane ,nile (w/barriers)? $917 $855 $1,053 $1,074 $0,1998 $1,030 $1,048
33. Construction cost per interchange (w/barriers)? $0 $0 $0 $0 $0 $0 $0
34. Right-of-way acquisition cost/mile (w/barriers)? $0 $0 $0 $0 $0 $0 $0
35. Ave. cost per lane mile for major resurfacing? $39.9 $39.9 $39.9 $39.9 $39.9 $39.9 $39.9
36. PSI parameter (delta) (in million 18-kip ESAL's)? 2.0 2.0 2.0 2.0 2.0 2.0 2.0
37. PSI parameter (beta) used as the power exponent? 1.2 1.2 1.2 1.2 1.2 1.2 1.2
38. Minimum allowable PSI (lower bound on PSI curve)? 1.5 1.5 1.5 1.5 1.5 1.5 1.5
39. PSI at which resurfacing is desired (0-5) scale? 2.5 2.5 2.5 2.5 2.5 2.5 2.5
40. Ave. ESAL's per light vehicle? 0.0003 0.0003 0.0003 0.0003 0.0003 0.0003 0.0003
41. Ave. ESAL's per single-unit vehicle? 0.37 0.37 0.37 0.37 0.37 0.37 0.37
42. Ave. ESAL's per combination vehicle? 1.28 1.28 1.28 1.28 1.28 1.28 1.28
Northbound SectionsValue-of-Time and Accident Costs (in dollars)
9 10 11 12 13 14 15
43. Light vehicle value-of-time per hour? 6.70 6.70 6.70 6.70 6.70 6.70 6.70
44. Single-unit vehicle value-of-time per hour? 14.66 14.66 14.66 14.66 14.66 14.66 14.66
45. Combination vehicle value-of-time per hour? 20.94 20.94 20.94 20.94 20.94 20.94 20.94
46. Light vehicle accident rate per LV MVM? 0.881 0.436 0.513 0.267 0.456 0.525 0.658
47. Single-unit vehicle accident rate per SU MVM? 1.358 0.380 0.315 0.486 0.708 1.258 3.211
48. Combination vehicle accident rate per CV MVM? 0.451 0.281 0.619 0.418 0.558 0.420 0.490
49. Accident costs per fatality accident? $2,450,0 $2,450,0 $2,450,0 $2,450,0 $2,450,0 $2,450,0 $2,450,0
50. Accident costs per injury accident? $19,862 $19,862 $19,862 $19,862 $19,862 $19,862 $19,862
51. Accident costs per PD~ accident? $4,427 $4,427 $4,427 $4,427 $4,427 $4,427 $4,427
52. Percent oftotal accidents blocking no lanes? 87% 87% 87% 87% 87% 87% 87%
53. Percent oftotal accidents blocking one lane? 11% 11% 11% 11% 11% 11% 11%
54. Percent of total accidents blocking two lanes? 2% 2% 2% 2% 2% 2% 2%
55. Ave. minutes to clear non-truck involvements? 67 155 105 145 52 52 116
56. Ave. minutes to clear truck involvements? 182 154 54 182 73 132 77
57. Maximum queue length before diversion (miles)? 4.99 9.99 3.84 4.96 2.93 2.79 3.67
NOTE: Values for the shaded blocks varied consistent with the six exclusive lane alternatives analyzed.
88

APPENDIXF
CONSUMER PRICE INDEX (CPI)

Consumer Price Index (CPI)TO
FROM 1970 1971 1972 1973 1974 1975 1976 1977 1978 1979 1980 1981 1982 1983 1984 1985 1986 1987 1988 1989 1990 1991 1992 1993 1994 1995
1970 1 1.043 1.078 1.144 1.270 1.386 1.466 1.561 1.680 1.869 2.122 2.342 2.486 2.566 2.675 2.770 2.824 2.927 3.046 3.195 3.368 3.509 3.615 3.723 3.819 3.922
1971 0.958 1 1.033 10.97 1.217 1.328 1.405 1.496 1.609 1.791 2.035 2.245 2.382 2.485 2.563 2.654 2.708 2.806 2.921 3.064 3.229 3.365 3.467 3.570 3.662 3.761
1972 0.928 0.968 1 1.062 1.179 1.286 1.361 1.448 1.599 1.735 1.971 2.174 2.307 2.381 2.482 2.571 2.620 2.717 2.828 2.964 3.124 3.256 3.354 3.454 3.543 3.638
1973 0.874 0.911 0.941 1 1.110 1.211 1.281 1.364 1.467 1.633 1.856 2.047 2.173 2.243 2.338 2.421 2.469 2.558 2.662 2.793 2.944 3.068 3.161 3.255 3.339 3.429
1974 0.787 0.821 0.848 0.901 1 1.091 1.154 1.229 1.322 1.472 1.672 1.844 1.956 2.019 2.105 2.180 2.224 2.305 2.399 2.516 2.652 2.764 2.847 2.932 3.007 3.088
1975 0.721 0.752 0.777 0.826 0.916 1 1.058 1.126 1.212 1.349 1.532 1.690 1.792 1.850 1.929 1.997 2.038 2.112 2.198 2.306 2.430 2.533 2.609 2.687 2.756 2.830
1976 0.682 0.712 0.736 0.781 0.866 0.945 1 1.065 1.145 1.275 1.449 1.598 1.696 1.750 1.824 1.889 1.926 1.997 2.078 2.180 2.297 2.393 2.465 2.539 2.604 2.675
1977 0.641 0.668 0.690 0.733 0.814 0.888 0.939 1 1.076 1.198 1.361 1.501 1.594 1.645 1.715 1.776 1.809 1.876 1.952 2.047 2.157 2.248 2.316 2.385 2.446 2.512
1978 0.595 0.621 0.642 0.682 0.756 0.825 0.873 0.929 1 1.113 1.265 1.395 1.479 1.527 1.592 1.648 1.681 1.742 1.813 1.902 2.005 2.089 2.152 2.216 2.273 2.334
1979 0.535 0.588 0.576 0.612 0.679 0.741 0.784 0.835 0.898 1 1.135 1.253 1.330 1.373 1.431 1.482 1.511 1.566 1.630 1.710 1.802 1.878 1.934 1.992 2.043 2.098
1980 0.471 0.491 0.508 0.539 0.598 0.653 0.690 0.735 0.791 0.881 1 1.103 1.171 1.209 1.260 1.305 1.331 1.379 1.436 1.506 1.587 1.654 1.704 1.755 1.800 1.848
1981 0.427 0.445 0.460 0.489 0.542 0.592 0.626 0.666 0.717 0.798 0.907 1 1.062 1.096 1.142 1.183 1.206 1.250 1.301 1.364 1.438 1.499 1.544 1.590 1.631 1.675
1982 0.402 0.420 0.434 0.460 0.511 0.558 0.590 0.628 0.676 0.752 0.853 0.942 1 1.032 1.075 1.114 1.136 1.178 1.226 1.285 1.355 1.412 1.454 1.498 1.536 1.578
1983 0.390 0.406 0.420 0.446 0.495 0.540 0.571 0.608 0.655 0.728 0.827 0.913 0.970 1 1.043 1.080 1.100 1.141 1.187 1.245 1.312 1.367 1.408 1.450 1.487 1.528
1984 0.374 0.390 0.403 0.428 0.475 0.518 0.548 0.584 0.628 0.699 0.793 0.876 0.930 0.960 1 1.036 1.056 1.094 1.139 1.195 1.259 1.312 1.352 1.392 1.428 1.466
1985 0.361 0.376 0.389 0.413 0.458 0.500 0.529 0.564 0.606 0.675 0.766 0.846 0.898 0.926 0.966 1 1.019 1.057 1.100 1.153 1.215 1.266 1.304 1.343 1.378 1.415
1986 0.354 0.369 0.382 0.405 0.450 0.491 0.519 0.553 0.595 0.662 0.751 0.829 0.880 0.909 0.947 0.981 1 1.036 1.079 1.131 1.193 1.243 1.208 1.318 1.352 1.389
1987 0.342 0.356 0.368 0.391 0.434 0.474 0.501 0.533 0.574 0.639 0.725 0.800 0.849 0.876 0.914 0.946 0.965 1 1.041 1.092 1.151 1.199 1.235 1.272 1.305 1.340
1988 0.328 0.342 03.54 0.376 0.417 0.455 0.481 0.512 0.552 0.614 0.697 0.769 0.816 0.842 0.878 0.909 0.926 0.960 1 1.048 1.105 1.151 1.186 1.221 1.253 1.287
1989 0.313 0.326 0.337 0.358 0.397 0.434 0.459 0.489 0.526 0.585 0.664 0.733 0.778 0.804 0.837 0.867 0.884 0.916 0.954 1 1.054 1.098 1.131 1.165 1.195 1.227
1990 0.297 0.310 0.320 0.340 0.377 0.411 0.435 0.464 0.499 0.555 0.630 0.695 0.738 0.762 0.794 0.823 0.839 0.869 0.905 0.949 1 1.042 1.073 1.106 1.134 1.164
1991 0.285 0.297 0.307 0.326 0.362 0.395 0.418 0.445 0.479 0.533 0.605 0.667 0.708 0.732 0.762 0.790 0.805 0.834 0.869 0.910 0.960 1 1.030 1.061 1.088 1.117
1992 0.277 0.288 0.298 0.316 0.351 0.383 0.406 0.432 0.465 0.517 0.587 0.648 0.688 0.710 0.740 0.767 0.781 0.810 0.843 0.884 0.932 0.971 1 1.030 1.056 1.085
1993 0.269 0.280 0.289 0.307 0.341 0.372 0.394 0.419 0.451 0.502 0.570 0.629 0.668 0.690 0.718 0.744 0.758 0.786 0.819 0.858 0.904 0.943 0.971 1 1.026 1.053
1994 0.262 0.273 0.282 0.300 0.333 0.363 0.384 0.409 0.440 0.489 0.556 0.613 0.651 0.672 0.700 0.726 0.740 0.767 0.798 0.837 0.882 0.919 0.947 0.975 1 1.027
1995 0.255 0.266 0.275 0.292 0.324 0.353 0.374 0.398 0.428 0.477 0.541 0.597 0.634 0.655 0.682 0.707 0.720 0.747 0.777 0.815 0.859 0.895 0.922 0.949 0.974
Source: Adapted from "Monthly Labor Review" and estimated.
91

APPENDIXG
BENEFIT/COST SUMMARY AND STATISTICS SUMMARY

COST SUMMARY(In $1000s) Base Case
No Traffic incr. Traffic incr.Alternative Case
Traffic incr. Net Costs
Resurfacing LanesVehicle OperationNew ConstructionRight of Way
Total
BENEFIT SUMMARY(in $1000s)
Travel TimeAccident CostsAccident Delays
Total
BENEFIT/COST RATIOS
1814177281
oo
$179095
6575212864
o$78617
1620213609
oo
$215229
7923515501
o$94736
9065213609
oo
$222674
79239-545
o$78694
7445ooo
$7445
-416045
o$16042
With Vehicle Operating CostsNet Present Value = $8597Benefit/Cost Ratio = 2.155
Without Vehicle Operating CostsNet Present Value = $8597Benefit/Cost Ratio = 2.155
Press enter to invoke menu
1 =Benefit/Cost Summary 2 =Statistics Summary
95
Press any other key to exit

STATISTICS SUMMARY Base Case Alternative Case
Total VMT (in 1000s)Total AccidentsAvg. Accident CostAvg. Delay CostAvg. Travel Speed
No Traffic incr.697734
504$44526
$065.00
Traffic incr.872197
630$44526
$065.00
Traffic incr.872197
17-$58800
$065.00
Net Diff.o
-613-$103326
$00.00
R/S/U1-60-60-40-40-4YIN)
LOCATION: 1-81 SB: (Sect. 4)
General Site Information:
1. Is this a rural. suburban, or urban highway section?2. Current mixed-vehicle lanes in each direction?3. Future mixed-vehicle lanes in each direction?4. Future light-vehicle lanes in each direction?5. Future heavy vehicle lanes in each direction?6. Number of new lanes of right-of-way to acquire?7. Will exclusive vehicle lanes be barrIer seRarated?8. Section length in miles (including decimal places)?9. Number of Interchanges along thIS section!
10. Average road gradient along section (typical value =O%)?11. Average curvature along section (typIcal value =2 deg.)?
R413ooN
4.5o
1%1
Press enter to invoke menu
1 =Benefit/Cost Summary 2 =Statistics Summary
96
Press any other key to exit