virginia nutrient management standards and criteria · virginia nutrient management . standards and...
TRANSCRIPT

Commonwealth of Virginia
Virginia Nutrient Management Standards and Criteria
Revised July 2014
Department of Conservation and Recreation Division of Soil and Water Conservation
600 East Main Street, 4th floor Richmond, VA 23219
(804) 786-2064


VIRGINIA NUTRIENT MANAGEMENT STANDARDS AND CRITERIA
Revised July 2014
Virginia Department of Conservation and Recreation
Division of Soil and Water Conservation 600 East Main Street, 4th Floor
Richmond, VA 23219


Table of Contents
Instructions .................................................................................................................................................... 1 Section I. Agronomic and Environmental Management of Soils and Other Site Features .................. 3
Table 1-1: Soil Productivity Groupings for Various Cropping Categories................................................ 3 Table 1-2: Estimated Yields in Bushels or Tons per Acre ..................................................................... 25 Table 1-3: Utilizing Erosion/Slope Information ...................................................................................... 26
Section I.A Explanation of Environmentally Sensitive Sites ................................................................. 27 Table 1-4: Nitrogen Loss Risk and Environmentally Sensitive Ratings................................................. 28
Section I.B Recommended Setback Areas .............................................................................................. 37 Section II. Soil Test Calibrations and Correlations ................................................................................ 39
Table 2-1: Virginia Tech Soil Test Calibrations ..................................................................................... 39 Table 2-2: Correlation of Soil Analysis for Phosphorus - Mehlich III to Mehlich I .................................. 41 Table 2-3: Correlation of Soil Analysis for Potassium - Mehlich III to Mehlich I .................................... 42
Section III. Lime Recommendations for Virginia Crops ......................................................................... 43 Table 3-1: Lime Recommendations for VA Crops ................................................................................. 44 Table 3-2: Lime Application Rate Based on SMP Buffer Test ............................................................... 45 Table 3-3: Lime Application Rate Adjustment based on % CCE of Material ......................................... 45
Section IV. Phosphorus Management ...................................................................................................... 47 Table 4-1: Virginia Phosphorus Saturation Levels Where Phosphorus Shall not be Applied ............... 47 Table 4-2: Phosphorus Environment Thresholds .................................................................................. 48 Table 4-3: Interpretation of Phosphorus Index Value ............................................................................ 50 Table 4-4: Erosion Risk Assessment Formula ...................................................................................... 51 Table 4-5: Topography and Climate Factors ......................................................................................... 52 Table 4-6: Tillage Management ............................................................................................................. 53 Table 4-7: VA Nutrient Management Planning P2O5 Removal Table for Grain and Forage Crops ...... 55
Section V. Crop Nutrient Recommendations .......................................................................................... 60 Figure 5-1: Nitrogen Uptake by Wheat .................................................................................................. 72 Figure 5-2: Growth Stage 25 - First Spring Nitrogen Application to Wheat ........................................... 74 Figure 5-3: Growth Stage 30 - Second Spring Nitrogen Application to Wheat ..................................... 75 Figure 5-4: White Potato Petiole Sap Nitrate Concentration before Flowering ..................................... 80
Section VI. Turfgrass Nutrient Recommendations ................................................................................. 96 Figure 6-1: Average Dates of First Killing Frost in Fall .......................................................................... 97 Figure 6-2: Average Dates of Last Killing Frost in Spring ..................................................................... 97
Section VII. Estimated Nitrogen Availability to Succeeding Crops From Legumes ......................... 108 Table 7-1: Estimated Nitrogen Availability to Succeeding Crops From Legumes ............................... 108
Section VIII. Manure Management .......................................................................................................... 109 Table 8-1: Manure Ammonium Nitrogen Availability Coefficients ...................................................... 109 Table 8-2: Coefficients for Organic N Availability in Manures ............................................................. 109 Table 8-3: Manure Residual Factors for Previous Applications .......................................................... 110 Table 8-4: Average Analysis for Manure Tested in Virginia ................................................................ 111 Table 8-5: Animal Manure Production Rates ....................................................................................... 112 Table 8-6: Annual Liquid Animal Waste Volume Available for Land Application ................................ 113 Table 8-7: Virginia Annual Normal Precipitation and Lake Evaporation.............................................. 115 Table 8-8: Maximum Wastewater Irrigation Application Rates for Different Soil Types ...................... 116
Section IX. Biosolids Management ........................................................................................................ 117 Table 9-1: Estimated Nitrogen Mineralization Rates for Biosolids ...................................................... 117 Table 9-2: Biosolids Ammonium Nitrogen Availability Coefficients ..................................................... 117


1
Instructions for the Use of the Virginia Nutrient Management Standards and Criteria, Revised 2014
♦ When producer records are utilized to establish expected crop yields, average the three highest yields achieved over the last five crop years the particular crop was grown in the field, (i.e. exclude the two lowest crop yields before calculating the average). The corresponding soil productivity group for the field is determined by finding the expected crop yield in Table 1-2 that is closest to the above determined yield. These yields must be adjusted to reflect standard moisture levels for grains and forages as indicated in Table 1-2. ♦ When developing nutrient recommendations using the Virginia Agronomic Land Use Evaluation System (VALUES), first determine the soil map units (soil series) within field boundaries from the soil survey maps of the subject farm. Using this information, the soil productivity group is determined from Table 1-1 for each crop to be grown. ♦ Using the Virginia Agronomic Land Use Evaluation System (VALUES), Table 1-2, the expected yield of a c rop for any one field may be det ermined in one o f two ways. If any single soil productivity group comprises 67% or more of a field, this is considered a predominant soil group, and it may be us ed to establish the expected yield for the entire field. The other method is to use a w eighted average of all soil productivity groups to determine the expected yield and nutrient recommendations. If several map units make up a field representing multiple productivity groups, none of which account for 67% or more of the field, then the weighted average method to determine the expected crop yield shall be used. ♦ When using the weighted average method, determine expected crop yield for each soil map unit from Table 1-2, and determine the weighted average yield for the field by summing the fractional yields for each soil map unit. After the weighted average expected yield is calculated and any yield reductions are considered, the soil productivity group of the field is determined by finding the expected crop yield in Table 1-2 which is closest to the weighted average yield. ♦ To establish an expected yield for a soil series complex use a weighted average formula based on the percentages for each complex as specified in the county soil survey OR with percentages of 60%-40% for complexes with two named soils and 50%-30%-20% for complexes with three named soils. In complexes, the percentages shall be appl ied in decending order in the same order as the soils are denoted in the complex name. ♦ Micronutrient or trace element recommendations should be made using Virginia Tech Soil Test Note 4: Trace Elements, (Publication 452-234) or the Commercial Vegetable Production Recommendations 2005 ( Publication 456-420). With the exception of boron, micronutrient recommendations should be based on soil test levels. ♦ Once the expected yield for a crop is determined, a yield reduction will need to be applied if certain conditions exist within the soil profile such as eroded topsoil, slope, coarse fragments and rock outcrops. These conditions are explained with the associated yield reductions in Table 1-3.

2
♦ A field shall be considered an “environmentally sensitive site”, where any part of the field drains into a sinkhole or if at least 33% of the area of the field contains one o r a combination of the following features: 1. Soils with high potential for leaching based on soil texture or excessive drainage
(Table 1-4); 2. Shallow soils less than 41 inches deep likely to be located over fractures or limestone
bedrock (Table 1-4); 3. Subsurface tile drains; 4. Soils with high potential for subsurface lateral flow based on soil texture and poor
drainage table 1-4); 5. Floodplains as identified by soils prone to frequent flooding in county soil surveys; 6. Lands with slopes greater than 15%. Fields containing environmentally sensitive sites may be subdivided into separate fields, if the areas can be managed individually and the operator agrees to manage each area as written in the plan. ♦ The results of soil testing labs approved by the Department must be correlated to Virginia Tech Mehlich I using Table 2-1, and the conversion procedures in Section II. Only the Virginia Tech soil test scale and the conversion of other approved labs to the Virginia Tech soil test scale can be used to develop phosphorus and potassium recommendations when developing Virginia nutrient management plans. ♦ Nitrogen fertilizer recommendations are developed by identifying the soil productivity group for the crop to be grown in Table 1-1, and selecting a recommended application rate from the various crops listed in Section V. Phosphorus and potassium recommendations are determined based on the soil test results for the field by the accompanying table listed with each crop in Section V. ♦ Use the Virginia Tech soil test rating (such as M+) to determine Phosphorus and Potassium recommendations from Section V. If the soil test level is L, M, or H use the midpoint of the recommended nutrient application range. If the soil test level is L-, M-, or H- use the highest value of the recommended nutrient application range. If the soil test level is L+, M+, or H+ use the lowest value of the recommended nutrient application range. Where there is only a s ingle recommendation listed for any soil test rating use the same recommendation for any of the three soil test ratings. ♦ When using soil productivity groupings to determine expected yields, if a soil is listed in Table 1-1 as not suited (NS) for a particular crop, the farmer should be advised that the particular crop is not recommended to be grown on the soil. If the crop will still be grown in that soil type, use the lowest productivity group rating for that crop to determine the expected yield (i.e, if alfalfa will be grown on a soil listed as NS, then the planner would use productivity group III to determine nutrient application rates).

3
Section I. Agronomic and Environmental Management of Soils and Other Site Features
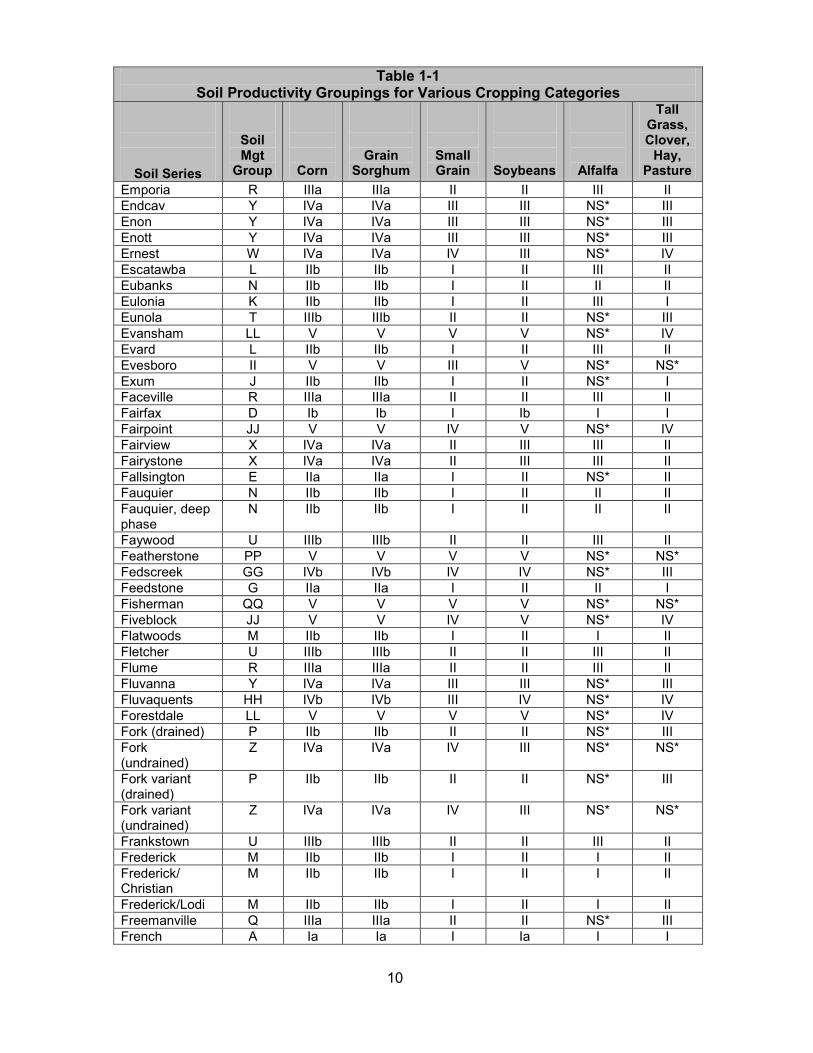
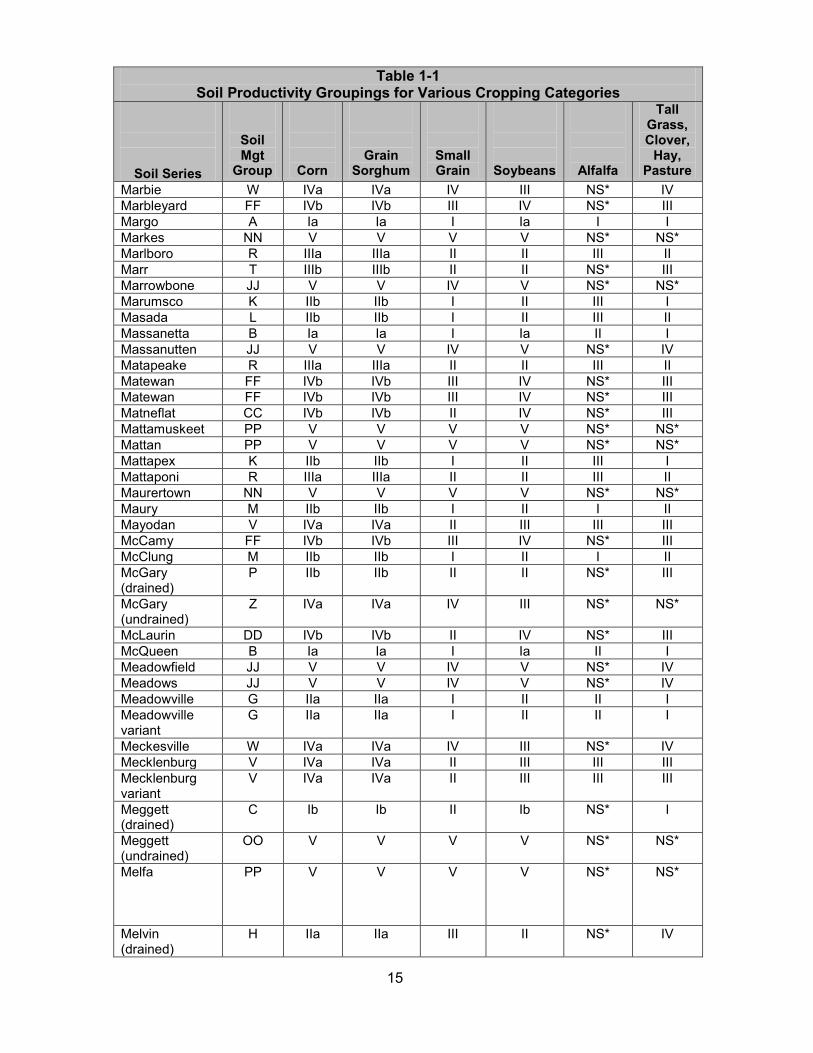
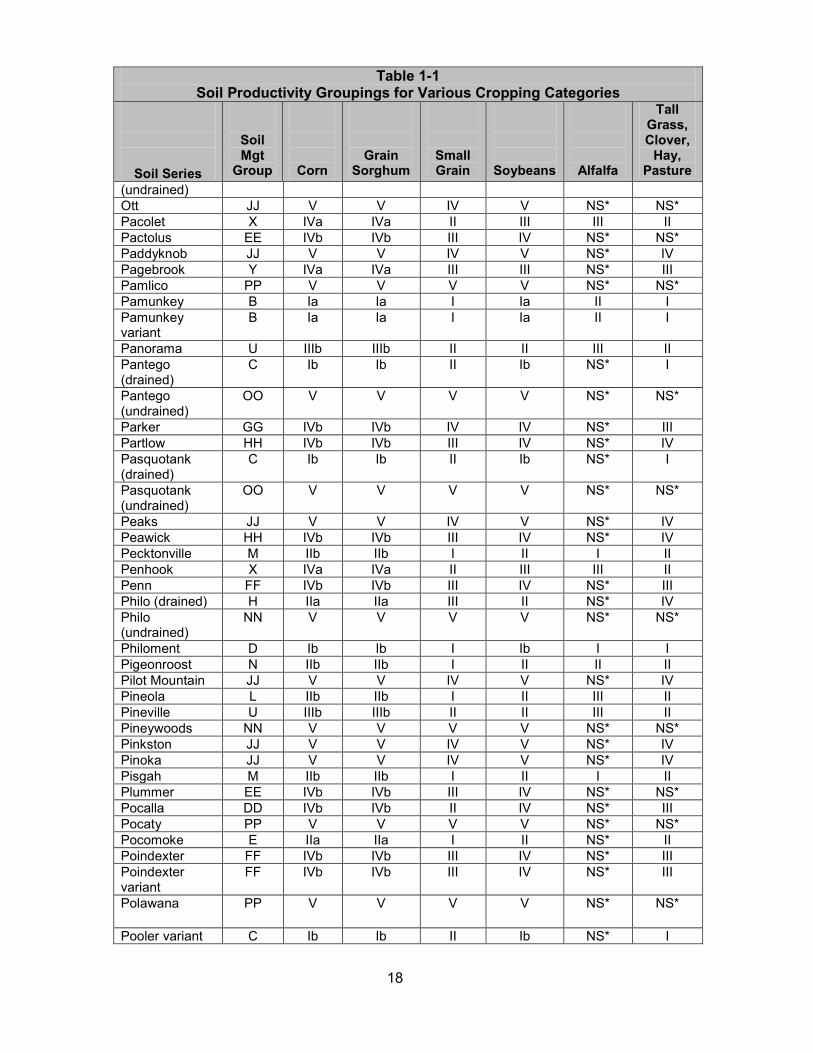
Table 1-1 Soil Productivity Groupings for Various Cropping Categories
Soil Series
Soil Mgt
Group
Corn
Grain Sorghum
Small Grain
Soybeans
Alfalfa
Tall Grass, Clover,
Hay, Pasture
Abell G IIa IIa I II II I Abell variant G IIa IIa I II II I Ackwater K IIb IIb I II III I Acredale (drained)
C Ib Ib II Ib NS* I
Acredale (undrained)
OO V V V V NS* NS*
Aden (drained) C Ib Ib II Ib NS* I Aden (undrained)
OO V V V V NS* NS*
Airmont BB IVb IVb III IV NS* III Alaga II V V III V NS* NS* Alamance FF IVb IVb III IV NS* III Alanthus D Ib Ib I Ib I I Albano KK V V V V NS* IV Albemarle JJ V V IV V NS* IV Alderflats NN V V V V NS* NS* Aldino W IVa IVa IV III NS* IV Aldio Y IVa IVa III III NS* III Allegheny L IIb IIb I II III II Alluvial Land, wet
MM V V V V NS* IV
Alonemill A Ia Ia I Ia I I Alonemill, Fluvaquentic
I IIa IIa I II NS* I
Alonzville L IIb IIb I II III II Altavista B Ia Ia I Ia II I Altavista, variant
B Ia Ia I Ia II I
Alticrest E IIa IIa I II NS* II Angie AA IVa IVa II III NS* IV Angie variant AA IVa IVa II III NS* IV Appling V IVa IVa II III III III Appling gritty V IVa IVa II III III III Appomattox O IIb IIb I II II II Arapahoe EE IVb IVb III IV NS* NS* Arcola U IIIb IIIb II II III II Ardilla W IVa IVa IV III NS* IV Argent PP V V V V NS* NS* Arkaqua I IIa IIa I II NS* I Ashburn BB IVb IVb III IV NS* III Ashe JJ V V IV V NS* IV Ashlar FF IVb IVb III IV NS* III Assateague QQ V V V V NS* NS*

4
Table 1-1 Soil Productivity Groupings for Various Cropping Categories
Soil Series
Soil Mgt
Group
Corn
Grain Sorghum
Small Grain
Soybeans
Alfalfa
Tall Grass, Clover,
Hay, Pasture
Athol M IIb IIb I II I II Atkins NN V V V V NS* NS* Atlee Q IIIa IIIa II II NS* III Augusta (drained)
P IIb IIb II II NS* III
Augusta (undrained)
Z IVa IVa IV III NS* NS*
Augusta variant(drained)
P IIb IIb II II NS* III
Augusta variant(undrained)
Z IVa IVa IV III NS* NS*
Aura T IIIb IIIb II II NS* III Austinville O IIb IIb I II II II Axis PP V V V V NS* NS* Aycock R IIIa IIIa II II III II Ayersville FF IVb IVb III IV NS* III Backbay PP V V V V NS* NS* Badin X IVa IVa II III III II Baile HH IVb IVb III IV NS* IV Bailegap GG IVb IVb IV IV NS* III Balsam GG IVb IVb IV IV NS* III Bama R IIIa IIIa II II III II Banister K IIb IIb I II III I Barclay E IIa IIa I II NS* II Bateau I IIa IIa I II NS* I Bayboro (drained)
C Ib Ib II Ib NS* I
Bayboro (undrained)
OO V V V V NS* NS*
Beckham O IIb IIb I II II II Bedington FF IVb IVb III IV NS* III Beech L IIb IIb I II III II Beech Grove JJ V V IV V NS* IV Belhaven PP V V V V NS* NS* Belspur H IIa IIa III II NS* IV Beltsville BB IVb IVb III IV NS* III Belvoir BB IVb IVb III IV NS* III Benthole CC IVb IVb II IV NS* III Bentley R IIIa IIIa II II III II Berks JJ V V IV V NS* IV Berks variant JJ V V IV V NS* IV Bermudian A Ia Ia I Ia I I Bertie J IIb IIb I II NS* I Bertie, variant J IIb IIb I II NS* I Bethera (drained)
C Ib Ib II Ib NS* I

5
Table 1-1 Soil Productivity Groupings for Various Cropping Categories
Soil Series
Soil Mgt
Group
Corn
Grain Sorghum
Small Grain
Soybeans
Alfalfa
Tall Grass, Clover,
Hay, Pasture
Bethera (undrained)
OO V V V V NS* NS*
Bethesda JJ V V IV V NS* IV Bethlehem V IVa IVa II III III III Bibb EE IVb IVb III IV NS* NS* Biltmore II V V III V NS* NS* Birdsboro L IIb IIb I II III II Blackthorn GG IVb IVb IV IV NS* III Bladen (drained)
C Ib Ib II Ib NS* I
Bladen (undrained)
OO V V V V NS* NS
Blago HH IVb IVb III IV NS* IV Blairton FF IVb IVb III IV NS* III Bland Y IVa IVa III III NS* III Bleakhill J IIb IIb I II NS* I Blocktown JJ V V IV V NS* IV Bloodyhorse JJ V V IV V NS* IV Bluemont JJ V V IV V NS* IV Bohicket PP V V V V NS* NS* Bojac (ES, VA Beach, Ches.)
T IIIb IIIb II II NS* III
Bojac (Mainland, excluding VA Beach & Ches.)
DD IVb IVb II IV NS* III
Bolling J IIb IIb I II NS* I Bolling variant J IIb IIb I II NS* I Bolton M IIb IIb I II I II Bonneau DD IVb IVb II IV NS* III Bookwood U IIIb IIIb II II III II Botetourt G IIa IIa I II II I Bourne BB IVb IVb III IV NS* III Bourne variant BB IVb IVb III IV NS* III Bowmansville I IIa IIa I II NS* I Braddock O IIb IIb I II II II Brandywine FF IVb IVb III IV NS* III Brecknock U IIIb IIIb II II III II Bremo JJ V V IV V NS* IV Brentsville FF IVb IVb III IV NS* III Brevard B Ia Ia I Ia II I Brickhaven Y IVa IVa III III NS* III Brinkerton LL V V V V NS* IV Brinklow FF IVb IVb III IV NS* III Broadway A Ia Ia I Ia I I Brockroad V IVa IVa II III III III Brownsville JJ V V IV V NS* IV Brownwood JJ V V IV V NS* IV

6
Table 1-1 Soil Productivity Groupings for Various Cropping Categories
Soil Series
Soil Mgt
Group
Corn
Grain Sorghum
Small Grain
Soybeans
Alfalfa
Tall Grass, Clover,
Hay, Pasture
Brumbaugh L IIb IIb I II III II Brushy JJ V V IV V NS* IV Buchanan BB IVb IVb III IV NS* III Buchanan cobbly
JJ V V IV V NS* IV
Buckhall V IVa IVa II III III III Buckingham JJ V V IV V NS* IV Bucks U IIIb IIIb II II III II Buckton A Ia Ia I Ia I I Buffstat V IVa IVa II III III III Bugley JJ V V IV V NS* IV Buncombe II V V III V NS* NS* Burketown BB IVb IVb III IV NS* III Burrowsville BB IVb IVb III IV NS* III Burton FF IVb IVb III IV NS* III Buzzrock JJ V V IV V NS* IV Cahaba R IIIa IIIa II II III II Calverton BB IVb IVb III IV NS* III Calvin JJ V V IV V NS* IV Calvin cobbly JJ V V IV V NS* IV Camocca PP V V V V NS* NS* Caneyville Y IVa IVa III III NS* III Cape Fear (drained)
C Ib Ib II Ib NS* I
Cape Fear (undrained)
OO V V V V NS* NS*
Captina BB IVb IVb III IV NS* III Carbo Y IVa IVa III III NS* III Carbonton Y IVa IVa III III NS* III Cardiff FF IVb IVb III IV NS* III Cardova JJ V V IV V NS* IV Caroline AA IVa IVa II III NS* IV Cartecay I IIa IIa I II NS* I Carteret PP V V V V NS* NS* Cataska JJ V V IV V NS* IV Catharpin X IVa IVa II III III II Catlett JJ V V IV V NS* IV Catlett variant JJ V V IV V NS* IV Catoctin JJ V V IV V NS* IV Catoctin variant JJ V V IV V NS* IV Catpoint II V V III V NS* NS* Caverns I IIa IIa I II NS* I Cecil X IVa IVa II III III II Cedarcreek GG IVb IVb IV IV NS* III Chagrin A Ia Ia I Ia I I Chagrin variant A Ia Ia I Ia I I Chandler
FF IVb IVb III IV NS* III

7
Table 1-1 Soil Productivity Groupings for Various Cropping Categories
Soil Series
Soil Mgt
Group
Corn
Grain Sorghum
Small Grain
Soybeans
Alfalfa
Tall Grass, Clover,
Hay, Pasture
Chapanoke (drained)
C Ib Ib II Ib NS* I
Chapanoke (undrained)
OO V V V V NS* NS*
Charity N IIb IIb I II II II Chastain LL V V V V NS* IV Chatuge (drained)
C Ib Ib II Ib NS* I
Chatuge (undrained)
OO V V V V NS* NS*
Chavies U IIIb IIIb II II III II Chavies variant U IIIb IIIb II II III II Chenneby I IIa IIa I II NS* I Chesapeake B Ia Ia I Ia II I Chester D Ib Ib I Ib I I Chester Loam D Ib Ib I Ib I I Chesterfield V IVa IVa II III III III Chestnut GG IVb IVb IV IV NS* III Chewacla I IIa IIa I II NS* I Chickahominy LL V V V V NS* IV Chilhowie JJ V V IV V NS* IV Chincoteague PP V V V V NS* NS* Chipley EE IVb IVb III IV NS* NS* Chiswell JJ V V IV V NS* IV Christian AA IVa IVa II III NS* IV Christiana AA IVa IVa II III NS* IV Cid KK V V V V NS* IV Claiborne U IIIb IIIb II II III II Clapham BB IVb IVb III IV NS* III Clarksburg W IVa IVa IV III NS* IV Clarksville GG IVb IVb IV IV NS* III Clearbrook JJ V V IV V NS* IV Cliffield JJ V V IV V NS* IV Clifford X IVa IVa II III III II Clifton L IIb IIb I II III II Clover V IVa IVa II III III III Cloverlick JJ V V IV V NS* IV Clubcaf LL V V V V NS* IV Clymer U IIIb IIIb II II III II Codorus A Ia Ia I Ia I I Codorus variant A Ia Ia I Ia I I Codorus stony A Ia Ia I Ia I I Codorus variant A Ia Ia I Ia I I Colescreek L IIb IIb I II III II Colfax BB IVb IVb III IV NS* III Colfax variant BB IVb IVb III IV NS* III Colleen KK V V V V NS* IV Colvard II V V III V NS* NS*

8
Table 1-1 Soil Productivity Groupings for Various Cropping Categories
Soil Series
Soil Mgt
Group
Corn
Grain Sorghum
Small Grain
Soybeans
Alfalfa
Tall Grass, Clover,
Hay, Pasture
Colvard fine II V V III V NS* NS* Colvard stony II V V III V NS* NS* Combs A Ia Ia I Ia I I Comus A Ia Ia I Ia I I Conetoe DD IVb IVb II IV NS* III Congaree A Ia Ia I Ia I I Coosaw DD IVb IVb II IV NS* III Corolla EE IVb IVb III IV NS* NS* Corydon JJ V V IV V NS* IV Cotaco G IIa IIa I II II I Cotaco cobbly G IIa IIa I II II I Cotaco variant G IIa IIa I II II I Cottonbend L IIb IIb I II III II Coursey G IIa IIa I II II I Cowee N IIb IIb I II II II Coxville LL V V V V NS* IV Craggey JJ V V IV V NS* IV Craigsville CC IVb IVb II IV NS* III Craven HH IVb IVb III IV NS* IV Creedmoor KK V V V V NS* IV Creedmoor variant
KK V V V V NS* IV
Croton LL V V V V NS* IV Cullasaja FF IVb IVb III IV NS* III Cullen N IIb IIb I II II II Culleoka U IIIb IIIb II II III II Culpeper X IVa IVa II III III II Culpeper variant
X IVa IVa II III III II
Daleville (drained)
C Ib Ib II Ib NS* I
Daleville (undrained)
OO V V V V NS* NS*
Dan River G IIa IIa I II II I Dandridge JJ V V IV V NS* IV Danripple L IIb IIb I II III II Davidson N IIb IIb I II II II Dawhoo PP V V V V NS* NS* Dawhoo variant PP V V V V NS* NS* Decatur M IIb IIb I II I II Dekalb FF IVb IVb III IV NS* III Dekalb variant FF IVb IVb III IV NS* III Delanco B Ia Ia I Ia II I Delila HH IVb IVb III IV NS* IV Dellwood CC IVb IVb II IV NS* III Deloss (drained)
C Ib Ib II Ib NS* I

9
Table 1-1 Soil Productivity Groupings for Various Cropping Categories
Soil Series
Soil Mgt
Group
Corn
Grain Sorghum
Small Grain
Soybeans
Alfalfa
Tall Grass, Clover,
Hay, Pasture
Deloss (undrained)
OO V V V V NS* NS*
Derroc CC IVb IVb II IV NS* III Devotion FF IVb IVb III IV NS* III Diana Mills V IVa IVa II III III III Dillard G IIa IIa I II II I Dogue K IIb IIb I II III I Dogue variant K IIb IIb I II III I Dorovan PP V V V V NS* NS* Dothan Q IIIa IIIa II II NS* III Downer DD IIb IIb II IV NS* III Dragston E IIa IIa I II NS* II Drall FF IVb IVb III IV NS* III Drapermill U IIIb IIIb II II III II Drypond JJ V V IV V NS* IV Duckston QQ V V V V NS* NS* Duffield G IIa IIa I II II I Dulles Y IVa IVa III III NS* III Dumfries T IIIb IIIb II II NS* III Dunbar (drained)
P IIb IIb II II NS* III
Dunbar (undrained)
Z IVa IVa IV III NS* NS*
Dunning (drained)
H IIa IIa III II NS* IV
Dunning (undrained)
NN V V V V NS* NS*
Duplin K IIb IIb I II III I Durham CC IVb IVb II IV NS* III Dyke O IIb IIb I II II II Easthamlet KK V V V V NS* IV Ebbing G IIa IIa I II II I Edgehill CC IVb IVb II IV NS* III Edgehill variant CC IVb IVb II IV NS* III Edgemont U IIIb IIIb II II III II Edneytown L IIb IIb I II III II Edneyville T IIIb IIIb II II NS* III Edom M IIb IIb I II I II Elbert LL V V V V NS* IV Elbert variant LL V V V V NS* IV Elioak X IVa IVa II III III II Elk A Ia Ia I Ia I I Elkton (drained) C Ib Ib II Ib NS* I Elkton (undrained)
OO V V V V NS* NS*
Elliber M IIb IIb I II I II Elsinboro L IIb IIb I II III II Emory G IIa IIa I II II I
10
Table 1-1 Soil Productivity Groupings for Various Cropping Categories
Soil Series
Soil Mgt
Group
Corn
Grain Sorghum
Small Grain
Soybeans
Alfalfa
Tall Grass, Clover,
Hay, Pasture
Emporia R IIIa IIIa II II III II Endcav Y IVa IVa III III NS* III Enon Y IVa IVa III III NS* III Enott Y IVa IVa III III NS* III Ernest W IVa IVa IV III NS* IV Escatawba L IIb IIb I II III II Eubanks N IIb IIb I II II II Eulonia K IIb IIb I II III I Eunola T IIIb IIIb II II NS* III Evansham LL V V V V NS* IV Evard L IIb IIb I II III II Evesboro II V V III V NS* NS* Exum J IIb IIb I II NS* I Faceville R IIIa IIIa II II III II Fairfax D Ib Ib I Ib I I Fairpoint JJ V V IV V NS* IV Fairview X IVa IVa II III III II Fairystone X IVa IVa II III III II Fallsington E IIa IIa I II NS* II Fauquier N IIb IIb I II II II Fauquier, deep phase
N IIb IIb I II II II
Faywood U IIIb IIIb II II III II Featherstone PP V V V V NS* NS* Fedscreek GG IVb IVb IV IV NS* III Feedstone G IIa IIa I II II I Fisherman QQ V V V V NS* NS* Fiveblock JJ V V IV V NS* IV Flatwoods M IIb IIb I II I II Fletcher U IIIb IIIb II II III II Flume R IIIa IIIa II II III II Fluvanna Y IVa IVa III III NS* III Fluvaquents HH IVb IVb III IV NS* IV Forestdale LL V V V V NS* IV Fork (drained) P IIb IIb II II NS* III Fork (undrained)
Z IVa IVa IV III NS* NS*
Fork variant (drained)
P IIb IIb II II NS* III
Fork variant (undrained)
Z IVa IVa IV III NS* NS*
Frankstown U IIIb IIIb II II III II Frederick M IIb IIb I II I II Frederick/ Christian
M IIb IIb I II I II
Frederick/Lodi M IIb IIb I II I II Freemanville Q IIIa IIIa II II NS* III French A Ia Ia I Ia I I

11
Table 1-1 Soil Productivity Groupings for Various Cropping Categories
Soil Series
Soil Mgt
Group
Corn
Grain Sorghum
Small Grain
Soybeans
Alfalfa
Tall Grass, Clover,
Hay, Pasture
Fripp QQ V V V V NS* NS* Funkstown A Ia Ia I Ia I I Gaila FF IVb IVb III IV NS* III Gainesboro FF IVb IVb III IV NS* III Galestown II V V III V NS* NS* Galtsmill II V V III V NS* NS* Georgeville X IVa IVa II III III II Germanna L IIb IIb I II III II Gertie OO V V V V NS* NS* Gilpin U IIIb IIIb II II III II Gilpin variant U IIIb IIIb II II III II Gladehill A Ia Ia I Ia I I Glenelg(BRH) N IIb IIb I II II II Glenelg(NV) U IIIb IIIb II II III II Glenville W IVa IVa IV III NS* IV Glynwood GG IVb IVb IV IV NS* III Glynwood variant
GG IVb IVb IV IV NS* III
Goblintown V IVa IVa II III III III Goldsboro J IIb IIb I II NS* I Goldston JJ V V IV V NS* IV Goldvein BB IVb IVb III IV NS* III Goldvein gritty BB IVb IVb III IV NS* III Goresville N IIb IIb I II II II Granville R IIIa IIIa II II III II Grassland L IIb IIb I II III II Greendale A Ia Ia I Ia I I Greenlee CC IVb IVb II IV NS* III Grigsby A Ia Ia I Ia I I Grimsley GG IVb IVb IV IV NS* III Gritney T IIIb IIIb II II NS* III Groseclose M IIb IIb I II I II Grover X IVa IVa II III III II Guernsey M IIb IIb I II I II Gullion B Ia Ia I Ia II I Gundy V IVa IVa II III III III Gunstock V IVa IVa II III III III Guyen Z IVa IVa IV III NS* NS* Gwinnett variant
X IVa IVa II III III II
Hagerstown M IIb IIb I II I II Halewood U IIIb IIIb II II III II Halifax KK V V V V NS* IV Hanceville V IVa IVa II III III III Happyland U IIIb IIIb II II III II Hartleton FF IVb IVb III IV NS* III Hartsells CC IVb IVb II IV NS* III Hatboro HH IVb IVb III IV NS* IV

12
Table 1-1 Soil Productivity Groupings for Various Cropping Categories
Soil Series
Soil Mgt
Group
Corn
Grain Sorghum
Small Grain
Soybeans
Alfalfa
Tall Grass, Clover,
Hay, Pasture
Hawksbill CC IVb IVb II IV NS* III Hawksbill cobbly
CC IVb IVb II IV NS* III
Hayesville X IVa IVa II III III II Haymarket KK V V V V NS* IV Hayter L IIb IIb I II III II Haywood JJ V V IV V NS* IV Hazel JJ V V IV V NS* IV Hazel channery JJ V V IV V NS* IV Hazel Run U IIIb IIIb II II III II Hazleton JJ V V IV V NS* IV Helena KK V V V V NS* IV Helena taxadjunct
KK V V V V NS* IV
Herndon V IVa IVa II III III III Hibler L IIb IIb I II III II Hickoryknob N IIb IIb I II II II Highsplint CC IVb IVb II IV NS* III Hiwassee O IIb IIb I II II II Hiwassee variant
O IIb IIb I II II II
Hoadley BB IVb IVb III IV NS* III Hobucken PP V V V V NS* NS* Holly NN V V V V NS* NS* Hollywood LL V V V V NS* IV Hublersburg M IIb IIb I II I II Huntington A Ia Ia I Ia I I Hyde (drained) C Ib Ib II Ib NS* I Hyde (undrained)
OO V V V V NS* NS*
Ingledove A Ia Ia I Ia I I Iotla A Ia Ia I Ia I I Iredell KK V V V V NS* IV Iredell variant KK V V V V NS* IV Irongate DD IVb IVb II IV NS* III Itman JJ V V IV V NS* IV Iuka F IIa IIa I II III II Izagora J IIb IIb I II NS* I Jackland KK V V V V NS* IV Jedburg Z IVa IVa IV III NS* NS* Jefferson U IIIb IIIb II II III II Jefferson variant
U IIIb IIIb II II III II
Johns (drained) C Ib Ib II Ib NS* I Johns (undrained)
OO V V V V NS* NS*
Johns variant C Ib Ib II Ib NS* I

13
Table 1-1 Soil Productivity Groupings for Various Cropping Categories
Soil Series
Soil Mgt
Group
Corn
Grain Sorghum
Small Grain
Soybeans
Alfalfa
Tall Grass, Clover,
Hay, Pasture
(drained) Johns variant (undrained)
OO V V V V NS* NS*
Johnston PP V V V V NS* NS* Junaluska U IIIb IIIb II II III II Kalmia S IIIa IIIa II II NS* III Kaymine JJ V V IV V NS* IV Keener O IIb IIb I II II II Kelly KK V V V V NS* IV Kempsville S IIIa IIIa II II NS* III Kenansville DD IVb IVb II IV NS* III Kenansville variant
DD IVb IVb II IV NS* III
Keyport K IIb IIb I II III I Kinkora (drained)
C Ib Ib II Ib NS* I
Kinkora (undrained)
OO V V V V NS* NS*
Kinston (drained)
C Ib Ib II Ib NS* I
Kinston (undrained)
OO V V V V NS* NS*
Klej EE IVb IVb III IV NS* NS* Klinesville JJ V V IV V NS* IV Konnarock JJ V V IV V NS* IV Lackstown K IIb IIb I II III I Laidig W IVa IVa IV III NS* IV Laidig cobbly W IVa IVa IV III NS* IV Lakehurst EE IVb IVb III IV NS* NS* Lakeland II V V III V NS* NS Lakin II V V III V NS* NS Landisburg W IVa IVa IV III NS* IV Lanexa PP V V V V NS* NS* Lansdale FF IVb IVb III IV NS* III Laroque FF IVb IVb III IV NS* III Lawnes PP V V V V NS* NS* Leadvale BB IVb IVb III IV NS* III Leaf (drained) C Ib Ib II Ib NS* I Leaf (undrained)
OO V V V V NS* NS*
Leaksville KK V V V V NS* IV Leatherwood OO V V V V NS* NS* Leck Kill U IIIb IIIb II II III II Leedsville L IIb IIb I II III II Leetonia II V V III V NS* NS* Legore V IVa IVa II III III III Lehew JJ V V IV V NS* IV Lenoir LL V V V V NS* IV

14
Table 1-1 Soil Productivity Groupings for Various Cropping Categories
Soil Series
Soil Mgt
Group
Corn
Grain Sorghum
Small Grain
Soybeans
Alfalfa
Tall Grass, Clover,
Hay, Pasture
Leon II V V III V NS* NS* Levy PP V V V V NS* NS* Lew FF IVb IVb III IV NS* III Lewisberry II V V III V NS* NS* Lewisburg CC IVb IVb II IV NS* III Library KK V V V V NS* IV Lickdale (drained)
H IIa IIa III II NS* IV
Lickdale (undrained)
NN V V V V NS* NS*
Lignum LL V V V V NS* IV Lily FF IVb IVb III IV NS* III Linden F IIa IIa I II III II Lindside A Ia Ia I Ia I I Littlejoe V IVa IVa II III III III Litz JJ V V IV V NS* IV Lloyd N IIb IIb I II II II Lloyd variant N IIb IIb I II II II Lobdell A Ia Ia I Ia I I Lodi M IIb IIb I II I II Lostcove FF IVb IVb III IV NS* III Louisa JJ V V IV V NS* IV Louisa variant JJ V V IV V NS* IV Louisburg FF IVb IVb III IV NS* III Lowell M IIb IIb I II I II Lucketts Y IVa IVa III III NS* III Lucy DD IVb IVb II IV NS* III Lumbee (drained)
C Ib Ib II Ib NS* I
Lumbee (undrained)
OO V V V V NS* NS*
Lumbee variant (drained)
C Ib Ib II Ib NS* I
Lumbee variant (undrained)
OO V V V V NS* NS*
Lunt AA IVa IVa II III NS* IV Lynchburg E IIa IIa I II NS* II Macove CC IVb IVb II IV NS* III Madison X IVa IVa II III III II Madsheep JJ V V IV V NS* IV Maggodee A Ia Ia I Ia I I Magotha PP V V V V NS* NS* Malbis W IVa IVa IV III NS* IV Manassas D Ib Ib I Ib I I Mandy JJ V V IV V NS* IV Manor FF IVb IVb III IV NS* III Mantachie I IIa IIa I II NS* I Manteo JJ V V IV V NS* IV
15
Table 1-1 Soil Productivity Groupings for Various Cropping Categories
Soil Series
Soil Mgt
Group
Corn
Grain Sorghum
Small Grain
Soybeans
Alfalfa
Tall Grass, Clover,
Hay, Pasture
Marbie W IVa IVa IV III NS* IV Marbleyard FF IVb IVb III IV NS* III Margo A Ia Ia I Ia I I Markes NN V V V V NS* NS* Marlboro R IIIa IIIa II II III II Marr T IIIb IIIb II II NS* III Marrowbone JJ V V IV V NS* NS* Marumsco K IIb IIb I II III I Masada L IIb IIb I II III II Massanetta B Ia Ia I Ia II I Massanutten JJ V V IV V NS* IV Matapeake R IIIa IIIa II II III II Matewan FF IVb IVb III IV NS* III Matewan FF IVb IVb III IV NS* III Matneflat CC IVb IVb II IV NS* III Mattamuskeet PP V V V V NS* NS* Mattan PP V V V V NS* NS* Mattapex K IIb IIb I II III I Mattaponi R IIIa IIIa II II III II Maurertown NN V V V V NS* NS* Maury M IIb IIb I II I II Mayodan V IVa IVa II III III III McCamy FF IVb IVb III IV NS* III McClung M IIb IIb I II I II McGary (drained)
P IIb IIb II II NS* III
McGary (undrained)
Z IVa IVa IV III NS* NS*
McLaurin DD IVb IVb II IV NS* III McQueen B Ia Ia I Ia II I Meadowfield JJ V V IV V NS* IV Meadows JJ V V IV V NS* IV Meadowville G IIa IIa I II II I Meadowville variant
G IIa IIa I II II I
Meckesville W IVa IVa IV III NS* IV Mecklenburg V IVa IVa II III III III Mecklenburg variant
V IVa IVa II III III III
Meggett (drained)
C Ib Ib II Ib NS* I
Meggett (undrained)
OO V V V V NS* NS*
Melfa
PP V V V V NS* NS*
Melvin (drained)
H IIa IIa III II NS* IV

16
Table 1-1 Soil Productivity Groupings for Various Cropping Categories
Soil Series
Soil Mgt
Group
Corn
Grain Sorghum
Small Grain
Soybeans
Alfalfa
Tall Grass, Clover,
Hay, Pasture
Melvin (undrained)
NN V V V V NS* NS*
Middleburg G IIa IIa I II II I Millrock II V V III V NS* NS* Mine Run II V V III V NS* NS* Minnieville N IIb IIb I II II II Mirerock KK V V V V NS* IV Misenheimer JJ V V IV V NS* IV Molena II V V III V NS* NS* Monacan I IIa IIa I II NS* I Mongle H IIa IIa III II NS* IV Monongahela W IVa IVa IV III NS* IV Montalto N IIb IIb I II II II Montonia X IVa IVa II III III II Montresso D Ib Ib I Ib I I Montross Q IIIa IIIa II II NS* III Moomaw W IVa IVa IV III NS* IV Morasonville D Ib Ib I Ib I I Morven G IIa IIa I II II I Mount Lucas J IIb IIb I II NS* I Mt. Rogers GG IVb IVb IV IV NS* III Muckalee MM V V V V NS* IV Munden F IIa IIa I II III II Murrill L IIb IIb I II III II Muskingum JJ V V IV V NS* IV Myatt (drained) C Ib Ib II Ib NS* I Myatt (undrained)
OO V V V V NS* NS*
Myatt variant (drained)
C Ib Ib II Ib NS* I
Myatt variant (undrained)
OO V V V V NS* NS*
Myersville D Ib Ib I Ib I I Nahunta E IIa IIa I II NS* II Nanford V IVa IVa II III III III Nansemond F IIa IIa I II III II Nason V IVa IVa II III III III Nawney PP V V V V NS* NS* Neabsco BB IVb IVb III IV NS* III Needmore FF IVb IVb III IV NS* III Nestoria JJ V V IV V NS* IV Nevarc HH IVb IVb III IV NS* IV Newark (drained)
H IIa IIa III II NS* IV
Newark (undrained)
NN V V V V NS* NS*
Newark variant (drained)
H IIa IIa III II NS* IV

17
Table 1-1 Soil Productivity Groupings for Various Cropping Categories
Soil Series
Soil Mgt
Group
Corn
Grain Sorghum
Small Grain
Soybeans
Alfalfa
Tall Grass, Clover,
Hay, Pasture
Newark variant (undrained)
NN V V V V NS* NS*
Newbern JJ V V IV V NS* IV Newflat LL V V V V NS* IV Newhan QQ V V V V NS* NS* Newmarc B Ia Ia I Ia II I Nicelytown A Ia Ia I Ia I I Nicholson BB IVb IVb III IV NS* III Nickwasi JJ V V IV V NS* NS* Nimmo E IIa IIa I II NS* II Nixa BB IVb IVb III IV NS* III Nolichucky O IIb IIb I II II II Nolin A Ia Ia I Ia I I Nollville G IIa IIa I II II I Nomberville A Ia Ia I Ia I I Norfolk R IIIa IIIa II II III II Oak Level V IVa IVa II III III III Oakhill FF IVb IVb III IV NS* III Oaklet Y IVa IVa III III NS* III Oatlands FF IVb IVb III IV NS* III Occoquan DD IVb IVb II IV NS* III Ochlockonee II V V III V NS* NS* Ochlockonee variant
II V V III V NS* NS*
Ocilla F IIa IIa I II III II Ogles CC IVb IVb II IV NS* III Okeetee LL V V V V NS* IV Opequon JJ V V IV V NS* IV Orange KK V V V V NS* IV Orange variant KK V V V V NS* IV Orangeburg R IIIa IIIa II II III II Orenda KK V V V V NS* IV Oriskany CC IVb IVb II IV NS* III Orrville (drained)
C Ib Ib II Ib NS* I
Orrville (undrained)
OO V V V V NS* NS*
Orrville variant (drained)
C Ib Ib II Ib NS* I
Orrville variant (undrained)
OO V V V V NS* NS*
Orthents JJ V V IV V NS IV Osier E IIa IIa I II NS* II Ostin II V V III V NS* NS* Othello (drained)
C Ib Ib II Ib NS* I
Othello OO V V V V NS* NS*
18
Table 1-1 Soil Productivity Groupings for Various Cropping Categories
Soil Series
Soil Mgt
Group
Corn
Grain Sorghum
Small Grain
Soybeans
Alfalfa
Tall Grass, Clover,
Hay, Pasture
(undrained) Ott JJ V V IV V NS* NS* Pacolet X IVa IVa II III III II Pactolus EE IVb IVb III IV NS* NS* Paddyknob JJ V V IV V NS* IV Pagebrook Y IVa IVa III III NS* III Pamlico PP V V V V NS* NS* Pamunkey B Ia Ia I Ia II I Pamunkey variant
B Ia Ia I Ia II I
Panorama U IIIb IIIb II II III II Pantego (drained)
C Ib Ib II Ib NS* I
Pantego (undrained)
OO V V V V NS* NS*
Parker GG IVb IVb IV IV NS* III Partlow HH IVb IVb III IV NS* IV Pasquotank (drained)
C Ib Ib II Ib NS* I
Pasquotank (undrained)
OO V V V V NS* NS*
Peaks JJ V V IV V NS* IV Peawick HH IVb IVb III IV NS* IV Pecktonville M IIb IIb I II I II Penhook X IVa IVa II III III II Penn FF IVb IVb III IV NS* III Philo (drained) H IIa IIa III II NS* IV Philo (undrained)
NN V V V V NS* NS*
Philoment D Ib Ib I Ib I I Pigeonroost N IIb IIb I II II II Pilot Mountain JJ V V IV V NS* IV Pineola L IIb IIb I II III II Pineville U IIIb IIIb II II III II Pineywoods NN V V V V NS* NS* Pinkston JJ V V IV V NS* IV Pinoka JJ V V IV V NS* IV Pisgah M IIb IIb I II I II Plummer EE IVb IVb III IV NS* NS* Pocalla DD IVb IVb II IV NS* III Pocaty PP V V V V NS* NS* Pocomoke E IIa IIa I II NS* II Poindexter FF IVb IVb III IV NS* III Poindexter variant
FF IVb IVb III IV NS* III
Polawana PP V V V V NS* NS*
Pooler variant C Ib Ib II Ib NS* I

19
Table 1-1 Soil Productivity Groupings for Various Cropping Categories
Soil Series
Soil Mgt
Group
Corn
Grain Sorghum
Small Grain
Soybeans
Alfalfa
Tall Grass, Clover,
Hay, Pasture
(drained) Pooler variant (undrained)
OO V V V V NS* NS*
Pope A Ia Ia I Ia I I Poplimento M IIb IIb I II I II Porters FF IVb IVb III IV NS* III Portsmouth (drained)
C Ib Ib II Ib NS* I
Portsmouth (undrained)
OO V V V V NS* NS*
Post V IVa IVa II III III III Pouncey LL V V V V NS* IV Poynor GG IVb IVb IV IV NS* III Psamments II V V III V NS* NS* Pungo PP V V V V NS* NS* Purcellville D Ib Ib I Ib I I Purdy (drained) H IIa IIa III II NS* IV Purdy (undrained)
NN V V V V NS* NS*
Quantico R IIIa IIIa II II III II Rabun N IIb IIb I II II II Rains (drained) C Ib Ib II Ib NS* I Rains (undrained)
OO V V V V NS* NS*
Ramsey JJ V V IV V NS* IV Rapidan N IIb IIb I II II II Rappahanock PP V V V V NS* NS* Raritan W IVa IVa IV III NS* IV Rasalo Y IVa IVa III III NS* III Rayne U IIIb IIIb II II III II Readington W IVa IVa IV III NS* IV Reaville JJ V V IV V NS* IV Redbrush Y IVa IVa III III NS* III Remlik DD IVb IVb II IV NS* III Rhodhiss X IVa IVa II III III II Rigley CC IVb IVb II IV NS* III Rion X IVa IVa II III III II Riverview G IIa IIa I II II I Rixeyville JJ V V IV V NS* NS* Roanoke (drained)
H IIa IIa III II NS* IV
Roanoke (undrained)
NN V V V V NS* NS*
Robertsville LL V V V V NS* IV Rockbam X IVa IVa II III III II Rohrersville BB IVb IVb III IV NS* III Ross A Ia Ia I Ia I I Rough JJ V V IV V NS* IV

20
Table 1-1 Soil Productivity Groupings for Various Cropping Categories
Soil Series
Soil Mgt
Group
Corn
Grain Sorghum
Small Grain
Soybeans
Alfalfa
Tall Grass, Clover,
Hay, Pasture
Rowland A Ia Ia I Ia I I Rumford DD IVb IVb II IV NS* III Rushtown FF IVb IVb III IV NS* III Ruston S IIIa IIIa II II NS* III Saffell DD IVb IVb II IV NS* III Santuc G IIa IIa I II II I Sassafras T IIIb IIIb II II NS* III Saunook L IIb IIb I II III II Sauratown CC IVb IVb II IV NS* III Savannah BB IVb IVb III IV NS* III Scatterville BB IVb IVb III IV NS* III Schaffenaker II V V III V NS* NS* Seabrook EE IVb IVb III IV NS* NS* Seagate EE IVb IVb III IV NS* NS* Sedgefield KK V V V V NS* IV Sekil FF IVb IVb III IV NS* III Seneca G IIa IIa I II II I Sequatchie B Ia Ia I Ia II I Sequoia U IIIb IIIb II II III II Sewell JJ V V IV V NS* IV Shelocta L IIb IIb I II III II Shelocta variant
L IIb IIb I II III II
Shenval O IIb IIb I II II II Sherando CC IVb IVb II IV NS* III Sheva KK V V V V NS* IV Shottower O IIb IIb I II II II Shouns G IIa IIa I II II I Sindion B Ia Ia I Ia II I Skeeterville KK V V V V NS* IV Slabtown G IIa IIa I II II I Slagle K IIb IIb I II III I Snicksville D Ib Ib I Ib I I Snowdog BB IVb IVb III IV NS* III Spears Mountain
V IVa IVa II III III III
Speedwell A Ia Ia I Ia I I Spessard CC IVb IVb II IV NS* III Spivey FF IVb IVb III IV NS* III Spotsylvania V IVa IVa II III III III Spray JJ V V IV V NS* IV Spriggs JJ V V IV V NS* IV Springwood D Ib Ib I Ib I I Stanton LL V V V V NS* IV Starr G IIa IIa I II II I Starr-Dyke O IIb IIb I II II II Staser A Ia Ia I Ia I I State (ES) T IIIb IIIb II II NS* III

21
Table 1-1 Soil Productivity Groupings for Various Cropping Categories
Soil Series
Soil Mgt
Group
Corn
Grain Sorghum
Small Grain
Soybeans
Alfalfa
Tall Grass, Clover,
Hay, Pasture
State (Mainland)
B Ia Ia I Ia II I
Steinsburg JJ V V IV V NS* IV Stonecoal JJ V V IV V NS* IV Stoneville X IVa IVa II III III II Stott Knob N IIb IIb I II II II Stough F IIa IIa I II III II Straightstone V IVa IVa II III III III Strawfield X IVa IVa II III III II Stumptown FF IVb IVb III IV NS* III Suches A Ia Ia I Ia I I Sudley D Ib Ib I Ib I I Suffolk T IIIb IIIb II II NS* III Sugarhol O IIb IIb I II II II Sulfaquents PP V V V V NS* NS* Summers GG IVb IVb IV IV NS* III Susquehanna KK V V V V NS* IV Swamp PP V V V V NS* NS* Swampoodle D Ib Ib I Ib I I Sweetapple FF IVb IVb III IV NS* III Swimley M IIb IIb I II I II Sycoline KK V V V V NS* IV Sylco JJ V V IV V NS* IV Sylvatus JJ V V IV V NS* IV Talladega JJ V V IV V NS* IV Tallapoosa JJ V V IV V NS* IV Tallapoosa variant
JJ V V IV V NS* IV
Tanasee JJ V V IV V NS* IV Tankerville N IIb IIb I II II II Tankerville taxadjunct
N IIb IIb I II II II
Tarboro II V V III V NS* NS* Tarrus X IVa IVa II III III II Tate O IIb IIb I II II II Tate variant O IIb IIb I II II II Tatum X IVa IVa II III III II Terric Medisaprists
PP V V V V NS* NS*
Tetotum K IIb IIb I II III I Tetotum variant K IIb IIb I II III I Thunder GG IVb IVb IV IV NS* III Thurmont L IIb IIb I II III II Tidal Marsh PP V V V V NS* NS* Tidal Marsh, high
PP V V V V NS* NS*
Tidal Marsh, low
PP V V V V NS* NS*

22
Table 1-1 Soil Productivity Groupings for Various Cropping Categories
Soil Series
Soil Mgt
Group
Corn
Grain Sorghum
Small Grain
Soybeans
Alfalfa
Tall Grass, Clover,
Hay, Pasture
Tidal Mudflats PP V V V V NS* NS* Tidal Pool PP V V V V NS* NS* Tifton Q IIIa IIIa II II NS* III Timberville G IIa IIa I II II I Timberville variant
G IIa IIa I II II I
Tioga A Ia Ia I Ia I I Toccoa II V V III V NS* NS* Toddstav HH IVb IVb III IV NS* IV Tomotley (drained)
C Ib Ib II Ib NS* I
Tomotley (undrained)
OO V V V V NS* NS*
Toms C Ib Ib II Ib NS* I Toqast V IVa IVa II III III III Torhunta E IIa IIa I II NS* II Totier U IIIb IIIb II II III II Toxaway CC IVb IVb II IV NS* III Toxaway (drained)
C Ib Ib II Ib NS* I
Toxaway (undrained)
OO V V V V NS* NS*
Trappist U IIIb IIIb II II III II Trego W IVa IVa IV III NS* IV Trenholm KK V V V V NS* IV Trimont FF IVb IVb III IV NS* III Trussell BB IVb IVb III IV NS* NS* Tuckahoe A Ia Ia I Ia I I Tuckasegee G IIa IIa I II II I Tugglesgap CC IVb IVb II IV NS* III Tumbling O IIb IIb I II II II Turbeville O IIb IIb I II II II Tusquitee G IIa IIa I II II I Tygart (drained)
P IIb IIb II II NS* III
Tygart (undrained)
Z IVa IVa IV III NS* NS*
Uchee DD IVb IVb II IV NS* III Udults Y IVa IVa III III NS* III Unison L IIb IIb I II III II Unison variant L IIb IIb I II III II Vance Y IVa IVa III III NS* III Vandalia L IIb IIb I II III II Varina Q IIIa IIIa II II NS* III Vaucluse Q IIIa IIIa II II NS* III Vertrees M IIb IIb I II I II Virgilina KK V V V V NS* IV Wadesboro X IVa IVa II III III II

23
Table 1-1 Soil Productivity Groupings for Various Cropping Categories
Soil Series
Soil Mgt
Group
Corn
Grain Sorghum
Small Grain
Soybeans
Alfalfa
Tall Grass, Clover,
Hay, Pasture
Wagram DD IVb IVb II IV NS* III Wahee (drained)
C Ib Ib II Ib NS* I
Wahee (undrained)
OO V V V V NS* NS*
Wakulla II V V III V NS* NS* Wallen JJ V V IV V NS* IV Walnut GG IVb IVb IV IV NS* III Wando II V V III IV NS* III Warminster X IVa IVa II III III II Watahala M IIb IIb I II I II Watauga V IVa IVa II III III III Wateree FF IVb IVb III IV NS* III Watt JJ V V IV V NS* IV Watt variant JJ V V IV V NS* IV Waxpool LL V V V V NS* IV Waynesboro L IIb IIb I II III II Weaver A Ia Ia I Ia I I Webbtown JJ V V IV V NS* IV Wedowee V IVa IVa II III III III Weeksville (drained)
C Ib Ib II Ib NS* I
Weeksville (undrained)
OO V V V V NS* NS*
Wehadkee MM V V V V NS* IV Weikert JJ V V IV V NS* IV Westfield V IVa IVa II IV III III Westmoreland U IIIb IIIb II II III II Weston E IIa IIa I II NS* II Westphalia II V V III V NS* NS* Weverton GG IVb IVb IV IV NS* III Wharton M IIb IIb I II I II Wheeling A Ia Ia I Ia I I White Store KK V V V V NS* IV White Store variant
KK V V V V NS* IV
Whiteford U IIIb IIIb II II III II Wickham B Ia Ia I Ia II I Wickham variant
B Ia Ia I Ia II I
Widget CC IVb IVb II IV NS* III Wilkes JJ V V IV V NS* IV Wingina A Ia Ia I Ia I I Winnsboro KK V V V V NS* IV Wintergreen O IIb IIb I II II II Winton B Ia Ia I Ia II I Wolfgap A Ia Ia I Ia I I Wolftrap K IIb IIb I II III I

24
Table 1-1 Soil Productivity Groupings for Various Cropping Categories
Soil Series
Soil Mgt
Group
Corn
Grain Sorghum
Small Grain
Soybeans
Alfalfa
Tall Grass, Clover,
Hay, Pasture
Woodington EE IVb IVb III IV NS* NS* Woodstown J IIb IIb I II NS* I Woolvine V IVa IVa II III III III Woolwine V IVa IVa II III III III Worsham HH IVb IVb III IV NS* IV Worsham variant
HH IVb IVb III IV NS* IV
Wrightsboro J IIb IIb I II NS* I Wurno JJ V V IV V NS* IV Wyrick G IIa IIa I II II I Yadkin X IVa IVa II III III II Yellowbottom V IVa IVa II III III III Yemasse (drained)
C Ib Ib II Ib NS* I
Yemasse (undrained)
OO V V V V NS* NS*
Yeopim K IIb IIb I II III I Yogaville MM V V V V NS* IV York BB IVb IVb III IV NS* III Zepp JJ V V IV V NS* IV Zion Y IVa IVa III III NS* III Zion variant Y IVa IVa III III NS* III Zoar K IIb IIb I II III I
*NS - Not Suited. If crop will be grown in this soil series, use the lowest Productivity Group Yield OR
verifiable past crop yields as defined in 4VAC5-15-150.A.2.e.(3) of the Nutrient Management Training and Certification Regulations.

25
Table 1-2 Estimated Yields in Bushels (Bu) or Tons (T) per Acre (Ac) of Various
Non-Irrigated Crops for Identified Soil Productivity Groups
Crop
I
II
III
IV
V
a
b
a
b
a
b
a
b
Corn Grain (Bu/Ac) Silage (T/Ac) 1
180 25.4
170 24.4
160 23.4
150 22.5
140 21.5
130 20.5
120 19.5
100 17.5
80 15.6
Grain Sorghum (Bu/Ac)
140
130
120
110
100
90
80 Soybeans (Bu/Ac) Early season Late season 2
50 40
45 34
40 34 30
35 25
25 18
20 15
Wheat (Bu/Ac) Standard Intensive
64 80
56 70
48 60
40 50
24 30
Barley (Bu/Ac) Standard Intensive
100 115
70 88
60 75
50 63
30 38
Oats (Bu/Ac)
80
80
80
60
60
Cereal Silage (T/Ac) Barley/Oats/Rye Wheat/Triticale
>10 >12
8-10 10-12
6-8 8-10
3-6 4-8
<3 <4
Tallgrass Hay (T/Ac)
>4.0
3.5-4.0
3.0-3.5
<3.0
<3.0 Bermudagrass Hay (T/Ac)
>6.0
5.0-6.0
4.0-5.0
3.0-4.0
<3 Prairie Grass Hay (T/Ac)
>5.0
4.25-5
3.5-4.25
3-3.5
<3
Alfalfa (T/Ac)
>6.0
4.0-6.0
<4.0
<4.0
<4.0
Pasture (Ac/AU)*
1.0
1.1-1.5
1.6-3.0
3.1-6.5
1. When using documented farmer records, corn silage yield may be calculated using the following
formula: Corn Grain Yield (bu/ac) X 0.0985 + 7.6964 = Corn Silage Yield Tons/ac.
2. Late season beans would be planted on or after 6/21 of that year. 3. Yields are based on the following moisture levels: grain-corn-15.5%, wheat-13.5%, barley-14%,
oats-14%, grain sorghum-13%, soybeans-14.5%; all silage-65%; all hay-15%. *Animal Unit (AU) - To determine pasture carrying capacity, one animal unit = 1000 lbs of any animal type or one 1000 lb cow and calf or two 500 lb steers or five ewes with lambs.
26
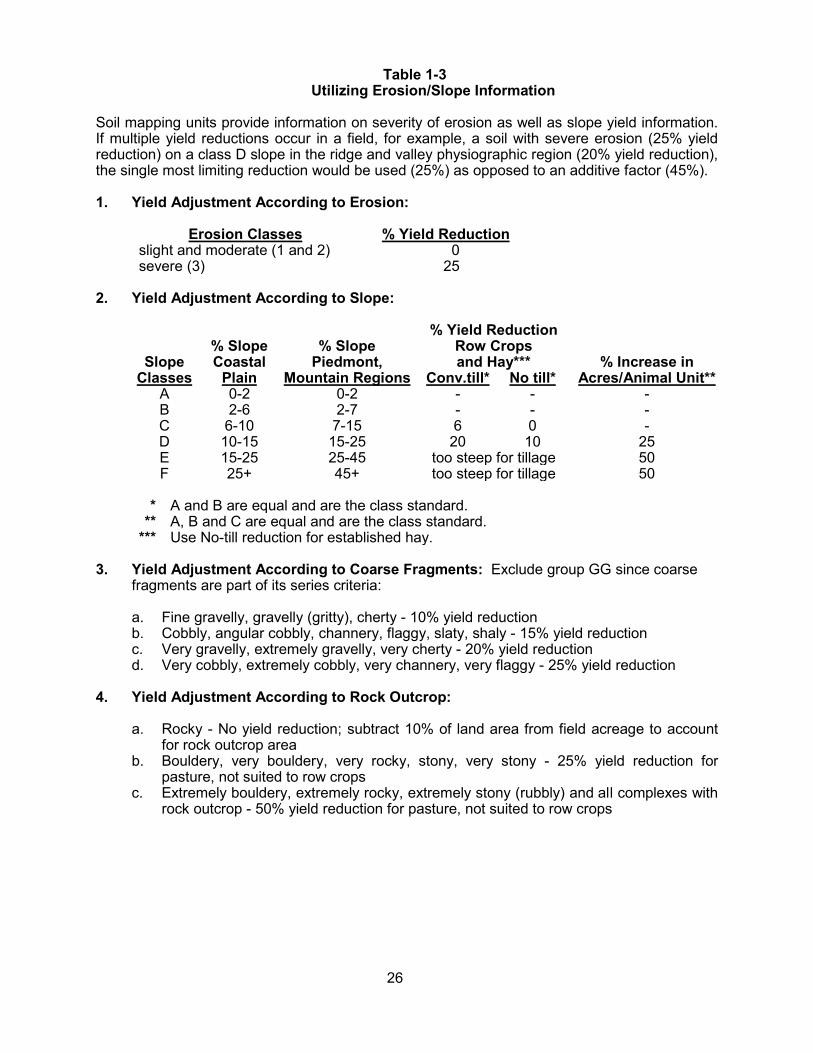
Table 1-3 Utilizing Erosion/Slope Information
Soil mapping units provide information on severity of erosion as well as slope yield information. If multiple yield reductions occur in a field, for example, a soil with severe erosion (25% yield reduction) on a class D slope in the ridge and valley physiographic region (20% yield reduction), the single most limiting reduction would be used (25%) as opposed to an additive factor (45%). 1. Yield Adjustment According to Erosion:
Erosion Classes % Yield Reduction slight and moderate (1 and 2) 0 severe (3) 25
2. Yield Adjustment According to Slope:
Slope Classes
% Slope Coastal
Plain
% Slope
Piedmont, Mountain Regions
% Yield Reduction Row Crops and Hay***
% Increase in Acres/Animal Unit** Conv.till* No till*
A 0-2 0-2 - - - B 2-6 2-7 - - - C 6-10 7-15 6 0 - D 10-15 15-25 20 10 25 E 15-25 25-45 too steep for tillage 50 F 25+ 45+ too steep for tillage 50
* A and B are equal and are the class standard.
** A, B and C are equal and are the class standard. *** Use No-till reduction for established hay.
3. Yield Adjustment According to Coarse Fragments: Exclude group GG since coarse
fragments are part of its series criteria:
a. Fine gravelly, gravelly (gritty), cherty - 10% yield reduction b. Cobbly, angular cobbly, channery, flaggy, slaty, shaly - 15% yield reduction c. Very gravelly, extremely gravelly, very cherty - 20% yield reduction d. Very cobbly, extremely cobbly, very channery, very flaggy - 25% yield reduction
4. Yield Adjustment According to Rock Outcrop:
a. Rocky - No yield reduction; subtract 10% of land area from field acreage to account for rock outcrop area
b. Bouldery, very bouldery, very rocky, stony, very stony - 25% yield reduction for pasture, not suited to row crops
c. Extremely bouldery, extremely rocky, extremely stony (rubbly) and all complexes with rock outcrop - 50% yield reduction for pasture, not suited to row crops
27
Section I.A Explanation of Environmentally Sensitive Sites The regulations define "environmentally sensitive site" to mean any field which is particularly susceptible to nutrient loss to groundwater or surface water since it contains or drains to areas which contain sinkholes; or where at least 33% of the area in a specific field contains one or any combination of the following features: 1. Soils with high potential for leaching based on soil texture or excessive drainage; 2. Shallow soils less than 41 inches deep likely to be located over fractured or limestone
bedrock; 3. Subsurface tile drains; 4. Soils with high potential for subsurface lateral flow based on soil texture and poor drainage; 5. Floodplains as identified by soils prone to frequent flooding in county soil surveys; or 6. Lands with slopes greater than 15%. Table 1-4 contains environmental risk ratings for Virginia soils for criteria 1,2 and 4 l isted above. Determine the percentage of field area for soils listed as H (high) for Environmental Sensitivity Rating in Table 1-4 plus any field areas that meet criteria 3, 5 or 6 above to determine if the field is an env ironmentally sensitive site. Soils listed as moderate risk are not defined as environmentally sensitive, but should be treated with similar caution when making nitrogen recommendations. The primary reason for the environmental sensitivity rating for each soil listed as high or moderate risk in Table 1-4 is identified by the following key:
Leaching - Soils with potential for leaching based on soil texture or excessive drainage Shallow - Shallow soils less than 41 i nches deep likely to be l ocated over fractured or
limestone bedrock Drainage - Soils with high potential for subsurface lateral flow based on soil texture and
poor drainage The category rating should be us ed to develop nitrogen application programs to address this concern through rate and timing recommendations. Table 1-4 that follows lists the environmental sensitivity rating and c ategory for each soil in Virginia.

28
Table 1-4
Nitrogen Loss Risk and Environmental Sensitivity Ratings for Virginia Soils & Soil Series Associated With Environmentally Sensitive Sites
Soil Series Environmental
Sensitivity
Category Abell L Ackwater L Acredale L Aden L Airmont L Alaga H Leaching Alamance H Leaching Alanthus M Leaching Albano L Albemarle M Leaching Alderflats L Aldino L Allegheny H Shallow Alonemill H Leaching Alonzville M Leaching Altavista L Altavista variant
L
Alticrest H Shallow Angie L Appling L Appling gritty L Appomattox L Aqualfs L Aquents H Drainage Aquic Udifluvents
L
Aquults L Arapahoe H Drainage Arcola M Leaching Ardilla L Argent L Arkaqua L Ashburn L Ashe H Leaching Ashlar H Leaching Assateague H Leaching Athol L Atkins H Drainage Atlee L Augusta variant L Augusta L Aura H Leaching Austinville L Axis H Drainage Aycock L Ayersville M Leaching Backbay H Drainage Badin L Baile L
Soil Series
Environmental Sensitivity
Category
Bailegap M Leaching Balsam H Shallow Bama M Leaching Banister L Barclay M Leaching Batteau L Beckham L Bedington M Leaching Beech L Beech Grove H Shallow Belhaven H Drainage Bellspur M Leaching Beltsville L Belvoir L Benthole H Leaching Bentley L Berks H Shallow Berks variant H Shallow Bermudian M Leaching Berthera L Bertie L Bethera L Bethesda H Leaching Bethlehem H Shallow Bibb H Drainage Biltmore H Leaching Birdsboro L Blackthorn L Bladen L Blago L Blairton H Shallow Bland H Shallow Blocktown H Shallow Bloodyhorse H Leaching Bluemont M Shallow Bluemount M Leaching Bohicket L Bojac, Eastern Shore
H Leaching
Bojac, mainland
H Leaching
Bolling L Bolling variant L Bolton M Leaching Bonneau H Leaching Bookwood H Shallow Botetourt L Bourne L Bourne variant L Bowmansville H Drainage
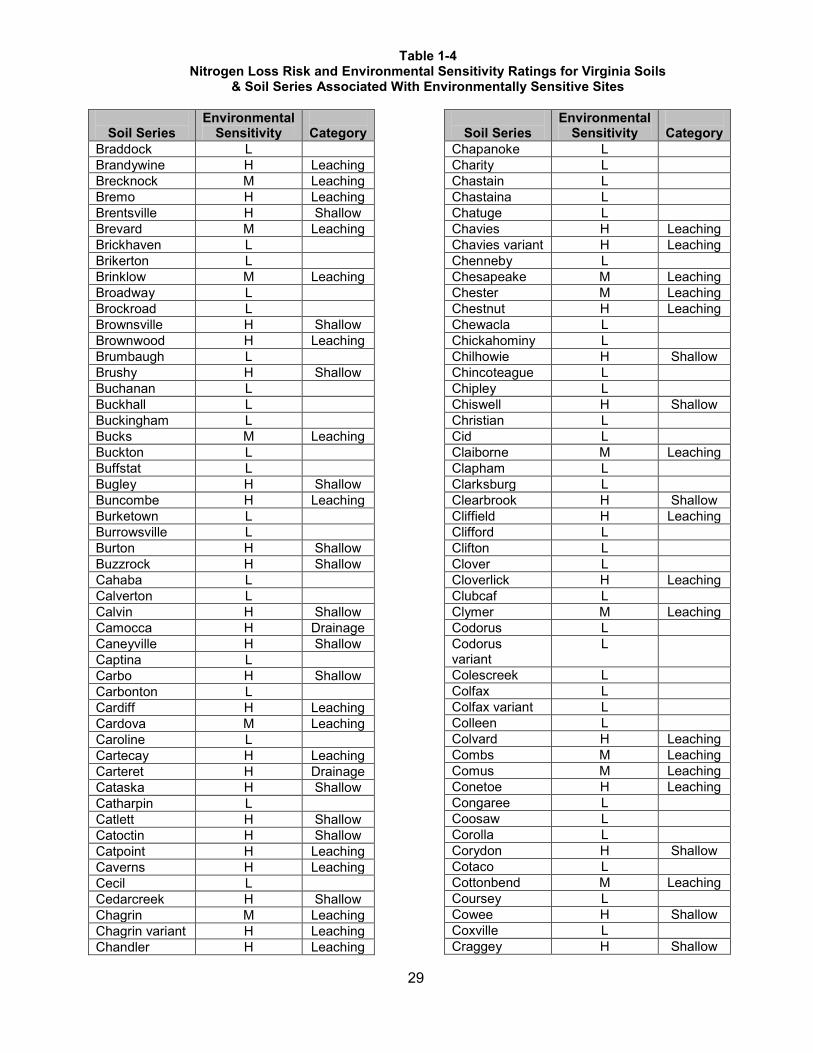
Table 1-4 Nitrogen Loss Risk and Environmental Sensitivity Ratings for Virginia Soils
& Soil Series Associated With Environmentally Sensitive Sites
29
Soil Series
Environmental Sensitivity
Category
Braddock L Brandywine H Leaching Brecknock M Leaching Bremo H Leaching Brentsville H Shallow Brevard M Leaching Brickhaven L Brikerton L Brinklow M Leaching Broadway L Brockroad L Brownsville H Shallow Brownwood H Leaching Brumbaugh L Brushy H Shallow Buchanan L Buckhall L Buckingham L Bucks M Leaching Buckton L Buffstat L Bugley H Shallow Buncombe H Leaching Burketown L Burrowsville L Burton H Shallow Buzzrock H Shallow Cahaba L Calverton L Calvin H Shallow Camocca H Drainage Caneyville H Shallow Captina L Carbo H Shallow Carbonton L Cardiff H Leaching Cardova M Leaching Caroline L Cartecay H Leaching Carteret H Drainage Cataska H Shallow Catharpin L Catlett H Shallow Catoctin H Shallow Catpoint H Leaching Caverns H Leaching Cecil L Cedarcreek H Shallow Chagrin M Leaching Chagrin variant H Leaching Chandler H Leaching
Soil Series
Environmental Sensitivity
Category
Chapanoke L Charity L Chastain L Chastaina L Chatuge L Chavies H Leaching Chavies variant H Leaching Chenneby L Chesapeake M Leaching Chester M Leaching Chestnut H Leaching Chewacla L Chickahominy L Chilhowie H Shallow Chincoteague L Chipley L Chiswell H Shallow Christian L Cid L Claiborne M Leaching Clapham L Clarksburg L Clearbrook H Shallow Cliffield H Leaching Clifford L Clifton L Clover L Cloverlick H Leaching Clubcaf L Clymer M Leaching Codorus L Codorus variant
L
Colescreek L Colfax L Colfax variant L Colleen L Colvard H Leaching Combs M Leaching Comus M Leaching Conetoe H Leaching Congaree L Coosaw L Corolla L Corydon H Shallow Cotaco L Cottonbend M Leaching Coursey L Cowee H Shallow Coxville L Craggey H Shallow
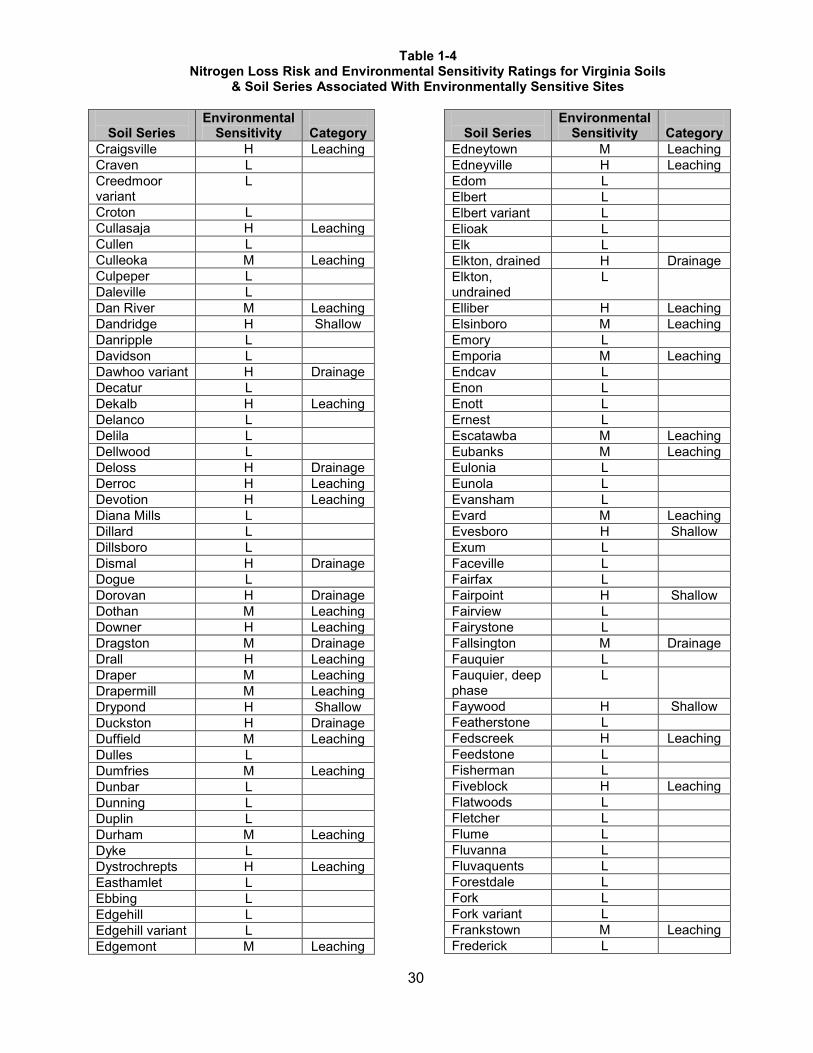
Table 1-4 Nitrogen Loss Risk and Environmental Sensitivity Ratings for Virginia Soils
& Soil Series Associated With Environmentally Sensitive Sites
30
Soil Series
Environmental Sensitivity
Category
Craigsville H Leaching Craven L Creedmoor variant
L
Croton L Cullasaja H Leaching Cullen L Culleoka M Leaching Culpeper L Daleville L Dan River M Leaching Dandridge H Shallow Danripple L Davidson L Dawhoo variant H Drainage Decatur L Dekalb H Leaching Delanco L Delila L Dellwood L Deloss H Drainage Derroc H Leaching Devotion H Leaching Diana Mills L Dillard L Dillsboro L Dismal H Drainage Dogue L Dorovan H Drainage Dothan M Leaching Downer H Leaching Dragston M Drainage Drall H Leaching Draper M Leaching Drapermill M Leaching Drypond H Shallow Duckston H Drainage Duffield M Leaching Dulles L Dumfries M Leaching Dunbar L Dunning L Duplin L Durham M Leaching Dyke L Dystrochrepts H Leaching Easthamlet L Ebbing L Edgehill L Edgehill variant L Edgemont M Leaching
Soil Series
Environmental Sensitivity
Category
Edneytown M Leaching Edneyville H Leaching Edom L Elbert L Elbert variant L Elioak L Elk L Elkton, drained H Drainage Elkton, undrained
L
Elliber H Leaching Elsinboro M Leaching Emory L Emporia M Leaching Endcav L Enon L Enott L Ernest L Escatawba M Leaching Eubanks M Leaching Eulonia L Eunola L Evansham L Evard M Leaching Evesboro H Shallow Exum L Faceville L Fairfax L Fairpoint H Shallow Fairview L Fairystone L Fallsington M Drainage Fauquier L Fauquier, deep phase
L
Faywood H Shallow Featherstone L Fedscreek H Leaching Feedstone L Fisherman L Fiveblock H Leaching Flatwoods L Fletcher L Flume L Fluvanna L Fluvaquents L Forestdale L Fork L Fork variant L Frankstown M Leaching Frederick L

Table 1-4 Nitrogen Loss Risk and Environmental Sensitivity Ratings for Virginia Soils
& Soil Series Associated With Environmentally Sensitive Sites
31
Soil Series
Environmental Sensitivity
Category
Freemanville L French L Fresh water swamp
H Drainage
Fripp H Leaching Funkstown L Gaila M Leaching Gainesboro H Shallow Galestown H Leaching Galtsmill H Leaching Georgeville L Germanna L Gertie L Gilpin H Shallow Gladehill H Leaching Glenelg M Leaching Glenelg, Blue Ridge
M Leaching
Glenelg, New River Valley
M Leaching
Glenville L Glynwood L Goblintown L Goldsboro L Goldston H Leaching Goldvein L Goresville L Granville L Grassland L Greendale L Greenlee H Leaching Griffinsburg H Shallow Grigsby H Leaching Grimsley H Leaching Gritney L Groseclose L Grover M Leaching Gullion L Gundy L Gunstock H Shallow Guyan L Gwinnett variant
L
Hagerstown L Halewood L Halifax L Hanceville L Haplaquepts H Leaching Happyland M Leaching Hartleton H Shallow Hartsells M Shallow Hatboro H Drainage
Soil Series
Environmental Sensitivity
Category
Hawksbill H Leaching Hayesville L Haymarket L Hayter M Leaching Haywood H Leaching Hazel H Shallow Hazel (channery)
H Shallow
Hazel Run M Leaching Hazleton H Shallow Helena L Herndon L Hibler L Hickoryknob M Leaching Highsplint H Leaching Hiwassee L Hoadly L Hobucken H Drainage Holly H Drainage Hollywood L Hubersburg L Huntington L Hyde L Hydraquents H Drainage Ingledove M Leaching Iotla L Iredell L Irongate H Leaching Itmann H Shallow Iuka L Izagora L Jackland L Jedburg L Jefferson M Leaching Jefferson variant
H Leaching
Johns, drained H Drainage Johns, undrained
L
Johnston H Drainage Junaluska H Shallow Kalmia M Leaching Kaymine H Shallow Keener M Leaching Kelly L Kempsville M Leaching Kenansville H Leaching Kenansville variant
L
Keyport L Kibler M Leaching Kinkora L

Table 1-4 Nitrogen Loss Risk and Environmental Sensitivity Ratings for Virginia Soils
& Soil Series Associated With Environmentally Sensitive Sites
32
Soil Series
Environmental Sensitivity
Category
Kinston L Klej H Drainage Klinesville H Shallow Konnarock H Shallow Lackstown L Laidig M Leaching Lakehurst variant
L
Lakeland H Leaching Lakin H Leaching Landsiburg L Lanexa H Drainage Lanside H Shallow LaRoque M Leaching Lawnes H Drainage Leaf L Leaksville L Leck Kill M Leaching Leedsville M Leaching Leetonia H Shallow Legore M Leaching Lehew H Shallow Lenoir L Leon H Drainage Levy H Drainage Lew H Leaching Lewisberry H Leaching Library L Lignum L Lily H Shallow Lindside L Littlejoe L Litz H Shallow Lloyd L Lloyd variant L Lobdell L Lodi L Lostcove H Leaching Louisa H Leaching Louisa variant H Leaching Louisburg H Leaching Louisburg, hapludalfs
H Leaching
Lowell L Lucketts L Lucy H Leaching Lumbee H Drainage Lumbee variant H Drainage Lunt L Lynchburg L Macove H Leaching
Soil Series
Environmental Sensitivity
Category
Madison L Madsheep H Shallow Magotha H Drainage Manassas L Mandy H Shallow Manor H Leaching Mantachie L Manteo H Shallow Marbie L Marbleyard H Leaching Margo L Markes H Drainage Marlboro L Marr M Leaching Marrowbone H Shallow Masada L Massanetta L Massanutten H Shallow Matapeake L Matewan H Leaching Matneflat H Leaching Mattamuskeet H Drainage Mattan H Drainage Mattapex L Mattaponi L Maurertown L Maury L Mayodan L McCamy M Leaching McClung M Leaching McGary L McLaurin H Leaching McQueen L Meadowfield H Shallow Meadows H Shallow Meadowville M Leaching Meckesville L Mecklenburg L Mecklenburg variant
L
Meggett L Melfa H Drainage Melvin L Middleburg M Leaching Millrock H Leaching Mine Run H Leaching Minnieville L Mirerock L Misenheimer H Shallow Mixed alluvium, poorly drained
H Drainage

Table 1-4 Nitrogen Loss Risk and Environmental Sensitivity Ratings for Virginia Soils
& Soil Series Associated With Environmentally Sensitive Sites
33
Soil Series
Environmental Sensitivity
Category
Mixed alluvium, well drained
L
Molena H Leaching Monacan L Mongle L Monongahela L Montalto L Montonia M Leaching Montross L Moomaw L Morven M Leaching Mount Lucas L Mt Rogers H Leaching Muckalee H Drainage Munden M Leaching Murrill M Leaching Muskingum H Shallow Myatt, drained M Leaching Myatt, undrained
L
Myatt variant, drained
M Leaching
Myatt variant, Undrained
L
Myersville M Leaching Nahunta L Nanford L Nansemond M Leaching Nason L Nathalie L Nawney L Neabsco L Needmore M Shallow Nestoria H Shallow Nevarc L Newark variant L Newark L Newark, undrained
L
Newbern H Shallow Newflat L Newhan H Leaching Newmarc L Nicelytown L Nicholson L Nikwasi H Drainage Nimmo H Drainage Nixa L Nolichucky M Leaching Nolin L Nollville L Nomberville L
Soil Series
Environmental Sensitivity
Category
Norfolk M Leaching Oak Level L Oakhill H Leaching Oaklet L Oatlands M Leaching Occoquan M Leaching Ochlockonee H Leaching Ochlockonee variant
L
Ochraquults L Ochrepts, A/D L Ochrepts, B/D L Ochrepts, D L Ocilla L Ogles H Leaching Okeetee L Opequon H Shallow Orange L Orange variant L Orangeburg M Leaching Orenda L Oriskany H Leaching Orrville, Drained
M Leaching
Orrville, Undrained
L
Orrville variant Drained
M Leaching
Orriville vairant undrained
L
Orthents L Osier H Drainage Ostin M Leaching Othello L Ott M Leaching Pacolet L Pactolus L Paddyknob H Shallow Pagebrook L Palms variant H Drainage Pamlico H Drainage Pamunkey M Leaching Pamunkey Variant
M Leaching
Panorama M Leaching Pantego L Parker H Leaching Partlow M Drainage Pasquotank H Drainage Peaks H Shallow Peawick L Pecktonville L

Table 1-4 Nitrogen Loss Risk and Environmental Sensitivity Ratings for Virginia Soils
& Soil Series Associated With Environmentally Sensitive Sites
34
Soil Series
Environmental Sensitivity
Category
Penhook L Penn M Leaching Philo (Dr.) M Leaching Philomont H Leaching Pigeonroost H Shallow Pilot Mountain H Leaching Pineola M Leaching Pineville M Leaching Pineywoods L Pinkston H Leaching Pinoka M Leaching Pisgah L Plummer M Drainage Pocalla M Leaching Pocaty L Pocomoke M Drainage Poindexter M Leaching Polawana H Drainage Pooler variant L Pooler L Pope H Leaching Poplimento L Porters M Leaching Portsmouth M Drainage Pouncey L Poynor H Leaching Psamments, mod well
L
Psamments, somewhat poorly
L
Psamments, well drained
H Leaching
Pungo H Drainage Purcellville L Purdy L Quantico L Rabun L Rains L Ramsey H Shallow Rapidan L Rappahannock H Drainage Raritan L Rasalo L Rayne M Leaching Readington L Reaville L Redbrush L Remlik H Leaching Rhodhiss M Leaching Rigley H Leaching Rion M Leaching
Soil Series
Environmental Sensitivity
Category
Riverview M Leaching Rixeyville H Shallow Roanoke L Robertsville L Rockbarn L Rohrersville L Ross M Leaching Rough H Shallow Rowland L Rumford H Leaching Rushtown H Leaching Ruston M Leaching Saffell H Shallow Santuc L Sassafras M Leaching Saunook M Leaching Sauratown M Leaching Savannah L Scattersville L Schaffenaker H Leaching Seabrook L Seagate H Drainage Sedgefield L Sekil H Leaching Seneca L Sequatchie L Sequoia H Shallow Sewell H Shallow Shelocta M Leaching Shelocta variant
L
Shenval L Sherando H Leaching Sheva L Shottower L Siloam L Sindion L Skeeterville L Slabtown L Slagle L Snowdog L Spears Mountain
L
Speedwell M Leaching Spessard H Leaching Spivey H Leaching Spotsylvania L Spray M Leaching Spriggs M Leaching Springwood L Starr M Leaching

Table 1-4 Nitrogen Loss Risk and Environmental Sensitivity Ratings for Virginia Soils
& Soil Series Associated With Environmentally Sensitive Sites
35
Soil Series
Environmental Sensitivity
Category
Starr Dyke L Stasser L State M Leaching Statler M Leaching Steinsburg H Leaching Stonecoal H Shallow Stoneville L Stott Knob M Leaching Stough L Straightstone L Strawfield L Stumptown H Leaching Suches M Leaching Sudley M Leaching Suffolk M Leaching Sugarhol L Sulfaquents L Summers H Shallow Susquehanna L Swamp H Drainage Swampoodle L Sweetapple H Leaching Swimley L Sycoline L Sylco H Shallow Sylvatus H Shallow Talladega H Shallow Tallapoosa L Tallapoosa variant
L
Tanasee H Leaching Tankerville H Shallow Tarboro H Leaching Tarrus L Tate M Leaching Tatum L Terric Haplohemists
H Drainage
Tetotum L Tetotum variant L Thunder H Leaching Thurmont M Leaching Tifton L Timberville L Timberville variant
M Leaching
Tioga H Leaching Tipples H Shallow Toast L Toddstav L Tomotley L Toms L
Soil Series
Environmental Sensitivity
Category
Torhunta H Drainage Totier L Toxaway M Drainage Trappist M Shallow Trego M Leaching Trenholm L Trimont M Leaching Trussell L Tuckahoe M Leaching Tuckasegee M Leaching Tugglesgap L Tumbling L Turbeville L Tusquitee, coarse loamy
H Leaching
Tusquitee, fine loamy
M Leaching
Tygart L Typic Udorthents
L
Uchee H Leaching Udalfs H Drainage Udifluvents, fine loamy
L
Udipsamments, mod well
L
Udipsamments, well
L
Udults, well drained
L
Unison L Unison variant L Vance L Vandalla L Varina L Vaucluse M Leaching Vertrees L Virgilina L Wadesboro L Wadesboro L Wagram M Leaching Wahee L Wallen H Shallow Walnut H Leaching Wando H Leaching Warminster L Watahala M Leaching Watauga M Leaching Wateree H Leaching Watt H Shallow Watt variant H Shallow Waxpool L

Table 1-4 Nitrogen Loss Risk and Environmental Sensitivity Ratings for Virginia Soils
& Soil Series Associated With Environmentally Sensitive Sites
36
Soil Series
Environmental Sensitivity
Category
Waynesboro L Weaver L Webbtown H Shallow Wedowee L Weeksville M Drainage Wehadkee L Weikert H Shallow Westfield L Westmoreland M Leaching Weston H Drainage Westphalia H Leaching Weverton H Leaching Wharton L Wheeling M Leaching White Store L White Store variant
L
Whiteford M Leaching Wickham M Leaching Wickham variant
M Leaching
Widgett H Leaching Wilkes L Wingina M Leaching Winnsboro L Wintergreen L
Soil Series
Environmental Sensitivity
Category
Winton L Wolfgap M Leaching Wolftrap L Woodington H Drainage Woodstown L Woolwine L Worsham L Worsham variant
L
Wrightsboro L Wurno H Shallow Wyrick M Leaching Yellowbottom L Yemasse, drained
H Drainage
Yemasse, undrained
L
Yeopim L Yogaville L York L Zepp H Leaching Zion L Zion variant L Zoar L

37
Section I.B Recommended Setback Areas In addition to other management practices discussed in this section, animal waste or biosolids shall not be applied within the following setback areas around the specific features listed. Select the category which applies to the plan you are writing. The set-back requirements exist for animal waste and biosolids primarily to reduce the potential for pathogens (such as fecal coliform) to enter surface and ground waters. ♦ Setbacks for plans not associated with Biosolids applications, VPA permitted animal
operations or DEQ industrial waste application permits. 100 feet from wells or springs 50 feet from surface water if surface applied 25 feet from surface water if injected 50 feet from sinkholes* 50 feet from limestone rock outcrops 25 feet from other rock outcrops * In addition to the 50 feet setback, manure and biosolids should not be applied in areas subject
to concentrated flow generated by runoff from storm events that drains into sinkholes. ♦ Setback distances for manure applications in plans written as part of a VPA or VPDES permit for confined animal feeding operations.
100 feet from wells or springs 100 feet from surface waters (no vegetated buffer) or 35 feet with a vegetated buffer** in
place or a DEQ approved conservation practice that will achieve at least equivalent pollutant reductions.
50 feet from sinkholes* 50 feet from limestone rock outcrops 25 feet from other rock outcrops 10 feet from agricultural drainage ditches (5 feet if injected) 200 feet from occupied dwellings (unless waived in writing by the occupant)
* Waste shall not be applied in such a manner that it would discharge into sinkholes. ** Vegetated buffer is a permanent strip of dense vegetation established parallel to the contours of
and perpendicular to the dominant slope of the field.

38
♦ Setback distances for fields receiving Biosolids applications in nutrient management plans.
Minimum distances to Land Application Area
Adjacent Features
Surface Application
(ft)(1)
Incorporation (ft)
Winter (ft) (2) Occupied Dwellings 200 200 200 Water Supply wells and springs 100 100 100 Property Lines 100 50 100 Perennial streams and other surface waters except intermittent streams
50 35 100
Intermittent streams/drainage ditches 25 25 50 All improved roadways 10 5 10 Rock outcrops 25 25 25 Limestone rock outcrops and sinkholes
25 25 25
Agricultural drainage ditches with slopes equal to or less than 2.0%
10 5 10
Notes:
If slopes are greater than 7.0% and biosolids will be applied between November 16 and March 15, standard buffer distances to perennial streams other surface water bodies shall be doubled.
(1) Not plowed or disked to incorporate within 48 hours (2) Application occurs on a verage site slope greater than 7.0% during the time between
November 16 of one year and March 15 of the following year
The stated setbacks to adjacent property boundaries and dr ainage ditches constructed for agricultural operations may be reduced by 50% for subsurface application (includes same day incorporation) unless state or federal regulations provide more stringent requirements. In cases where more than one bu ffer distance is involved, only the single most restrictive distance shall be used.
39
Section II. Soil Test Calibrations and Correlations
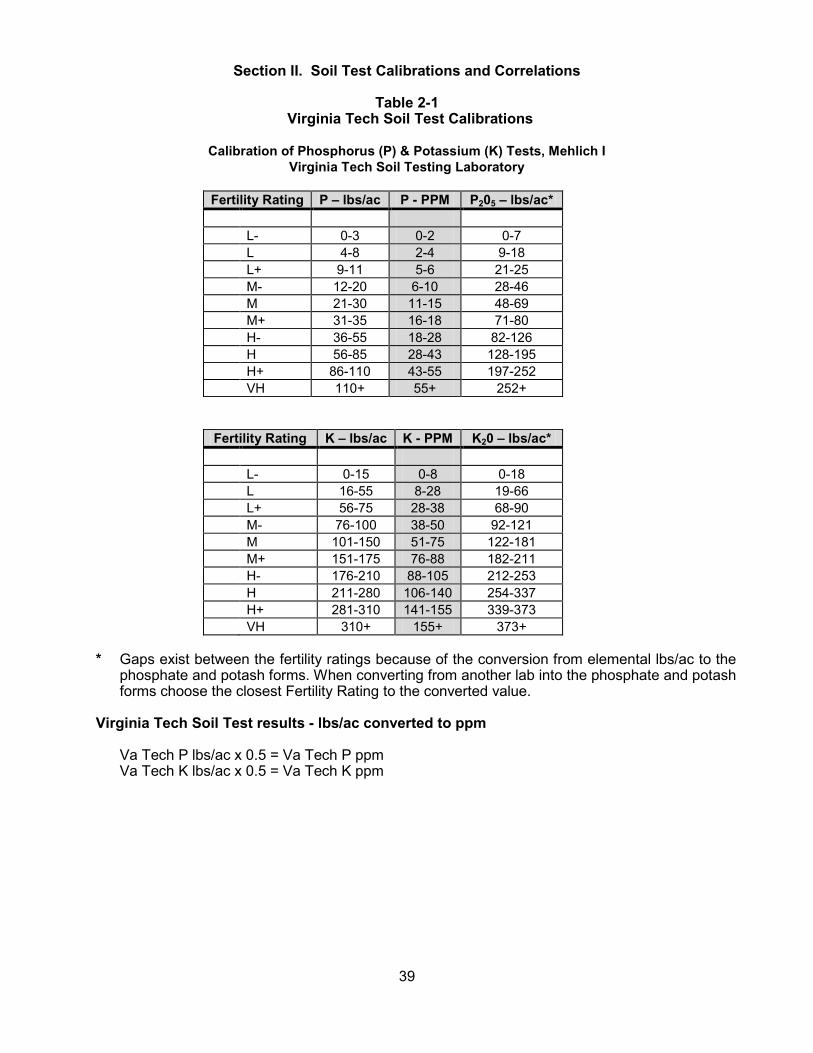
Table 2-1 Virginia Tech Soil Test Calibrations
Calibration of Phosphorus (P) & Potassium (K) Tests, Mehlich I
Virginia Tech Soil Testing Laboratory
Fertility Rating P – lbs/ac P - PPM P205 – lbs/ac*
L- 0-3 0-2 0-7 L 4-8 2-4 9-18 L+ 9-11 5-6 21-25 M- 12-20 6-10 28-46 M 21-30 11-15 48-69 M+ 31-35 16-18 71-80 H- 36-55 18-28 82-126 H 56-85 28-43 128-195 H+ 86-110 43-55 197-252 VH 110+ 55+ 252+
Fertility Rating K – lbs/ac K - PPM K20 – lbs/ac*
L- 0-15 0-8 0-18 L 16-55 8-28 19-66 L+ 56-75 28-38 68-90 M- 76-100 38-50 92-121 M 101-150 51-75 122-181 M+ 151-175 76-88 182-211 H- 176-210 88-105 212-253 H 211-280 106-140 254-337 H+ 281-310 141-155 339-373 VH 310+ 155+ 373+
* Gaps exist between the fertility ratings because of the conversion from elemental lbs/ac to the
phosphate and potash forms. When converting from another lab into the phosphate and potash forms choose the closest Fertility Rating to the converted value.
Virginia Tech Soil Test results - lbs/ac converted to ppm
Va Tech P lbs/ac x 0.5 = Va Tech P ppm Va Tech K lbs/ac x 0.5 = Va Tech K ppm

40
Correlation of Soil Analysis Results for Plan Writing in Virginia
Soil test results dated after 12/31/05 which are used to write nutrient management plans in Virginia shall use the Mehlich I procedure to determine the phosphorus soil level. Mehlich III to Mehlich I is the only acceptable correlation, using the following criteria. Approved soil test labs correlated to the Va Tech soil test lab using the Mehlich III procedure for phosphorus analysis are A & L Agricultural Laboratories, Brookside Laboratories, and Spectrum Analytical Laboratories. Waters Agricultural Laboratories uses the Mehlich I procedure therefore the phosphorus soil test results can be interpreted the same as Va Tech phosphorus soil test results.
41
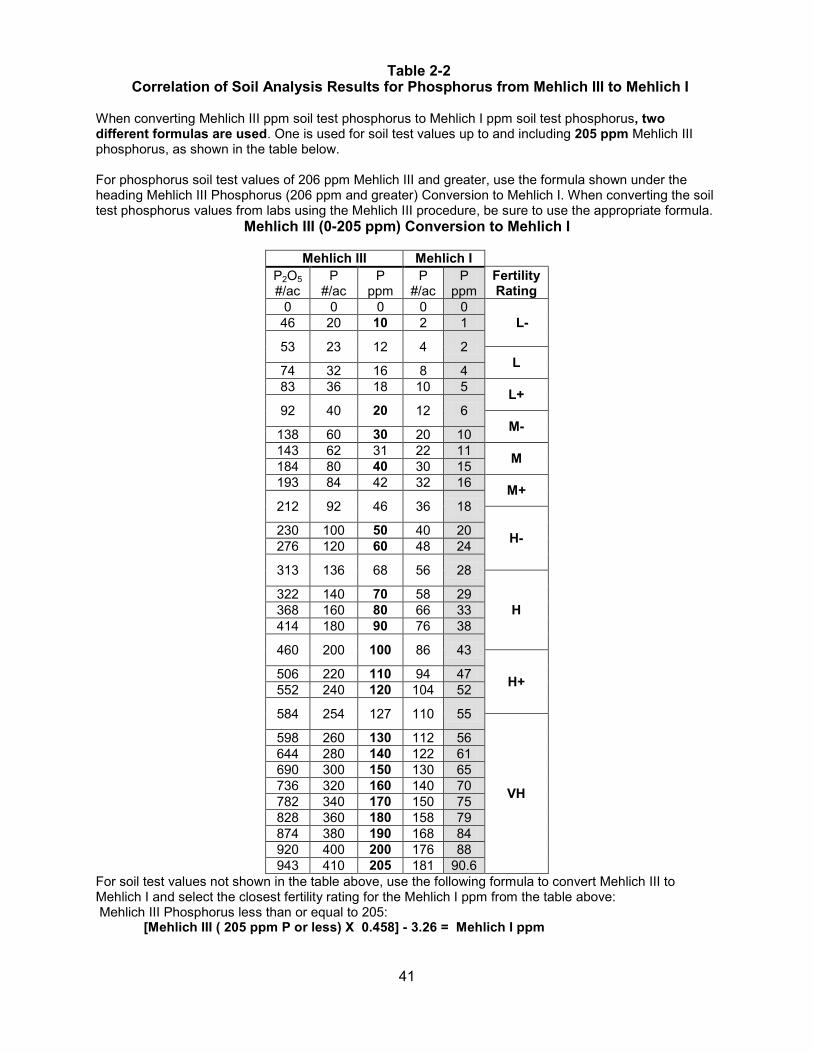
Table 2-2 Correlation of Soil Analysis Results for Phosphorus from Mehlich III to Mehlich I
When converting Mehlich III ppm soil test phosphorus to Mehlich I ppm soil test phosphorus, two different formulas are used. One is used for soil test values up to and including 205 ppm Mehlich III phosphorus, as shown in the table below. For phosphorus soil test values of 206 ppm Mehlich III and greater, use the formula shown under the heading Mehlich III Phosphorus (206 ppm and greater) Conversion to Mehlich I. When converting the soil test phosphorus values from labs using the Mehlich III procedure, be sure to use the appropriate formula.
Mehlich III (0-205 ppm) Conversion to Mehlich I
Mehlich III Mehlich I P2O5 #/ac
P #/ac
P ppm
P #/ac
P ppm
Fertility Rating
0 0 0 0 0 L- 46 20 10 2 1
53 23 12 4 2 L 74 32 16 8 4
83 36 18 10 5 L+ 92 40 20 12 6
M- 138 60 30 20 10 143 62 31 22 11 M 184 80 40 30 15 193 84 42 32 16 M+ 212 92 46 36 18
H- 230 100 50 40 20 276 120 60 48 24
313 136 68 56 28
H 322 140 70 58 29 368 160 80 66 33 414 180 90 76 38
460 200 100 86 43
H+ 506 220 110 94 47 552 240 120 104 52
584 254 127 110 55
VH
598 260 130 112 56 644 280 140 122 61 690 300 150 130 65 736 320 160 140 70 782 340 170 150 75 828 360 180 158 79 874 380 190 168 84 920 400 200 176 88 943 410 205 181 90.6
For soil test values not shown in the table above, use the following formula to convert Mehlich III to Mehlich I and select the closest fertility rating for the Mehlich I ppm from the table above: Mehlich III Phosphorus less than or equal to 205:
[Mehlich III ( 205 ppm P or less) X 0.458] - 3.26 = Mehlich I ppm

42
Mehlich III Phosphorus (206 ppm and greater) Conversion to Mehlich I
Mehlich III Phosphorus Soil Test Conversions to Mehlich III Phosphorus ppm P2O5 #/ac. (Mehlich III) X 0.22 = P ppm (Mehlich III) P #/ac. (Mehlich III) X 0.5 = P ppm ( Mehlich III) Conversion Formula for Mehlich III Phosphorus ppm to Mehlich I Phosphorus ppm To calculate the Mehlich I ppm, if not expressed on the soil test report, use the following formula. Mehlich I ppm phosphorus must be used when determining the Applied Fertilizer Dissolved Reactive Orthophosphate factor in a P-Index calculation.
[Mehlich III (206 ppm P or greater) X 0.945] - 103.5 = Mehlich I P ppm The table below shows a sample of soil test values converting Mehlich III to Mehlich I. The Mehlich I upper limit, above which no phosphorus shall be applied to a field, based on either the Threshold Method or the P - Index and the associated physiographic region are shown in bold.
Mehlich III Mehlich I P2O5 #/ac
P #/ac
P ppm
P #/ac P ppm Phosphorus Procedure/Physiographic Regions
948 412 206 182 91 1164 506 253 270 135 Threshold/ Eastern Shore & Lower Coastal Plain 1168 508 254 272 136 Threshold/Middle & Upper Coastal Plain & Piedmont 1293 562 281 324 162 Threshold/Ridge and Valley 1380 600 300 320 180 1610 700 350 454 227 1840 800 400 550 275 2070 900 450 644 322 2332 1014 507 750 375 P- Index/ Middle & Upper Coastal Plain & Piedmont 2737 1190 595 916 458 P-Index/ Eastern Shore & Lower Coastal Plain 3064 1332 666 1050 525 P-Index/ Ridge and Valley
Table 2-3 Correlation of Soil Analysis Results for Potassium from Mehlich III to Mehlich I
A & L Laboratories: A & L Potassium ppm X 0.71 = Va Tech - K ppm Brookside Laboratories: Brookside K lbs/acre X 0.36 = Va Tech - K ppm Spectrum Analytical Laboratories: Spectrum Available Potassium (K) lbs/acre X 0.31 = Va Tech - K ppm Waters Agricultural Laboratories: Waters Potassium (K) lbs/acre X 0.53 = Va Tech - K ppm
43
Section III. Lime Recommendations for Virginia Crops (Except Commercial Turf, Surface-
Mined Area Crops, Greenhouse, and Nursery Production) Optimum pH for Various Crops
Tobacco-The target pH 5.8 column shows recommendations applicable to mainly tobacco, where the lower pH is desired.
Most Agronomic Crops - Lime rates shown for target pH 6.2 column are recommendations that provide an adequate rate of agricultural limestone to adjust the pH to an acceptable range for most agronomic crops. Alfalfa - Lime rates shown for target pH 6.8 column are recommendations that provide an adequate rate of agricultural limestone to adjust the pH to an acceptable range for alfalfa.
Lime Stabilized Biosolids The target pH 6.5 column shall be used as one factor to determine maximum rates for lime stabilized biosolids applied within the Coastal Plain area. This table shows higher rates of lime stabilized biosolids, than would normally be applied to meet the lime need, to get more use out of the other nutrients contained in the biosolids. Exceeding the rates shown for target pH 6.5 may exceed the desirable pH range, and this may cause induced deficiencies of some nutrients while increasing availability of other nutrients to a toxic level for the crop being grown. The target pH 6.8 column shall be used as one factor to determine maximum rates for lime stabilized biosolids outside the Coastal Plain area of Virginia. This table shows higher rates of lime stabilized biosolids than would normally be applied to meet the lime need for most agronomic crops, to get more use out of the other nutrients contained in the biosolids. Exceeding the rates shown for target pH 6.8 may exceed the desirable pH range and this may cause induced deficiencies of some nutrients while increasing availability of other nutrients to a toxic level for the crop being grown. While these are higher than normal application of lime, application rates of biosolids can not exceed the nitrogen or phosphorus needs, which ever is less, as established in the nutrient management plan. Virginia Tech Soil analysis showing a Buffer pH test For Virginia Tech soil samples showing a soil pH and a buffer pH use the table designated as Lime Rates based on Va Tech Soil buffer pH. The Lime Recommendations for Virginia Crops table can only be used with soil test buffer pH readings from Virginia Tech soil test.
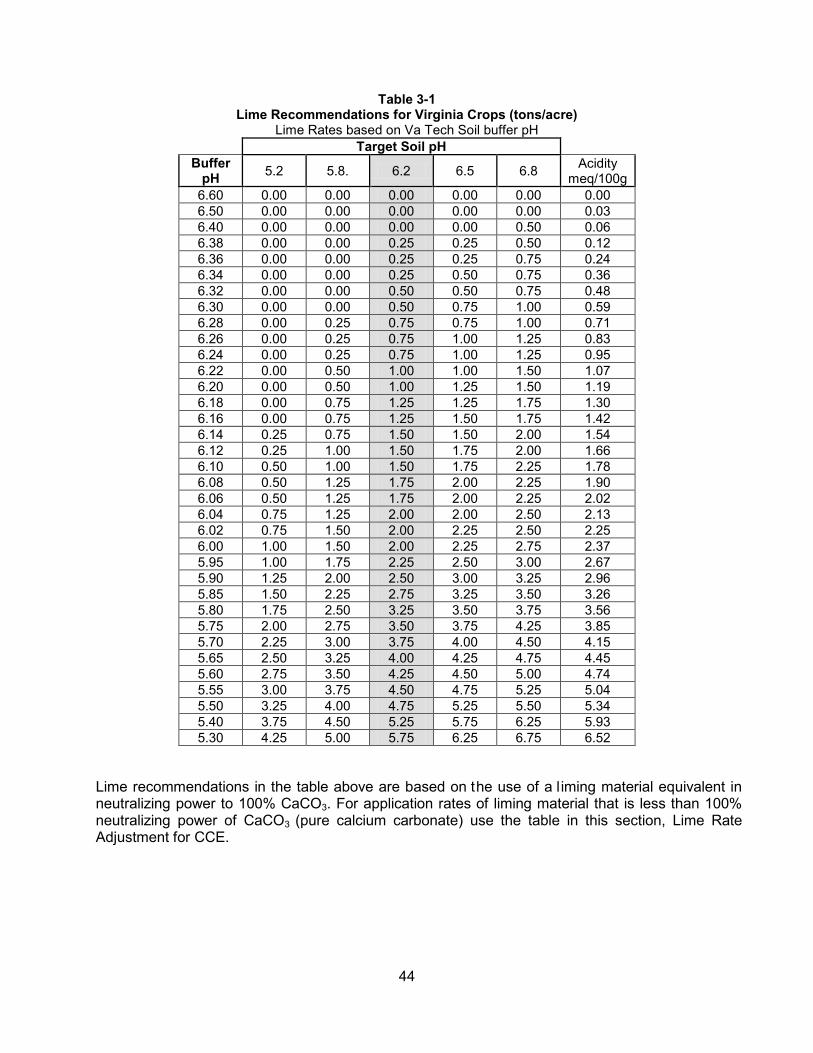
44
Table 3-1
Lime Recommendations for Virginia Crops (tons/acre) Lime Rates based on Va Tech Soil buffer pH
Target Soil pH Buffer
pH 5.2 5.8. 6.2 6.5 6.8 Acidity meq/100g
6.60 0.00 0.00 0.00 0.00 0.00 0.00 6.50 0.00 0.00 0.00 0.00 0.00 0.03 6.40 0.00 0.00 0.00 0.00 0.50 0.06 6.38 0.00 0.00 0.25 0.25 0.50 0.12 6.36 0.00 0.00 0.25 0.25 0.75 0.24 6.34 0.00 0.00 0.25 0.50 0.75 0.36 6.32 0.00 0.00 0.50 0.50 0.75 0.48 6.30 0.00 0.00 0.50 0.75 1.00 0.59 6.28 0.00 0.25 0.75 0.75 1.00 0.71 6.26 0.00 0.25 0.75 1.00 1.25 0.83 6.24 0.00 0.25 0.75 1.00 1.25 0.95 6.22 0.00 0.50 1.00 1.00 1.50 1.07 6.20 0.00 0.50 1.00 1.25 1.50 1.19 6.18 0.00 0.75 1.25 1.25 1.75 1.30 6.16 0.00 0.75 1.25 1.50 1.75 1.42 6.14 0.25 0.75 1.50 1.50 2.00 1.54 6.12 0.25 1.00 1.50 1.75 2.00 1.66 6.10 0.50 1.00 1.50 1.75 2.25 1.78 6.08 0.50 1.25 1.75 2.00 2.25 1.90 6.06 0.50 1.25 1.75 2.00 2.25 2.02 6.04 0.75 1.25 2.00 2.00 2.50 2.13 6.02 0.75 1.50 2.00 2.25 2.50 2.25 6.00 1.00 1.50 2.00 2.25 2.75 2.37 5.95 1.00 1.75 2.25 2.50 3.00 2.67 5.90 1.25 2.00 2.50 3.00 3.25 2.96 5.85 1.50 2.25 2.75 3.25 3.50 3.26 5.80 1.75 2.50 3.25 3.50 3.75 3.56 5.75 2.00 2.75 3.50 3.75 4.25 3.85 5.70 2.25 3.00 3.75 4.00 4.50 4.15 5.65 2.50 3.25 4.00 4.25 4.75 4.45 5.60 2.75 3.50 4.25 4.50 5.00 4.74 5.55 3.00 3.75 4.50 4.75 5.25 5.04 5.50 3.25 4.00 4.75 5.25 5.50 5.34 5.40 3.75 4.50 5.25 5.75 6.25 5.93 5.30 4.25 5.00 5.75 6.25 6.75 6.52
Lime recommendations in the table above are based on the use of a l iming material equivalent in neutralizing power to 100% CaCO3. For application rates of liming material that is less than 100% neutralizing power of CaCO3
(pure calcium carbonate) use the table in this section, Lime Rate Adjustment for CCE.

45
Lime Recommendations Using Other Testing Labs For approved labs other than Virginia Tech, use the lime recommendations given by the lab. IF there are no recommendations with the soil analysis, use the table below for A&L Agricultural, Spectrum Analytical, and Brookside Laboratories.
Table 3-2 Lime Application Rate1 (tons/acre) to achieve desired pH based on SMP Buffer Test
Soil- Buffer pH
Target Soil pH
5.2 5.8 6.2 6.5 6.8
6.9 0 0.25 0.50 0.50 0.75 6.8 0.50 0.75 1.00 1.00 1.25 6.7 1.00 1.50 1.50 1.75 2.00 6.6 1.50 1.75 2.00 2.25 2.50 6.5 2.00 2.25 2.50 3.00 3.25 6.4 2.75 3.00 3.25 3.75 4.00 6.3 3.25 3.50 4.00 4.50 5.00
1 Ag-ground lime of 90% plus total neutralizing power (TNP) or CaCO3 equivalent, and fineness of 40% < 100 mesh, 50% < 60 mesh, 70% < 20 mesh and 95% < 8 mesh. Adjustments in the application rate should be made for liming materials with different particle sizes, or neutralizing value. Waters Agricultural Laboratories uses the Adams and Evans single buffer method which uses a different table for recommendations than the Mehlich or the SMP tables supplied here. In the event you would have lab reports from Waters Lab, which do not have lime recommendations, contact the lab for recommendations based on their analysis procedure. Lime Rate Adjustment for CCE Using the lime application rate to achieve the desired target pH based on the soil test buffer pH, use the table below to adjust that rate based on the % CCE of the liming material to be applied.
Table 3-3 Lime Application Rate Adjustment Based on % CCE of Material
% CCE of Your Liming Material T/ac* 50 60 70 80 90 100 110 120 130 140 150 0.5 1.00 0.75 0.75 0.75 0.50 0.50 0.50 0.50 0.50 0.25 0.25 1.0 2.00 1.75 1.50 1.25 1.00 1.00 1.00 0.75 0.75 0.75 0.75 1.5 3.00 2.50 2.25 2.00 1.75 1.50 1.25 1.25 1.25 1.00 1.00 2.0 4.00 3.25 2.75 2.50 2.25 2.00 1.75 1.75 1.50 1.50 1.25 2.5 5.00 4.25 3.50 3.25 2.75 2.50 2.25 2.00 2.00 1.75 1.75 3.0 6.00 5.00 4.25 3.75 3.25 3.00 2.75 2.50 2.25 2.25 2.00 3.5 7.00 5.75 5.00 4.50 4.00 3.50 3.25 3.00 2.75 2.50 2.25 4.0 8.00 6.75 5.75 5.00 4.50 4.00 3.75 3.25 3.00 2.75 2.75 * Lime recommendation to adjust pH as determined from soil test analysis. Limestone Application Methods

46
Applications of 2 tons or less per acre - Adding this amount in a single application either before or after plowing will usually give best results. Limestone applied before plowing should be disked into the soil and t hen plowed. Limestone applied after plowing should be disked into the soil as thoroughly as possible. Applications of more than 2 tons per acre - For the best results, apply one-half of the limestone, disk into the soil, plow under and then apply the second-half and di sk into the soil. This method offers the best incorporation of limestone into the soil and is particularly important when the soil pH is very low and large amounts of limestone are needed. For no-till cropping systems - Where incorporation of limestone is not possible, single applications should be limited to no more than 2 tons per acre. Where more than 2 tons per acre are recommended (indicating very low pH), limestone should be incorporated as mentioned above for best results. If incorporation is not feasible, apply one-half the total amount one year and the other half the next year. Time of application - The best time to apply limestone is several months ahead of planting. This allows for more complete reaction of the limestone with the soil. However, if this cannot be done, apply it as early as possible, before the crop is planted. Failing to apply limestone because it could not be applied at the best time is worse than applying it late.

47
Section IV. Phosphorus Management
Phosphorus application rates shall be managed to minimize adverse water quality impacts consistent with procedures contained in this section. ♦ Phosphorus applications from inorganic nutrient sources shall not exceed crop nutrient
needs over the crop rotation based on a soil test. ♦ Phosphorus applications shall be i ndicated as zero in nutrient management plans for soils
exceeding 65% phosphorus saturation levels as listed in Table 4-1 regardless of the outcome of other procedures specified in this section.
Table 4-1
Virginia Tech Mehlich 1 Phosphorus (as ppm P) for 65% Phosphorus Saturation Level where Phosphorus Shall Not be Applied
(Must use approved conversion factors if results are from another lab)
Region Mehlich I Soil Test P (ppm)
Eastern Shore and Lower Coastal Plain >458 Middle and Upper Coastal Plain and Piedmont >375 Ridge and Valley >525
Note: All Soil Test P values in this table are shown as elemental phosphorus, expressed as a
Mehlich I Virginia soil test value. Section II. provides conversion formulas for approved labs which report results as Mehlich III.
♦ A single phosphorus application may be recommended to address multiple crops in the crop
rotation identified within the nutrient management plan if; (a) the single application does not exceed the sum of the appropriate application rates for individual crops as determined by this subsection.
For fields that do not exceed the maximum phosphorus saturation levels listed in Table 4-1, one of the following options must be used to determine maximum organic nutrient source phosphorus applications for fields contained in nutrient management plans. The Environmental Threshold and the Virginia Phosphorus Index Version 2.0 Technical Guide, Revised October 2005, are only applicable to organic nutrient sources. Additionally, plant available nitrogen in nutrient management plans shall not exceed the crop nutrient needs for any individual crop. Soil Test Method With this method phosphorus recommendations are made using: (1) the soil test level for the field and (2) recommendations for the crop as shown in Section V.

48
Alternative phosphorus application methods when the Soil Test Method cannot address management of organic nutrient sources. Environmental Threshold Method Table 4-2 can be used to determine allowable phosphorus applications rates for organic materials.
Table 4-2 Phosphorus Environmental Thresholds
Eastern Shore and Lower Coastal Plain
VPI&SU Soil Test (Mehlich I) P ppm Maximum Phosphorus Application Rate
<55 Nitrogen cannot exceed N needs; Phosphorus applications should be managed to reduce adverse water quality impacts.
55 - 135 Nitrogen cannot exceed N needs; Phosphorus applications shall not exceed crop removal.**
>135 Nitrogen cannot exceed N needs; no Phosphorus shall be applied during the life of the plan.
Middle and Upper Coastal Plain and Piedmont VPI&SU Soil Test (Mehlich I) P ppm Maximum Phosphorus Application Rate
<55 Nitrogen cannot exceed N needs; Phosphorus applications should be managed to reduce adverse water quality impacts.
55- 136 Nitrogen cannot exceed N needs; Phosphorus applications shall not exceed crop removal.**
>136 Nitrogen cannot exceed N needs; no Phosphorus shall be applied during the life of the plan.
Ridge and Valley VPI&SU Soil Test (Mehlich I) P ppm Maximum Phosphorus Application Rate
<55 Nitrogen cannot exceed N needs; Phosphorus applications should be managed to reduce adverse water quality impacts.
55 - 162 Nitrogen cannot exceed N needs; Phosphorus applications shall not exceed crop removal**
>162 Nitrogen cannot exceed N needs; no Phosphorus shall be applied during the life of the plan
** Phosphorus crop removal may be calculated as an application to meet each crop need or a single
application per rotation to meet the total removal of all the crop needs for that rotation within the valid life of the nutrient management plan. The Virginia Nutrient Management Planning P2O5 Removal Table for Grain and Forage Crops, Table 4-7, must be used to calculate the crop removal of phosphorus in this method.
Notes explaining criteria associated with the Environmental Threshold Method continued on next page.

49
Phosphorus Environmental Threshold (notes continued) An index to counties and cities by region can be found in the Virginia Phosphorus Index Version 2.0 Technical Guide, Revised October 2005. Other laboratories’ results shall only be us ed if conversion factors are published in Virginia Nutrient Management Standards and C riteria, Revised July 2014 and the appropriate conversion factor is utilized. The Virginia Nutrient Management Planning P2O5 Removal Table for Grain and Forage Crops, Table 4-7, must be used to calculate the crop removal of phosphorus in this method.
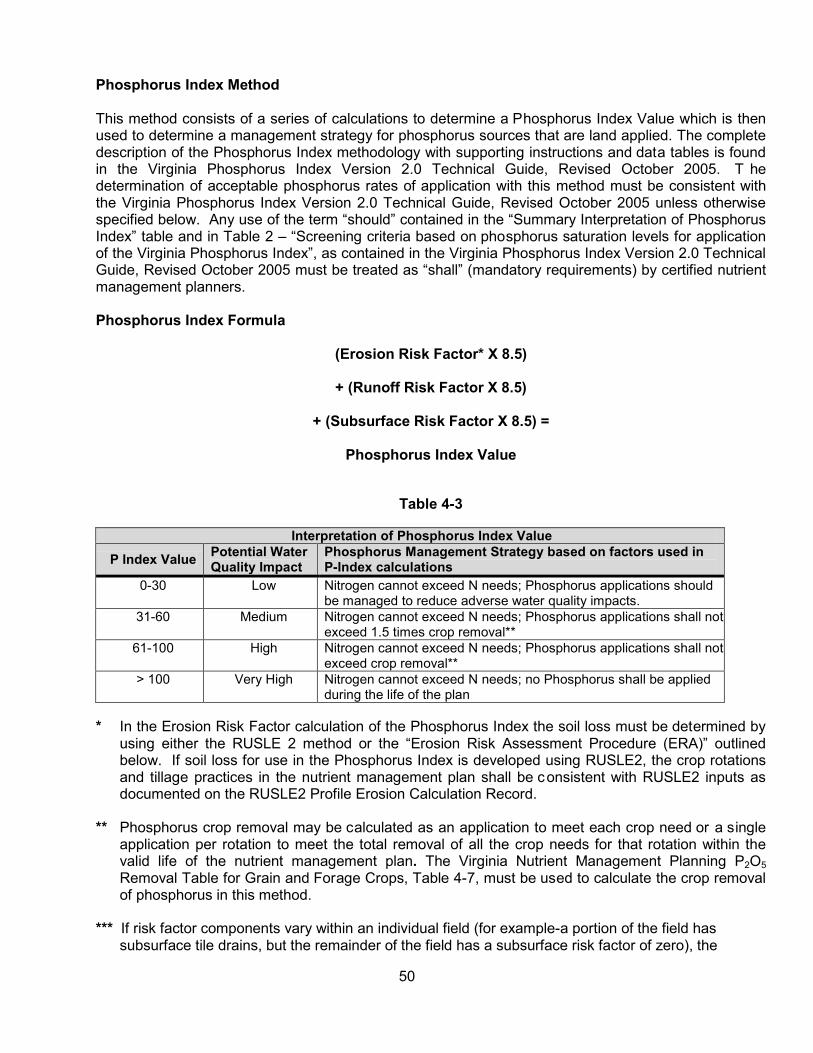
50
Phosphorus Index Method This method consists of a series of calculations to determine a Phosphorus Index Value which is then used to determine a management strategy for phosphorus sources that are land applied. The complete description of the Phosphorus Index methodology with supporting instructions and data tables is found in the Virginia Phosphorus Index Version 2.0 Technical Guide, Revised October 2005. T he determination of acceptable phosphorus rates of application with this method must be consistent with the Virginia Phosphorus Index Version 2.0 Technical Guide, Revised October 2005 unless otherwise specified below. Any use of the term “should” contained in the “Summary Interpretation of Phosphorus Index” table and in Table 2 – “Screening criteria based on phosphorus saturation levels for application of the Virginia Phosphorus Index”, as contained in the Virginia Phosphorus Index Version 2.0 Technical Guide, Revised October 2005 must be treated as “shall” (mandatory requirements) by certified nutrient management planners. Phosphorus Index Formula
(Erosion Risk Factor* X 8.5)
+ (Runoff Risk Factor X 8.5)
+ (Subsurface Risk Factor X 8.5) =
Phosphorus Index Value
Table 4-3
Interpretation of Phosphorus Index Value
P Index Value Potential Water Quality Impact
Phosphorus Management Strategy based on factors used in P-Index calculations
0-30 Low Nitrogen cannot exceed N needs; Phosphorus applications should be managed to reduce adverse water quality impacts.
31-60 Medium Nitrogen cannot exceed N needs; Phosphorus applications shall not exceed 1.5 times crop removal**
61-100 High Nitrogen cannot exceed N needs; Phosphorus applications shall not exceed crop removal**
> 100 Very High Nitrogen cannot exceed N needs; no Phosphorus shall be applied during the life of the plan
* In the Erosion Risk Factor calculation of the Phosphorus Index the soil loss must be determined by
using either the RUSLE 2 method or the “Erosion Risk Assessment Procedure (ERA)” outlined below. If soil loss for use in the Phosphorus Index is developed using RUSLE2, the crop rotations and tillage practices in the nutrient management plan shall be consistent with RUSLE2 inputs as documented on the RUSLE2 Profile Erosion Calculation Record.
** Phosphorus crop removal may be calculated as an application to meet each crop need or a single
application per rotation to meet the total removal of all the crop needs for that rotation within the valid life of the nutrient management plan. The Virginia Nutrient Management Planning P2O5 Removal Table for Grain and Forage Crops, Table 4-7, must be used to calculate the crop removal of phosphorus in this method.
*** If risk factor components vary within an individual field (for example-a portion of the field has
subsurface tile drains, but the remainder of the field has a subsurface risk factor of zero), the
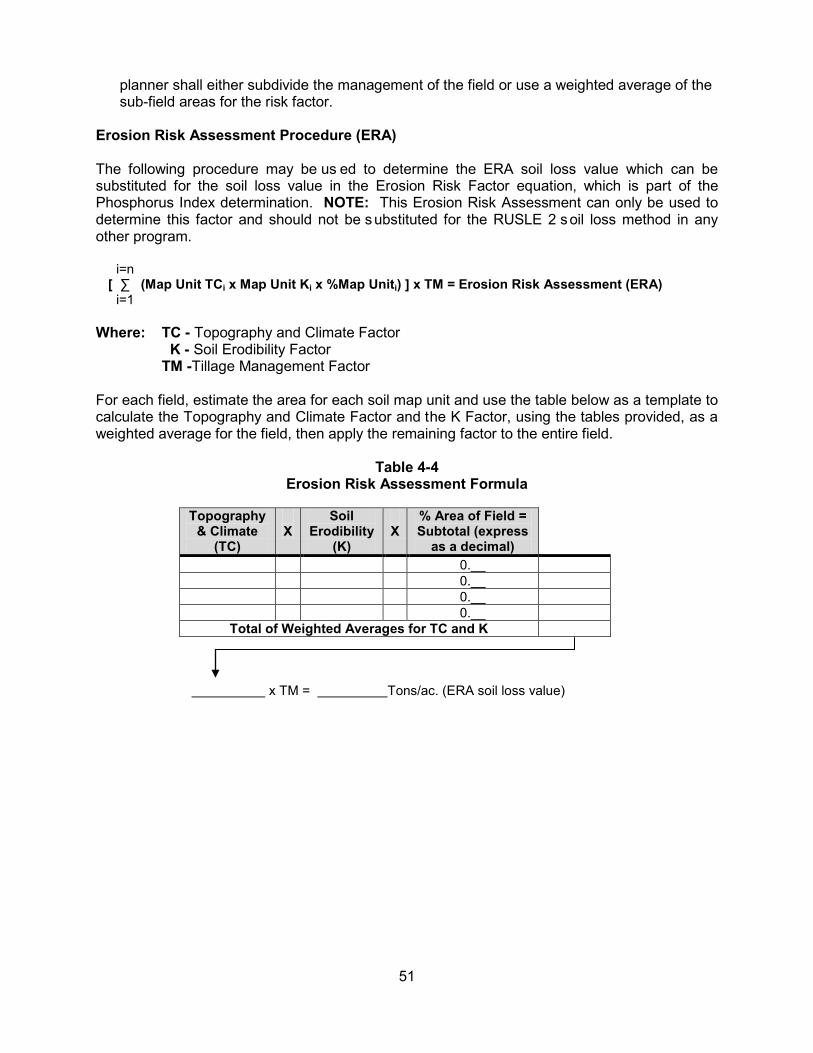
51
planner shall either subdivide the management of the field or use a weighted average of the sub-field areas for the risk factor.
Erosion Risk Assessment Procedure (ERA) The following procedure may be us ed to determine the ERA soil loss value which can be substituted for the soil loss value in the Erosion Risk Factor equation, which is part of the Phosphorus Index determination. NOTE: This Erosion Risk Assessment can only be used to determine this factor and should not be substituted for the RUSLE 2 soil loss method in any other program. i=n [ ∑ (Map Unit TCi x Map Unit Ki x %Map Uniti) ] x TM = Erosion Risk Assessment (ERA) i=1 Where: TC - Topography and Climate Factor K - Soil Erodibility Factor TM -Tillage Management Factor
For each field, estimate the area for each soil map unit and use the table below as a template to calculate the Topography and Climate Factor and the K Factor, using the tables provided, as a weighted average for the field, then apply the remaining factor to the entire field.
Table 4-4
Erosion Risk Assessment Formula
Topography & Climate
(TC)
X
Soil Erodibility
(K)
X
% Area of Field = Subtotal (express
as a decimal) 0.__ 0.__ 0.__ 0.__
Total of Weighted Averages for TC and K x TM = Tons/ac. (ERA soil loss value)

52
ERA-TC Factors These factors represent a combination of the Topography and Climate factors for the areas of Virginia listed below designated by map unit slope.
Table 4-5 Topography and Climate Factors
Coastal Plain (East of I-95)
Soil Survey Map
Unit Slope Hay/Pasture
TC Crop TC
A .40 .44 B 1.24 1.41 C 2.48 2.78 D 4.35 4.92 E 7.80 8.57 F 11.58 10.87
Northern Piedmont (North of James River-West of I-95)
Soil Survey Map
Unit Slope Hay/Pasture
TC Crop TC
A .29 .33 B .96 1.17 C 2.40 2.67 D 4.63 5.17 E 7.17 7.20 F 11.33 11.07
Southern Piedmont (South of James River-West of I-95)
Soil Survey Map
Unit Slope Hay/Pasture
TC Crop TC
A .33 .37 B 1.08 1.32 C 2.69 3.00 D 5.20 5.80 E 8.05 8.09 F 12.72 12.43
Mountain and Valley
Soil Survey Map
Unit Slope Hay/Pasture
TC Crop TC
A .26 .28 B .85 .97 C 2.19 2.40 D 4.35 4.59 E 7.99 8.42 F 11.20 11.25

53
K Factor This factor represents the soil erodibility factor based on soil texture and designated by county and map unit symbol. The K factor for specific soils can be found in the USDA-NRCS electronic Field Office Technical Guide. ERA - TM Factors This factor represents the Tillage Management designated by crop or crop rotation being grown.
Table 4-6
Tillage Management
Annual Crop Rotation Tilled Mixed * No-till Corn Silage - Continuous 30 - 15 Corn Silage / Small Grain Silage 22 19 16 Corn Silage / Small Grain 18 9 7 Corn Grain - Continuous 12 - 3 Corn Grain / Small Grain 6 5 1 Corn Grain / Small Grain Silage 13 7 6 Small Grain / DC Soybeans 10 6 4 Soybeans – Full Season 17 - 8 Peanuts 19 - - Peanuts / Small Grain 11 8 3 Cotton 20 - 12 Cotton / Small Grain 11 8 3 Tobacco 46 - - Tobacco / Small Grain 30 25 18 Vegetables 35 - 16 Vegetables / Small Grain 20 16 8 Other Row Crops (Grain) 17 - 8 Other Summer Annuals with Small Grain
13 8 7
Other Summer Annuals with Small Grain Silage
22 19 16
Hay – Legume (maintenance) - - 2 Hay – Grass or Mixed (maintenance)
- - 1
Pasture < 50% cover or heavily grazed
- - 4
Pasture 50-75% cover not heavily grazed
- - 2
Pasture >75% cover and lightly grazed
- - 1
Hay or Pasture Establishment** 11 - 3 *Mixed = double crop with one crop tilled and one crop no-till **Fall Establishment-use previous crop sequence TM Factor or Establishment Factor – whichever is greater. For Spring Establishment use number shown.
♦ The TM factor is determined by the rotation and the tillage types, regardless of the beginning
season of the plan. (Notes continued on next page)

54
♦ Add the TM factor for each year of the rotation, not to exceed a three year plan life, and divide by the number of years to determine the TM factor to be used for that field during the life of the plan.
♦ If the crop rotation is not included in the table above, RUSLE 2 must be used to determine the soil loss for that rotation.
♦ If tillage or crop rotation is changed, the TM must be re-calculated and the P-Index must be re-calculated.
♦ Corn Grain assumes all stalks remain on field after harvest. ♦ Small Grain = cover crop or grain harvest only, no straw removal. If straw is removed use silage
TM Factor

55
Table 4-7 Virginia Nutrient Management Planning P2O5 Removal Table for Grain
and Forage Crops
Use the following table to determine the pounds of P2O5 removed per unit of harvest. See Note 1 for yield moisture criteria.
CROP YIELD UNIT LBS P2O5 PER YIELD UNIT GRAINS
Barley (cover crop) NA 0
Barley bushels 0.40
Barley straw (per bushel grain) bushels 0.11
Barley-soybean dbl crop bushels **
Buckwheat bushels 0.36
Canola bushels 1.3
Corn bushels 0.38
Oat (cover crop) NA 0
Oat bushels 0.33
Oat straw (per bushel grain) bushels 0.09
Proso millet bushels 0.39
Rye (cover crop) NA 0
Rye bushels 0.45
Rye straw (per bushel grain) bushels 0.17
Sorghum bushels 0.4
Soybean bushels 0.89
Sunflower tons 27
Triticale (cover crop) NA 0
Triticale bushels 0.39
Wheat (cover crop) NA 0
Wheat bushels 0.51
Wheat straw (per bushel grain) bushels 0.11
CROP YIELD UNIT LBS P2O5 PER YIELD UNIT
SILAGE
Barley silage tons 5.1
Corn silage tons 4.2
Grass silage tons 5.7
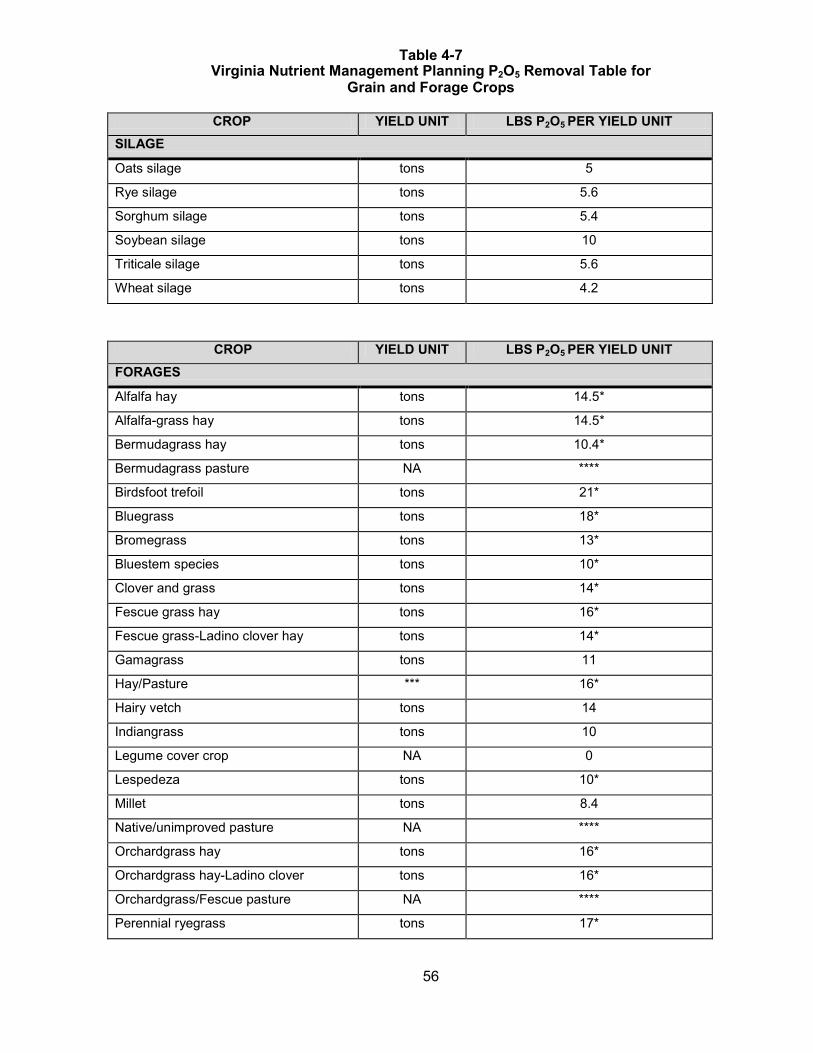
Table 4-7 Virginia Nutrient Management Planning P2O5 Removal Table for
Grain and Forage Crops
56
CROP YIELD UNIT LBS P2O5 PER YIELD UNIT
SILAGE
Oats silage tons 5
Rye silage tons 5.6
Sorghum silage tons 5.4
Soybean silage tons 10
Triticale silage tons 5.6
Wheat silage tons 4.2
CROP YIELD UNIT LBS P2O5 PER YIELD UNIT FORAGES
Alfalfa hay tons 14.5*
Alfalfa-grass hay tons 14.5*
Bermudagrass hay tons 10.4*
Bermudagrass pasture NA ****
Birdsfoot trefoil tons 21*
Bluegrass tons 18*
Bromegrass tons 13*
Bluestem species tons 10*
Clover and grass tons 14*
Fescue grass hay tons 16*
Fescue grass-Ladino clover hay tons 14*
Gamagrass tons 11
Hay/Pasture *** 16*
Hairy vetch tons 14
Indiangrass tons 10
Legume cover crop NA 0
Lespedeza tons 10*
Millet tons 8.4
Native/unimproved pasture NA ****
Orchardgrass hay tons 16*
Orchardgrass hay-Ladino clover tons 16*
Orchardgrass/Fescue pasture NA ****
Perennial ryegrass tons 17*

Table 4-7 Virginia Nutrient Management Planning P2O5 Removal Table for
Grain and Forage Crops
57
CROP YIELD UNIT LBS P2O5 PER YIELD UNIT FORAGES
Red clover tons 10*
Red clover-grass hay tons 14*
Reed canarygrass tons 12*
Small grain hay tons 10
Sorghum tons 8.4
Sorghum x sudangrass (Sudax)
tons 10
Sorghum-sudan, millet, sudan (hay) tons 10
Soybean and sorghum tons 9.2
Soybean hay tons 10
Soybean and millet tons 9.2
Soybean and Sudangrass tons 10
Switchgrass tons 10*
Sudangrass tons 10
Tall fescue hay tons 16*
Timothy tons 14*
Weeping lovegrass tons 10*
CROP YIELD UNIT LBS P2O5 PER YIELD UNIT
SEED CROPS
Crimson clover seed pounds 0.018
Lespedeza seed pounds 0.016
Red clover seed pounds 0.016
White clover seed pounds 0.030
CROP YIELD UNIT LBS P2O5 PER YIELD UNIT
VEGETABLES
Asparagus cwt 0.13
Beet (root) cwt 0.092
Beet (top) cwt 0.12
Broccoli cwt 0.18
Brussels sprout cwt 0.29
Cabbage tons 1.8

Table 4-7 Virginia Nutrient Management Planning P2O5 Removal Table for
Grain and Forage Crops
58
CROP YIELD UNIT LBS P2O5 PER YIELD UNIT
VEGETABLES
Carrot cwt 0.092
Cauliflower cwt 0.14
Celery cwt 0.083
Chive cwt 0.12
Collard cwt 0.13
Cucumber tons 1.1
Eggplant cwt 0.050
Endive cwt 0.051
Escarole cwt 0.032
Garlic cwt 0.39
Kale cwt 0.13
Leek cwt 0.080
Lettuce (head) cwt 0.79
Lettuce (leaf) cwt 0.10
Lima bean cwt 0.34
Mustard green cwt 0.10
Okra cwt 0.15
Onion (dry) cwt 0.60
Onion (green) cwt 0.084
Parsley cwt 0.092
Parsnip cwt 0.16
Pea cwt 0.57
Pepper cwt 0.066
Potato cwt 0.14
Pumpkin tons 1.7
Radish cwt 0.064
Rutabaga cwt 0.092
Snap bean cwt 0.23
Spinach cwt 0.15
Squash (summer) cwt 0.064
Squash (winter) cwt 0.079
Sweet corn cwt 0.14
Sweet potato cwt 0.12

Table 4-7 Virginia Nutrient Management Planning P2O5 Removal Table for
Grain and Forage Crops
59
CROP YIELD UNIT LBS P2O5 PER YIELD UNIT
VEGETABLES
Tomato tons 2.0
Turnip (root) cwt 0.065
Turnip (green) cwt 0.14
CROP YIELD UNIT LBS P2O5 PER YIELD UNIT
FRUITS
Apple bushels 0.020
Grape tons 2.0
Honeydew melon tons 1.3
Muskmelon tons 3.5
Peach bushels 0.033
Watermelon tons 0.47
Strawberry cwt 0.043
CROP YIELD UNIT LBS P2O5 PER YIELD UNIT MISCELLANEOUS
Cotton (seed & lint) tons 26
Cotton (stalk, leaf & bur) tons 10
Tobacco (leaf & stalk - based on harvest leaf weight)
lb leaves .009
Peanuts pounds .007
NOTES: 1.Yields are based on the following moisture levels: grain-corn-15.5%, wheat-13.5%, barley-14%, oats-14%, grain sorghum-13%, soybeans-14.5%; all silage-65%; all hay-15%. For all other crops, yield should be based on moisture at which, no deduction would be accessed when sold, crop can be safely stored without any additional drying, or in the case of fresh market vegetables crop has reached marketable stage of growth.
* Use 1/2 of the yield from VALUES if planted in the spring, 0 if planted in the fall, to calculate crop
removal for the establishment year. ** For double crops, add removal for each crop *** Use 2/3 hay yield from VALUES or use the actual yield from field records, to calculate crop
removal. **** 30 lbs P2O5 Removal for Productivity Group I 30 lbs P2O5 Removal for Productivity Group II 25 lbs P2O5 Removal for Productivity Group III 20 lbs P2O5 Removal for Productivity Group IV

60
Section V. Crop Nutrient Needs
Phosphorus and potash soil test levels in this table are based on Mehlich I soil test results. Only soil test levels correlated to Mehlich I using methods contained in this document are acceptable. Corn Grain Nutrient Needs*
Productivity Group N - Nutrient Needs
IA 180 IB 170 IIA 160 IIB 150 IIIA 140 IIIB 130 IVA 120 IVB 100 V 80
*See nitrogen management recommendations for Corn.
Soil Productivity Groups I , II
Soil Test Level Nutrient Needs (lbs/ac) P2O5 K2O L 100-140 100-140 M 60-100 60-100 H 20-60 20-60 VH 0 0
Soil Productivity Groups III, IV, V
Soil Test Level Nutrient Needs (lbs/ac)
P2O5 K2O L 80 -120 80 -120 M 40 - 80 40 - 80 H 20 - 40 20 - 40 VH 0 0
Corn Silage Nutrient Needs*
Productivity Group N - Nutrient Needs (a)
IA 200 IB 185 IIA 175 IIB 165 IIIA 155 IIIB 145 IVA 130 IVB 110 V 90
*See nitrogen management recommendations for Corn.

61
Corn Silage Nutrient Needs (cont) Soil Productivity Groups I , II
Soil Test Level Nutrient Needs (lbs/ac)
P2O5 K2O L 140-200 240-300 M 100-140 180-240 H 40-100 100-180 VH 0 0
Soil Productivity Groups III , VI, V
Soil Test Level Nutrient Needs (lbs/ac)
P2O5 K2O L 120-160 200-240 M 80-120 140-200 H 40-80 60-140 VH 0 0
When using documented farmer records, corn silage yield may be calculated using the following formula: Corn Grain Yield (bu/ac) X 0.0985 + 7.6964 = Corn Silage Yield Tons/acre. Nitrogen Management Recommendations for Corn On soils with a High nitrogen loss risk, at least 50% of the inorganic nitrogen applications shall be applied as a sidedress application. On Moderate and Low nitrogen loss risk soils this management method is preferred, but not required. The combination of row starter, at planting nitrogen applications and sidedress applications cannot exceed the nitrogen need listed for that crop in that field. It is recommended that fields which contain high environmental risk soils for nitrogen loss where organic nutrient sources are used to meet most of the nitrogen need for corn should include a split application of nitrogen which is at least 33% of the nitrogen needs to be applied as a sidedress application. If no pre-plant nitrogen will be broadcast and planting conditions exist where the cold soil temperatures may be limiting mineralization of nitrogen, starter nitrogen may aid in plant establishment and ear ly season growth. The combination of row starter, at planting nitrogen applications, plant available nitrogen supplied from organic sources, and sidedress applications cannot exceed the nitrogen need listed for that crop in that field. For cereal silage/corn silage rotations only, 20 lbs/acre of nitrogen may be applied as part of a banded starter application at planting, in addition to the nitrogen need designated for the field. IF no starter is applied as a banded appl ication, only the nitrogen need des ignated for the field shall be recommended. To determine nitrogen needs for corn yields above those listed in Table 1-2, Estimated Yields in Bushels or Tons per Acre of Various Non-Irrigated Crops for Identified Soil Productivity Groups, use 1 lb of nitrogen per bushel for grain yields, and 1.1 lbs of nitrogen per bushel of grain yield for silage corn tonnage converted back to bushels using the formula: (corn silage tons/acre - 7.6964 ) = Corn grain yield 0.0985

62
Irrigated Corn These expected yields and nitrogen recommendations in the table below should not be used for fields where manure is applied through an irrigation system unless supplemental clean water irrigation is utilized, since manure applications should usually occur prior to the times of peak moisture demand by crops to allow time for mineralization. Irrigated nitrogen recommendations shall only be used when the water source can supply at least 6 inches of water to the entire field per growing season.
Corn Grain production using Center Pivot Irrigation *
Soil Management Groups Expected Corn
Yield, Bu/Ac
N - Nutrient Needs A,B,D 210 210
C,E,F,G,J,K,L,M,N,O,Q,R,S,T 200 200 I,DD 190 190
V,W,X 180 180 AA,BB,II 170 170
Y 160 160 KK 140 140
Soil Test Level Nutrient Needs (lbs/ac)
P2O5 K2O L 130 - 170 130 - 170 M 80 - 120 80 - 120 H 30 - 70 30 - 70 VH 0 0
*An adjustment to irrigated grain yields is needed for traveling gun systems, because typically yield response will be highly variable depending upon management of the system. A reasonable estimate of planning yield is 90% of the above estimates for properly scheduled irrigation. Corn Silage Production using Traveling Gun Irrigation
Soil Management Groups
Expected Corn Yield, Tons/Ac
N - Nutrient Needs
A,B,D 26.3 210 C,E,F,G,J,K,L,M,N,O,Q,R,S,T 25.4 200
I,DD 24.5 190 V,W,X 23.6 180
AA,BB,II 22.7 170 Y 21.9 160
KK 20.1 140
Soil Test Level Nutrient Needs (lbs/ac) P2O5 K2O L 140-200 240-300 M 100-140 180-240 H 40-100 100-180 VH 0 0
63
Notes for all irrigated corn silage and corn grain fields: Irrigation of soils in the following soil management groups is not recommended; factors other than water-holding capacity may be the yield limiting factor; H, P, U, Z, CC, EE, FF, GG, HH, LL, MM, NN, OO, PP, QQ. Use dryland yields in Table 1-2. Nitrogen use efficiency by irrigated corn can be increased by splitting the total sidedress rate of nitrogen into two applications, with the second of the two applications occurring just before the corn is too tall to drive through with the application equipment. If this second application is applied through the irrigation system, it should be applied about 7-10 days before silking, or split into smaller multiple applications.
Pre-Sidedress Soil Nitrate Test (PSNT)
Sample collection essentials for PSNT for corn: Select fields where organic sources of nitrogen have been applied, according to the timing criteria listed in the Virginia Nutrient Management Training and Certification Regulations under Nutrient Application Timing, to supply nitrogen to the present corn crop Sample collection - At least 10-20 cores per field, 12 inches deep, between rows to avoid starter bands and areas where roots have not depleted nitrogen. Sample time - corn should be 10” to 15” tall at the whorl as it stands, NOT to the tallest part of the plant. Only one of the following options can be used to determine sidedress rate adjustment in any one season, based on the criteria outlined for each option.

64
Option 1 - Adjustment of Nitrogen Sidedress Recommendations Nitrogen needs and timing of applications for corn shall be calculated based on criteria outlined in Section VAC 5-15-150.A.2.e. of the Virginia Nutrient Management Training and Certification Regulations. When organic nutrient sources have been used to supply a significant portion of the nitrogen need i n present or past years and a nitrogen sidedress application rate has been recommended, the PSNT results and the guidance below shall be used to adjust the sidedress rate when applicable. This guidance should be used as one factor along with rate of organic material applied, field history, seasonal conditions, and an understanding of the effects of soil properties and management practices related to nitrogen availability to corn. All these factors need to be considered to adjust the sidedress nitrogen rate stated in the nutrient management plan to improve the economics of crop production and to enhance water quality.
Nitrate-N Conc. N Rate Recommendation < 11 ppm Apply full rate of sidedress N that is specified for the field in
the nutrient management plan. 11-20 ppm Apply 50 - 75% of sidedress N that is specified for the field in
the nutrient management plan. The decision to reduce the recommended nitrogen rate must be made on a site-by site basis and s hould take into account previous field history, organic N additions, and management practices.
> 20 ppm Nitrate nitrogen at a level to meet the yield goal without any sidedress nitrogen needed.
Option 2 - Adjustment of Nitrogen Sidedress Recommendations Considering suspected high nitrogen leaching loss or low mineralization of organic nitrogen sources(s). If: (a) extreme weather conditions occur, such as two or more rainfall events exceeding 2 inches since the nitrogen application, which have caused significant amounts of nitrogen to be l eached below the root zone, or (b) mineralization of organic nitrogen sources are much lower than expected, a one t ime corrective nitrogen sidedress application can be m ade consistent with the following table if: a) nitrogen applications have been made such that rate and timing of applications have been consistent with the criteria in 4VAC 5-15-150, b) and corn shows visual signs of nitrogen deficiency, c) and a PSNT indicates NO3-N is below 20 ppm in the top 12” of the soil profile.
Nitrate-N Conc. N Rate Recommendation < 6 ppm Apply planned sidedress N that is specified for the field OR
70% of the nitrogen needs shown in the nutrient management plan for that field, whichever is greater.
6 - 11 ppm Apply planned sidedress N that is specified for the field OR 40% of the nitrogen needs shown in the nutrient management plan for that field, which ever is greater.
12 - 20 ppm Apply 50 - 75% of sidedress N that is specified for the field OR 30% of the nitrogen needs shown in the nutrient management plan for that field.
> 20 ppm Nitrate nitrogen at a level to meet the yield goal without any sidedress nitrogen needed.
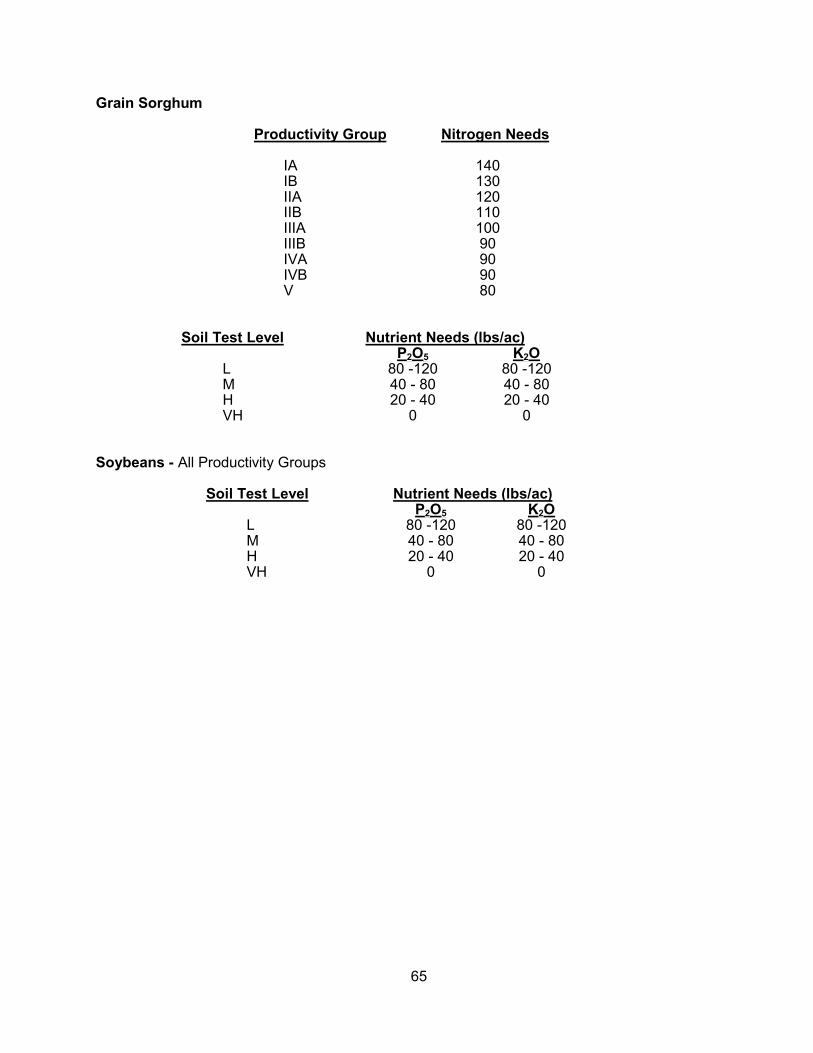
65
Grain Sorghum
Productivity Group Nitrogen Needs
IA 140 IB 130 IIA 120 IIB 110 IIIA 100 IIIB 90 IVA 90 IVB 90 V 80
Soil Test Level Nutrient Needs (lbs/ac) P2O5 K2O
L 80 -120 80 -120 M 40 - 80 40 - 80 H 20 - 40 20 - 40 VH 0 0
Soybeans - All Productivity Groups
Soil Test Level Nutrient Needs (lbs/ac)
P2O5 K2O L 80 -120 80 -120 M 40 - 80 40 - 80 H 20 - 40 20 - 40 VH 0 0

66
Small Grain Management Options: Choose nutrient needs based on the intended use of the crop by the farmer. 1. Small Grain Silage - this crop is planted for the intended purpose of harvest in early
spring for silage. Similar fall tiller management practices should be applied as used in Standard/Intensive Management of Wheat and Barley.
2. Wheat and B arley- Standard/Intensive Grain Production- this crop is to be m anaged
based on a program to maximize grain yield by planting within the window of acceptable dates according to location within the state, careful tiller management through the fall and winter months and s pring split application rates of nitrogen based on tiller counts and tissue tests.
3. Cover Crop - this crop is grown for the purpose of scavenging any residual nitrogen from
the previous crop due to lower than expected yield, or mineralization of organic nutrient materials applied to the previous crop is expected to occur after the crop is harvested. Cover crop may also be used to manage on farm manure storage facilities by application of low rates of manure in the fall and winter when needed.
4. Trap Crop - the sole purpose of this crop is to provide fields which can receive manure,
biosolids, or other organic nutrient source applications through the fall and winter months for management of limited storage facilities of these materials.
This is a less desirable option because the nitrogen need for the following spring crop, or some part of the nitrogen need, may be used to determine rate of nitrogen for the winter application. IF the intention is to base the application rate of nitrogen on the total nitrogen need of the following spring crop, then application shall be in compliance with Timing of Organic Nutrient Sources in Section I.A and at least 30 pounds of nitrogen need must be withheld at the time of application to be used as part of a banded starter at planting. Also, all phosphorus applied though this application will be credited to the Spring crop or to the phosphorus application of the rotation.
The only purpose of the trap crop is for the management of organic nutrient sources where
limited or no s torage facilities are available. Fall or winter application of a ni trogen rate based on a s pring crop, commits the farmer to planting that crop in a t imely manner to assure successful establishment of the intended spring crop.
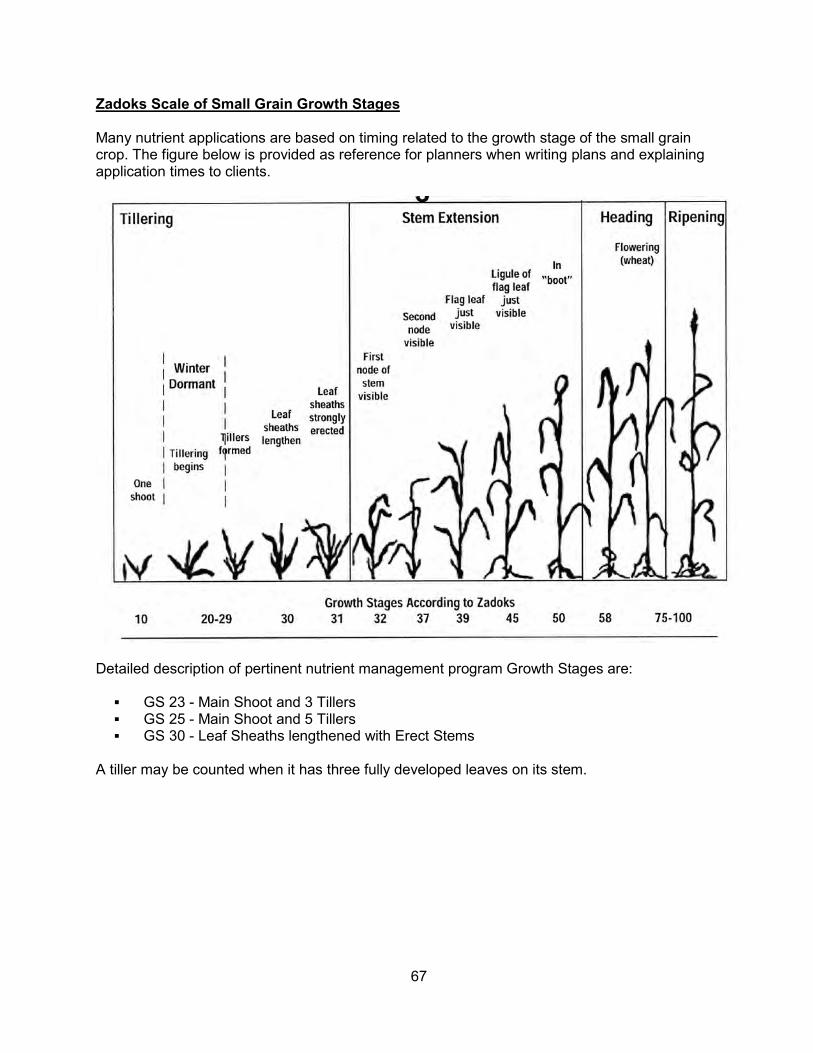
67
Zadoks Scale of Small Grain Growth Stages Many nutrient applications are based on timing related to the growth stage of the small grain crop. The figure below is provided as reference for planners when writing plans and explaining application times to clients.
Detailed description of pertinent nutrient management program Growth Stages are: GS 23 - Main Shoot and 3 Tillers GS 25 - Main Shoot and 5 Tillers GS 30 - Leaf Sheaths lengthened with Erect Stems
A tiller may be counted when it has three fully developed leaves on its stem.

68
Nutrient Recommendations by Small Grain Program
Cover Crop
Crop should be planted early enough in the fall to be q uickly established after the harvested crop. The main purpose of the Cover Crop is to scavenge residual nitrogen from the previous crop. However, fields designated to be pl anted to a c over crop may also be us ed to spread manure at low rates (less than 40 pounds of nitrogen) through the fall and winter to properly manage on farm storage manure facilities, to assure adequate storage capacity is available until the spring applications can begin.
1. Eligible Fields:
a. Acceptable small grains are barley, wheat, rye, triticale b. Seeding of all seed types must be established by the dates indicated in the table
below.
Region Established Date Cites of Chesapeake & VA Beach November 30 Coastal Plain November 15 Piedmont November 1 Mountain and Valley October 25
2. Fall - Winter Nitrogen Rates
Nitrogen rates will be calculated using Spring or early Fall applied coefficients for manures and Year of Application coefficient for biosolids to calculate the PAN for the organic fraction and appropriate coefficient for PAN ammonium fraction for all materials.
Nitrogen rate for application to manage on farm manure storage facilities:
Nutrient Needs (lbs/ac) Nitrogen P2O5 K2O
0-40 0 0 All phosphorus applied though this application will be credited to the spring crop or the phosphorus application of the rotation.

69
3. Late Winter - Early Spring Nitrogen Rates
a. Cover crop will be killed before Spring crop is planted - No Nitrogen applied
OR
If at any time the management of this crop is changed from the original cover crop status, then the following nitrogen management recommendations shall be us ed. Performance and final yield of this crop may not be comparable to proper management of the specific crop outlined in other parts of this booklet. NOTE: This change in management of the cover crop will affect eligibility for state and/or federal cost-share payments.
a. Cover crop will be harvested for silage:
Triticale - Maximum of 70 lbs/ac.
Rye - Maximum of 70 lbs/ac. Wheat - Maximum of 60 lbs/ac.
Barley - Maximum of 50 lbs/ac.
OR
b. Cover crop will be harvested for grain - Follow recommendations in table below. Warning - Using maximum N rates listed in table below may cause lodging of crop when a high rate of Nitrogen was applied in the Fall.
(Feb. - Early March) Tiller Count: N Application Program
Single Application:
<70/sq. ft.
80 lbs/acre-Feb.(Growth Stage 25)
>100; plants dark green; tissue N levels >3.75%
30-40 lbs/acre-late March (Zadoks Growth Stage 30)
Split Application:
February (Zadoks Growth Stage 25)
<60/sq. ft.
60 lbs N/acre
60-100/sq. ft.
40 lbs N/acre
>100/sq. ft. and dark green color
none; tissue test at growth stage 30
March (growth stage 30 tissue test)
No more than 120 lbs N/acre; the total of Growth Stages 25 and 30
70
Trap Crop
Nutrient Needs (lbs/ac)* Nitrogen P2O5 K2O
0 0 0 *Specific to the Trap Crop itself.
The purpose of the following recommendations are to provide fields which can receive manure, biosolids and other organic nutrient source applications through the fall and winter months if the priority is for management of limited storage facilities, rather than achieving expected yield of future crops. Applications shall not occur before the trap crop reaches Zadoks growth stage 23 (one main shoot and 3 tillers) or greater AND having a uniform stand throughout the entire area to be spread of at least 20 plants per square foot. Application rate shall not exceed the nutrient needs described below and shall not smother the crop. Application shall only occur when the spreading equipment and associated operations will cause minimal damage to the crop during application.
Nitrogen rate for application based on Spring Crop nitrogen needs: Nitrogen needs of spring crop to be planted minus at least 30 pounds of nitrogen to be applied as a banded application at planting. Nitrogen rates will be calculated using Spring or Early Fall Applied coefficients for manures and Year of Application coefficient for biosolids to calculate the PAN for the organic fraction and appropriate coefficient for PAN ammonium fraction for all materials. No more nitrogen shall be applied to the trap crop or the following spring crop using this option, with the exception of the amount of nitrogen deducted from the nitrogen needs at the time of application. This remaining nitrogen shall be applied as a banded application at planting of the spring crop. It should be noted that this program of nitrogen application may result in a lack of adequate nitrogen available to the spring crop to produce the expected yield. Less than adequate nitrogen would be due to immobilization of nitrogen by the trap crop and loss of the applied nitrogen through runoff and leaching. All phosphorus applied though this application will be credited to the spring crop or the phosphorus application of the rotation.
71
Rye Grown for Grain 1. Soil productivity groups are the same as for wheat and barley 2. Nitrogen recommendations: a. At planting - 25-30 lbs N/acre b. Late winter - a single application made in February (1) For grain production - 45 lbs N/acre
Soil Test Level Nutrient Needs (lbs/ac) P2O5 K2O
L 80 -120 80 -120 M 40 - 80 40 - 80 H 20 - 40 20 - 40 VH 0 0
Small Grain for Silage 1. Soil productivity groups are the same as for wheat and barley 2. Nitrogen recommendations: a. At planting - 0-30 lbs N/acre - use lower rate on fields, which will be timely planted, with a history of frequent
manure applications, and good growing conditions are expected 10 days after planting.
b. Late winter - a single application made in February (1) Triticale, Rye, Wheat silage production - 40-90 lbs N/acre (2) Barley, Oats silage production - 40-70 lbs N/acre
(a) Preferred application period would be after green-up occurs and before first joint has emerged.
(b) Use lower rates on field which are well established, have dark green color, and a history of lodging.
Soil Test Level Nutrient Needs (lbs/ac) P2O5 K2O
L 80 -120 80 -120 M 40 - 80 40 - 80 H 20 - 40 20 - 40 VH 0 0

72
Wheat and Barley for Grain - Nitrogen Management Applications Standard/Intensive 1. At planting:
a. With NO3- soil test from top 6 inches measuring above 30 ppm, no nitrogen needed at
planting. b. If soil test is below 30 ppm, apply 15-30 pounds of nitrogen. c. Without NO3
- soil test results:
(1) Conventional tillage: broadcast and i ncorporate 1-2 inches, 25-30 lbs N/acre during land preparation for planting. R educe N application if high residual N levels are expected.
(2) No-till: broadcast 30-40 lbs N/acre shortly before planting, if heavy residue (60%
or greater cover) is present. Follow N recommendations for conventional planting if light residue (less than 60% cover) or no residue is present.
Intensive Management Only 2. Midwinter (December-January)
If: a. Significant leaching rains have occurred during the October-December period, i.e.,
two or more rainfall events of 2.0 inches or more, and b. there has been very little tiller development, i.e., less than 3 tillers per plant, and the
crop has a pale green color, and c. there is an expectation of several days during January and February when maximum
daily temperature will exceed 500F; apply: 30 lbs N/acre as a topdress.
Figure 5-1

73
Management of Spring Nitrogen
3. Late Winter (February-early March)
a. Single Spring application of N, (Standard management):
(1) Fields with less than 70 tillers per sq.ft., apply 80 lbs/acre in February. Fertilize those fields with less than 60 tillers per sq.ft. first.
OR
(2) Fields with 70 to 100 tillers per sq.ft., and plants are pale green and tissue test
levels are lower than 3.75%, apply: 60 lbs/acre in February.
OR (3)Fields have 70 to 100 tillers per sq.ft., plants are dark green and N tissue test
levels are 3.75% or higher, apply: 30-40 lbs/acre in late March (Zadoks growth stage 30.)
OR
(4) Fields have more than 100 tillers per sq.ft., plants are dark green and tissue
test levels are 3.75% or higher apply: 30-40 lbs/acre in late March (Zadoks growth stage 30.)
b. Split applications of Spring N (Intensive small grain management): (1) February (Zadoks growth stage 25.)
(a) Fields with less than 60 tillers per sq. ft. - apply 60 lbs N/acre.
OR
(b) Fields with 60 to 100 tillers per sq. ft. - apply 40 lb N/acre.
OR
(c) Fields with more than 100 tillers per sq. ft. and the crop has a good green color - do not apply nitrogen at this time. Tissue test at Zadoks growth stage 30 to determine N application needs.
Use Figure 5-2 for more detailed nitrogen application rates based on exact tiller counts.

74
Figure 5-2
To determine the rate for the growth stage 25 application, one needs to determine the number of tillers per square foot in the field. If there are less than 60 per square foot, apply 60 pounds per acre at growth stage 25. If there are between 60 and 100 tillers, determine the rate from Figure 5-2. If there are more than 100 tillers per square foot and the crop has a dark green color, do not apply any nitrogen at this time.
(Spring N management continued on next page)

75
(2) March (Zadoks growth stage 30).
(a) N application rate for wheat based on the % N in a plant tissue sample taken at Zadoks growth stage 30 using Fig. 5-3. NOTE: Observations have shown that barley topdress rate should be decreased by 0.5% N.
Figure 5-3
76
Nitrogen Application Recommendations for Wheat and Barley (Summary)
Season Application Criteria N Application Program I. Planting
Nitrate Soil Test
>30 ppm (top 6 inches) None <30 ppm (top 6 inches) Apply 15-30 lbs/ac. N None Conventional Tillage-broadcast
& incorporate to 1-2 inches, 25-30 lbs/ac N; No-Till-broadcast 25-30 lb N/acre
II. Midwinter (Dec.-January)
Precipitation 2 or more rainfalls >2.0 inches AND
Tiller Development <3 tillers per plant; pale green AND
Max. Daily Temp. >500F THEN: Apply 30 lbs N/acre topdressed
III. Late Winter
(Feb. - Early March)
Tiller Count:
Single Application: <70/sq. ft. 80 lbs/ac. N-Feb.(Growth Stage 25)
>100; plants dark green; tissue N levels >3.75%
30-40 lbs/ac. N- late March (Zadoks Growth Stage 30)
Split Application: February (Zadoks Growth Stage 25)
<60/sq. ft. 60 lbs ac.N 60-100/sq. ft. 40 lbs/ac. N >100/sq. ft. and dark green color
none; tissue test at growth stage 30
March (growth stage 30 tissue test)
Refer to Figure 5-3 for N rates based on tissue test
No more than 120 lbs N/acre - total of Growth Stages 25 and 30
Phosphorus and Potassium Nutrient Needs (Standard/Intensive Small Grain Management)
Soil Test Level Nutrient Needs (lbs/ac) P2O5 K2O
L 80 – 120 80 – 120 M 40 – 80 40 – 80 H 20 – 40 20 – 40 VH 0 0

77
Canola Nitrogen Fertilization: 1. Apply 30 - 40 lbs/ac. N at planting time. Broadcast and disc-in before planting. 2. Apply 90 - 120 lbs/ac. N in late February just before spring growth begins. For soils which
are a H igh environmental risk for nitrogen loss, the late winter application should be split with the first 45 to 60 lbs/ac being applied in late February and the second 45 to 60 lbs/ac being applied 4 weeks later.
Soil Test Level Nutrient Needs (lbs/ac) P2O5 K2O
L 80 -120 80 -120 M 40 - 80 40 - 80 H 20 - 40 20 - 40 VH 0 0
Peanuts Phosphorus and Potassium Nutrient Needs: The phosphorus and potassium nutrient needs for peanuts can be applied at the same time the crop preceding peanuts in the rotation is fertilized. If not applied at that time, it should be plowed down before peanuts are planted.
Soil Test Level Nutrient Needs (lbs/ac) P2O5 K2O
L 100-200 80 -120 M 55 – 85 0 H 0 - 40* 0 VH 0 0
*Apply 40 lbs/ac at H-. No P205 recommended at H and H+.
Apply ½ pound of elemental boron per acre per year at early bloom stage in a compatible labeled pesticide spray or dust or as a separate foliar application. (Va. Tech Soil Test Note 4).

78
Cotton Nitrogen Needs: The planned rate of total nitrogen application should take into consideration the crop that cotton will be following and the soil on which it will be grown. The following suggestions consider both:
Soil Management Groups on Which Cotton Will Be Grown
Total N Application
Lbs/Acre
I. A, AA, B, C, E, J, K 50-60 II. F, Q, R, S, T, DD, II 60-90
III. N, O, V, X 50-70 IV. Soil Management Groups that are not suited for cotton production: P , Z,
BB, CC, EE, FF, HH, JJ, KK, LL, MM, NN, OO, PP, QQ.* V. Soil Management Groups on which cotton will not be grown: D, G, H, I, J, L,
M, U, W, Y, GG. * "Soils in this field are not suited for cotton production. If at all possible, select
another field, but if cotton will be grown, apply 50-70 lbs of N per acre."
Reduce the planned rate of nitrogen application by 10 pounds per acre if cotton will be following soybeans and by 20 pounds per acre if it will follow peanuts.

79
Timing of Nitrogen Application on Cotton
Only about 20 per cent of the total nitrogen uptake will have occurred by early square formation (approximately 45 days after planting). To avoid possible stimulation of excessive vegetative growth and loss of unneeded nitrogen through leaching, apply only one third of the planned nitrogen application rate at planting. The most effective method of application of this nitrogen is in a starter fertilizer which would also supply 20 to 40 pounds of P2O5 depending upon P2O5 needs as shown by a soil test. This can be done by using either a 1:1:0 ratio fertilizer such as 15-15-0, a 1:2:0 ratio fertilizer such as 18-46-0 or a 1:3:0 fertilizer such as 10-34-0. Use of a starter fertilizer has been shown to stimulate the early growth rate and increase lint cotton yields by 60 to 100 pounds per acre, both of which are desirable. The preferred placement of this starter fertilizer is two inches to one side of the seed and at least as deep as the seeds are planted but preferably one to two inches below seed level. P lacing the starter fertilizer in the row behind the subsoiler shank while ripping under the row has also been shown to be an effective placement. However, applying the starter fertilizer in a 3 to 4 inch wide band on the soil surface in front of the press wheel has not proven to be an e ffective placement method in research conducted in North Carolina. The remainder of the planned nitrogen application can be applied at first square formation (approximately 45 days after planting).
Soil Test Level Nutrient Needs (lbs/ac) P2O5 K2O
L 80 – 120 80 -120 M 40 – 80 40 - 80 H 20 – 40 20 - 40 VH 0 0
Apply ½ pound of elemental boron per acre per year in a compatible labeled pesticide spray or dust or as a separate foliar application. (Va. Tech Soil Test Note 4).

80
White Potatoes - All Soil Productivity Groups
Soil Test Level Nutrient Needs (lbs/ac)
N P2O5 K2O L 125-150* 200 300 M 125-150* 150 200 H 125-150* 100 100 VH 125-150* 30** 50
* Nitrogen recommendation for yields up to 250 cwt/acre. Split apply nitrogen with 1/3 of the
rate applied at planting and remaining 2/3 to be applied 1-2 weeks after emergence. ** For phosphorus soil test levels exceeding 65% saturation as shown in Table 4-1,Section IV,
or if the Phosphorus Index rating is greater than 100, no phosphorus application shall be made to the field, including starter.
When documented yields for the field (average of the high 3 yields in the last 5 years) indicate an expected yield of greater than 250 cwt/acre use .6 (six-tenths) X the expected tuber yield (cwt/ac) to determine the nitrogen recommendation. At this higher nitrogen recommendation, use a three way split as follows, 1/6 -1/3 of the total recommendation at planting, 1/2 to 2/3 of the total recommendation at emergence, and 1/6 of the total recommendation at flowering. The combination of nitrogen applications applied before flowering shall not exceed 5/6 of the total nitrogen need when using this program. For more efficient nitrogen management application at flowering, apply the remaining nitrogen from the 3-way nitrogen split, or use the figure below showing petiole sap concentrations at flowering to adjust nitrogen application rate.
Figure 5-4 White Potato Petiole Sap Nitrate Concentration before Flowering Note: At greater than 1500 ppm, response to additional nitrogen is unlikely.

81
Sudangrass, Sudan-Sorghum Hybrids and Millet Plantings
Soil Test Level Nutrient Needs (lbs/ac) N P2O5 K2O
L 70* 100-120 100-120 M 70* 70-90 70-90 H 70* 40-60 40-60 VH 70* 0 0
* The N recommendation is for application at planting. If additional pasture, hay, silage production
is desired, apply 40-60 lbs/A N after each cutting, or 30-40 lbs/ac. N after each grazing. Do not apply more than 130 lbs/A N per year.
Alfalfa and Alfalfa-Orchardgrass Establishment
Soil Test Level Nutrient Needs (lbs/ac) P2O5 K2O
L 150-170 150-170 M 120-140 120-140 H 50-110 50-110 VH 0 0
Alfalfa and Alfalfa-Grass Hay Maintenance, Soil Productivity Group I
Soil Test Level Nutrient Needs (lbs/ac)
P2O5 K2O L 100-120 390-450* M 70-90 300-360* H 40-60 40-210* VH 0 0
* For K2O rates greater than 200 lbs/ac, split the application, applying 1/2 in the fall and 1/2 in the
spring. (Alternate recommendation where field sampled in spring - apply 1/2 in early spring, and 1/2 after the first cutting).
Apply 2 to 4 pounds of elemental boron per acre per year with a broadcast fertilizer.(Va. Tech
Soil Test Note 4).
Alfalfa and Alfalfa-Grass Hay Maintenance, Soil Productivity Group II
Soil Test Level Nutrient Needs (lbs/ac) P2O5 K2O
L 100-120 280-330* M 70-90 220-270* H 40-60 60-200 VH 0 0
* For K2O rates greater than 200 lbs/acre, split the application, applying 1/2 in the fall and
1/2 in the spring. (Alternate recommendation where field sampled in spring - apply 1/2 in early spring, and 1/2 after the first cutting).
Apply 2 to 4 pounds of elemental boron per acre per year with a broadcast fertilizer.(Va. Tech
Soil Test Note 4).
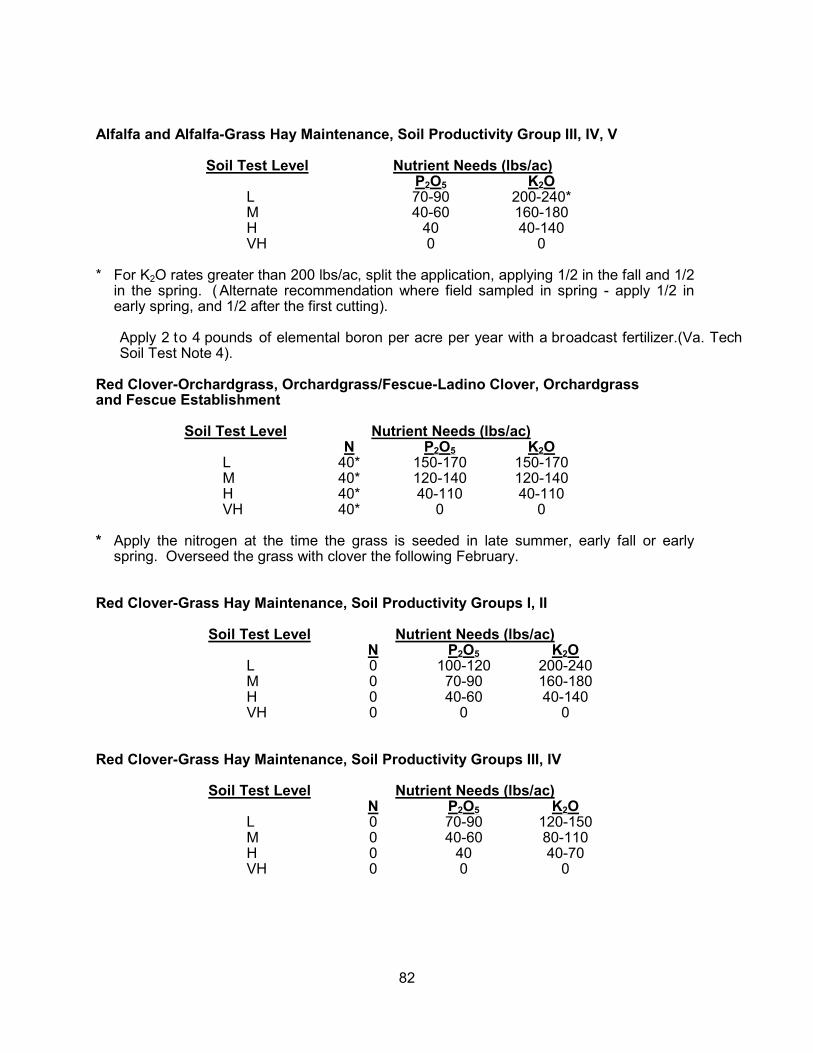
82
Alfalfa and Alfalfa-Grass Hay Maintenance, Soil Productivity Group III, IV, V
Soil Test Level Nutrient Needs (lbs/ac)
P2O5 K2O L 70-90 200-240* M 40-60 160-180 H 40 40-140 VH 0 0
* For K2O rates greater than 200 lbs/ac, split the application, applying 1/2 in the fall and 1/2
in the spring. ( Alternate recommendation where field sampled in spring - apply 1/2 in early spring, and 1/2 after the first cutting).
Apply 2 to 4 pounds of elemental boron per acre per year with a broadcast fertilizer.(Va. Tech
Soil Test Note 4). Red Clover-Orchardgrass, Orchardgrass/Fescue-Ladino Clover, Orchardgrass and Fescue Establishment
Soil Test Level Nutrient Needs (lbs/ac) N P2O5 K2O
L 40* 150-170 150-170 M 40* 120-140 120-140 H 40* 40-110 40-110 VH 40* 0 0
* Apply the nitrogen at the time the grass is seeded in late summer, early fall or early
spring. Overseed the grass with clover the following February. Red Clover-Grass Hay Maintenance, Soil Productivity Groups I, II
Soil Test Level Nutrient Needs (lbs/ac)
N P2O5 K2O L 0 100-120 200-240 M 0 70-90 160-180 H 0 40-60 40-140 VH 0 0 0
Red Clover-Grass Hay Maintenance, Soil Productivity Groups III, IV
Soil Test Level Nutrient Needs (lbs/ac) N P2O5 K2O
L 0 70-90 120-150 M 0 40-60 80-110 H 0 40 40-70 VH 0 0 0

83
Stockpiled Tall Fescue, Soil Productivity Groups I, II
Soil Test Level Nutrient Needs (lbs/ac) N P2O5 K2O
L 60-100* 100-120 100-120 M 60-100* 40-90 40-90 H 60-100* 0 0 VH 60-100* 0 0
* Remove animals by early August and apply the N between August 1-15. Keep animals
off pasture until November to allow stand to mature. Where clover makes up more than 25% of the stand, use the 60 l bs/ac. N rate. I f clover is not present and you desire maximum production, apply the 100 lbs/ac. N rate.
Stockpiled Tall Fescue, Soil Productivity Groups III, IV, V
Soil Test Level Nutrient Needs (lbs/ac)
N P2O5 K2O L 50-80* 40-60 60-80 M 50-80* 30 30-50 H 50-80* 0 0 VH 50-80* 0 0
* Remove animals by early August and apply the N between August 1-15. Keep animals
off pasture until November to allow stand to mature. Where clover makes up more than 25% of the stand, use the 50 l bs/ac. N rate. I f clover is not present and you desire maximum production, apply the 80 lbs/ac. N rate.
Orchardgrass/Fescue-Clover Pastures, Soil Productivity Groups I, II
Soil Test Level Nutrient Needs (lbs/ac) N P2O5 K2O
L 0* 100-120 100-120 M 0* 40-90 40-90 H 0* 0 0 VH 0* 0 0
* If stand contains less than 25% clover, apply 50-80 lbs/ac. of N.
If additional production is needed later on, apply 40 to 60 lbs/ac. of N in late summer.
If you are planning to overseed a legume into the stand, do not apply any N.
If organic nutrient sources are utilized, up t o 120 l bs/ac. of N may be appl ied if the application is no m ore frequent than once every 2 years. When applying organic nutrient sources pasture should be maintained at no less than three inches in height in order to reduce runoff and assure adequate regrowth of crop.

84
Orchardgrass/Fescue-Clover Pastures, Soil Productivity Groups III, IV, V
Soil Test Level Nutrient Needs (lbs/ac)
N P2O5 K2O L 0* 40-60 60-80 M 0* 30 30-50 H 0* 0 0 VH 0* 0 0
* If stand contains less than 25% clover, apply 40-60 lbs/ac. of N.
If additional production is needed later on, apply 40 to 60 lbs/ac. of N in late summer.
If you are planning to overseed a legume into the stand, do not apply any N.
If organic nutrient sources are utilized, up to 100 lbs of N may be applied if the application is no more frequent than once every 2 years When applying organic nutrient sources, pasture should be maintained at no less than three inches in height in order to reduce runoff and assure adequate regrowth of crop.
Native or Unimproved Pastures, Soil Productivity Groups I, II
Soil Test Level Nutrient Needs (lbs/ac)
N P2O5 K2O L 0* 150-200 150-200 M 0* 75-125 75-125 H 0* 0 0 VH 0* 0 0
* If stand contains less than 25% clover, apply 40-60 lbs/ac. of N.
For phosphorus and potassium - apply once every three or four years.
If you are planning to overseed a legume into the stand, omit the N application. When applying organic nutrient sources, pasture should be maintained at no less than three inches in height in order to reduce runoff and assure adequate regrowth of crop.

85
Native or Unimproved Pastures, Soil Productivity Groups III, IV
Soil Test Level Nutrient Needs (lbs/ac)
N P2O5 K2O L 0* 100-120 100-120 M 0* 40-90 40-90 H 0* 0 0 VH 0* 0 0
* If stand contains less than 25% clover, apply 40-60 lbs/ac. N.
When applying organic nutrient sources, pasture should be maintained at no less than three inches in height in order to reduce runoff and assure adequate regrowth of crop.
For phosphorus and potassium - apply once every three or four years.
Orchardgrass/Fescue (Tall Grass) Hay Production, Soil Productivity Groups I, II
Soil Test Level Nutrient Needs (lbs/ac) N P2O5 K2O
L 80-100* 100-120 200-240 M 80-100* 70-90 160-180 H 80-100* 40-60 40-140 VH 80-100* 0 0
* The N recommendation is for a March application of commercial fertilizer.
If additional hay production is needed, apply 80 lbs/ac N after each cutting during the growing season. Use the number of cuttings to determine total nitrogen rate with a maximum annual rate not to exceed 250 lbs/acre per year.
Organic nutrient sources may be applied in one or more applications, not to exceed 250 lbs/acre plant available nitrogen annually. If applied after 9/1 of any year until 3/1 of the following year, application rates during this period shall not exceed ½ of the total nitrogen rate (125 lbs/acre). When applying organic nutrient sources, fields should be m aintained at no l ess than three inches in height in order to reduce runoff and assure adequate regrowth of crop.

86
Orchardgrass/Fescue (Tall Grass) Hay Production, Soil Productivity Groups III, IV
Soil Test Level Nutrient Needs (lbs/ac)
N P2O5 K2O L 60-80* 70-90 120-150 M 60-80* 40-60 80-110 H 60-80* 40 40-70 VH 60-80* 0 0
* N recommendation is for a March application of commercial fertilizer.
For additional fall hay production apply 60-80 lbs N/acre in late August/early September. Do not apply more than 160 lbs N/acre/year. Organic nutrient sources may be applied in one or more applications, not to exceed 160 lbs/acre plant available nitrogen annually. If applied after 9/1 of any year until 3/1 of the following year, application rates during this period shall not exceed ½ of the total nitrogen rate (80 lbs/acre). When applying organic nutrient sources, fields should be maintained at no less than three inches in height in order to reduce runoff and assure adequate regrowth of crop.
Bermudagrass Establishment
Soil Test Level Nutrient Needs (lbs/ac)
N P2O5 K2O L 70 100-120 100-120 M 70 70-90 70-90 H 70 40-60 40-60 VH 70 0 0
Bermudagrass Pastures - Soil Productivity Groups I, II
Soil Test Level Nutrient Needs (lbs/ac) N P2O5 K2O
L 175-225* 100-120 100-120 M 175-225* 40-90 40-90 H 175-225* 0 0 VH 175-225* 0 0
* The N recommendation represents the total amount of Nitrogen to be applied during the
season. Split the N into three applications - April, June and July.
Organic nutrient sources may be applied in one or more applications, not to exceed 225 lbs./ac. plant available nitrogen annually. If applied after 7/1, application rates shall not exceed ½ the total nitrogen rate (112 lbs/ac.) based on above criteria while crop is still actively growing up to 9/15, with the remaining rate not to be applied until after 4/1 of the following year. When applying organic nutrient sources, pastures should be maintained at no less than three inches in height in order to reduce runoff and assure adequate regrowth of crop.

87
Bermudagrass Pastures - Soil Productivity Groups III, IV, V**
Soil Test Level Nutrient Needs (lbs/ac) N P2O5 K2O
L 120-180* 100-120 100-120 M 120-180* 40-90 40-90 H 120-180* 0 0 VH 120-180* 0 0
* The N recommendation represents the total amount of N to be appl ied during the
season. Split the N into three applications - April, June and July. ** Use the lower end of range for Group V soils.
Organic nutrient sources may be applied in one or more applications, not to exceed 180 lbs/ac. plant available nitrogen annually. If applied after 7/1 application rates shall not exceed ½ the total nitrogen rate (90 lbs/ac.) based on above criteria while crop is still actively growing up to 9/15, with the remaining rate not to be applied until after 4/1 of the following year. When applying organic nutrient sources, pastures should be maintained at no less than three inches in height in order to reduce runoff and assure adequate regrowth of crop.
Bermudagrass Hay Production, Soil Productivity Groups I, II (Use Tall Grass Productivity Group)
Soil Test Level Nutrient Needs (lbs/ac)
N P2O5 K2O L 240-300* 100-120 235-275 M 240-300* 70-90 185-225 H 240-300* 40-60 40-165 VH 240-300* 0 0
* Total application of N should be divided equally between an early April application and
applications made after the first and second harvests.
Organic nutrient sources may be applied in one or more applications, not to exceed 300 lbs/ac. plant available nitrogen annually. If applied after 7/1, application rates shall not exceed ½ the total nitrogen rate (150 lbs/ac.) based on above criteria while crop is still actively growing up to 9/15, with the remaining rate not to be applied until after 4/1 of the following year. When applying organic nutrient sources, fields should be m aintained at no l ess than three inches in height in order to reduce runoff and assure adequate regrowth of crop.

88
Bermudagrass Hay Production, Soil Productivity Groups III, IV, V** (Use Tall Grass Productivity Group)
Soil Test Level Nutrient Needs (lbs/ac) N P2O5 K2O
L 210-260* 100-120 235-275 M 210-260* 70-90 185-225 H 210-260* 40-60 40-165 VH 210-260* 0 0
* Total application of N should be divided equally between an early April application and applications made after the first and second harvests. ** Use the lower end of range for Group V soils.
Organic nutrient sources may be applied in one or more applications, not to exceed 260 lbs/ac. plant available nitrogen annually. If applied after 7/1 application rates shall not exceed ½ the total nitrogen rate (130 lbs/ac.) based on above criteria while crop is still actively growing up to 9/15, with the remaining rate not to be applied until after 4/1 of the following year. When applying organic nutrient sources fields should be maintained at no less than three inches in height in order to reduce runoff and assure adequate regrowth of crop.
Annual Ryegrass Hay Production, Soil Productivity Groups I and II (Use Tall Grass Productivity Group)
Soil Test Level Nutrient Needs (lbs/ac) N P2O5 K2O
L 40-50* 100-120 200-240 M 40-50* 70-90 160-180 H 40-50* 40-60 40-140 VH 40-50* 0 0
* The above N rates are recommended at seeding during the Fall. For additional
production 30-40 lbs/ac of N should be a dded after each grazing, not to exceed 160 lbs/ac. annually. For hay production 40-60 lbs/ac N after each cutting, not to exceed 200 lbs/ac. annually.
When applying organic nutrient sources, fields should be maintained at no less than three inches in height in order to reduce runoff and assure adequate regrowth of crop.

89
Annual Ryegrass Hay Production, Soil Productivity Groups III and IV (Use Tall Grass Productivity Group)
Soil Test Level Nutrient Needs (lbs/ac) N P2O5 K2O
L 40-50* 70-90 120-150 M 40-50* 40-60 80-110 H 40-50* 40 40-70 VH 40-50* 0 0
* The above N rates are recommended at seeding during the Fall. For additional
production, 30-40 lbs/ac of N should be added after each grazing, not to exceed 140 lbs/ac annually. For hay production, 40-60 lbs/ac N after each cutting, not to exceed 180 lbs/ac annually.
When applying organic nutrient sources, fields should be maintained at no less than
three inches in height in order to reduce runoff and assure adequate regrowth of crop. Prairie Grass (Matua) Hay Production, Soil Productivity Groups I and II (Use Tall Grass Productivity Group)
Soil Test Level Nutrient Needs (lbs/ac) N P2O5 K2O
L 80-100* 100-120 280-330 M 80-100* 70-90 220-270 H 80-100* 40-60 60-200 VH 80-100* 0 0
* The N recommendation is for a March application. Apply 40-60 lbs/ac after hay or silage
cutting. Do not exceed 300 lbs/ac per year for hay. When pastured after hay harvest, apply 30-40 lbs/ac after each grazing. Do not exceed 200 lbs/ac per year for intensive rotational grazing.
When applying organic nutrient sources, fields should be maintained at no less than
three inches in height in order to reduce runoff and assure adequate regrowth of crop.

90
Prairie Grass (Matua) Hay Production, Soil Productivity Groups III and IV (Use Tall Grass Productivity Group)
Soil Test Level Nutrient Needs (lbs/ac)
N P2O5 K2O L 60-80* 100-120 200-240 M 60-80* 70-90 160-180 H 60-80* 40-60 40-140 VH 60-80* 0 0
* The N recommendation is for a March application. Apply 40-60 lbs/A after hay or silage
cutting. Do not exceed 250 lbs/A per year for hay. When pastured after hay harvest, apply 30-40 lbs/ac after each grazing. Do not exceed 180 lbs/ac per year for intensive rotational grazing.
When applying organic nutrient sources, fields should be maintained at no less than
three inches in height in order to reduce runoff and assure adequate regrowth of crop. Switchgrass - All Soil Productivity Groups
Soil Test Level Nutrient Needs (lbs/ac) N* P2O5 K2O
L 40-60 100-120 100-120 M 40-60 40-90 40-90 H 40-60 0 0 VH 40-60 0 0
*If stand contains greater than 25% legumes, no Nitrogen is required. For establishment no Nitrogen is needed, follow P2O5 and K2O soil test recommendations shown above.
When applying organic nutrient sources, fields should be maintained at no less than three inches in height in order to reduce runoff and assure adequate regrowth of crop.

91
Caucasian Bluestem (hay or pasture), All Soil Productivity Groups
Soil Test Level Nutrient Needs (lbs/ac) N P2O5 K2O
L 60-120* 100-120 100-120 M 60-120* 40-90 40-90 H 60-120* 0 0 VH 60-120* 0 0
*This is an annual nitrogen rate. Annual nitrogen rate should be applied in split applications, such as between grazings or cuttings if used for hay. If organic nutrient sources are utilized, up to 120 lbs of N may be applied if the application is no more frequent than once every 2 years.
When applying organic nutrient sources, fields should be maintained at no less than three
inches in height in order to reduce runoff and assure adequate regrowth of crop. Tobacco Recommendations: Flue-Cured
Soil Test Level Nutrient Needs (lbs/ac) N P2O5 K2O
L 60-70
290-330 150-175 M 60-100 100-150 H 40 100
VH 40* 100
* For phosphorus soil test levels exceeding 65% saturation as shown in Table 4-1,Section IV, or if the Phosphorus Index is greater than 100, no phosphorus application shall be made to the field, including starter.
50% of the total nitrogen need should be in the nitrate nitrogen form. Pre-plant broadcast fertilizer should not exceed 40 lbs/ac of nitrogen and 120 lbs/ac. of
potash. Balance of nutrient recommendation can be applied as a sidedress application. Use of soluble fertilizer in transplant water is discouraged where soil test levels are M+
and higher. For phosphorus soil test levels Medium or below, soluble fertilizer may be used. Select a product approved for direct application in the row with the plant. Total phosphorus applied can not exceed phosphorus nutrient need.
Potassium source should not contain any chloride compounds.

92
Dark-Fired
Soil Test Level Nutrient Needs (lbs/ac) N P2O5 K2O
L 135
290-330 150-175 M 60-100 100-150 H 40 100 VH 40* 100
* For phosphorus soil test levels exceeding 65% saturation as shown in Table 4-1,Section IV, or if the Phosphorus Index is greater than 100, no phosphorus application shall be made to the field, including starter.
50% of the total nitrogen need should be in the nitrate nitrogen form. Pre-plant broadcast fertilizer should not exceed 60-70 lbs/ac. of nitrogen and 120 lbs/ac.
of potash. Balance of nutrient recommendation can be applied as a sidedress application.
Use of soluble fertilizer in transplant water is discouraged where soil test levels are M+
and higher. For phosphorus soil test levels Medium or below, soluble fertilizer may be used. Select a product approved for direct application in the row with the plant. Total phosphorus applied can not exceed phosphorus nutrient need.
Potassium source should not contain any chloride compounds.
Burley
Soil Test Level Nutrient Needs (lbs/ac) N P2O5 K2O
L 175 - 200
290-330 250-350 M 60-100 200-250 H 40 100-200 VH 40* 100
* For phosphorus soil test levels exceeding 65% saturation as shown in Table 4-1,Section IV, or if the Phosphorus Index is greater than 100, no phosphorus application shall be made to the field, including starter.
50% of the total nitrogen need should be in the nitrate nitrogen form. Pre-plant broadcast fertilizer should not exceed 100 lbs/ac. of nitrogen and 120 lbs/ac. of
potash. Balance of nutrient recommendation can be applied as a sidedress application. Use of soluble fertilizer in transplant water is discouraged where soil test levels are M+
and higher. For phosphorus soil test levels Medium or below, soluble fertilizer may be used. Select a product approved for direct application in the row with the plant. Total phosphorus applied can not exceed phosphorus nutrient need.
Potassium source should not contain any chloride compounds.

93
Hardwood and Pine Nutrient Application Rates and Timing All references to age of trees or stands starts as of the time the trees were planted at the site and not the age of the seedling tree at planting. Hardwood and Pine Plantation Establishment (0 - 3 years of age) - All Soil Productivity Groups
Soil Test Level Nutrient Needs, (lbs/ac)
N P2O5 K20 L 0 50-70 50-80 M 0 10-40 10-40 H 0 0 0 VH 0 0 0
Phosphorus and potassium may be applied by incorporation before planting, or by
broadcast on the soil surface or by banding along the planting row. Acceptable pH ranges for pines are pH 4.5 to 6 and should not exceed pH 6.5.
Acceptable pH ranges for hardwoods are pH 5 to 7 and should not exceed pH 7.5. If the soil pH falls within these ranges, it is not necessary to apply lime.
Control of competing vegetation, including both woody and herbaceous species, may be
required within the stand following planting to avoid overtopping of the seedlings and thus decrease tree survival.
Pine* and Hardwood Maintenance (3 to 10 years of age) – All Soil Productivity Groups Soil Test Level Nutrient Needs, (lbs/ac)
N P2O5 K20 See detailed nitrogen
L management below 50-70 50-80 M 10-40 10-40 H 0 0 VH 0 0
*Pines Species includes loblolly, short leaf, Virginia, and white pine. Long leaf pine should not exceed 100 lbs/ac N at any age.

94
Nitrogen intervals and rates for Pine and Hardwood Maintenance
Between ages 3-10, one application of N at a rate of 50 to 100 lbs/acre can be made to the stand. Applications in pines at this stage of growth shall be made no sooner than one month before the average date of the last killing frost in the Spring (Fig. 6-2, Section VI) and ending no later than two months before the average date of the first killing frost in the Fall. (Fig 6-1, Section VI).
After age 10, applications of nitrogen can be made using one of the nitrogen rates and
application intervals listed in the table below. The applications can continue at the selected interval and rate until approximately 5 years before expected harvest of the trees.
Interval between
Nitrogen applications Nitrogen Application
Rate (lbs/ac)per Application Intervala
4-6 yrs. 100 OR
6-8 yrs. 150 OR
8-10 yrs. 200 a - Long leaf pine may receive no more than 100 lbs/ac of nitrogen after age >10 years, every 4-6 years.
Season of Nitrogen Application No applications shall be made when the soil is saturated or standing water is present on
the surface of the soil, regardless of the time of year. Pine: Applications in pine stands greater than 10 years of age may be made at any time
of the year that the soil is not saturated or standing water is not present on the soil surface.
Hardwood: Applications in hardwoods shall be limited to the growing season. Applications
in hardwood forests shall be made no sooner than one month before the average date of the last killing frost in the Spring (Fig. 6-2, Section VI) and ending no later than two months before the average date of the first killing frost in the Fall. (Fig 6-1, Section VI).
Understory vegetation Moderate amounts of understory vegetation that is below the canopy of the planted trees is acceptable in mid-rotation stands. This vegetation will take up nutrients and reduce runoff. However, if understory vegetation is excessive, that is, it is as tall or taller than the planted trees, suppression of the understory vegetation may be needed. Consult a local Virginia Department of Forestry forester to develop an understory management program. In all cases Best Management Practices for nutrient applications, such as adhering to
buffers for wells and surface waters is required.

95
Christmas Trees - Establishment (broadcast before planting) White Pine, Virginia Pine, Scotch Pine
Soil Test Level Nutrient Needs (lbs/ac) N P2O5 K2O
L 100-120 90-150 100-160 M 100-120 40-80 50-90 H 100-120 30 40 VH 100-120 0 0
Christmas Trees – Establishment (broadcast before planting) Fraser Fir, Norway Spruce, Hemlock, Blue Spruce, Red Cedar
Soil Test Level Nutrient Needs (lbs/ac) N P2O5 K2O
L 100-120 160-300 150-250 M 100-120 60-150 60-150 H 100-120 30-50 30-50 VH 100-120 0 0
Christmas Trees – Maintenance
A nitrogen application of 50-60 lbs/acre should be made with the first Spring application to be made about 2 weeks before budbreak. A Fall application of 50-60 lbs/acre can be made anytime beginning in September, but no later than the end of October.
Use the Fertilizer Recommendations table under Establishment for the appropriate rate
for the specific species. Base P2O5 and K2O applications on soil test results taken before planned maintenance applications.
Maintenance fertilizer applications should be uniformly applied in 2 to 3 foot wide bands
between the trees along the planted row.
OR
For a rate per tree, determine the fertilizer rate in ounces (lbs/ac X 16) then divide by the number of trees per acre. (100 lbs/ac of N X 16 ozs/lb = 1600 ozs. Then 1600 ozs ÷ no. of trees/ac = ozs/tree).

96
Section VI. Turfgrass Nutrient Recommendations for Home Lawns, Office Parks, Public Lands and Other Similar Residential/Commercial Grounds
Definitions For the purposes of this section, the following definitions, as presented by the Association of American Plant Food Control Officials (AAPFCO), apply: “Enhanced efficiency fertilizer” describes fertilizer products with characteristics that allow increased plant nutrient availability and reduce the potential of nutrient losses to the environment when compared to an appropriate reference product. “Slow or controlled release fertilizer” means a fertilizer containing a plant nutrient in a form which delays its availability for plant uptake and use after application, or which extends its availability to the plant significantly longer than a reference “rapidly available nutrient fertilizer” such as ammonium nitrate, urea, ammonium phosphate or potassium chloride. A slow or controlled release fertilizer must contain a minimum of 15 percent slowly available forms of nitrogen. “Water soluble nitrogen”, “WSN”, or “readily available nitrogen” means: Water soluble nitrogen in either ammonical, urea, or nitrate form that does not have a controlled release, or slow response. Recommended Season of Application For Nitrogen Fertilizers - Applies to all Turf A nitrogen fertilization schedule weighted toward fall application is recommended and preferred for agronomic quality and persistence of cool season turfgrass; however, the acceptable window of applications is much wider than this for nutrient management. T he nutrient management recommended application season for nitrogen fertilizers to cool season turfgrasses begins six weeks prior to the last spring average killing frost date and ends six weeks past the first fall average killing frost date (see Figures 6-1 & 6-2). Applications of nitrogen during the intervening late fall and winter period should be avoided due to higher potential leaching or runoff risk, but where necessary, apply no more than 0.5 pounds per 1,000 ft2 of water soluble nitrogen within a 30-day period. Higher application rates may be used during this late fall and winter period by using materials containing slowly available sources of nitrogen, if the water soluble nitrogen contained in the fertilizer does not exceed the recommended maximum of 0.5 pounds per 1,000 ft2 rate. Do not apply nitrogen or phosphorus fertilizers when the ground is frozen. The acceptable nitrogen fertilizer application season for non-overseeded warm season turfgrass begins no earlier than the last spring average killing frost date and ends no later than one month prior to the first fall average killing frost date (see Figures 6-1 & 6-2).
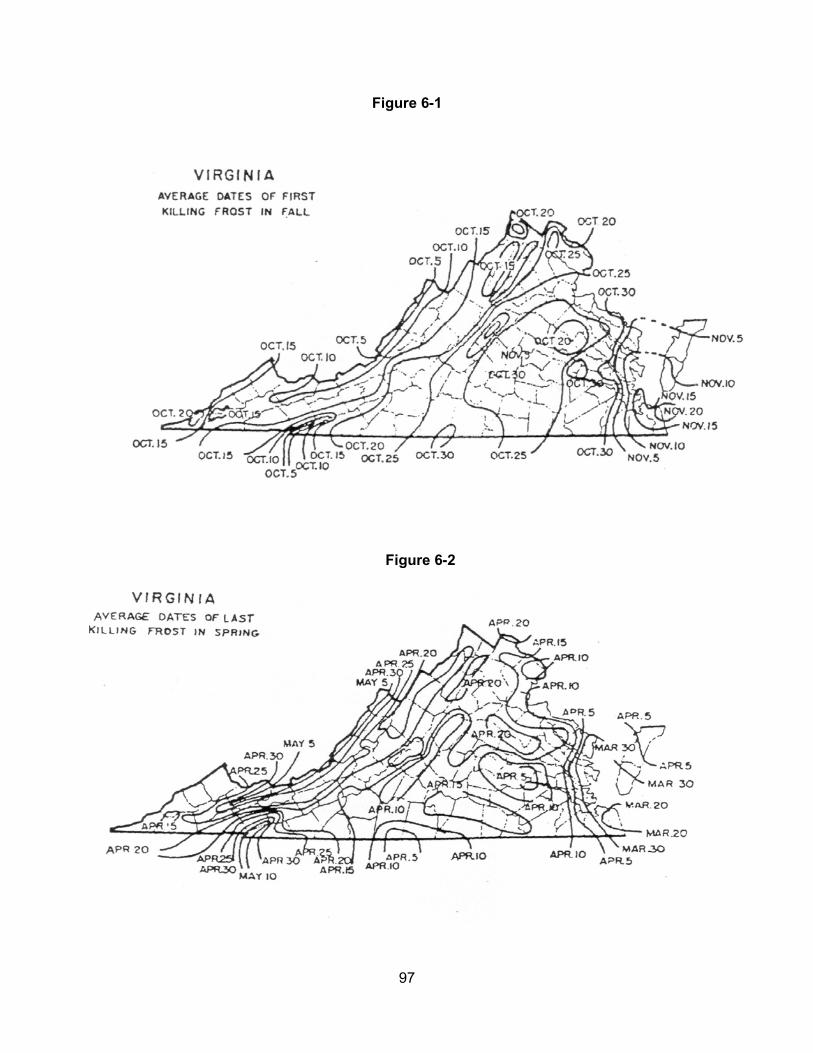
97
Figure 6-1
Figure 6-2

98
Per Application Rates Do not apply more than 0.7 pounds of water soluble nitrogen per 1,000 ft2 within a 30-day period. For cool season grasses, do not apply more than 0.9 pounds of total nitrogen per 1,000 ft2 within a 30-day period. For warm season grasses, do not apply more than 1.0 pounds of total nitrogen per 1,000 ft2 within a 30-day period. Lower per application rates of water soluble nitrogen sources or use of slowly available nitrogen sources should be ut ilized on very permeable sandy soils, shallow soils over fractured bedrock, or areas near water wells. Annual Application Rates for Home Lawns and Commercial Turf Up to 3.5 pounds per 1,000 ft2 of nitrogen may be applied annually to cool season grass species or up to 4 pounds per 1,000 ft2 may be applied annually to warm season grass species using 100 percent water soluble nitrogen sources. Lower rates of nitrogen application may be desirable on those mature stands of grasses that require less nitrogen for long-term quality. As a result, lower application rates will probably be more suited to the fine leaf fescues (hard fescue, chewings fescue, creeping red fescue, and sheep fescue) and non-overseeded zoysiagrass. Lower rates should also be used on less intensively managed areas. Use of Slowly Available Forms of Nitrogen For slow or controlled release fertilizer sources, or enhanced efficiency fertilizer sources, no more than 0.9 pounds of nitrogen per 1,000 ft2 may; be applied to cool season grasses within a 30-day period and no more than 1.0 pounds of nitrogen per 1,000 ft2 may be applied to warm season grasses within a 30-day period. Provided the fertilizer label guarantees that the product can be used in such a way that it will not release more than 0.7 pounds of nitrogen per 1,000 ft2 in a 30-day period, no more than 2.5 pounds of nitrogen per 1,000 ft2 may be appl ied in a single application. A dditionally, total annual applications shall not exceed 80 percent of the annual nitrogen rates for cool or warm season grasses. Phosphorus and Potassium Nutrient Needs (Established Turf) Apply phosphorus (P2O5) and potassium (K2O) fertilizers as indicated necessary by a soil test using the following guidelines:
Soil Test Level Nutrient Needs (pounds per 1,000 ft2)*
P2O5 K2O L 2-3 2-3 M 1-2 1-2 H 0.5-1 0.5-1 VH 0 0
* For the lower soil test level within a rating, use the higher side of the range and for higher
soil test level within a rating use the lower side of the recommendation range. (For example the recommendation for a P2O5 soil test level of L- would be 3 pounds per 1,000 ft2.)
Do not use high phosphorus ratio fertilizers such as 10-10-10 or 5-10-10, unless soil tests indicate phosphorus availability below the M+ level.

99
Recommendations for Establishment of Turf These recommendations are for timely planted turfgrass, that is, the seed or vegetative material (sod, plugs, and /or sprigs), are planted at a time of the year when temperatures and moisture are adequate to maximize turfgrass establishment. These recommended establishment periods would be late summer to early fall for cool-season turfgrasses and late spring through mid-summer for warm-season turfgrasses. Nitrogen Applications At the time of establishment, apply no more than 0.9 pounds per 1,000 ft2 of total nitrogen for cool season grasses or 1.0 pounds per 1,000 ft2 of total nitrogen for warm season grasses, using a material containing slowly available forms of nitrogen, followed by one or two applications beginning 30 days after planting, not to exceed a total of 1.8 pounds per 1,000 ft2 total for cool season grasses and 2.0 pounds per 1,000 ft2 for warm season grasses for the establishment period. Applications of WSN cannot exceed more than 0.7 pounds per 1,000 ft2
within a 30-day period. Phosphorus and Potassium Recommendations for Establishment
Soil Test Level Nutrient Needs (pounds per 1,000 ft2) *
P2O5 K2O L 3-4 2-3 M 2-3 1-2 H 2-1 0.5-1 VH 0 0
* For the lower soil test level within a rating, use the higher side of the range and for higher
soil test level within a rating use the lower side of the recommendation range.

100
Nutrient Recommendations for Golf Courses
Nitrogen Timing The beginning and ending dates for application of nitrogen shall be determined using guidance and frost date maps contained in the Season of Application for Nitrogen section, Figures 6-1 and 6-2. If the full rate or the highest rate of the recommendation range for a monthly application is applied in a single application, then the interval of application for nitrogen shall be at least 30 days to allow turf to utilize previous nitrogen applications. If several applications are to be made for the monthly nitrogen rate, then the timing of the applications shall be at approximately even intervals, with the rate per application to be evenly divided between each application with the total nitrogen applied not to exceed the maximum monthly rate. Use of Water Insoluble Nitrogen forms of Nitrogen is encouraged.
Nitrogen Rates
Grass Type Maximum WSN Rate Per
Application - pounds per 1,000
ft2
Total Annual Nitrogen Rate - pounds per
1,000 ft2 a
Greens 0.7 (b) 3-6 Tees 0.7 (b) 2-5 Fairways Cool Season 0.7 (c) 2-3 Warm Season 0.7 (c) 3-4 Fairways – Intensive Management
Cool Season 0.5 (d) 3-4
Warm Season 0.5 (d) 3.5-4.5
Overseeding Warm Season Fairways
.5 1.25
Roughs 0.7 (e) 1-3 Fairways-Overseeding Warm Season Fairways • For warm season grasses, up to 0.7 pounds of nitrogen per 1,000 ft2 in a 30-day period
may be applied in the Fall after perennial ryegrass overseeding is well established. An additional nitrogen application of 0.7 pounds per 1,000 ft2 may be made in February-March to overseeded perennial ryegrass if growth and color indicate need. Applications using WSN may not exceed 0.7 pounds per 1,000 ft2 within a 30-day period.
• Soluble nitrogen rates of 0.25 pounds per 1,000 ft2 or less which may be a component of
a pesticide or minor element application, may be applied any time during the application windows described in Recommended Season of Application for Nitrogen Fertilizers of this section, but must be considered with the total annual nitrogen application rate.
(a)Use higher rates for intensively used turf where accelerated growth and/or rapid
recovery are required, use lower rates for maintenance of lesser used areas; do not exceed total annual nitrogen levels as stated above.

101
(b)Greens and Tees – Per application timing must be a minimum of 30 days between applications. A rate of 0.9 pounds per 1,000 ft2 of total nitrogen may be applied for cool season grasses or 1.0 pounds per 1,000 ft2 of total nitrogen may be applied for warm season grasses using a material containing slowly available forms of nitrogen.
(c) Fairways-Normal Management (Non-Irrigated or Irrigated) - Per Application timing must
be a minimum of 30 days between applications. Total nitrogen application rates of 0.9 pounds per 1,000 ft2 of total nitrogen may be applied for cool season grasses or 1.0 pound per 1,000 ft2 of total nitrogen may be applied for warm season grasses using a material containing slowly available forms of nitrogen.
(d) Fairways-Intensive Management (Irrigated)- Per Application timing must be a minimum
of 15 days between applications. This option requires optimized timing of more frequent applications of nitrogen with lesser rates per application. Alternatively, a maximum application rate of 0.9 pounds per 1,000 ft2 of total nitrogen for cool season grasses or 1.0 pounds per 1,000 ft2 of total nitrogen for warm season grasses using a material containing slowly available forms of nitrogen may be applied with a minimum of 30 days between applications.
(e) Foliar fertilizer may be applied to warm season grasses within 30 days prior to the first
killing frost in the fall, at a rate not to exceed 0.1 pounds per 1,000 ft2 of nitrogen per application. This application must be accounted for in the total annual nitrogen rate.
Phosphorus and Potassium Recommendations for Established Golf Courses Apply phosphorus (P2O5) and po tassium (K2O) fertilizers as indicated by a soil test using the following guidelines:
Soil Test Level Nutrient Needs (pounds per 1,000 ft2)* P2O5 K2O
L 2-3 2-3 M 1-2 1-2 H 0.5-1 0.5-1 VH 0 0
* For the lower soil test level within a rating, use the higher side of the range and for
higher soil test level within a rating use the lower side of the recommendation range. For irrigated turf grown on Naturally Occurring and Modified Sand Based soils only, up to
0.5 pounds of P2O5 per 1,000 ft2 may be appl ied, if needed, to aid in recovery of damaged turf during times of extreme use. No phosphorus applications shall be made when the soil phosphorus test level is above 65% saturation, based on the soil test phosphorus values and region as listed in Table 4-1 of Section IV.
Avoid the general use of high phosphorus ratio fertilizers such as 10-10-10 or 5-10-10,
unless soil tests indicate phosphorus availability below the M+ level. Nitrogen Management on Athletic Fields - Cool Season Grasses
• This program is intended for those fields which are under heavy use.
• Nitrogen recommendations are based on t he assumption that there is adequate soil moisture to promote good turf growth at the time of application. If no r ainfall has occurred since the last application, further applications should be delayed until significant soil moisture is available.
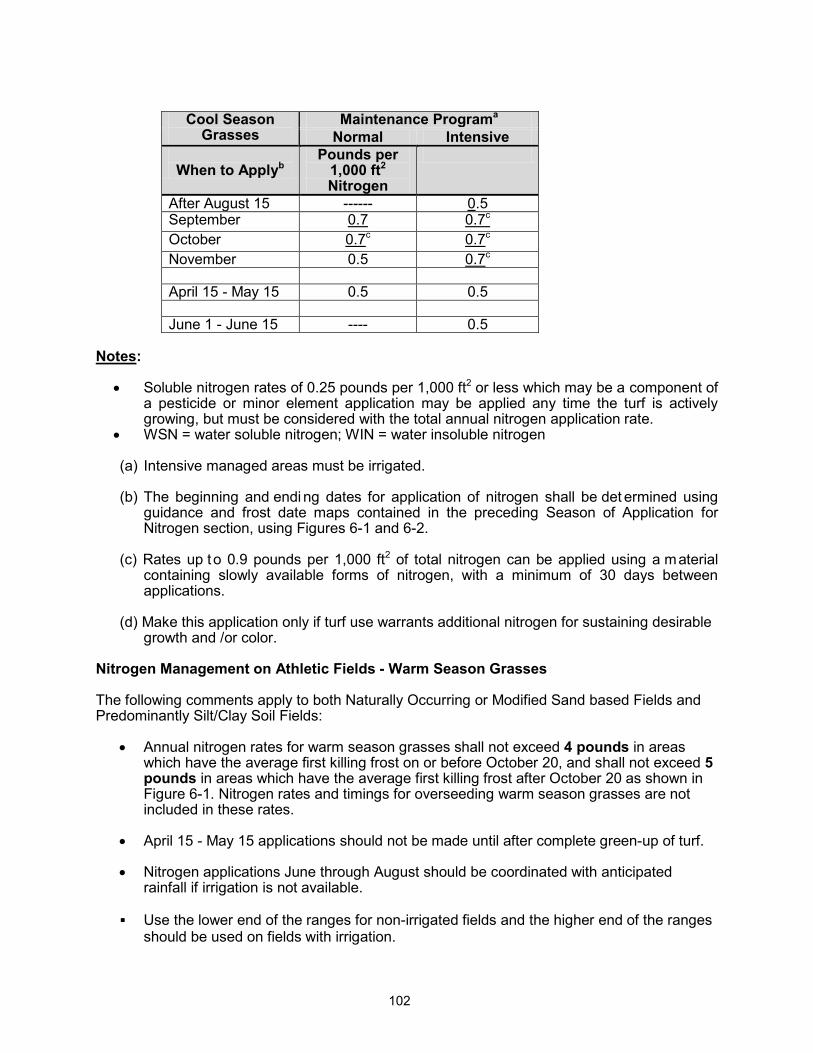
102
Cool Season
Grasses Maintenance Programa
Normal Intensive
When to Applyb Pounds per
1,000 ft2 Nitrogen
After August 15 ------ 0.5 September 0.7 0.7c October 0.7c 0.7c November 0.5 0.7c April 15 - May 15 0.5 0.5 June 1 - June 15 ---- 0.5
Notes:
• Soluble nitrogen rates of 0.25 pounds per 1,000 ft2 or less which may be a component of a pesticide or minor element application may be applied any time the turf is actively growing, but must be considered with the total annual nitrogen application rate.
• WSN = water soluble nitrogen; WIN = water insoluble nitrogen
(a) Intensive managed areas must be irrigated. (b) The beginning and endi ng dates for application of nitrogen shall be det ermined using
guidance and frost date maps contained in the preceding Season of Application for Nitrogen section, using Figures 6-1 and 6-2.
(c) Rates up to 0.9 pounds per 1,000 ft2 of total nitrogen can be applied using a material
containing slowly available forms of nitrogen, with a minimum of 30 days between applications.
(d) Make this application only if turf use warrants additional nitrogen for sustaining desirable
growth and /or color. Nitrogen Management on Athletic Fields - Warm Season Grasses The following comments apply to both Naturally Occurring or Modified Sand based Fields and Predominantly Silt/Clay Soil Fields:
• Annual nitrogen rates for warm season grasses shall not exceed 4 pounds in areas which have the average first killing frost on or before October 20, and shall not exceed 5 pounds in areas which have the average first killing frost after October 20 as shown in Figure 6-1. Nitrogen rates and timings for overseeding warm season grasses are not included in these rates.
• April 15 - May 15 applications should not be made until after complete green-up of turf.
• Nitrogen applications June through August should be coordinated with anticipated
rainfall if irrigation is not available.
Use the lower end of the ranges for non-irrigated fields and the higher end of the ranges should be used on fields with irrigation.
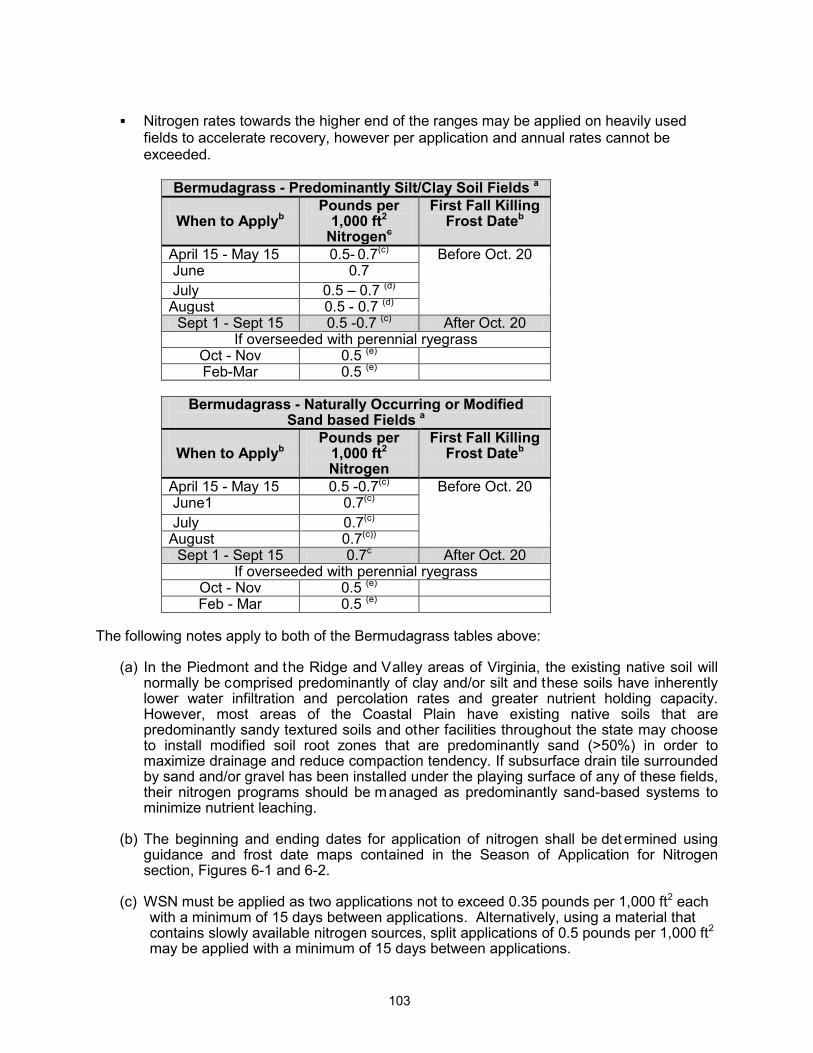
103
Nitrogen rates towards the higher end of the ranges may be applied on heavily used
fields to accelerate recovery, however per application and annual rates cannot be exceeded.
Bermudagrass - Predominantly Silt/Clay Soil Fields a
When to Applyb
Pounds per 1,000 ft2
Nitrogenc
First Fall Killing Frost Dateb
April 15 - May 15 0.5- 0.7(c) Before Oct. 20 June 0.7 July 0.5 – 0.7 (d) August 0.5 - 0.7 (d)
Sept 1 - Sept 15 0.5 -0.7 (c) After Oct. 20 If overseeded with perennial ryegrass
Oct - Nov 0.5 (e) Feb-Mar 0.5 (e)
Bermudagrass - Naturally Occurring or Modified
Sand based Fields a
When to Applyb Pounds per
1,000 ft2 Nitrogen
First Fall Killing Frost Dateb
April 15 - May 15 0.5 -0.7(c) Before Oct. 20 June1 0.7(c) July 0.7(c) August 0.7(c))
Sept 1 - Sept 15 0.7c After Oct. 20 If overseeded with perennial ryegrass
Oct - Nov 0.5 (e) Feb - Mar 0.5 (e)
The following notes apply to both of the Bermudagrass tables above:
(a) In the Piedmont and the Ridge and Valley areas of Virginia, the existing native soil will normally be comprised predominantly of clay and/or silt and these soils have inherently lower water infiltration and percolation rates and greater nutrient holding capacity. However, most areas of the Coastal Plain have existing native soils that are predominantly sandy textured soils and other facilities throughout the state may choose to install modified soil root zones that are predominantly sand (>50%) in order to maximize drainage and reduce compaction tendency. If subsurface drain tile surrounded by sand and/or gravel has been installed under the playing surface of any of these fields, their nitrogen programs should be m anaged as predominantly sand-based systems to minimize nutrient leaching.
(b) The beginning and ending dates for application of nitrogen shall be det ermined using
guidance and frost date maps contained in the Season of Application for Nitrogen section, Figures 6-1 and 6-2.
(c) WSN must be applied as two applications not to exceed 0.35 pounds per 1,000 ft2 each
with a minimum of 15 days between applications. Alternatively, using a material that contains slowly available nitrogen sources, split applications of 0.5 pounds per 1,000 ft2 may be applied with a minimum of 15 days between applications.

104
(d) If a material containing slowly available forms of nitrogen is used, rates up to 1.0 pounds
of nitrogen per 1,000 ft2 may be appl ied in a s ingle application with a m inimum of 30 days between applications.
(e) For overseeded warm season grasses, an additional 0.7 pounds per 1,000ft2 of WSN
may be applied in the Fall after the perennial ryegrass overseeding is well established. The WSN must be applied as two applications not to exceed 0.35 pounds per 1,000 ft2 of nitrogen each, with a minimum of 15 days between applications. Additional WSN application of 0.5 pounds per 1,000 ft2 may be made in February-March to overseeded perennial ryegrass if growth and color indicate need. Alternatively, split applications of 0.5 pounds of nitrogen per 1,000 ft2 each with a minimum of 15 days between applications may be applied using a material containing slowly available nitrogen sources.
Phosphorus and Potassium Recommendations Athletic Fields Apply phosphorus (P2O5) and po tassium (K2O) fertilizers as indicated by a soil test using the following guidelines:
Soil Test Level Nutrient Needs (pounds per 1,000 ft2)*
P2O5 K2O L 2-3 2-3 M 1-2 1-2 H 0.5-1 0.5-1 VH 0 0
* For the lower soil test level within a rating, use the higher side of the range and for
higher soil test level within a rating use the lower side of the recommendation range.
For irrigated turf grown on Naturally Occurring and Modified Sand Based soils only, up to 0.5 pounds of P2O5 per 1,000 ft2 may be appl ied, if needed, to aid in recovery of damaged turf during times of extreme use. No phosphorus applications shall be made when the soil phosphorus test level is above 65% saturation, based on the soil test phosphorus values and region as listed in Table 4-1 of Section IV.
Avoid the general use of high phosphorus ratio fertilizers such as 10-10-10 or 5-10-10,
unless soil tests indicate phosphorus availability below the M+ level.
105
Establishment/Grow-In Recommendations for Golf Courses, Athletic Fields, and Sod Production
(These rates replace normal maintenance fertilizer applications that would have occurred during these time periods.)
Warm Season Grasses:
Predominantly Silt/Clay Soils ♦ Plant Date - late May -June for sprigs, plugs, sod, or seeding. ♦ Apply P2O5 and K2O as needed based on soil test recommendations, incorporate into
the top 2 inches if possible. ♦ At Planting - Up to 1.0 pounds of nitrogen per 1,000 ft2 using a material containing
slowly available forms of nitrogen may be applied as one application or lesser amounts applied at regular intervals, through the first 4 weeks, not to exceed a total of 1.0 pounds of nitrogen per 1,000ft2.
♦ Four weeks after planting - 0.25 pounds.of WSN per 1,000 ft2 per week for the next 4 weeks.
Naturally Occurring or Modified Sand Based Soils ♦ Plant Date - late May -June for sprigs, plugs, sod, or seeding. ♦ Apply P2O5 and K2O as needed based on soil test recommendations, incorporate into
the top 2 inches if possible. ♦ At Planting - Up to 1.0 pounds of nitrogen per 1,000 ft2 using a material containing
slowly available forms of nitrogen may be applied as one application or lesser amounts at regular intervals through the first 4 weeks, not to exceed a total of 1.0 pounds of nitrogen per 1,000 ft2.
♦ Four weeks after planting - 0.25 pounds per1,000 ft2 using a material containing slowly available forms of nitrogen per week for the next 4 weeks.
Cool Season Grasses:
Predominantly Silt/Clay Soils ♦ Plant Date - August - September (preferred) ♦ Apply P2O5 and K2O as needed based on soil test recommendations, incorporate into the
top 2 inches if possible. ♦ At Planting - up to 0.9 pounds of nitrogen per 1,000 ft2 using a material containing slowly
available forms of nitrogen may be applied; 30 days after planting, apply up to 0.5 pounds of nitrogen per 1,000 ft2 every week for the next 4 weeks.
Naturally Occurring or Modified Sand Based Soils ♦ Plant Date - August -September (preferred) ♦ Apply P2O5 and K2O as needed based on soil test recommendations, incorporate into the
top 2 inches if possible. ♦ At Planting - up to 0.9 pounds of nitrogen per 1,000 ft2 using a material containing slowly
available forms of nitrogen may be applied. ♦ Apply up to 0.25 pounds of nitrogen per 1,000 ft2 per week after germination is complete,
for the next 8 weeks. If using a material that contains slowly available forms of nitrogen, up to 0.5 pounds of nitrogen per 1,000 ft2 every two weeks may be applied after germination is complete for the next 8 weeks.

106
Sod Installations: Site preparation should include a soil test, which can be done several months before the project begins in order to have time to get test results back. Phosphorus, potassium and lime applications should be based on soil test analysis to increase the likelihood of a successful installation. Shallow incorporation of material into the top 2 inches of the soil is preferred prior to sod installation, especially if lime is required. No more than 0.7 pounds of nitrogen per 1,000 ft2 of WSN may be applied before sod is installed. Alternatively, using a material with slowly available forms of nitrogen, 0.9 pounds of nitrogen per 1,000 ft2 for cool season grasses or 1.0 pounds of nitrogen per 1,000 ft2 for warm season grasses may be applied before sod is installed. After installation apply adequate amounts of water to maintain sufficient soil moisture (i.e. to prevent visible wilt symptoms). Excessive water will limit initial root development. After roots begin to establish (as verified by lightly tugging on the sod pieces), shift irrigation strategy to a deep and infrequent program in order to encourage deep root growth. Apply approximately 1 inch of water per week (either by rainfall or irrigation), making sure that the water is being accepted by the soil profile without running off. This will insure thorough wetting of the soil profile. After sod has completed rooting and is well established, initiate the normal nitrogen management program as described for the appropriate use shall be recommended.
Phosphorus and Potassium Recommendations for Establishment/Grow-In/Installation
Soil Test Level Nutrient Needs (pounds per 1,000 ft2) *
P2O5 K2O L 3-4 2-3 M 2-3 1-2 H 2-1 0.5-1 VH 0 0
* For the lower soil test level within a rating, use the higher side of the range and for higher soil test level within a rating use the lower side of the recommendation range.

107
Other Turf Management Considerations for Golf Courses, Athletic fields,
and Home Lawns Lime Recommendations Lime should be r ecommended based on a soil test to maintain soil pH within an ag ronomic range for turfgrass. For new seedings where lime is recommended, incorporate the lime into the topsoil for best results. Returning Grass Clippings Recycling of clippings on turf should be encouraged as an effective means of recycling nitrogen, phosphorus, and potassium. Proper mowing practices that ensure no more than 1/3 of the leaf blade is removed in any cutting event will enhance turf appearance and performance when clippings are returned. Return all leaf clippings from mowing events to the turf rather than discharging them onto sidewalks or streets. Rotary mulching mowers can further enhance clipping recycling by reducing the size of clippings being returned to the turfgrass canopy. Management of Collected Clippings If clippings are collected they should be di sposed of properly. They may be c omposted or spread uniformly as a thin layer over other turf areas or areas where the nutrient content of the clippings can be recycled through actively growing plants. They should not be blown onto impervious surfaces or surface waters, dumped down stormwater drains, or piled outside where rainwater will leach out the nutrients creating the potential for nutrient loss to the environment. Use of Iron Iron applications (particularly foliar applications) may periodically be used for enhanced greening as an alternative to nitrogen. These applications are most beneficial if applied in late spring through summer for cool season grasses and in late summer/fall applications for warm-season grasses. Impervious Surfaces Do not apply fertilizers containing nitrogen or phosphorus to impervious surfaces (sidewalks, streets, etc.). Remove any granular materials that land on impervious surfaces by sweeping and collecting, and either put the collected material back in the bag, or spread it onto the turf and /or using a leaf blower etc. to return the fertilizer back to the turfgrass canopy.

108
Section VII. Estimated Nitrogen Availability to Succeeding Crops From Legumes
Table 7-1
Estimated Nitrogen Availability to Succeeding Crops From Legumes
Crop % Stand Description Residual N (Lbs/ac) Alfalfa 50-75 Good (>4 T/A) 90
25-49 Fair (3-4 T/A) 70 <25 Poor (<3 T/A) 50
Red Clover or Crimson Clover
>50 Good (>3 T/A) 80 25-49 Fair (2-3 T/A) 60 <25 Poor (<2 T/A) 40
Hairy Vetch (cover crop)
80-100 Good 100 50-79 Fair 75 <50 Poor 50
Peanuts - - 45 Soybeans 1/2 lb. N per bushel of yield, if previous yield unknown, 20 lbs.

109
Section VIII. Manure Management
Table 8-1 Manure Ammonium Nitrogen Availability Coefficients
Method of Application
Semi- Solid
Manure
Liquid Manure Slurry
Lagoon Liquid
Dry
Litter Injection - 0.95 0.95 - Broadcast with incorporation immediate 0.75 0.75 0.90 0.90 Incorporated after 2 days 0.65 0.65 0.80 0.80 Incorporated after 4 days 0.40 0.40 0.60 0.65 Incorporated after 7 days or no incorporation
0.25 0.25 0.45 0.50
Irrigation without incorporation - 0.20 0.50 -
To utilize the table, the pounds of NH4-N per ton or 1000 gallons of manure is determined from a manure test. M ultiply the NH4-N content of the manure by the availability coefficient in the table to obtain plant available nitrogen from the manure ammonium content.
Table 8-2 Coefficients for Organic N Availability in Manures1
Spring or Early2
Fall Applied Winter Topdress/ Spring Residual3
Perennial Grass
Dairy Manure .35 .20/.15 .35 Poultry Manure .60 .30/.30 .60 Swine Manure .50 .25/.25 .50
1. Multiply the organic nitrogen content by the coefficient in the table to obtain expected
available nitrogen. 2. Manure applied in spring for summer annuals such as corn, or early fall (prior to December 1) for small grains. This coefficient shall also be used to calculate Orgainc N
availability when the nitrogen need of the next spring crop is being used to determine a nitrogen application rate for fall or winter applications to a trap crop.
3. Use the first coefficient to calculate Organic N released from manure applied in early winter on w inter annuals such as rye, wheat, or barley as a topdressing. Use the second coefficient to calculate Organic N released the following Spring.

110
Table 8-3 Manure Residual Factors for Previous Applications*
Historical Frequency of
Manure Application on the Field Residual Factor
Rarely Received Manure in Past (0-1 years in last 5) 0 Frequent Past Applications (2-3 out of 5 years) 0.10 Continuously Received Manure (4-5 out of 5 years) 0.20
* The appropriate rate of manure to use in residual calculations is generally the average rate
applied for years in which manure was land applied to the field. * Multiply the initial organic N content by the appropriate manure residual factor to obtain an
estimate of residual nitrogen from past manure applications. * If more detailed manure history information is available, a residual availability of the initial
organic nitrogen content of .12, .05, .02 may be used for one, two, and three years respectively following application.
Primary Nutrient Availability for Manures
Manure Phosphorus
Available P2O5 = Manure Analysis P2O5
If soils are testing M+ or above in phosphorus and the manure will supply enough phosphorus for the crop according to the formula Available P2O5 = Total P2O5, no fertilizer phosphorus should be used due to unlikely crop response and water quality concerns. For soils testing Medium or below, starter applications of fertilizer phosphorus should be made even if the manure contains sufficient phosphorus since it is contained in slow release organic forms. For soils testing low, higher levels of phosphorus starter fertilizer are recommended. Manure Potassium Available K2O = Manure Analysis K2O

111
Table 8-4 Average Analysis for Manure Tested in Virginia
Manure Type TKN NH4 P2O5 K2O % Moisture Liquid Dairy Slurry (518)* 19.22 8.88 9.08 17.35 94.60 Semi-Solid Dairy (167) 15.34 3.47 7.58 14.33 67.35 Semi-Solid Beef (47) 18.00 2.36 9.88 19.02 63.13 Dry Chicken Broiler Litter (937) 64.86 11.48 52.18 53.36 27.83 Dry Chicken Layer/Breeder (172) 47.87 8.51 60.79 43.68 29.49 Dry Turkey Litter (475) 62.03 13.05 50.23 38.31 28.64 Dry Turkey Breeder (62) 58.82 12.64 61.23 36.18 25.48 Liquid Swine Lagoon (250)* 7.20 5.66 2.81 12.23 99.35 Liquid Swine Pit (38)* 23.56 15.29 16.71 15.74 97.48
* Nutrient values presented in pounds/1000 gallons. All other nutrient values in pounds/ton. The above table is a compilation of average values for Virginia manure samples from
October 2001 through October 2004, analyzed by Clemson University Agricultural Service Lab. Numbers in parentheses indicate the number of samples analyzed for each category.

112
Table 8-5
Animal Manure Production Rates1 Daily Manure Production Per 1,000 lb weight
Animal
Animal Size
lbs.
cu. ft.
gals
% Dry Matter
Cattle Dairy 150 - 1,500 82 1.4 10.0 13 Beef 400 – 1,400 60 1.0 7.5 12 Veal 100 – 350 63 1.0 7.5 1.6
Swine Pigs 35 – 200 65 1.1 7.5 9 Gestation Sow 275 32 0.5 4.0 9 Sow and 8 pigs 375 88 1.4 10.6 9 Boar 350 31 0.5 4.0 9
Sheep 100 40 0.6 4.6 25 Horse 1,000 45 0.7 5.6 20
Poultry Poultry2 Liquid - 300 - - 5 Fresh, wet, sticky and caked
- 61 - - 25
Moist crumbly to sticky - 32 - - 50 Crumbly - 22 - - 70 Dry - 18 - - 85 1. Does not include bedding, wash water, runoff water and o ther inputs which increase
manure volume.
2. Storage losses already deducted.
Broiler houses generate approximately 1.25 tons of litter per 1000 birds during each cycle. S ix cycles per year is average. H ouses are cleaned out at variable intervals ranging from after each cycle to once every two years. Turkey Tom production generates approximately 10 tons of litter per 1000 birds during each cycle for 4 c ycles per year. T urkey hens produce about 8 t ons per 1000 bi rds during each of 5 cycles per year.
Complete clean outs of poultry houses should be scheduled during spring or summer, consistent with the availability of a suitable crop for uptake of N, unless covered storage is available, to minimize water quality impacts and maximize agronomic efficiency.

113
Table 8-6
Annual Liquid Animal Waste Volume Available for Land Application A. Manure Production
Animal Type
Ave. Wt*
Gal/Yr
# Animals
% Confined
Volume (Gals)
Feeder Swine x 2.74 x x . = Sow & Litter x 3.84 x x . = Gestation Sow x 1.46 x x . = Boar x 1.46 x x . = Beef Cattle x 2.74 x x . = Dairy Cattle x 3.65 x x . =
Subtotal Annual Manure Production _____________ gallons
*Typical Weights Lbs. Lbs. Feeder Swine 145 Dairy Cattle Sow & Litter 375 Mature 1400 Gestation Sow 275 Heifers 16-24 Mo 1050 Boar 350 9-16 Mo 680 Beef Cattle (Finishing) 1000 2-9 Mo 350
Calves 0-2 Mo 150 B. Process Wastewater
Type # Animals Gals. Per Day 365 Days/Yr. Total Wastewater Dairy x x 365 = gals Hogs x x 365 = gals Other x x 365 = gals
Dairy Cows Milked Wastewater (Gal/Cow/Day) 0 - 50 5 - 8
50 - 150 4 - 6 150+ 2 – 4
* Typical Wastewater — excludes flushing systems
Note: Most modern swine operations with lagoons use recirculated flush water for some of the
production areas, therefore, when calculating process wastewater, you should consider only the clean water that is added during each flush.

114
C. Feedlot Runoff (A x ROF x AnnPrec) x 7.48 = Feedlot Runoff 12
Where: A = lot area in square feet ROF = runoff factor ROF for paved lot = .60 ROF for unpaved lot = .25 AnnPrec = annual average precipitation from Table 8-7 7.48 converts cubic feet to gallons (_________________________) x 7.48 = _________________gallons 12 D. Net Precipitation Excess Over Pit or Lagoon (Precipitation less Evaporation)
Lagoons: NPE = Rainfall - (Lake Evaporation x .9)* NPE = _______ - ( _______ x ________ ) NPE = _______
Pits: NPE = Rainfall - (Lake Evaporation X .3)* NPE = _______ - ( ________ x ________ ) NPE = _______ *See Table 8-7 (SA x NPE) x 7.48 = Total NPE (gallons) 12
where: SA = surface area of pit or lagoon at the top, NPE = net precipitation excess as calculated above, 7.48 converts cubic feet to gallons
(______________________) x 7.48 = __________________gallons 12 Total Annual Liquid Animal Waste Volume Produced = (A. Manure + B. Process Wastewater + C. Feedlot Runoff + D. Net Precipitation Excess) _____________ gallons

115
Table 8-7 Virginia Annual Normal Precipitation and Lake Evaporation
County Annual Precip. Lake Evaporation Accomack 42 38 Albemarle 44 36 Alleghany 37 32 Amelia 42 40 Amherst 45 36 Appomatox 40 38 Augusta 38 33 Bath 41 32 Bedford 43 37 Bland 39 32 Botetourt 42 34 Brunswick 42 41 Buchanan 42 31 Buckingham 41 38 Campbell 38 38 Caroline 42 38 Carroll 41 35 Charles City 42 40 Charlotte 43 40 Chesapeake 48 40 Chesterfield 42 40 Clarke 37 34 Craig 38 32 Culpeper 40 36 Cumberland 41 39 Dickenson 42 32 Dinwiddie 42 40 Essex 44 39 Fairfax 42 37 Fauquier 40 36 Floyd 44 35 Fluvanna 39 38 Franklin 43 38 Frederick 37 33 Giles 35 32 Gloucester 43 40 Goochland 40 39 Grayson 43 33 Greene 41 36 Greensville 43 41 Halifax 42 40 Hanover 42 39 Henrico 43 40 Henry 44 39 Highland 39 32 Isle of Wight 44 40 James City 42 40 King & Queen 44 39 King George 40 38 King William 44 39
County Annual Precip. Lake Evaporation Lancaster 42 39 Lee 50 33 Loudoun 40 37 Louisa 42 38 Lunenburg 42 40 Madison 41 36 Mathews 43 40 Mecklenburg 42 41 Middlesex 42 39 Montgomery 37 34 Nelson 46 36 New Kent 44 40 Northampton 41 39 Northumberland 42 38 Nottoway 42 40 Orange 40 37 Page 39 34 Patrick 44 38 Pittsylvania 41 39 Powhatan 40 40 Prince Edward 41 40 Prince George 42 40 Prince William 36 37 Pulaski 35 33 Rappahannock 40 35 Richmond 43 38 Roanoke 40 34 Rockbridge 38 34 Rockingham 34 33 Russell 45 31 Scott 45 32 Shenandoah 34 33 Smyth 43 32 Southampton 45 41 Spotsylvania 40 38 Stafford 38 37 Suffolk 47 40 Surry 44 40 Sussex 44 40 Tazewell 42 31 Virginia Beach 46 40 Warren 35 34 Washington 45 32 Westmoreland 41 38 Wise 46 32 Wythe 37 32 York 44 40

116
Table 8-8 Maximum Wastewater Irrigation Application Rates for Different Soil Types
0%-5% Slope Inches per hour
Soil Characteristics Cover Bare Clay; very poorly drained 0.30 0.15 Silty Surface; poorly drained clay or claypan subsoil
0.40 0.25
Medium textured surface soil; moderate to imperfectly drained profile
0.50 0.30
Silt loam; loam, and very fine sandy loam; well to moderately well drained
0.60 0.40
Loamy sand, sandy loam or peat; well drained
0.90 0.60
Reduce hydraulic application rates on sloping ground:
Slope
Application Rate Reduction
0% - 5% 0% 6% - 8% 20% 9% -12% 40%
13% -20% 60% Over 20% 75%
Caution: Check application rates to insure that desired nutrient levels are not exceeded. Use the most restrictive criteria. Do not irrigate wastewater to sites where soil moisture will exceed field capacity immediately following irrigation. Field capacity is defined as the amount of water held in the soil after the excess gravitational water has drained away and after free drainage has practically ceased. Allow sufficient drying time between subsequent irrigations so that field capacity is not exceeded due to the irrigation events. Source: Pennsylvania Department of Environmental Resources, 1990. "Assessment of
Field Manure Nutrient Management."
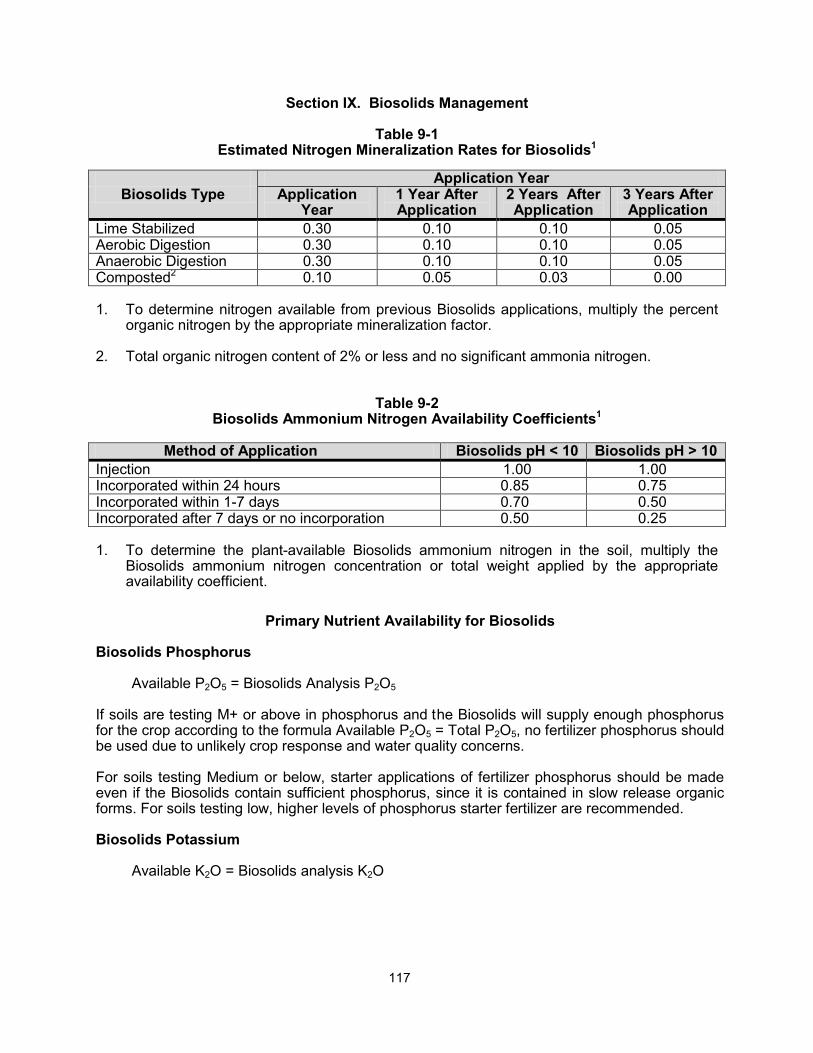
117
Section IX. Biosolids Management
Table 9-1 Estimated Nitrogen Mineralization Rates for Biosolids1
Application Year
Biosolids Type Application Year
1 Year After Application
2 Years After Application
3 Years After Application
Lime Stabilized 0.30 0.10 0.10 0.05 Aerobic Digestion 0.30 0.10 0.10 0.05 Anaerobic Digestion 0.30 0.10 0.10 0.05 Composted2 0.10 0.05 0.03 0.00 1. To determine nitrogen available from previous Biosolids applications, multiply the percent
organic nitrogen by the appropriate mineralization factor. 2. Total organic nitrogen content of 2% or less and no significant ammonia nitrogen.
Table 9-2 Biosolids Ammonium Nitrogen Availability Coefficients1
Method of Application Biosolids pH < 10 Biosolids pH > 10 Injection 1.00 1.00 Incorporated within 24 hours 0.85 0.75 Incorporated within 1-7 days 0.70 0.50 Incorporated after 7 days or no incorporation 0.50 0.25 1. To determine the plant-available Biosolids ammonium nitrogen in the soil, multiply the
Biosolids ammonium nitrogen concentration or total weight applied by the appropriate availability coefficient.
Primary Nutrient Availability for Biosolids Biosolids Phosphorus Available P2O5 = Biosolids Analysis P2O5 If soils are testing M+ or above in phosphorus and the Biosolids will supply enough phosphorus for the crop according to the formula Available P2O5 = Total P2O5, no fertilizer phosphorus should be used due to unlikely crop response and water quality concerns. For soils testing Medium or below, starter applications of fertilizer phosphorus should be made even if the Biosolids contain sufficient phosphorus, since it is contained in slow release organic forms. For soils testing low, higher levels of phosphorus starter fertilizer are recommended. Biosolids Potassium Available K2O = Biosolids analysis K2O