virginia obesity survey results karen remley, md, mba, faap state health commissioner may 18, 2010
DESCRIPTION
Virginia Obesity Survey Results Karen Remley, MD, MBA, FAAP State Health Commissioner May 18, 2010. Methodology. The survey was conducted through telephone interviews Interviews conducted from Dec. 3, 2009 to March 20, 2010 2,501 randomly selected Virginia youth ages 10 to 17 - PowerPoint PPT PresentationTRANSCRIPT

Virginia Obesity Survey Virginia Obesity Survey ResultsResults
Karen Remley, MD, MBA, FAAPKaren Remley, MD, MBA, FAAPState Health CommissionerState Health Commissioner
May 18, 2010May 18, 2010

MethodologyMethodology
The survey was conducted through telephone interviews– Interviews conducted from Dec. 3, 2009 to
March 20, 2010
2,501 randomly selected Virginia youth ages 10 to 17– When an eligible phone number was called, When an eligible phone number was called,
permission was obtained from a parent to permission was obtained from a parent to speak with a 10- to 17-year-old living in the speak with a 10- to 17-year-old living in the householdhousehold

WeightWeight
⅔ ⅔ of Virginia youth are healthy weightof Virginia youth are healthy weight
1 out of 5 Virginia kids are overweight or 1 out of 5 Virginia kids are overweight or obeseobese

Demographic DifferencesDemographic Differences
0
5
10
15
20
25
30
Female/Male White/Minorities
Gender
Race/Ethnicity


Weight and PerceptionWeight and Perception
Most youth believe they are right weightMost youth believe they are right weight
Youth correctly classify own weight 65% of the Youth correctly classify own weight 65% of the timetime
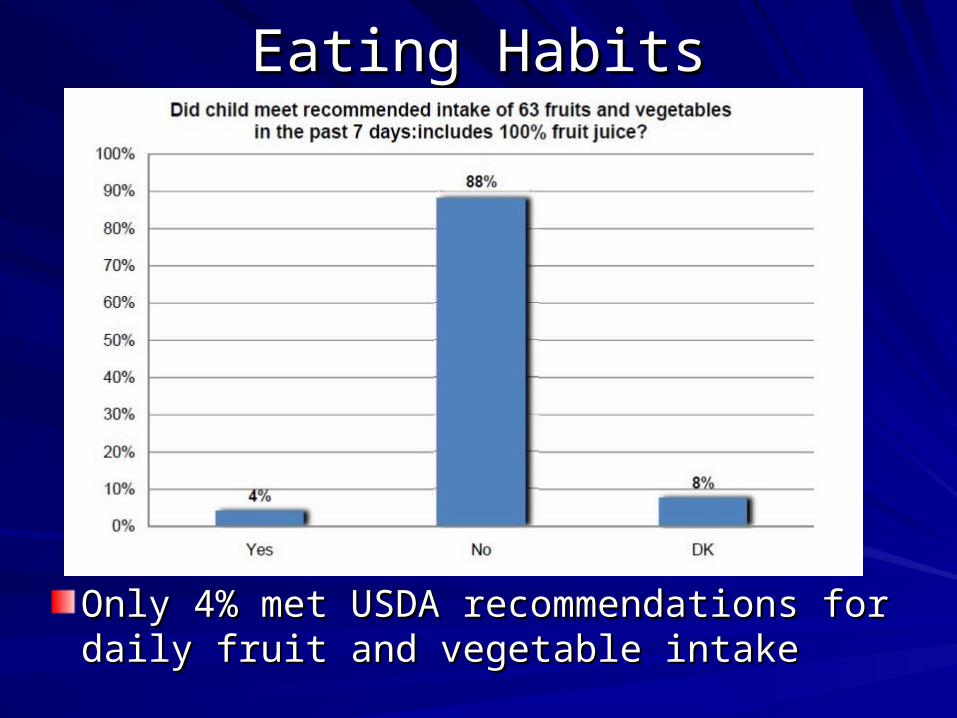
Eating HabitsEating Habits
Only 4% met USDA recommendations for Only 4% met USDA recommendations for daily fruit and vegetable intakedaily fruit and vegetable intake

Eating Habits: School LunchEating Habits: School Lunch
88% eat lunch every day88% eat lunch every day
59% buy lunch at school59% buy lunch at school– About a quarter (23%) have access to About a quarter (23%) have access to
fast food at schoolfast food at school
– Of those with fast food options, 54% eat Of those with fast food options, 54% eat fast food for lunch at least once a weekfast food for lunch at least once a week

Eating Habits: Fast FoodEating Habits: Fast Food
73% eat fast food at least once a week73% eat fast food at least once a week

Eating Habits: SnacksEating Habits: Snacks
92% eat chips or candy or drink soda at 92% eat chips or candy or drink soda at least once/weekleast once/week
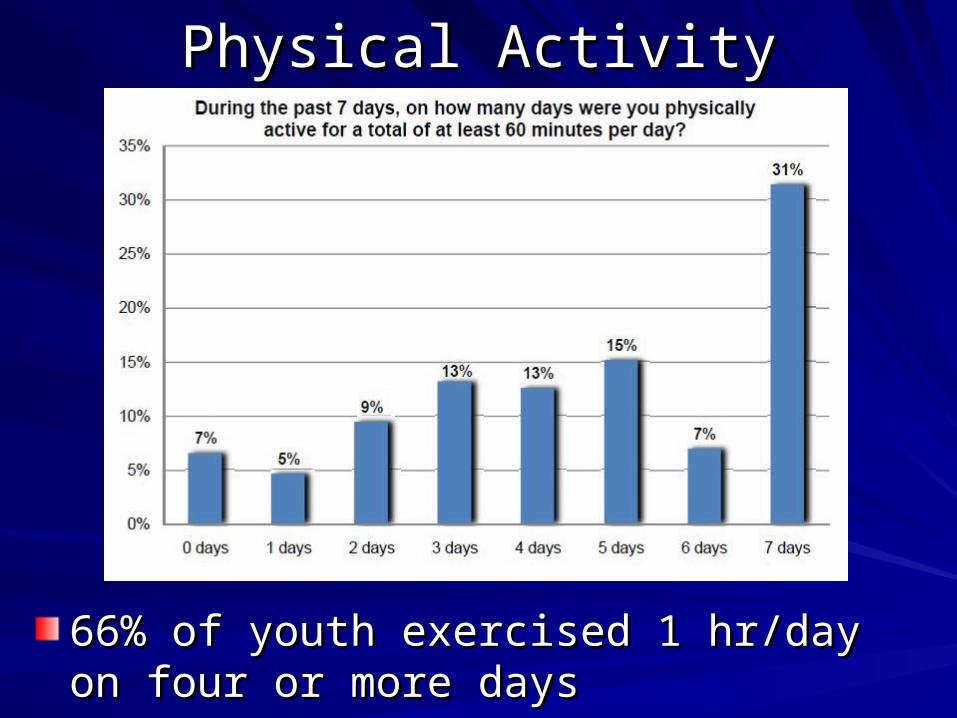
Physical ActivityPhysical Activity
66% of youth exercised 1 hr/day on four or 66% of youth exercised 1 hr/day on four or more daysmore days

Physical Activity: Screen TimePhysical Activity: Screen Time

Future DirectionsFuture Directions
The Virginia Youth Obesity survey The Virginia Youth Obesity survey provides valuable baseline obesity dataprovides valuable baseline obesity data
VFHY plans to continue collecting VFHY plans to continue collecting information on youth behaviors to information on youth behaviors to measure trends and progress in reducing measure trends and progress in reducing childhood obesity overtime childhood obesity overtime