virginia offshore wind port readiness evaluation · pdf filevirginia offshore wind port...
TRANSCRIPT

Commercial in confidence
Report 1: An evaluation of 10 Virginia ports
A report to the Virginia Department of Mines, Minerals and Energy Subtitle
Virginia offshore wind port readiness evaluation
Subtitle
April 2015
2
Document history
Revision Purpose and description Originated Checked Authorized Date
1 For client release AER CJN BAV 29 April 2015
2 Updated tables 6.1 - 6.17 AER CJN BAV 17 June 2015
BVG Associates
BVG Associates is a technical consultancy with expertise in wind and marine energy technologies. The team probably has the best
independent knowledge of the supply chain and market for wind turbines in the UK. BVG Associates has over 150 person years
experience in the wind industry, many of these being “hands on” with wind turbine manufacturers, leading RD&D, purchasing and
production departments. BVG Associates has consistently delivered to customers in many areas of the wind energy sector.
Apex Companies
Apex delivers planning, engineering, environmental, and consulting services to clients across the United States and abroad. Apex
has been at the forefront of port and site selection for the first purpose-build offshore wind support facility in the United Sates located
in New Bedford, Massachusetts.
Offshore Design Engineering
ODE is an international engineering contractor to the offshore oil, gas and renewable energy markets providing comprehensive
range of consultancy, engineering, project and construction management and O&M services. ODE have been involved in the
development of some 400MW of offshore wind encompassing a majority of current UK project, plus providing considerable ongoing
engineering and management support to North American and German markets.
Timmons group
Timmons group provides civil engineering, environmental, geotechnical, geospatial/GIS technology, landscape architecture and
surveying services to a diverse client base. Timmons Group is headquartered in Richmond, Virginia.
Global Wind Network
GLWN is an international supply chain advisory group with a mission to increase the domestic content of North America’s wind
energy installations, onshore and offshore. GLWN’s manufacturing engineering and wind supply chain expertise has been
significantly leveraged these past two years with key projects specific to offshore wind component production for the U.S.
Department of Energy, the National Renewable Energy Labs, Lawrence-Berkley Labs, the Massachusetts Clean Energy Center,
and the New Bedford (MA) Economic Development Council.
Clarendon Hill Consulting
CHC provides inter-disciplinary consulting services in environmental and urban planning, port infrastructure and vessel analysis for
the offshore wind industry and Geographical Information Systems (GIS), as well as general project management.
The views expressed in this report are those of BVG Associates and its partners. The content of this report does not necessarily
reflect the views of Virginia DMME.
Virginia offshore wind port readiness evaluation: Report 1
3
Contents
Contents ............................................................................................................................................................................................... 3
List of figures ........................................................................................................................................................................................ 4
Executive Summary .............................................................................................................................................................................. 8
1. Introduction ................................................................................................................................................................................. 10
2. Ports industry in Virginia ............................................................................................................................................................. 12
2.1. Current and recent uses .................................................................................................................................................... 12 2.2. Ownership of Virginia ports ................................................................................................................................................ 12
3. Methodology ............................................................................................................................................................................... 14
3.1. Industry requirement assessment ...................................................................................................................................... 14
3.2. Port parameter assessment ............................................................................................................................................... 14
3.3. Port evaluation ................................................................................................................................................................... 15
3.4. Implementation analysis .................................................................................................................................................... 15 4. Port requirements ....................................................................................................................................................................... 17
4.1. Vessels used in offshore wind port activities ...................................................................................................................... 19
4.2. Blade manufacturing .......................................................................................................................................................... 22
4.3. Generator manufacturing ................................................................................................................................................... 25
4.4. Nacelle assembly ............................................................................................................................................................... 27
4.5. Tower manufacturing ......................................................................................................................................................... 30
4.6. Foundation manufacturing ................................................................................................................................................. 33
4.7. Submarine cable manufacturing ........................................................................................................................................ 36
4.8. Substation manufacturing .................................................................................................................................................. 39
4.9. Construction staging .......................................................................................................................................................... 41
5. Port evaluation ............................................................................................................................................................................ 44
5.1. Portsmouth Marine Terminal .............................................................................................................................................. 46
5.2. Newport News Marine Terminal ......................................................................................................................................... 48 5.3. Cape Charles Harbor ......................................................................................................................................................... 50
5.4. Norfolk Southern Lamberts Point ....................................................................................................................................... 52
5.5. Peck Marine Terminal ........................................................................................................................................................ 54
5.6. BASF James City ............................................................................................................................................................... 56
5.7. Gravel Neck ....................................................................................................................................................................... 58
5.8. Virginia Renaissance Center ............................................................................................................................................. 60
5.9. Steel Street, Chesapeake .................................................................................................................................................. 62 5.10. BASF Portsmouth .............................................................................................................................................................. 64
5.11. Commercial shipyard capabilities for substation manufacturing ........................................................................................ 66
6. Implementation ........................................................................................................................................................................... 68
6.1. Portsmouth Marine Terminal .............................................................................................................................................. 70
6.2. Newport News Marine Terminal ......................................................................................................................................... 78
6.3. Peck Marine Terminal ........................................................................................................................................................ 86 6.4. Virginia Renaissance Center ............................................................................................................................................. 92
6.5. BASF Portsmouth .............................................................................................................................................................. 95
Appendix A : Estimates used for implementation analysis ................................................................................................................ 103
Overview ................................................................................................................................................................................... 103
Repair costs for existing port infrastructure ............................................................................................................................... 103
Ground bearing capacity ........................................................................................................................................................... 103
4
Ground strength improvements................................................................................................................................................. 104
Navigational access .................................................................................................................................................................. 105
Timeline and labor assumptions ............................................................................................................................................... 105
List of figures
Figure 1.1 Map showing the ports considered in the evaluation. ........................................................................................................ 11
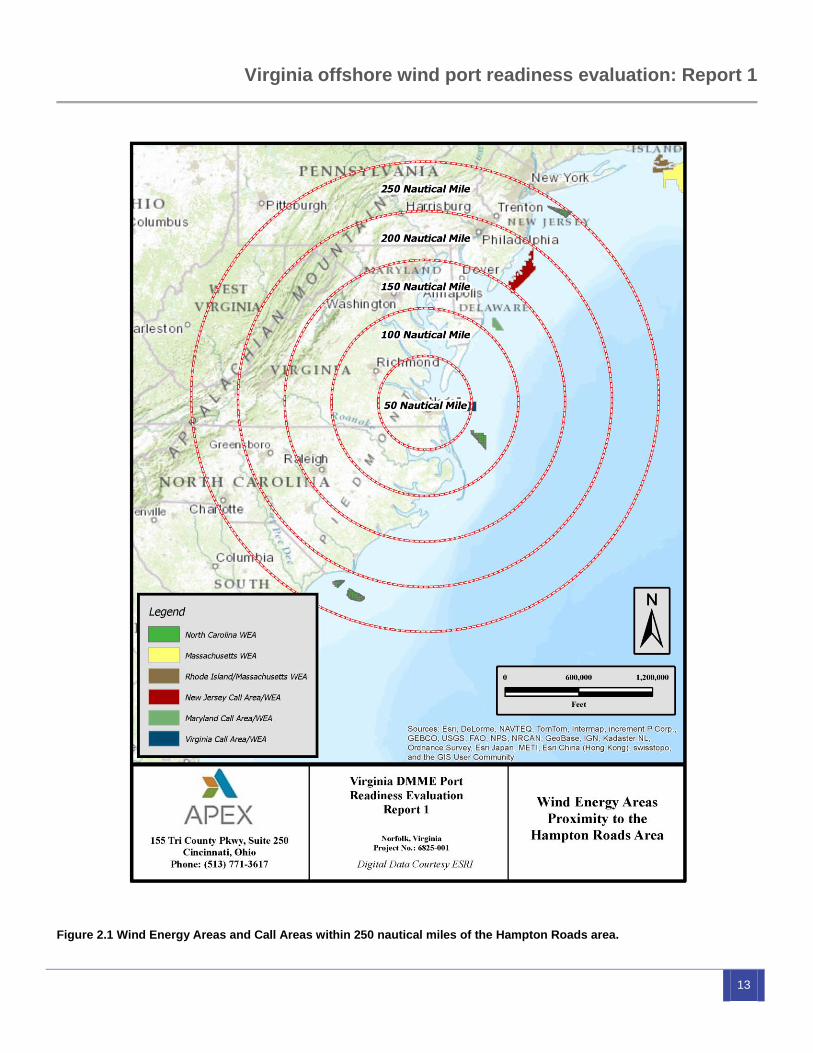
Figure 2.1 Wind Energy Areas and Call Areas within 250 nautical miles of the Hampton Roads area. .............................................. 13
Figure 4.1 Jack-up vessel Swire Blue Ocean Pacific Osprey. ............................................................................................................ 19
Figure 4.2 General cargo vessel BBC Amber. .................................................................................................................................... 19
Figure 4.3 Foss Maritime tug and ocean service barge. ..................................................................................................................... 20
Figure 4.4 Cable lay vessel Van Oord Nexus. .................................................................................................................................... 20
Figure 4.5 Offshore heavy-lift derrick EP Paup. .................................................................................................................................. 21
Figure 4.6 Offshore heavy-lift derrick Stanislav Yudin. ....................................................................................................................... 21
Figure 4.7 The Senvion offshore wind blade factory (foreground) in Bremerhaven, Germany. .......................................................... 24
Figure 4.8 Alstom’s offshore wind generator manufacturing assembly facility in Saint Nazaire, France. ............................................ 29
Figure 4.9 Ambau’s offshore tower factory in Cuxhaven, Germany. ................................................................................................... 32
Figure 4.10 Smulders’ offshore wind foundation factory in Hoboken, Belgium. .................................................................................. 35
Figure 4.11 Prysmian’s high voltage cable factory in Pikkala, Finland. ............................................................................................... 38
Figure 4.12 Heerema’s yard in Hartlepool, UK during the fabrication of two conventional substations for the Sheringham Shoal wind
farm in the UK. .................................................................................................................................................................................... 40
Figure 4.13. Keppel Verolme’s main dock in Rotterdam, Netherlands during the manufacturing of the self-Installing substation for the
Global Tech 1 wind farm in Germany. ................................................................................................................................................ 40
Figure 4.14 Construction staging at Belfast, Northern Ireland during the construction of the UK West of Duddon Sands wind farm. 43
Figure 5.1 Aerial photograph of Portsmouth Marine Terminal. ........................................................................................................... 47
Figure 5.2 Aerial photograph of Newport News Marine Terminal. ...................................................................................................... 49
Figure 5.3 Aerial photograph of Cape Charles Harbor. ....................................................................................................................... 51
Figure 5.4 An aerial photograph of Norfolk Southern Lamberts Point. ................................................................................................ 53
Figure 5.5 Aerial photograph of Peck Marine Terminal. ...................................................................................................................... 55
Figure 5.6 Aerial photograph of BASF James City. ............................................................................................................................ 57
Figure 5.7 Aerial photograph of Gravel Neck. The red line shows the site boundary. ........................................................................ 59
Figure 5.8 Aerial photograph of Virginia Renaissance Center. ........................................................................................................... 61
Figure 5.9 Aerial photograph of Steel Street Chesapeake. The red line shows the site boundary. .................................................... 63
Figure 5.10 An aerial photograph of BASF Portsmouth. ..................................................................................................................... 65

Virginia offshore wind port readiness evaluation: Report 1
5
List of tables
Table 1.1 Reports produced as part of the Virginia offshore wind port readiness evaluation study. ................................................... 10
Table 2.1 Ownership and current use of the evaluated ports.............................................................................................................. 12
Table 3.1 Grading of port suitability for each offshore wind activity. ................................................................................................... 15
Table 4.1 High-level port requirements for each activity. .................................................................................................................... 18
Table 4.2 Principal particulars of a jack up vessel. ............................................................................................................................. 19
Table 4.3 Principal particulars of a general cargo vessel. ................................................................................................................... 19
Table 4.4 Principal particulars of an ocean service barge .................................................................................................................. 20
Table 4.5 Principal particulars of a cable lay vessel. .......................................................................................................................... 20
Table 4.6 Principal particulars of an offshore heavy-lift derrick. .......................................................................................................... 21
Table 4.7 Optimal blade manufacturing port parameters (100 sets per year). .................................................................................... 23
Table 4.8 Optimal generator manufacturing port parameters (100 units per year). ............................................................................ 26
Table 4.9 Optimal nacelle assembly port parameters (100 units per year). ........................................................................................ 28
Table 4.10 Optimal tower manufacturing port parameters (100 units per year). ................................................................................. 31
Table 4.11 Optimal foundation manufacturing and staging port parameters (100 units per year)....................................................... 34
Table 4.12 Optimal cable manufacturing port parameters (150km per year) ...................................................................................... 37
Table 4.13 Optimal substation manufacturing port parameters (two units per year) ........................................................................... 39
Table 4.14 Optimal construction staging port parameters (100 sets per year).................................................................................... 42
Table 5.1 Summary evaluation of the ports. ....................................................................................................................................... 45
Table 5.2 Overview of the readiness of Portsmouth Marine Terminal. ............................................................................................... 46
Table 5.3 Readiness of Portsmouth Marine Terminal for different offshore wind activities. ................................................................ 46
Table 5.4 Overview of the readiness of Newport News Marine Terminal ........................................................................................... 48
Table 5.5 Readiness of Newport News Marine Terminal for different offshore wind activities. ........................................................... 48
Table 5.6 Overview of the readiness of Cape Charles Harbor. ........................................................................................................... 50
Table 5.7 Readiness of Cape Charles Harbor for different offshore wind activities. ........................................................................... 50
Table 5.8 Overview of the readiness of Norfolk Southern Lamberts Point. ......................................................................................... 52
Table 5.9 Readiness of Norfolk Southern Lamberts Point for different offshore wind activities. ......................................................... 52
Table 5.10 Overview of the readiness of Peck Marine Terminal. ........................................................................................................ 54
Table 5.11 Readiness of Peck Marine Terminal for different offshore wind activities. ........................................................................ 54
Table 5.12 Overview of the readiness of BASF James City................................................................................................................ 56
Table 5.13 Readiness of BASF James City for different offshore wind activities. ............................................................................... 56
Table 5.14 Overview of the readiness of Gravel Neck ........................................................................................................................ 58
Table 5.15 Readiness of Gravel Neck for different offshore wind activities. ....................................................................................... 58
Table 5.16 Overview of the readiness of Virginia Renaissance Center. ............................................................................................. 60
Table 5.17 Readiness of Virginia Renaissance Center for different offshore wind activities. .............................................................. 60
6
Table 5.18 Overview of the readiness of Steel Street Chesapeake .................................................................................................... 62
Table 5.19 Readiness of Steel Street Chesapeake for different offshore wind activities. ................................................................... 62
Table 5.20 Overview of the readiness of BASF Portsmouth. .............................................................................................................. 64
Table 5.21 Readiness of BASF Portsmouth for different offshore wind activities. .............................................................................. 64
Table 5.22 Evaluation of commercial shipbuilding capabilities for self-installing and conventional substation manufacturing. ........... 67
Table 6.1 Summary of implementation analysis. ................................................................................................................................ 69
Table 6.2 Implementation summary for Portsmouth Marine Terminal. ............................................................................................... 70
Table 6.3 Implementation estimates for blade manufacturing at Portsmouth Marine Terminal........................................................... 71
Table 6.4 Implementation estimates for generator manufacturing at Portsmouth Marine Terminal. ................................................... 72
Table 6.5 Implementation estimates for nacelle assembly at Portsmouth Marine Terminal. .............................................................. 73
Table 6.6 Implementation estimates for tower manufacturing at Portsmouth Marine Terminal........................................................... 74
Table 6.7 Implementation estimates for foundation manufacturing and staging at Portsmouth Marine Terminal. .............................. 75
Table 6.8 Implementation estimates for cable manufacturing at Portsmouth Marine Terminal. .......................................................... 76
Table 6.9 Implementation estimates for construction staging at Portsmouth Marine Terminal. .......................................................... 77
Table 6.10 Implementation summary for Newport News Marine Terminal. ........................................................................................ 78
Table 6.11 Implementation estimates for blade manufacturing at Newport News Marine Terminal. ................................................... 79
Table 6.12 Implementation estimates for generator manufacturing at Newport News Marine Terminal. ............................................ 80
Table 6.13 Implementation estimates for nacelle assembly at Newport News Marine Terminal......................................................... 81
Table 6.14 Implementation estimates for tower manufacturing at Newport News Marine Terminal. ................................................... 82
Table 6.15 Implementation estimates for foundation manufacturing and staging at Newport News Marine Terminal. ....................... 83
Table 6.16 Implementation estimates for cable manufacturing at Newport News Marine Terminal. ................................................... 84
Table 6.17 Implementation estimates for construction staging at Newport News Marine Terminal. ................................................... 85
Table 6.18 Implementation summary for Peck Marine Terminal. ........................................................................................................ 86
Table 6.19 Implementation estimates for blade manufacturing at Peck Marine Terminal. .................................................................. 87
Table 6.20 Implementation estimates for generator manufacturing at Peck Marine Terminal. ........................................................... 88
Table 6.21 Implementation estimates for nacelle assembly at Peck Marine Terminal. ....................................................................... 89
Table 6.22 Implementation estimates for tower manufacturing at Peck Marine Terminal. .................................................................. 90
Table 6.23 Implementation estimates for cable manufacturing at Peck Marine Terminal. .................................................................. 91
Table 6.24 Implementation summary for Peck Marine Terminal. ........................................................................................................ 92
Table 6.25 Implementation estimates for blade manufacturing at Virginia Renaissance Center. ....................................................... 93
Table 6.26 Implementation estimates for cable manufacturing at Virginia Renaissance Center......................................................... 94
Table 6.27 Implementation summary for BASF Portsmouth. .............................................................................................................. 95
Table 6.28 Implementation estimates for blade manufacturing at BASF Portsmouth. ........................................................................ 96
Table 6.29 Implementation estimates for generator manufacturing at BASF Portsmouth. ................................................................. 97
Table 6.30 Implementation estimates for nacelle assembly at BASF Portsmouth. ............................................................................. 98
Table 6.31 Implementation estimates for tower manufacturing at BASF Portsmouth. ........................................................................ 99

Virginia offshore wind port readiness evaluation: Report 1
7
Table 6.32 Implementation estimates for foundation manufacturing and staging at BASF Portsmouth. ........................................... 100
Table 6.33 Implementation estimates for cable manufacturing at BASF Portsmouth. ...................................................................... 101
Table 6.34 Implementation estimates for construction staging at BASF Portsmouth. ....................................................................... 102

8
Executive Summary
BVG Associates led a team commissioned by The Virginia
Department of Mines, Minerals and Energy to evaluate 10
Virginia ports for their readiness to accommodate seven
different offshore wind manufacturing and construction
activities:
Blade manufacturing
Generator manufacturing
Nacelle assembly
Tower manufacturing
Foundation manufacturing
Submarine cable manufacturing, and
Construction staging.
The team also evaluated five Virginia commercial shipyards
for their readiness to manufacture offshore substations.
This report is one of three in this study. The other two other
reports present port utilization scenarios for offshore wind
manufacturing and staging and high-impact investment
opportunities.
Drawing on intelligence from established offshore wind
industry suppliers, we developed a set of optimal
requirements for each offshore wind activity. The
requirements included the waterside infrastructure, the
onshore infrastructure for the activities themselves and the
access requirements for vessels associated with offshore
wind activities. They excluded the buildings or equipment that
would be used for each activity.
Virginia has a thriving port and shipbuilding sector and the
ports were chosen by Virginia DMME as having significant
available areas of land adjacent to quaysides. Other ports are
likely to be suitable for offshore wind activities if they become
available.
Through dialog with property owners, site visits and desktop
research, we built up a database of characteristics for the 10
ports. We then assessed the readiness of each port for each
offshore wind activity in turn.
For some activities in some ports, necessary upgrades are
either unfeasible or likely to be uneconomic. In these cases,
we did no further evaluation.
Although offshore wind activity is more demanding on port
infrastructure than many other commercial port activities,
Virginia’s ports offer a high level of readiness. We concluded
that five ports have a realistic potential to be used for one or
more offshore wind activities. These were:
Portsmouth Marine Terminal
Newport News Marine Terminal
Peck Marine Terminal
Virginia Renaissance Center, and
BASF Portsmouth.
Each of the ports requires upgrades to meet offshore wind
requirements. This report provides details of the required
upgrades specific to each activity at each port. These
upgrades are summarized in Table 0.1.
Portsmouth and Newport News Marine Terminals
PMT and NNMT have the highest level of port readiness.
They each have sufficient space to accommodate multiple,
co-located offshore wind activities, making them candidates
for a future offshore wind manufacturing and deployment
hub. The necessary upgrades to meet offshore wind
requirements would cost up to $10 million at each port.
Peck Marine Terminal
Peck has the space and vessel access to accommodate
many of the offshore wind manufacturing activities. Overhead
navigational clearance precludes using Peck for foundation
manufacturing and construction staging. Necessary
upgrades at Peck would cost up to $14 million.
Virginia Renaissance Center
VRC has a high level of readiness but faces navigation
constraints. Blade manufacturing and submarine cable
manufacturing could be located at VRC and necessary
upgrades would cost up to $5 million.
BASF Portsmouth
BASF Portsmouth represents an opportunity to develop new
port infrastructure and would require a larger investment of
$8 million to $45 million.
Commercial Shipyards
We concluded that five Virginia shipyards are capable of
manufacturing conventional offshore substations without
further infrastructure investment. Two of these facilities had
dry docks suitable for manufacturing self-installing
substations.
.
Virginia offshore wind port readiness evaluation: Report 1
9
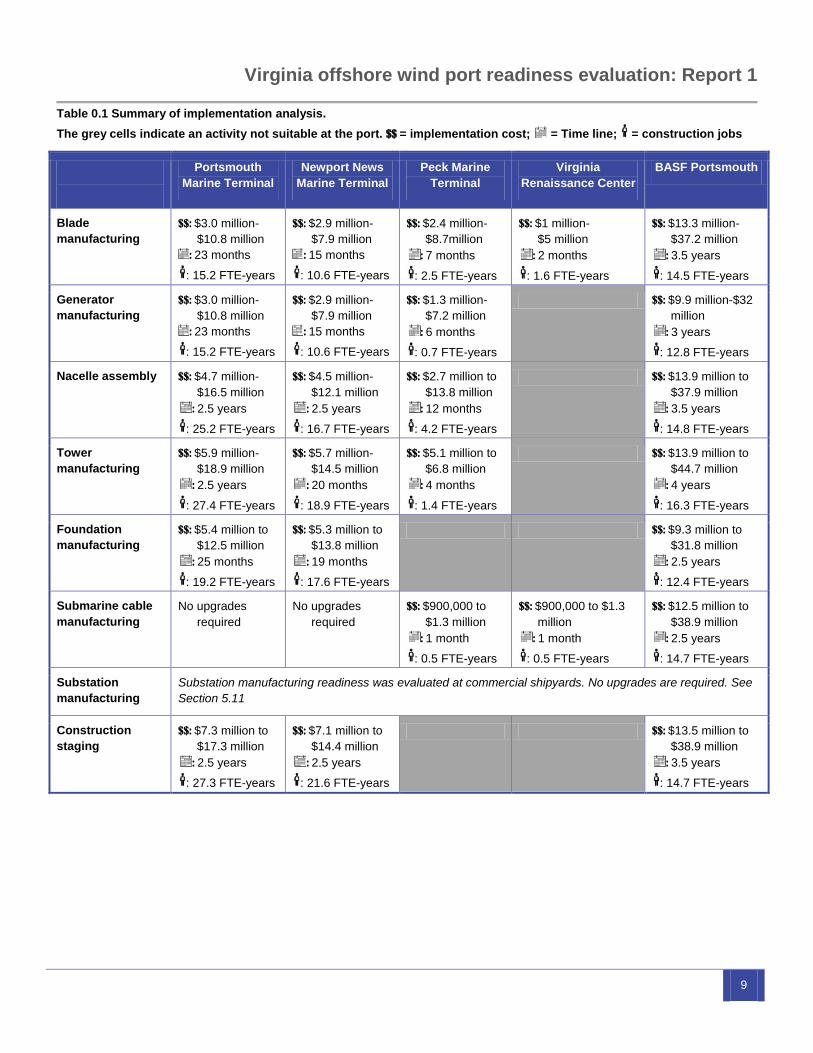
Table 0.1 Summary of implementation analysis.
The grey cells indicate an activity not suitable at the port. $$ = implementation cost; = Time line; = construction jobs
Portsmouth
Marine Terminal
Newport News
Marine Terminal
Peck Marine
Terminal
Virginia
Renaissance Center
BASF Portsmouth
Blade
manufacturing
$$: $3.0 million-
$10.8 million
: 23 months
: 15.2 FTE-years
$$: $2.9 million-
$7.9 million
: 15 months
: 10.6 FTE-years
$$: $2.4 million-
$8.7million
: 7 months
: 2.5 FTE-years
$$: $1 million-
$5 million
: 2 months
: 1.6 FTE-years
$$: $13.3 million-
$37.2 million
: 3.5 years
: 14.5 FTE-years
Generator
manufacturing
$$: $3.0 million-
$10.8 million
: 23 months
: 15.2 FTE-years
$$: $2.9 million-
$7.9 million
: 15 months
: 10.6 FTE-years
$$: $1.3 million-
$7.2 million
: 6 months
: 0.7 FTE-years
$$: $9.9 million-$32
million
: 3 years
: 12.8 FTE-years
Nacelle assembly $$: $4.7 million-
$16.5 million
: 2.5 years
: 25.2 FTE-years
$$: $4.5 million-
$12.1 million
: 2.5 years
: 16.7 FTE-years
$$: $2.7 million to
$13.8 million
: 12 months
: 4.2 FTE-years
$$: $13.9 million to
$37.9 million
: 3.5 years
: 14.8 FTE-years
Tower
manufacturing
$$: $5.9 million-
$18.9 million
: 2.5 years
: 27.4 FTE-years
$$: $5.7 million-
$14.5 million
: 20 months
: 18.9 FTE-years
$$: $5.1 million to
$6.8 million
: 4 months
: 1.4 FTE-years
$$: $13.9 million to
$44.7 million
: 4 years
: 16.3 FTE-years
Foundation
manufacturing
$$: $5.4 million to
$12.5 million
: 25 months
: 19.2 FTE-years
$$: $5.3 million to
$13.8 million
: 19 months
: 17.6 FTE-years
$$: $9.3 million to
$31.8 million
: 2.5 years
: 12.4 FTE-years
Submarine cable
manufacturing
No upgrades
required
No upgrades
required
$$: $900,000 to
$1.3 million
: 1 month
: 0.5 FTE-years
$$: $900,000 to $1.3
million
: 1 month
: 0.5 FTE-years
$$: $12.5 million to
$38.9 million
: 2.5 years
: 14.7 FTE-years
Substation
manufacturing
Substation manufacturing readiness was evaluated at commercial shipyards. No upgrades are required. See
Section 5.11
Construction
staging
$$: $7.3 million to
$17.3 million
: 2.5 years
: 27.3 FTE-years
$$: $7.1 million to
$14.4 million
: 2.5 years
: 21.6 FTE-years
$$: $13.5 million to
$38.9 million
: 3.5 years
: 14.7 FTE-years
10
1. Introduction
Virginia Department of Mines, Minerals and Energy (DMME)
commissioned BVG Associates (BVGA) and its partners to
evaluate the readiness of Virginia’s ports to support offshore
wind farm manufacturing and construction.
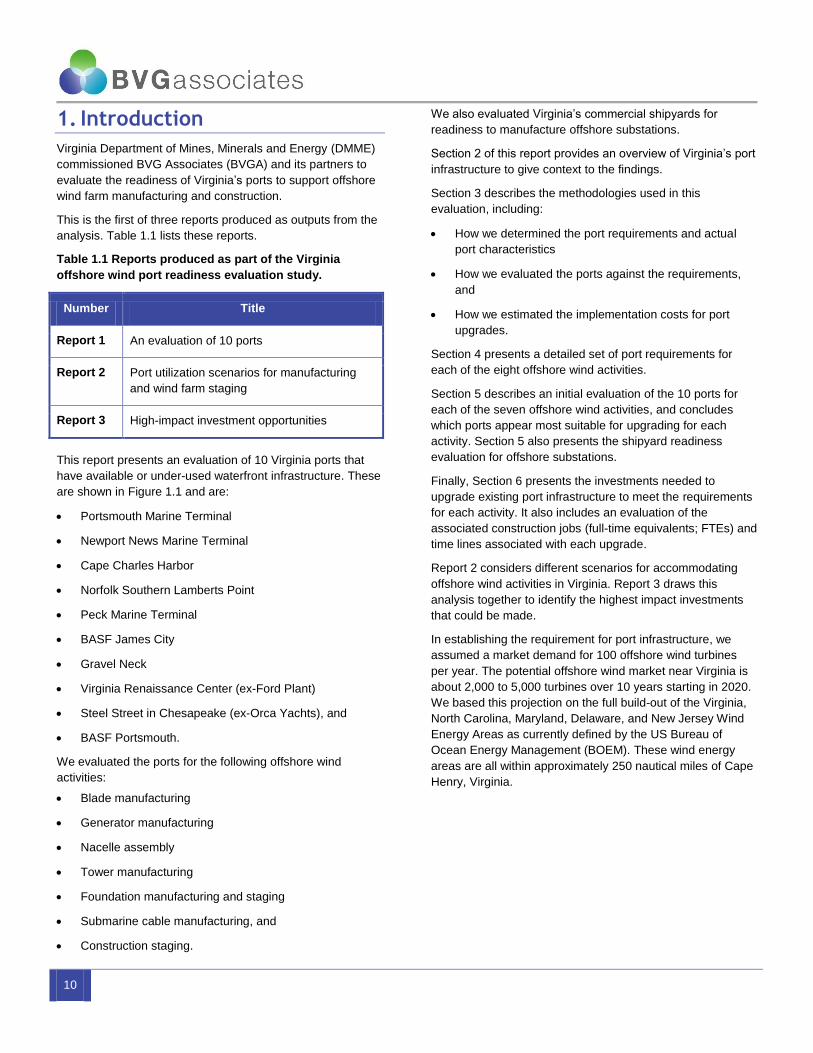
This is the first of three reports produced as outputs from the
analysis. Table 1.1 lists these reports.
Table 1.1 Reports produced as part of the Virginia
offshore wind port readiness evaluation study.
Number Title
Report 1 An evaluation of 10 ports
Report 2 Port utilization scenarios for manufacturing
and wind farm staging
Report 3 High-impact investment opportunities
This report presents an evaluation of 10 Virginia ports that
have available or under-used waterfront infrastructure. These
are shown in Figure 1.1 and are:
Portsmouth Marine Terminal
Newport News Marine Terminal
Cape Charles Harbor
Norfolk Southern Lamberts Point
Peck Marine Terminal
BASF James City
Gravel Neck
Virginia Renaissance Center (ex-Ford Plant)
Steel Street in Chesapeake (ex-Orca Yachts), and
BASF Portsmouth.
We evaluated the ports for the following offshore wind
activities:
Blade manufacturing
Generator manufacturing
Nacelle assembly
Tower manufacturing
Foundation manufacturing and staging
Submarine cable manufacturing, and
Construction staging.
We also evaluated Virginia’s commercial shipyards for
readiness to manufacture offshore substations.
Section 2 of this report provides an overview of Virginia’s port
infrastructure to give context to the findings.
Section 3 describes the methodologies used in this
evaluation, including:
How we determined the port requirements and actual
port characteristics
How we evaluated the ports against the requirements,
and
How we estimated the implementation costs for port
upgrades.
Section 4 presents a detailed set of port requirements for
each of the eight offshore wind activities.
Section 5 describes an initial evaluation of the 10 ports for
each of the seven offshore wind activities, and concludes
which ports appear most suitable for upgrading for each
activity. Section 5 also presents the shipyard readiness
evaluation for offshore substations.
Finally, Section 6 presents the investments needed to
upgrade existing port infrastructure to meet the requirements
for each activity. It also includes an evaluation of the
associated construction jobs (full-time equivalents; FTEs) and
time lines associated with each upgrade.
Report 2 considers different scenarios for accommodating
offshore wind activities in Virginia. Report 3 draws this
analysis together to identify the highest impact investments
that could be made.
In establishing the requirement for port infrastructure, we
assumed a market demand for 100 offshore wind turbines
per year. The potential offshore wind market near Virginia is
about 2,000 to 5,000 turbines over 10 years starting in 2020.
We based this projection on the full build-out of the Virginia,
North Carolina, Maryland, Delaware, and New Jersey Wind
Energy Areas as currently defined by the US Bureau of
Ocean Energy Management (BOEM). These wind energy
areas are all within approximately 250 nautical miles of Cape
Henry, Virginia.
Virginia offshore wind port readiness evaluation: Report 1
11
We based our evaluation on detailed consultation with
experienced industry suppliers. We are grateful to the
following companies that contributed:
Alstom Power
Blade Dynamics
Bladt
Gamesa
Keystone Engineering
LM Wind Power
MHI Vestas Offshore Wind
Oceaneering
Prysmian, and
Senvion.
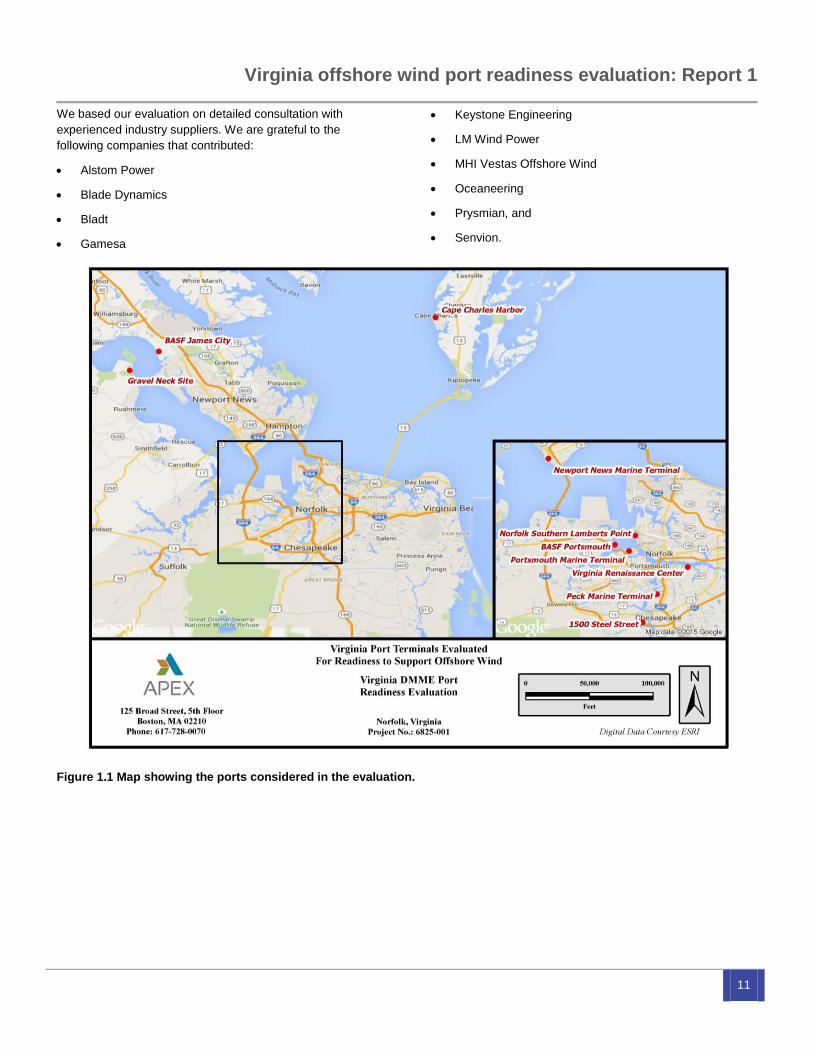
Figure 1.1 Map showing the ports considered in the evaluation.
12
2. Ports industry in Virginia
2.1. Current and recent uses
The Commonwealth of Virginia has thriving, world-class
military and commercial ports. Commercial ports handle
containers, bulk commodities, roll-on/roll-off cargo, and inter-
modal transshipment (ship-to-train). Shipbuilding, primarily
military, is also flourishing in Virginia.
Many of Virginia’s ports have naturally deep water,
unobstructed access to the open sea, or both. Waterfront
facilities of every shape, size, and development level can be
found in the Hampton Roads area and further inland along
the James River and Elizabeth River.
Some ports are decommissioned industrial sites used for
such purposes as textile manufacturing, automotive
manufacturing, oil storage and yacht building. Others are
undeveloped green field sites. There are also highly
developed container terminals and ship-to-rail facilities.
2.2. Ownership of Virginia ports
Virginia ports are under both public and private ownership.
The Virginia Port Authority, “a component of the
Commonwealth of Virginia”, controls three publically owned
major marine terminals and leases these to private operators.
These public facilities offer an opportunity for major public-
private partnerships that could lead to offshore wind “super-
ports” in which wind turbines are loaded directly onto
specialist offshore installation vessels. Realizing these
opportunities will require investment in the ports and may
require changes to the current port leasing business model.
Virginia also has many privately owned ports and maritime
facilities such as shipyards. Some are thriving, some are
under-used, and others are vacant or completely
undeveloped. Some of these privately owned sites are being
actively marketed for lease or sale and therefore may offer a
good route for establishing offshore wind manufacturing and
construction support facilities in Virginia.
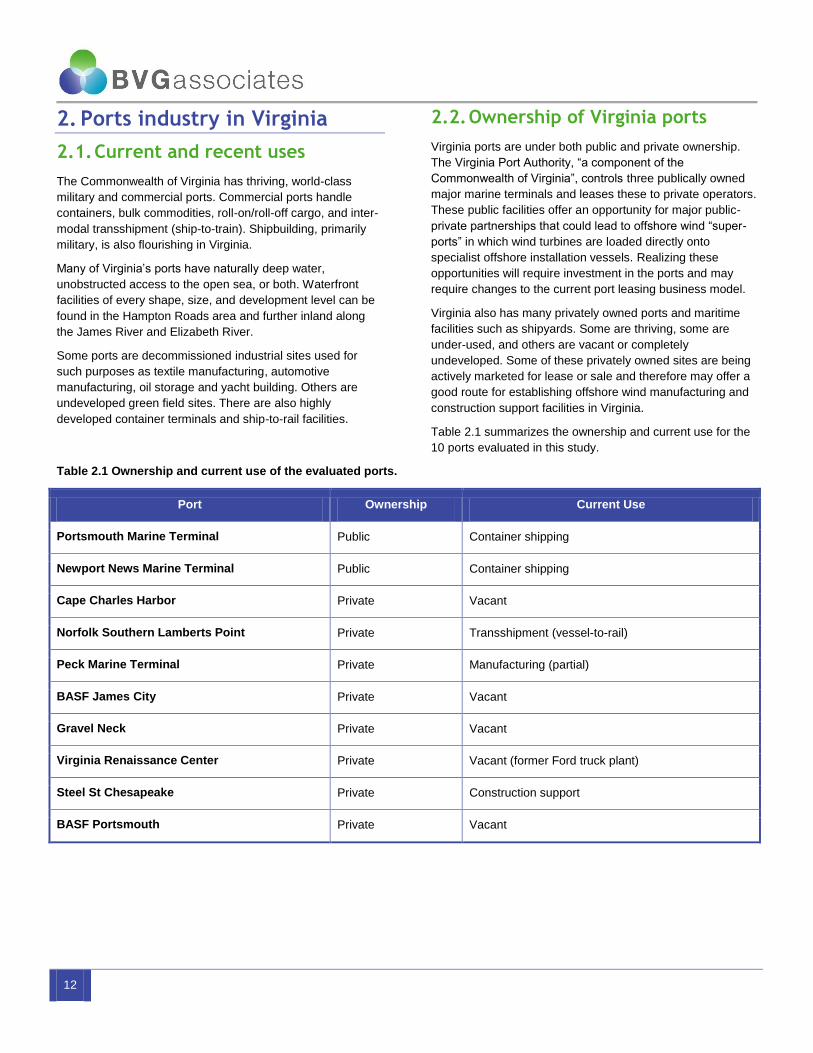
Table 2.1 summarizes the ownership and current use for the
10 ports evaluated in this study.
Table 2.1 Ownership and current use of the evaluated ports.
Port Ownership Current Use
Portsmouth Marine Terminal Public Container shipping
Newport News Marine Terminal Public Container shipping
Cape Charles Harbor Private Vacant
Norfolk Southern Lamberts Point Private Transshipment (vessel-to-rail)
Peck Marine Terminal Private Manufacturing (partial)
BASF James City Private Vacant
Gravel Neck Private Vacant
Virginia Renaissance Center Private Vacant (former Ford truck plant)
Steel St Chesapeake Private Construction support
BASF Portsmouth Private Vacant
Virginia offshore wind port readiness evaluation: Report 1
13
Figure 2.1 Wind Energy Areas and Call Areas within 250 nautical miles of the Hampton Roads area.
14
3. Methodology
We evaluated 10 ports for this study. Virginia DMME chose
nine of these based on earlier analysis. We identified three
additional ports that were available, had waterfront access
and greater than 80,000m2 of space. These were BASF
Portsmouth, Chesapeake Deepwater Terminal, and CSX
Piers 14 and 15.
In discussion with Virginia DMME, we added BASF
Portsmouth to this evaluation since it represented a unique
opportunity to create new port infrastructure. Chesapeake
Deepwater and CSX Piers 14 and 15 were not included since
they were similar to other ports under consideration.
We undertook the evaluation in four main stages:
1. Industry requirement assessment, in which we:
a. Developed port requirements for each of the eight
activities based on our collective knowledge and
experience
b. Gathered detailed input from each of our industry
partners
2. Port parameter assessment, in which we:
a. Undertook desk-based research
b. Gathered outstanding information
c. Undertook site visits
3. Evaluation, in which we:
a. Screened ports for potential use
b. Made interim conclusions, and
4. Implementation analysis, in which we:
a. Estimated implementation costs and time lines for
necessary port upgrades and improvements.
3.1. Industry requirement
assessment
We based the port requirements on manufacturing and
constructing 100 units per year. Turbines installed in US east
coast waters over the next 10 years are likely to have a rated
capacity of between 5MW and 8MW and have a rotor
diameter of between 130m and 180m (blade length between
about 63m and 83m). There are significant cost benefits of
larger turbines and we therefore assumed that demand will
be at the upper end of this range when defining
requirements.
For the foundations, we assumed that space frame structures
such as jackets will be made as these are likely to be the
technology choice for Mid-Atlantic wind farms. Monopile
manufacturing does not have more demanding infrastructure
requirements than jacket manufacturing.
We assumed that the average array link will be 1.7km (10
times the rotor diameter).
Export cable requirements are based on an interconnection
distance of 55km.
For quayside and water access requirements, we assumed
that the vessels used to support manufacturing and
construction in Virginia are similar to those that will be used
in Europe from 2016. We present an overview of these
vessel types in Section 4.1.
We chose port parameters to align with Department of
Energy (DOE) Port Readiness Database, so the data we
gathered in this project would be consistent.
Focus areas were:
Waterside infrastructure
Water depth
Road and rail access
Utility connections, and
General site condition.
For substations, we assumed that orders would be placed
with commercial shipyards (or offshore fabrication yards) and
that new, bespoke manufacturing facilities will not be
developed. We therefore evaluated the readiness of
Virginia’s existing commercial shipbuilding sites to build two
substations per year.
For the eight activities, we undertook a two-stage process to
capture the port infrastructure and waterway requirements
needed by industry tenants:
1. Aggregated the considerable existing knowledge of the
project team, then
2. Filled knowledge gaps and validated data through
targeted questionnaires and discussions with industry.
Existing offshore wind manufacturing and construction
facilities have rarely been designed exclusively for the sector.
Also, some compromises are inevitable in selecting a site.
Significant variations in the specifications of existing facilities
are therefore likely and it was necessary to consolidate the
data we gathered and choose a reasonable value or range of
values for each parameter to cover most likely medium-term
needs.
3.2. Port parameter assessment
We researched the parameters for each of the 10 Virginia
ports, in three stages:

Virginia offshore wind port readiness evaluation: Report 1
15
1. Desktop research
2. Interviews with port owners, and
3. Site visits.
Desktop research focused on publicly available reports, GIS
data, National Oceanic and Atmospheric Administration
(NOAA) navigational charts, marketing materials and
information provided from port operators and users.
We approached port owners initially through a letter from
Virginia DMME presenting the project team and requesting
interviews. Through this engagement and follow-up
correspondence, we gathered more background data, gained
a better understand the current uses, and identified the key
contacts for setting up site visits.
We made site visits in February 2015. Each visit lasted two to
five hours and focused on acquiring better documentation of
the condition of the existing infrastructure, reviewing current
operations, talking with on-site personnel, and gaining an on-
the ground perspective.
We were unable to gather detailed data on subsurface
conditions, particularly ground strength and quayside
conditions, which are important factors in offshore wind
development ports. Instead, we made assumptions about
ground strength based on current uses and anecdotal
information. These assumptions are noted in Section 6.
We were unable to gain access to the Gravel Neck Site and
the Virginia Renaissance Center within the required time line
of this evaluation. Instead, we made our assessment by
visiting adjacent properties. We also corresponded with the
key personnel for each of these properties who were able to
provide useful information. We were also unable to visit the
Norfolk Southern Lambert’s Point facility due to lack of
availability of on-site personnel, but did we correspond with
its general manager.
3.3. Port evaluation
We convened a team workshop to conduct a review of the
suitability of each port for each offshore wind activity. We
graded each combination using the criteria in Table 3.1
Table 3.1 Grading of port suitability for each offshore
wind activity.
Grade Definition Examples of constraint or
work needed
Green Site is suitable for
the activity with
minimal upgrade
Resurfacing
Yellow Site is suitable for
the activity with
significant
upgrade
Maintenance dredging
Targeted improvement
dredging
Strengthening of existing
waterside infrastructure
Defined-scope
environmental
remediation
Orange Site is suitable for
the activity with
major upgrade
New waterside
infrastructure
Extensive improvement
dredging
Full green-field
development
Red Site is unsuitable
for the activity
Air draft limitation
Insufficient space
Water depth (dredging
disallowed or impractical)
We presented this evaluation to Virginia DMME in a face-to-
face meeting and agreed that we would not undertake the
implementation analysis for site-activity combinations rated
orange or red.
3.4. Implementation analysis
For each site rated green or yellow for an offshore wind
activity, we calculated the costs, time lines and construction
jobs for completing necessary infrastructure upgrades. We
did not address the cost of building and outfitting the
manufacturing facilities, as these costs are dependent on
each manufacturer’s preference.
We calculated the cost of upgrading a port to meet a wind
industry manufacturer’s needs without being over-specified,
that is, the upgraded ports are “optimal”.
The upgrades included the following construction activities:
16
Repair of existing infrastructure to current specification
Ground strength improvements
Pier and quayside improvements, and
Dredging.
Costs
For each activity at each site, we compared the port
requirements to the actual conditions to develop a work
scope for infrastructure upgrades.
Due to uncertainty in ground bearing strength, we considered
two strategies:
Spread point loads across a larger area using cross-
laminated timbers, and
Repair or replace pier supports and decking.
We also considered the use of plastic materials, for example
those made by Cultec, for areas requiring infill, such as
drainage ponds.
For each upgrade, we divided the work scope items into
components and quantities for cost estimating.
Using standard cost-estimating resources, including
estimating manuals and recent public bid documents, we
developed a common set of unit costs for the various
infrastructure upgrades (such as the cost per cubic meter for
dredging).
We calculated the component upgrade costs by multiplying
the specific quantities by unit costs. This is an efficient,
consistent and commonly used means of evaluating a large
number of upgrade scenarios.
Time lines
The team developed a common set of productivity rates for
each type of upgrade (such as cubic meters of dredged soil
per day). We based these productivity rates on estimating
manuals and recent, relevant construction projects. We
calculated the construction implementation time by
multiplying the productivity rates with the specific quantities
for each upgrade.
We developed engineering and permitting time lines using
the project team’s experience of similar infrastructure projects
and local dialogue.
The total upgrade time is a combination of the engineering,
permitting and construction implementation time.
Construction jobs
We identified a common set of daily productivity rates for
each infrastructure upgrade. Each of these rates is achieved
with a certain labor crew. Using the construction time lines
and the labor crews required, we calculated the labor
requirements for each infrastructure upgrade, and in turn for
the complete port upgrade work scope. A construction job is
defined as an FTE job for one year (an FTE-year).
Virginia offshore wind port readiness evaluation: Report 1
17
4. Port requirements
This section presents the port readiness requirements for
each of the seven activities considered, namely:
Blade manufacturing
Generator manufacturing
Nacelle assembly
Tower manufacturing
Foundation manufacturing and staging
Submarine cable manufacturing, and
Construction staging.
This section also presents shipbuilding readiness
requirements for offshore substation manufacturing.
The vessels needing to access a given facility dictate the
waterside infrastructure requirements of the port. We have
considered the following vessel types:
Jack-up vessel
General cargo vessel
Tug and barge
Cable lay vessel, and
Offshore heavy-lift derrick.
We describe these vessel types in more detail in Section 4.1.
Port readiness in the context of each of the eight activities
means that the site offers the following:
Adequate space and acceptable layout
Suitable access for incoming materials and outgoing
finished goods
Suitable waterside infrastructure
Environmental remediation has been undertaken or is
close to completion
Site generally cleared and ready for construction of
facilities
Suitable commuter access for workers, and
Necessary utility connections (water, sewer, electricity
and gas) in place.
Port readiness does not include site build-out such as:
Buildings
Machinery and cranes
Security systems
Paving and parking lots, and
We were unable to establish whether the sea bed alongside
the quay wall suitable for jack-up operations. This is
particularly important for construction staging and this should
be borne in mind in considering the evaluation’s conclusions.
For land parcel size, we present a range of figures for each
activity and discuss to what extent tenants may be willing to
compromise.
High level port requirements are summarized in Table 4.1.
Sections 4.2 to 4.9 provide the basis for these requirements.
Water depth requirements are stated as mean lower low
water (MLLW).
This is a primarily a quantitative analysis but commercial
considerations are significant. We have not sought to
establish the commercial requirements in quantitative terms
but qualitatively discus these commercial considerations in
our evaluation of each port.
18
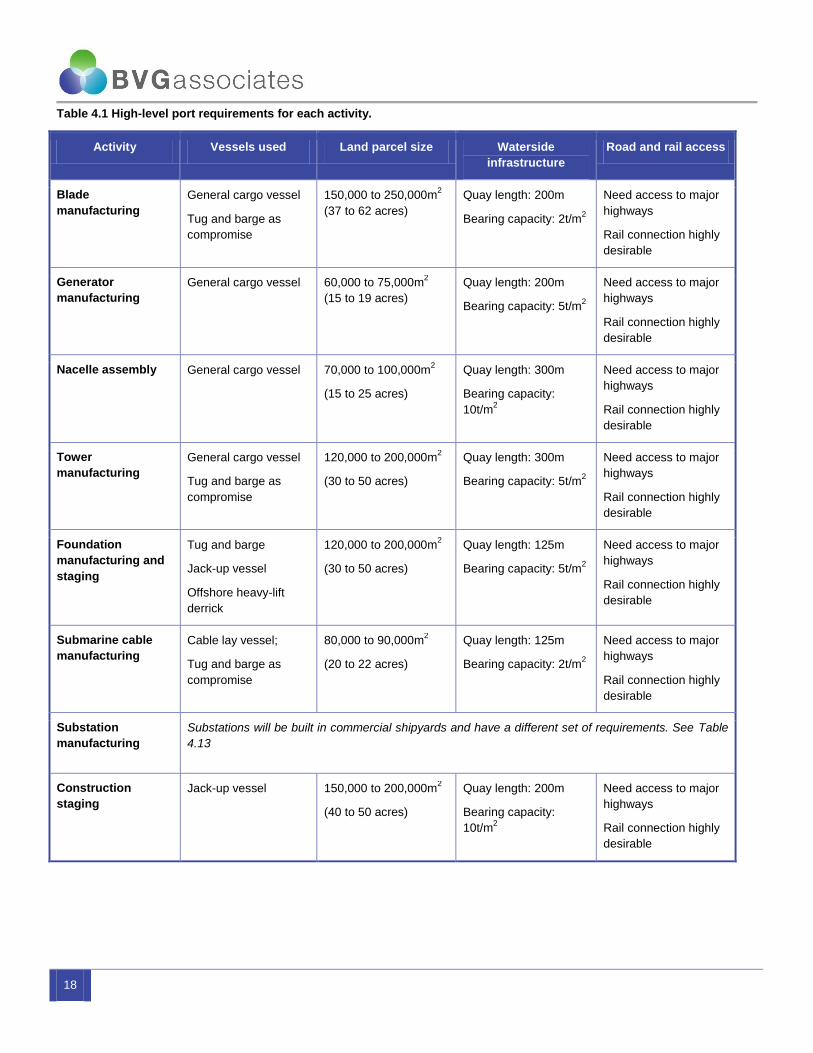
Table 4.1 High-level port requirements for each activity.
Activity Vessels used Land parcel size Waterside
infrastructure
Road and rail access
Blade
manufacturing
General cargo vessel
Tug and barge as
compromise
150,000 to 250,000m2
(37 to 62 acres)
Quay length: 200m
Bearing capacity: 2t/m2
Need access to major
highways
Rail connection highly
desirable
Generator
manufacturing
General cargo vessel 60,000 to 75,000m2
(15 to 19 acres)
Quay length: 200m
Bearing capacity: 5t/m2
Need access to major
highways
Rail connection highly
desirable
Nacelle assembly General cargo vessel 70,000 to 100,000m2
(15 to 25 acres)
Quay length: 300m
Bearing capacity:
10t/m2
Need access to major
highways
Rail connection highly
desirable
Tower
manufacturing
General cargo vessel
Tug and barge as
compromise
120,000 to 200,000m2
(30 to 50 acres)
Quay length: 300m
Bearing capacity: 5t/m2
Need access to major
highways
Rail connection highly
desirable
Foundation
manufacturing and
staging
Tug and barge
Jack-up vessel
Offshore heavy-lift
derrick
120,000 to 200,000m2
(30 to 50 acres)
Quay length: 125m
Bearing capacity: 5t/m2
Need access to major
highways
Rail connection highly
desirable
Submarine cable
manufacturing
Cable lay vessel;
Tug and barge as
compromise
80,000 to 90,000m2
(20 to 22 acres)
Quay length: 125m
Bearing capacity: 2t/m2
Need access to major
highways
Rail connection highly
desirable
Substation
manufacturing
Substations will be built in commercial shipyards and have a different set of requirements. See Table
4.13
Construction
staging
Jack-up vessel
150,000 to 200,000m2
(40 to 50 acres)
Quay length: 200m
Bearing capacity:
10t/m2
Need access to major
highways
Rail connection highly
desirable
Virginia offshore wind port readiness evaluation: Report 1
19
4.1. Vessels used in offshore wind
port activities
Vessels impose significant requirements on offshore wind
ports. This section describes the requirements for the main
vessels likely to be used.
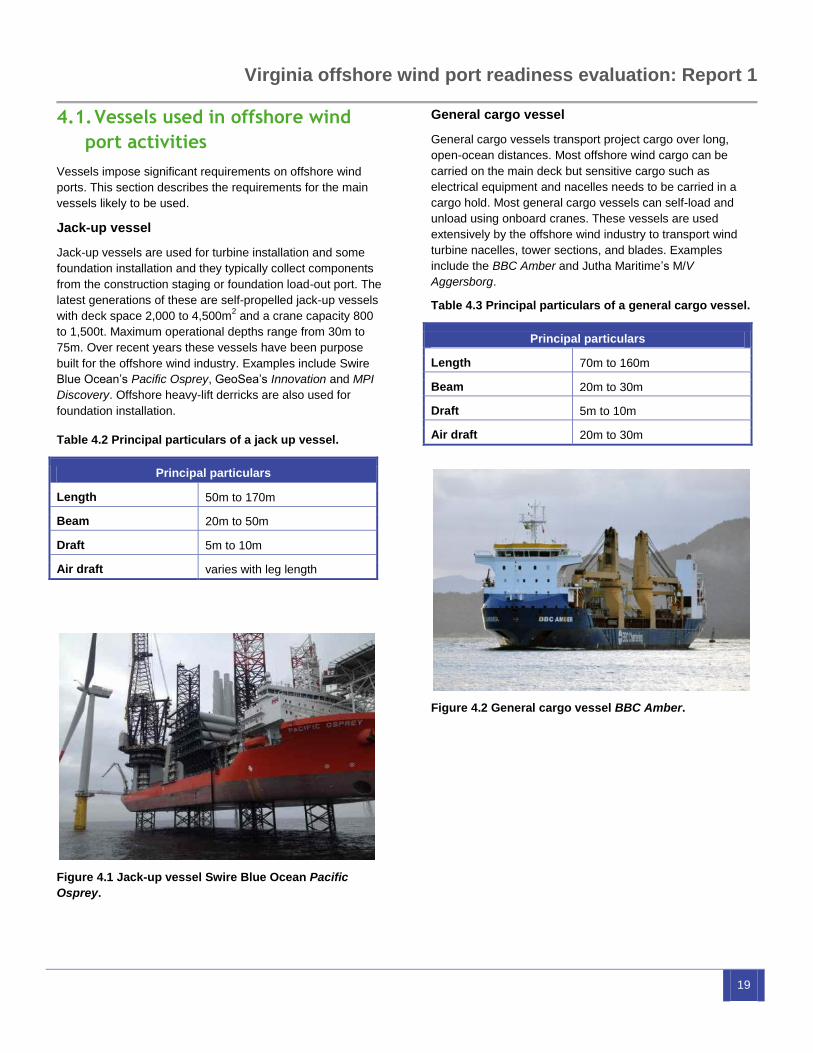
Jack-up vessel
Jack-up vessels are used for turbine installation and some
foundation installation and they typically collect components
from the construction staging or foundation load-out port. The
latest generations of these are self-propelled jack-up vessels
with deck space 2,000 to 4,500m2 and a crane capacity 800
to 1,500t. Maximum operational depths range from 30m to
75m. Over recent years these vessels have been purpose
built for the offshore wind industry. Examples include Swire
Blue Ocean’s Pacific Osprey, GeoSea’s Innovation and MPI
Discovery. Offshore heavy-lift derricks are also used for
foundation installation.
Table 4.2 Principal particulars of a jack up vessel.
Principal particulars
Length 50m to 170m
Beam 20m to 50m
Draft 5m to 10m
Air draft varies with leg length
Figure 4.1 Jack-up vessel Swire Blue Ocean Pacific
Osprey.
General cargo vessel
General cargo vessels transport project cargo over long,
open-ocean distances. Most offshore wind cargo can be
carried on the main deck but sensitive cargo such as
electrical equipment and nacelles needs to be carried in a
cargo hold. Most general cargo vessels can self-load and
unload using onboard cranes. These vessels are used
extensively by the offshore wind industry to transport wind
turbine nacelles, tower sections, and blades. Examples
include the BBC Amber and Jutha Maritime’s M/V
Aggersborg.
Table 4.3 Principal particulars of a general cargo vessel.
Principal particulars
Length 70m to 160m
Beam 20m to 30m
Draft 5m to 10m
Air draft 20m to 30m
Figure 4.2 General cargo vessel BBC Amber.
20
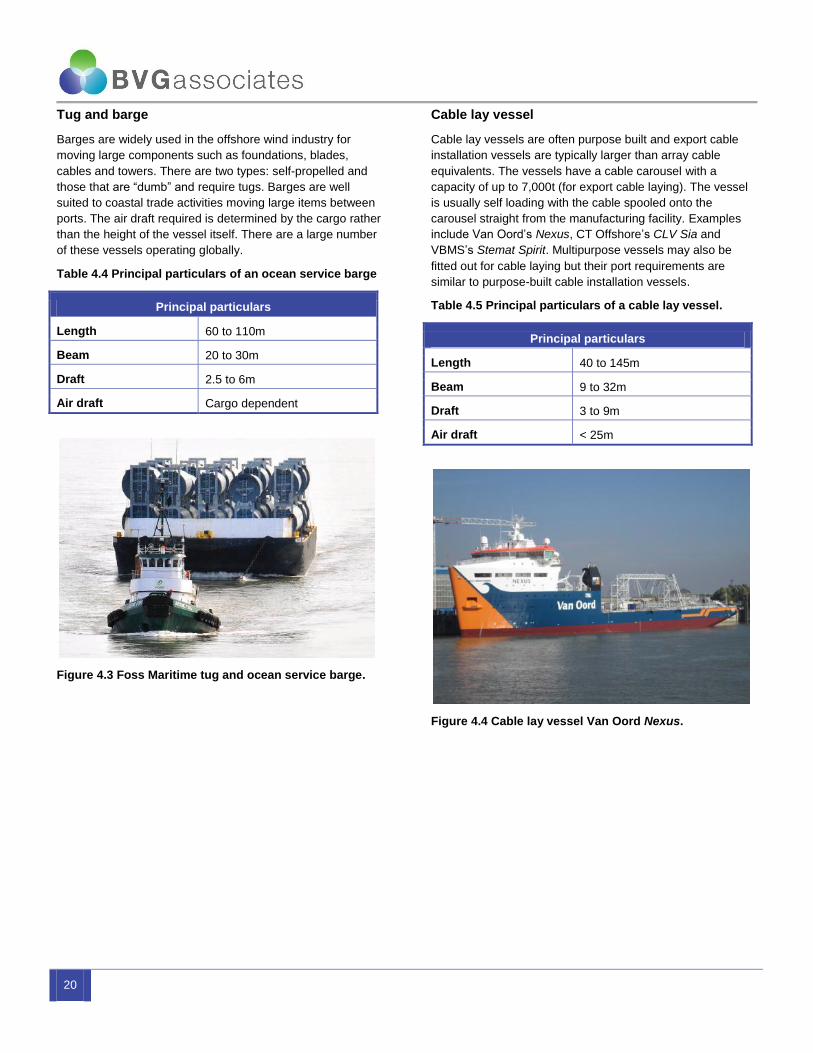
Tug and barge
Barges are widely used in the offshore wind industry for
moving large components such as foundations, blades,
cables and towers. There are two types: self-propelled and
those that are “dumb” and require tugs. Barges are well
suited to coastal trade activities moving large items between
ports. The air draft required is determined by the cargo rather
than the height of the vessel itself. There are a large number
of these vessels operating globally.
Table 4.4 Principal particulars of an ocean service barge
Principal particulars
Length 60 to 110m
Beam 20 to 30m
Draft 2.5 to 6m
Air draft Cargo dependent
Figure 4.3 Foss Maritime tug and ocean service barge.
Cable lay vessel
Cable lay vessels are often purpose built and export cable
installation vessels are typically larger than array cable
equivalents. The vessels have a cable carousel with a
capacity of up to 7,000t (for export cable laying). The vessel
is usually self loading with the cable spooled onto the
carousel straight from the manufacturing facility. Examples
include Van Oord’s Nexus, CT Offshore’s CLV Sia and
VBMS’s Stemat Spirit. Multipurpose vessels may also be
fitted out for cable laying but their port requirements are
similar to purpose-built cable installation vessels.
Table 4.5 Principal particulars of a cable lay vessel.
Principal particulars
Length 40 to 145m
Beam 9 to 32m
Draft 3 to 9m
Air draft < 25m
Figure 4.4 Cable lay vessel Van Oord Nexus.
Virginia offshore wind port readiness evaluation: Report 1
21
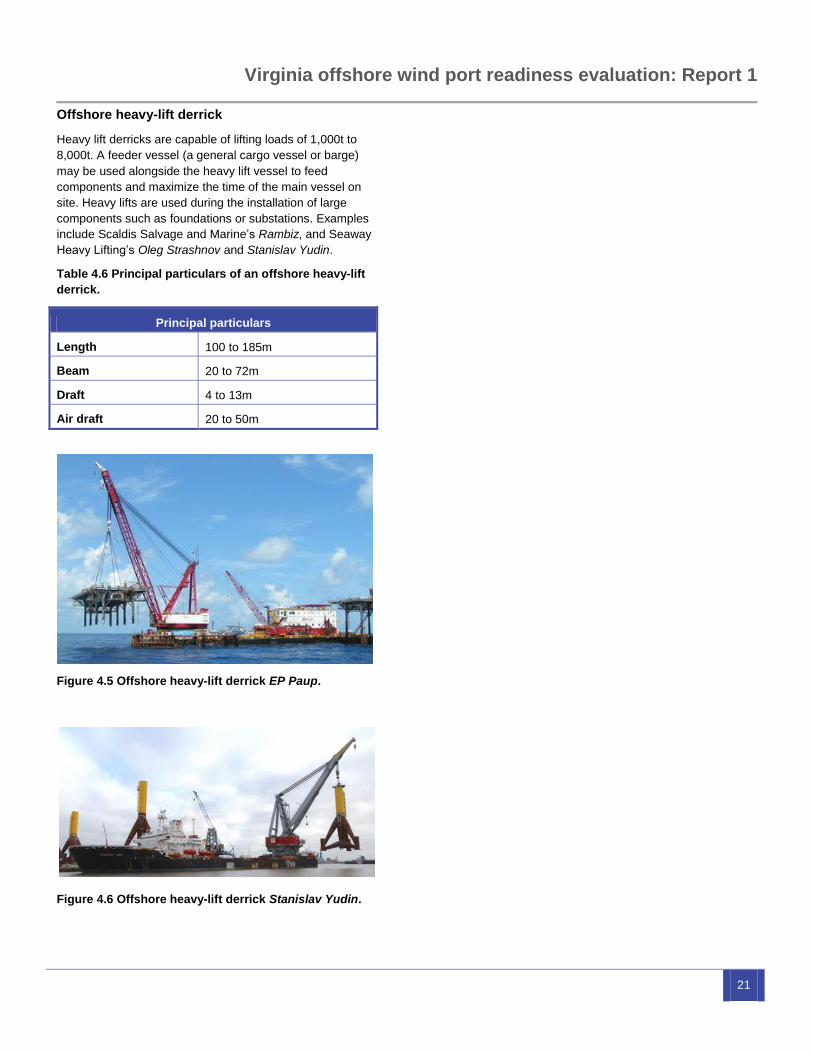
Offshore heavy-lift derrick
Heavy lift derricks are capable of lifting loads of 1,000t to
8,000t. A feeder vessel (a general cargo vessel or barge)
may be used alongside the heavy lift vessel to feed
components and maximize the time of the main vessel on
site. Heavy lifts are used during the installation of large
components such as foundations or substations. Examples
include Scaldis Salvage and Marine’s Rambiz, and Seaway
Heavy Lifting’s Oleg Strashnov and Stanislav Yudin.
Table 4.6 Principal particulars of an offshore heavy-lift
derrick.
Principal particulars
Length 100 to 185m
Beam 20 to 72m
Draft 4 to 13m
Air draft 20 to 50m
Figure 4.5 Offshore heavy-lift derrick EP Paup.
Figure 4.6 Offshore heavy-lift derrick Stanislav Yudin.
22
4.2. Blade manufacturing
Import and storage of materials and components
The main materials used in the production of blades are
glass or carbon fiber mats, resins and adhesives. There are
also structural components, particularly for the blade root.
All materials can be transported by standard heavy goods
vehicles (HGVs) or sea-borne containers.
Mats and structural components are typically stored in
standard warehousing. Some manufacturers use mats that
are pre-impregnated with resin (“pre-preg”), for which
refrigerated storage is required. Resins and adhesives are
stored in suitable liquid bulk tanks near the main production
site.
Manufacturing
Next generation blades have a length of up to 100m with a
chord (width) up to 10m. A manufacturing facility must have
space to accommodate one or more moulds and a paint
shop, and allow the easy and safe maneuvering of complete
blades.
Production and coating of the blades needs to be undertaken
in strictly controlled environments.
Storage of finished goods
Due to the need to balance stable year-round production
rates and high installation rates during the summer, a blade
manufacturer needs to have sufficient storage for at least half
of the facility’s annual production capacity.
Blades are stored in bespoke frames that can be stacked two
or more high. Blades are laid out so that cranes or reach-
stackers can access them easily.
Blades are stored with waterproof protection at the root but,
otherwise, no weather protection is required.
Export of finished goods
The size of next-generation offshore wind blades means it is
not possible to move them by road. If a manufacturer
chooses to produce smaller blades for the onshore market
then road transport is needed.
Turbine blades have a relatively low mass for their size and
therefore do not need high load-bearing quayside or cranes
for handling.
Blades are transported in their storage frames using
specialist heavy-lift vessels. Such vessels typically have
onboard tandem cranes that can be used for loading but, if
not, two quayside cranes can be used.
It is unlikely that a dedicated berth will be required as
movements will be booked in advance and there will be some
flexibility about timing.
If necessary, blades can be transferred from the site using a
shallow-drafted barge to a deeper water export berth.
Although this will involve double handling the units, it may be
a more cost effective use of expensive quayside
infrastructure.
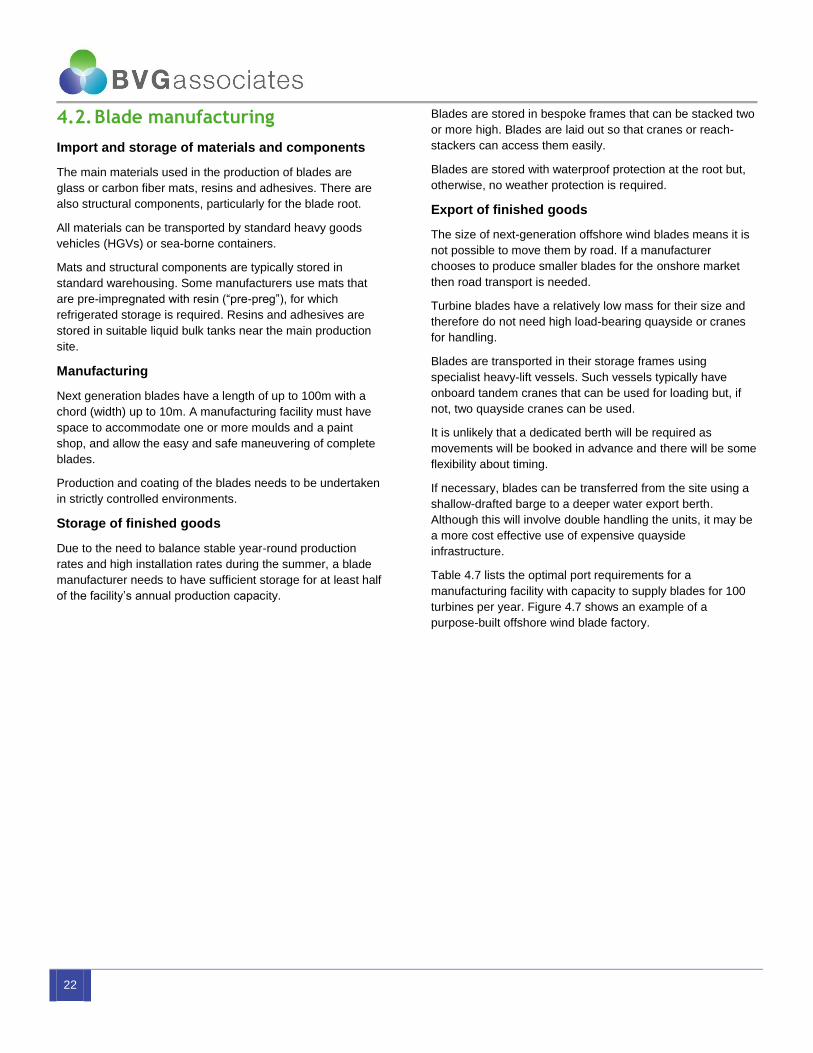
Table 4.7 lists the optimal port requirements for a
manufacturing facility with capacity to supply blades for 100
turbines per year. Figure 4.7 shows an example of a
purpose-built offshore wind blade factory.

Virginia offshore wind port readiness evaluation: Report 1
23
Table 4.7 Optimal blade manufacturing port parameters (100 sets per year).
Category Parameter Optimal requirement
Water access Horizontal clearance 25m
Air draft 20m
Vessel draft 9m
Waterfront site Total area 222,500m2 (55 acres)
Ground bearing pressure 2 t/m2
Round-the-clock operation No
Quay Length 200m
Accommodate jack-up vessels No
Quayside ground strength (crane footprint and lay-down areas) 5 t/m2
Reinforced quayside area (crane footprint and lay-down areas) 1,000 m2
On-site storage Storage space - open air 125,000 m2
Storage space - enclosed area 0
Road access Standard truck Yes
Oversize truck Yes
Rail access Rail access No
Utilities Electrical service - rating Yes
Process water consumption Yes
Gas utility connection Yes
24
Figure 4.7 The Senvion offshore wind blade factory (foreground) in Bremerhaven, Germany. The factory is in the
foreground; behind it is a staging area for Adwen (formerly Areva) turbines and at the top of the picture is the Weserwind
foundation factory.

Virginia offshore wind port readiness evaluation: Report 1
25
4.3. Generator manufacturing
Import and storage of materials and components
All the materials and subassemblies for a generator facility
are small enough to be transported by standard HGVs or
sea-borne containers.
Sensitive components need to be stored in a climate
controlled warehousing
Manufacturing
A generator facility typically has a several production lines,
but it may be built in a phases to allow a measured ramp-up
in capacity.
The first phase of development would include the
development of component storage warehousing and
logistics areas.
The facility will probably use gantry cranes to move semi-
finished and finished components.
Storage of finished goods
All completed generators would need to be stored indoors in
controlled conditions. As a facility feeds a nacelle assembly
facility, storage is only required as a buffer to the full loading
of a vessel.
Export of finished goods
Ideally, the facility is co-located with a nacelle assembly
facility so completed units are moved between sites as
required, using self-propelled modular transporters (SPMTs).
If the generators are manufactured away from the turbine
assembly facility, they are transported in frames, using
specialist heavy lift vessels.
It is unlikely that a dedicated berth will be required as
movements will be booked in advance and there will be some
flexibility over timing.
If necessary, generators can be transferred from the site
using a shallow-drafted barge to a deeper water export berth,
although this will entail double handling the units.
Road transport is not possible for completed direct drive
generators because of the size of units.
Table 4.8 lists the optimal port requirements for a
manufacturing facility with capacity to supply generators for
100 turbines per year.

26
Table 4.8 Optimal generator manufacturing port parameters (100 units per year).
Category Port characteristic Optimal Requirement
Water access Horizontal clearance 35m
Air draft 15m
Vessel draft 5m
Waterfront site Total area 70,000 m2 (17 acres)
Ground bearing pressure 5 t/m2
Round-the-clock operation No
Quay Length 200m
Accommodate jack-up vessels No
Quayside ground strength (crane footprint and lay-down areas) 10 t/m2
Reinforced quayside area (crane footprint and lay-down areas) 1,000 m2
On-site storage Storage space - open air 0
Storage space - enclosed area 0
Road access Standard truck Yes
Oversize truck No
Rail access Rail access No
Utilities Electrical service - rating Yes
Process water consumption Yes
Gas utility connection Yes

Virginia offshore wind port readiness evaluation: Report 1
27
4.4. Nacelle assembly
Import and storage of materials and components
Large electro-mechanical or structural subassemblies, such
as the generator, drive shaft, bed plate and hub are typically
imported as project cargo by specialist heavy lift vessels
(unless the nacelle assembly facility is clustered with the
production facilities for any of these components)
The largest structural components, such as the bedplate and
hub, have masses of up to 60t.
Smaller subassemblies and components are imported by
standard HGVs or sea-borne containers.
Structural components may be stored outside but electro-
mechanical subassemblies are stored in climate-controlled
warehousing
Turbine suppliers typically prefer a just-in-time logistics model
so there is no need to stockpile sub-assemblies and
components.
Manufacturing
Nacelles are assembled using a production line, with an
emphasis on lean processes. Volumes are unlikely to require
a moving production platform (although this is used on some
onshore turbine designs) so units are moved around the
facility using SPMTs or cranes.
The site also need mechanical and electrical test facilities to
ensure nacelles are operating correctly before being
despatched.
Storage of finished goods
Due to the need to balance stable year-round production
rates and high installation rates during the summer, a turbine
supplier needs to have sufficient storage for at least half of
the facility’s annual production capacity.
With transport frames and weatherproof covers at sensitive
areas, units can be stored outdoors.
Export of finished goods
The size of next-generation offshore wind nacelles means it
is not possible to move them by road. A manufacturer may
choose to produce smaller onshore units for the local market,
in which case road transport may be possible.
Complete offshore wind nacelles have a mass of several
hundred tons so high load bearing quayside is required for
export.
Nacelles are typically transported in their storage frames.
using specialist heavy lift vessels. Such vessels typically
have onboard cranes that can be used for loading but, if not,
suitable onshore quayside cranes can be used. If necessary,
nacelles could be transferred from the site using a shallow-
drafted barge to a deeper water export berth, although this
will entail double handling the units.
It is unlikely that a dedicated berth is required as movements
will be booked in advance and have some flexibility about
timing.
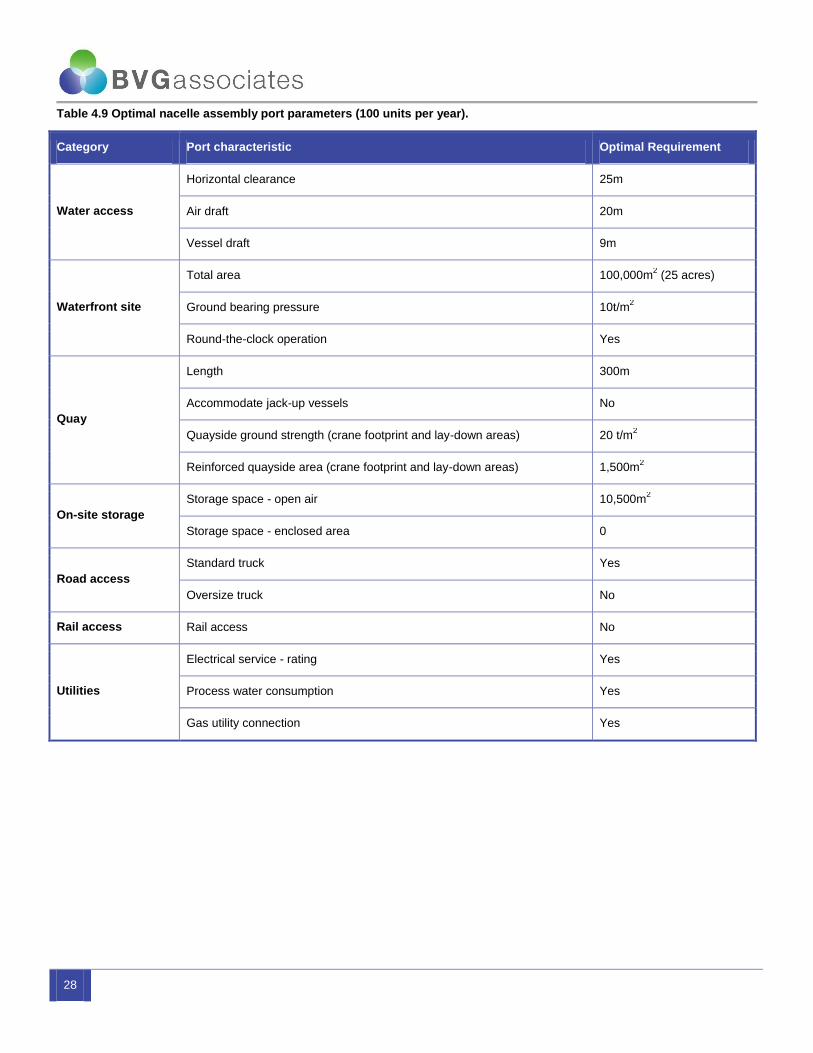
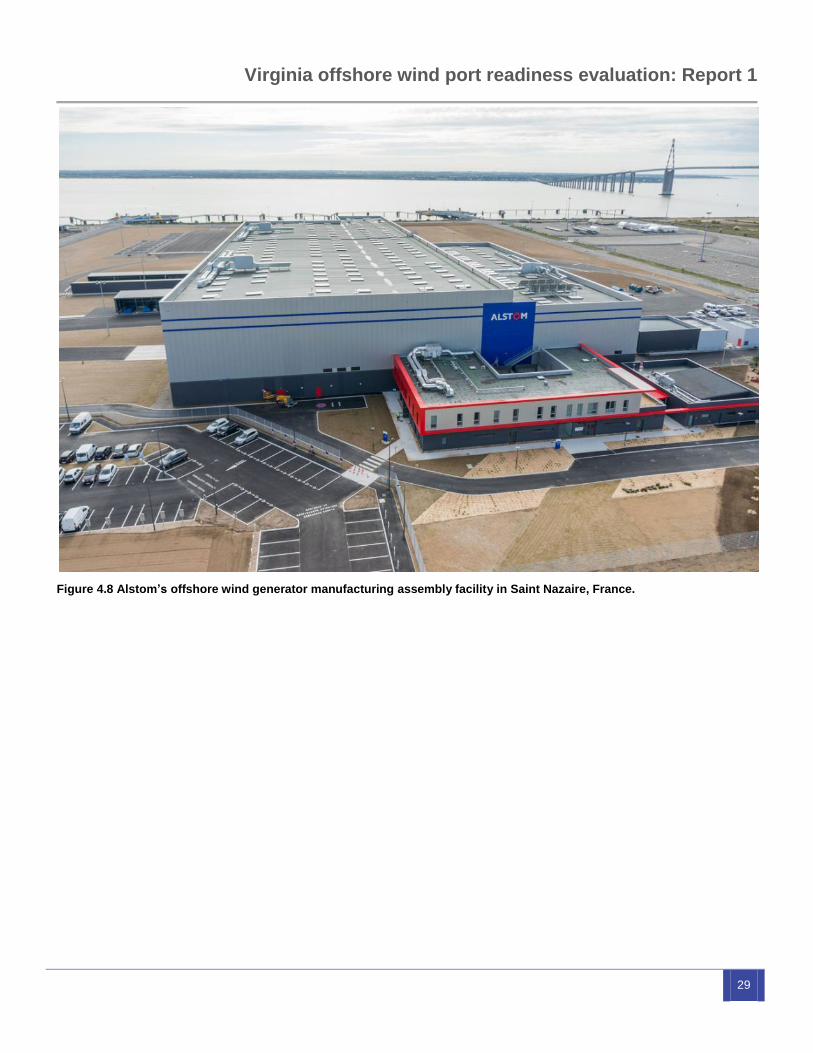
Table 4.9 lists the optimal port requirements for a
manufacturing facility with capacity to supply 100 nacelles
per year. Figure 4.8 shows an example of a purpose-built
offshore wind nacelle assembly facility.
28
Table 4.9 Optimal nacelle assembly port parameters (100 units per year).
Category Port characteristic Optimal Requirement
Water access
Horizontal clearance 25m
Air draft 20m
Vessel draft 9m
Waterfront site
Total area 100,000m2 (25 acres)
Ground bearing pressure 10t/m2
Round-the-clock operation Yes
Quay
Length 300m
Accommodate jack-up vessels No
Quayside ground strength (crane footprint and lay-down areas) 20 t/m2
Reinforced quayside area (crane footprint and lay-down areas) 1,500m2
On-site storage
Storage space - open air 10,500m2
Storage space - enclosed area 0
Road access
Standard truck Yes
Oversize truck No
Rail access Rail access No
Utilities
Electrical service - rating Yes
Process water consumption Yes
Gas utility connection Yes
Virginia offshore wind port readiness evaluation: Report 1
29
Figure 4.8 Alstom’s offshore wind generator manufacturing assembly facility in Saint Nazaire, France.
30
4.5. Tower manufacturing
Import and storage of materials and components
Flat steel plate is delivered in various thicknesses to the
facility. Depending on the capability of the supplier, plate can
be up to 14m long.
Depending on the location of the subsupplier, plate can be
delivered to the site by specialist HGVs or as project cargo by
sea.
Other components such as flange rings and internal
components (like doors, platforms, ladders and lifts) is
supplied as complete or semi-finished sub-assemblies by
road or as project cargo.
Coatings are typically delivered by road transport in drums or
tanks.
Plate can be stored outdoors but some internal components
may need to be kept in standard warehousing
Manufacturing
Depending on the strategy of the manufacturer, the plate may
be delivered to the facility in rough cut form or with the edges
prepared and shaped ready for welding and rolling. A facility
receiving rough cut plate has additional areas for these
activities.
Once the plate is prepared, it is rolled and welded into ‘cans’
which are then welded together using submerged arc welding
to form ‘sections’. There are typically three sections for a
complete offshore wind turbine tower.
Sections have flanges attached and doors cut out. They are
then washed, shot blasted and spray painted with a weather
proof coating.
Internal components are then installed.
Storage of finished goods
Due to the need to balance stable year-round production
rates and high installation rates during the summer, tower
suppliers need to have sufficient storage for at least half of
the facility’s annual production capacity
With weather proof covers at the ends, units can be stored
outdoors
Export of finished goods
The tower is transported in sections. These are usually bolted
together at the construction staging ports and installed with a
single offshore lift.
The size of next-generation offshore wind towers means it is
not possible to move them by road. A manufacturer may also
choose to produce smaller onshore units for the local market,
in which case road transport may be possible.
Finish sections have a mass of several hundred tons so high
load bearing quayside is required for export. Sections are
transported in their storage frames. They are typically
transported using specialist heavy lift vessels. Such vessels
typically have onboard cranes that can be used for loading
but, if not, suitable quayside cranes can be used.
If necessary, nacelles can be transferred from the site using
a shallow-drafted barge to a deeper water export berth,
although this entails double handling the units..
It is unlikely that a dedicated berth is needed as movements
will be booked in advance and there is some flexibility over
timing.
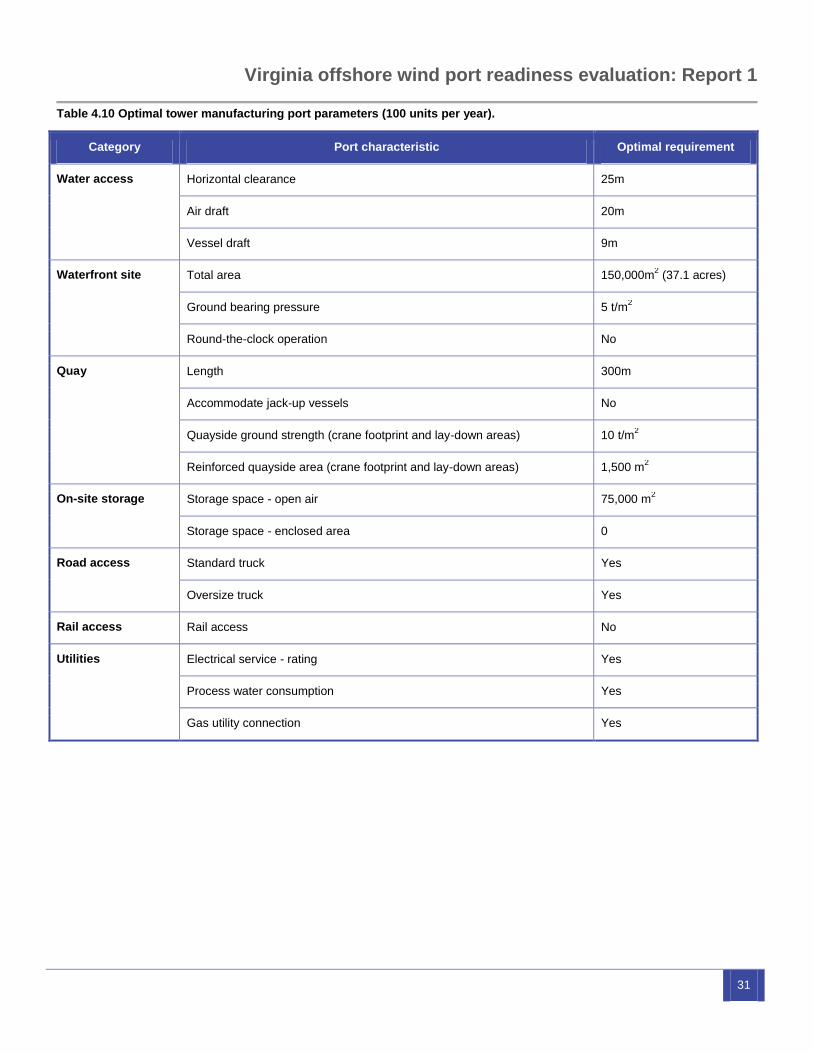
Table 4.10 lists the optimal port requirements for a tower
manufacturing facility with capacity to supply 100 turbines per
year. Figure 4.9 shows an example of an operational offshore
tower facility.
Virginia offshore wind port readiness evaluation: Report 1
31
Table 4.10 Optimal tower manufacturing port parameters (100 units per year).
Category Port characteristic Optimal requirement
Water access Horizontal clearance 25m
Air draft 20m
Vessel draft 9m
Waterfront site Total area 150,000m2 (37.1 acres)
Ground bearing pressure 5 t/m2
Round-the-clock operation No
Quay Length 300m
Accommodate jack-up vessels No
Quayside ground strength (crane footprint and lay-down areas) 10 t/m2
Reinforced quayside area (crane footprint and lay-down areas) 1,500 m2
On-site storage Storage space - open air 75,000 m2
Storage space - enclosed area 0
Road access Standard truck Yes
Oversize truck Yes
Rail access Rail access No
Utilities Electrical service - rating Yes
Process water consumption Yes
Gas utility connection Yes
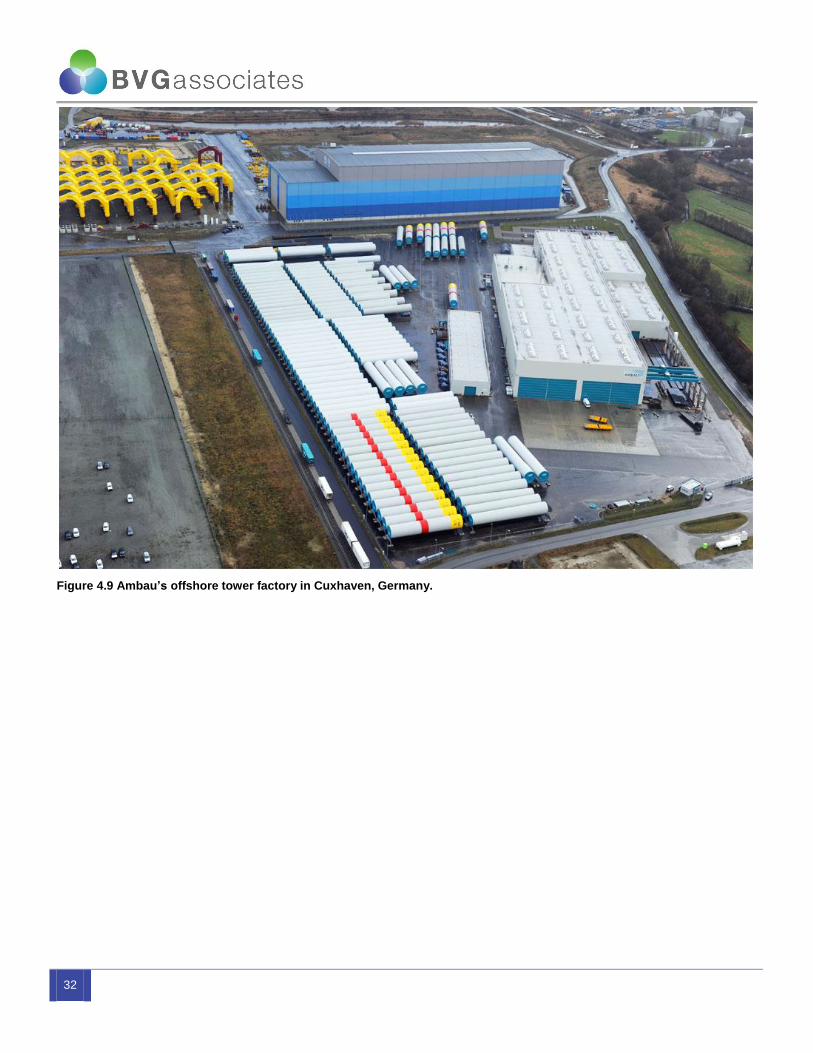
32
Figure 4.9 Ambau’s offshore tower factory in Cuxhaven, Germany.
Virginia offshore wind port readiness evaluation: Report 1
33
4.6. Foundation manufacturing
Import and storage of materials and components
The steel for jacket foundations is typically delivered to the
site pre-rolled into tubulars.
Depending on the location of the subsupplier, tubulars can be
delivered to the site by specialist HGVs or as project cargo by
sea.
Secondary steel components such as platforms, anodes, and
cable tubes are supplied as complete or semi-finished
subassemblies by road or as project cargo.
Tubular sections can be stored outdoors but some secondary
steel components may be kept in standard warehousing.
Manufacturing
Depending on the strategy of the manufacturer, the tubulars
may be delivered cut to size with edges prepared for welding.
A facility receiving unprepared tubulars has additional areas
for these activities.
Ideally, jackets are fabricated on a production line with units
moved through the facility by gantry cranes.
Once the main structure is complete, it is shot blasted and
spray painted with a weather-proof coating. Secondary steel
items are then attached.
The jacket is not up-ended until it has been taken out of the
factory
Storage of finished goods
Due to the need to balance stable year-round production
rates and high installation rates during the summer,
foundation suppliers need to have sufficient storage for at
least half of the facility’s annual production capacity.
Units can be stored outdoors
Export of finished goods
A complete jacket has a mass of several hundred tons so a
high load-bearing quayside is required
Currently, jackets are exported by barge using onshore
cranes. Units are fixed to the barge and then towed away.
Suppliers may choose to use barges as floating storage, in
which case the land storage requirement is reduced.
A dedicated berth may be required as the supplier aims to
line up units near the quayside to avoid double handling,
although this is not essential.
Table 4.11 lists the optimal port requirements for a
manufacturing facility with capacity to supply 100 foundations
per year. Figure 4.10 shows an operational foundation
manufacturing facility.
.
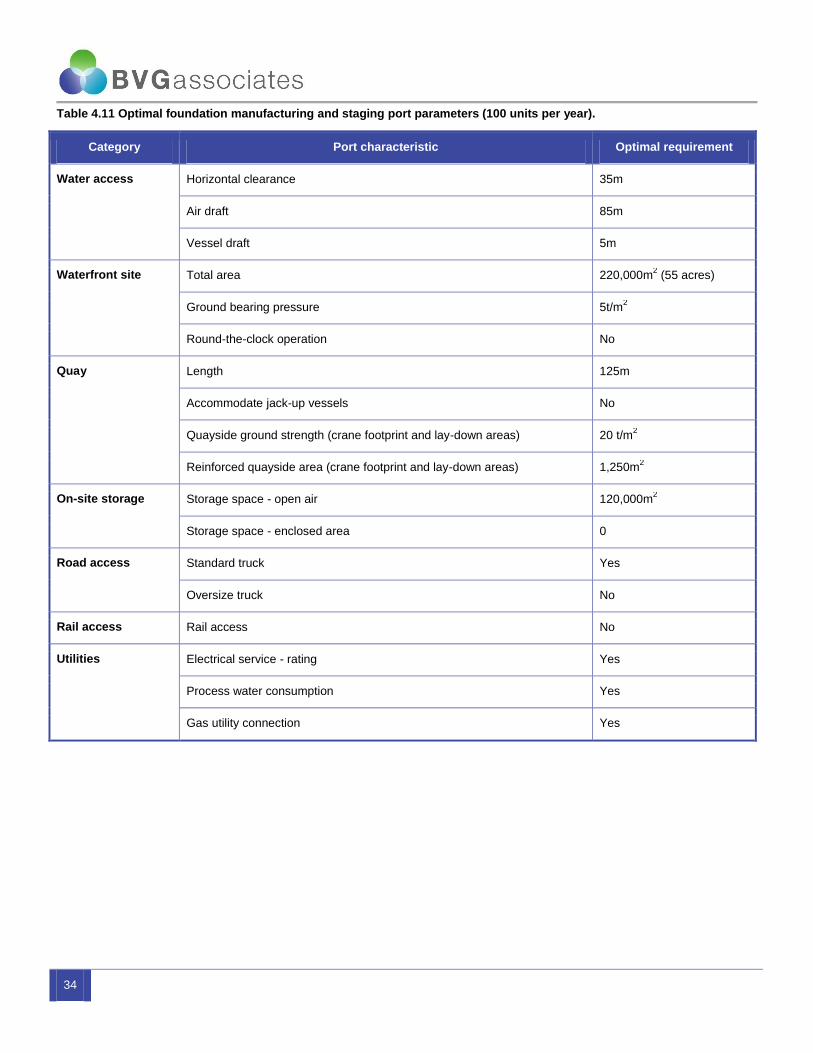
34
Table 4.11 Optimal foundation manufacturing and staging port parameters (100 units per year).
Category Port characteristic Optimal requirement
Water access Horizontal clearance 35m
Air draft 85m
Vessel draft 5m
Waterfront site Total area 220,000m2 (55 acres)
Ground bearing pressure 5t/m2
Round-the-clock operation No
Quay Length 125m
Accommodate jack-up vessels No
Quayside ground strength (crane footprint and lay-down areas) 20 t/m2
Reinforced quayside area (crane footprint and lay-down areas) 1,250m2
On-site storage Storage space - open air 120,000m2
Storage space - enclosed area 0
Road access Standard truck Yes
Oversize truck No
Rail access Rail access No
Utilities Electrical service - rating Yes
Process water consumption Yes
Gas utility connection Yes
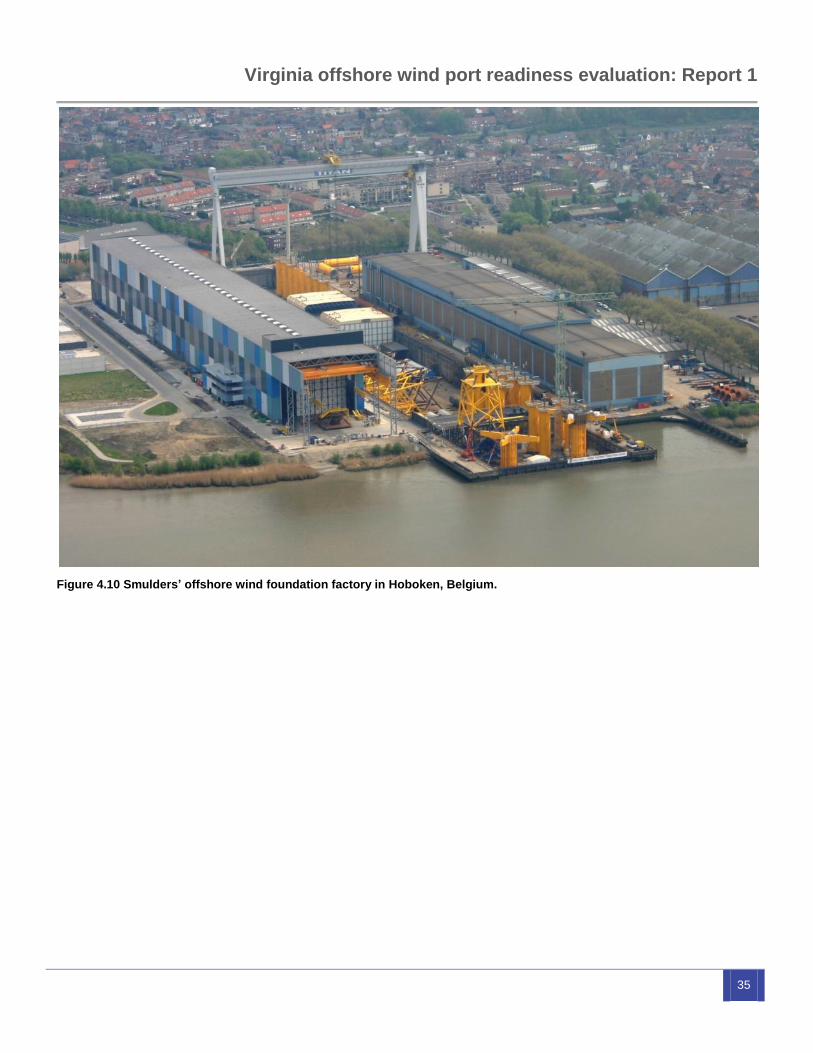
Virginia offshore wind port readiness evaluation: Report 1
35
Figure 4.10 Smulders’ offshore wind foundation factory in Hoboken, Belgium.
36
4.7. Submarine cable manufacturing
Import and storage of materials and components
Submarine cable manufacturers either have on-site core
extrusion facilities or import them from in-house or external
suppliers.
All the materials for a cable manufacturing facility (copper
strand, cladding and extrusion material) can be transported
by standard HGVs or by sea-borne containers.
There are no special material storage requirements other
than the need for sufficient covered warehousing space.
Manufacturing
The production line process is generally laid out in long
horizontal bays. Cables and component materials are moved
around the site via carousels and forklift trucks.
Cable extrusions are likely to be supplied from external
hoppers on the outside of the main factory.
The facility uses gantry cranes to move semi-finished and
finished components.
Storage of finished goods
Finished cables are stored on large capacity carousels inside
and/or outside the factory.
Cable factories can store multiple lengths of finished product
on a single carousel. Product is spooled onto a particular
carousel with a planned off-take running sequence.
Export of finished goods
Finished cable is spooled from the manufacturing facility
directly onto a cable lay vessel or barge.
Due to bend radius restrictions, many cable facilities use
spool tracking on the quayside which can extend via a gantry
out into the sea.
Table 4.12 lists the optimal port requirements for a cable
manufacturing facility with capacity to supply 150km of cable
per year. Figure 4.11 shows an operational cable
manufacturing facility.
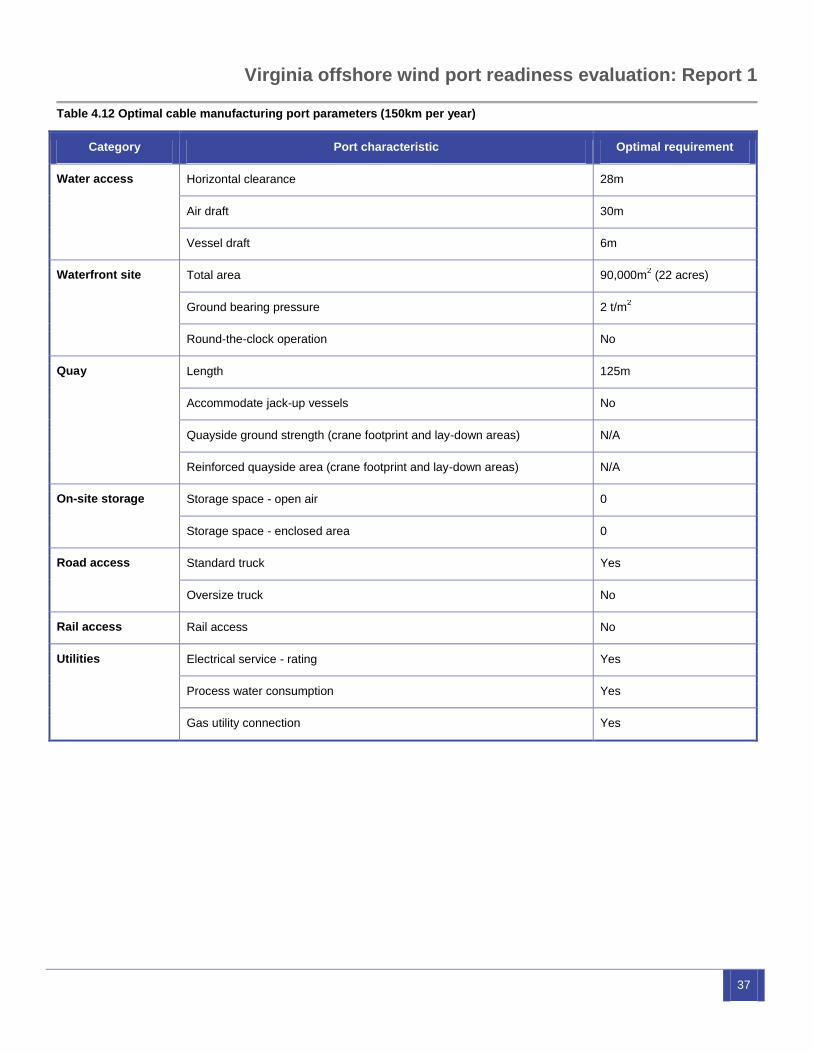
Virginia offshore wind port readiness evaluation: Report 1
37
Table 4.12 Optimal cable manufacturing port parameters (150km per year)
Category Port characteristic Optimal requirement
Water access Horizontal clearance 28m
Air draft 30m
Vessel draft 6m
Waterfront site Total area 90,000m2 (22 acres)
Ground bearing pressure 2 t/m2
Round-the-clock operation No
Quay Length 125m
Accommodate jack-up vessels No
Quayside ground strength (crane footprint and lay-down areas) N/A
Reinforced quayside area (crane footprint and lay-down areas) N/A
On-site storage Storage space - open air 0
Storage space - enclosed area 0
Road access Standard truck Yes
Oversize truck No
Rail access Rail access No
Utilities Electrical service - rating Yes
Process water consumption Yes
Gas utility connection Yes
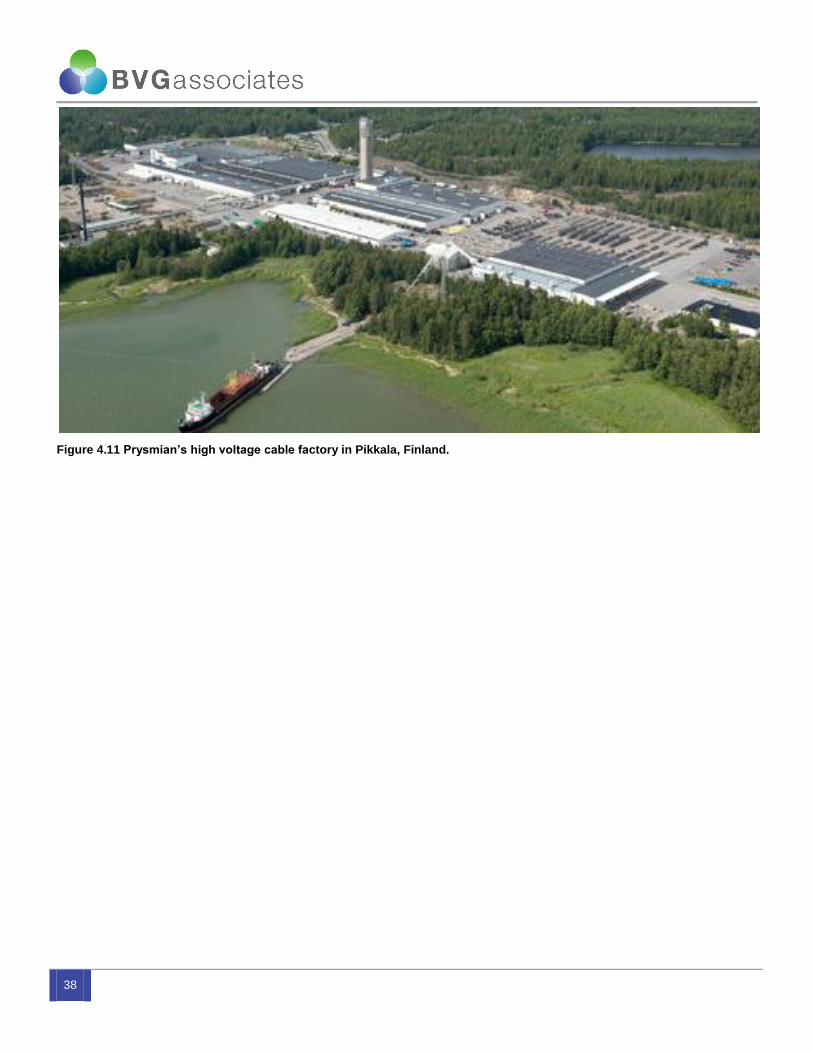
38
Figure 4.11 Prysmian’s high voltage cable factory in Pikkala, Finland.
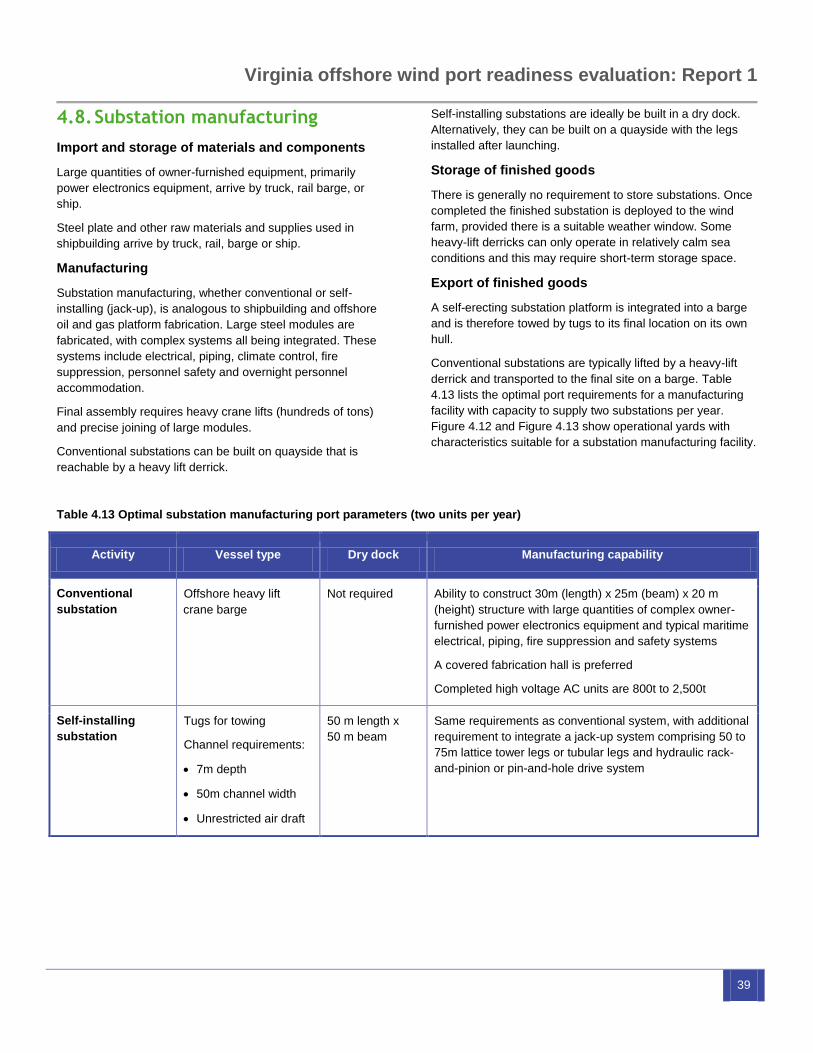
Virginia offshore wind port readiness evaluation: Report 1
39
4.8. Substation manufacturing
Import and storage of materials and components
Large quantities of owner-furnished equipment, primarily
power electronics equipment, arrive by truck, rail barge, or
ship.
Steel plate and other raw materials and supplies used in
shipbuilding arrive by truck, rail, barge or ship.
Manufacturing
Substation manufacturing, whether conventional or self-
installing (jack-up), is analogous to shipbuilding and offshore
oil and gas platform fabrication. Large steel modules are
fabricated, with complex systems all being integrated. These
systems include electrical, piping, climate control, fire
suppression, personnel safety and overnight personnel
accommodation.
Final assembly requires heavy crane lifts (hundreds of tons)
and precise joining of large modules.
Conventional substations can be built on quayside that is
reachable by a heavy lift derrick.
Self-installing substations are ideally be built in a dry dock.
Alternatively, they can be built on a quayside with the legs
installed after launching.
Storage of finished goods
There is generally no requirement to store substations. Once
completed the finished substation is deployed to the wind
farm, provided there is a suitable weather window. Some
heavy-lift derricks can only operate in relatively calm sea
conditions and this may require short-term storage space.
Export of finished goods
A self-erecting substation platform is integrated into a barge
and is therefore towed by tugs to its final location on its own
hull.
Conventional substations are typically lifted by a heavy-lift
derrick and transported to the final site on a barge. Table
4.13 lists the optimal port requirements for a manufacturing
facility with capacity to supply two substations per year.
Figure 4.12 and Figure 4.13 show operational yards with
characteristics suitable for a substation manufacturing facility.
Table 4.13 Optimal substation manufacturing port parameters (two units per year)
Activity Vessel type Dry dock Manufacturing capability
Conventional
substation
Offshore heavy lift
crane barge
Not required Ability to construct 30m (length) x 25m (beam) x 20 m
(height) structure with large quantities of complex owner-
furnished power electronics equipment and typical maritime
electrical, piping, fire suppression and safety systems
A covered fabrication hall is preferred
Completed high voltage AC units are 800t to 2,500t
Self-installing
substation
Tugs for towing
Channel requirements:
7m depth
50m channel width
Unrestricted air draft
50 m length x
50 m beam
Same requirements as conventional system, with additional
requirement to integrate a jack-up system comprising 50 to
75m lattice tower legs or tubular legs and hydraulic rack-
and-pinion or pin-and-hole drive system
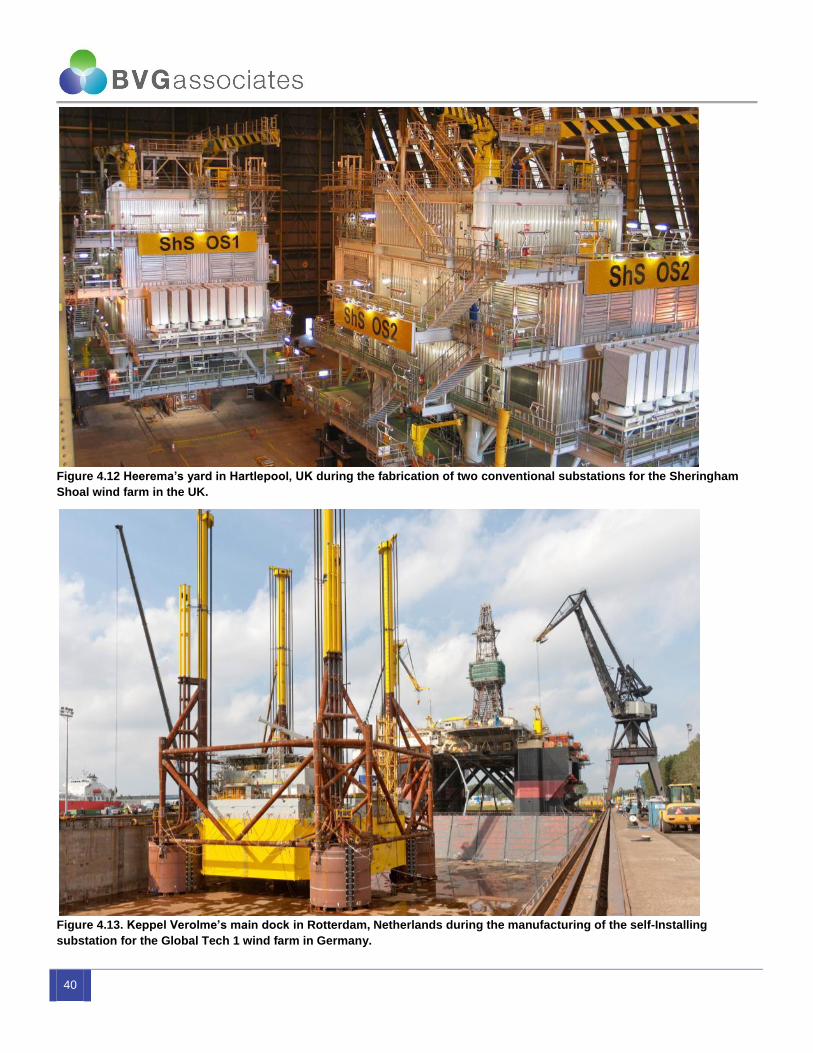
40
Figure 4.12 Heerema’s yard in Hartlepool, UK during the fabrication of two conventional substations for the Sheringham
Shoal wind farm in the UK.
Figure 4.13. Keppel Verolme’s main dock in Rotterdam, Netherlands during the manufacturing of the self-Installing
substation for the Global Tech 1 wind farm in Germany.

Virginia offshore wind port readiness evaluation: Report 1
41
4.9. Construction staging
Import and storage of materials and components
Unless the construction port is clustered with manufacturing
facilities, then towers, blades and nacelles are imported to
the site.
These components are typically transported general cargo
vessels. Such vessels typically have onboard cranes that are
for unloading but, if not, suitable quayside cranes can be
used.
Storage of finished goods
Developers face high daily projects costs during the
construction phase with multiple, high cost charters and
larger teams of crew and technicians. As such, it is standard
practice to import turbine components to the construction port
before the start of offshore activity. This ensure that delays in
the supply chain do hold up construction activity
Units may be stacked closely but still need to be individually
accessible by cranes or reach stackers
Export of finished goods
Turbine components are moved to a staging area near the
quayside, in preparation for loading onto the installation
vessel.
Towers sections are assembled to form full towers with
installation of power take-off equipment for some models.
Blades may be attached to rotor hubs in some cases
although this will become less common as rotor diameters
increase.
Next generation turbines have been designed to limit the
amount of offshore commissioning work. Instead a significant
amount of pre-commissioning is undertaken onshore,
Components are then be moved to the loading quayside. As
the tower and nacelle may both have a mass of several
hundred tons, the quayside needs to have high a load
bearing capacity.
Turbines are installed using a jack-up vessel. These vessels
will come alongside the quay wall and lower their legs to give
a stable platform during loading. The sea bed around the
quayside (and the quayside itself) therefore needs to be
suitable for repeated jacking-up operations.
Components are then loaded on to the jack-up vessel for
installation. The jack-up vessel will typically use its own crane
to complete this operation.
Table 4.14 lists the optimal port requirements for a
construction staging facility with capacity to handle 100
turbines per year. Figure 4.14 shows an operational facility
with suitable characteristics.
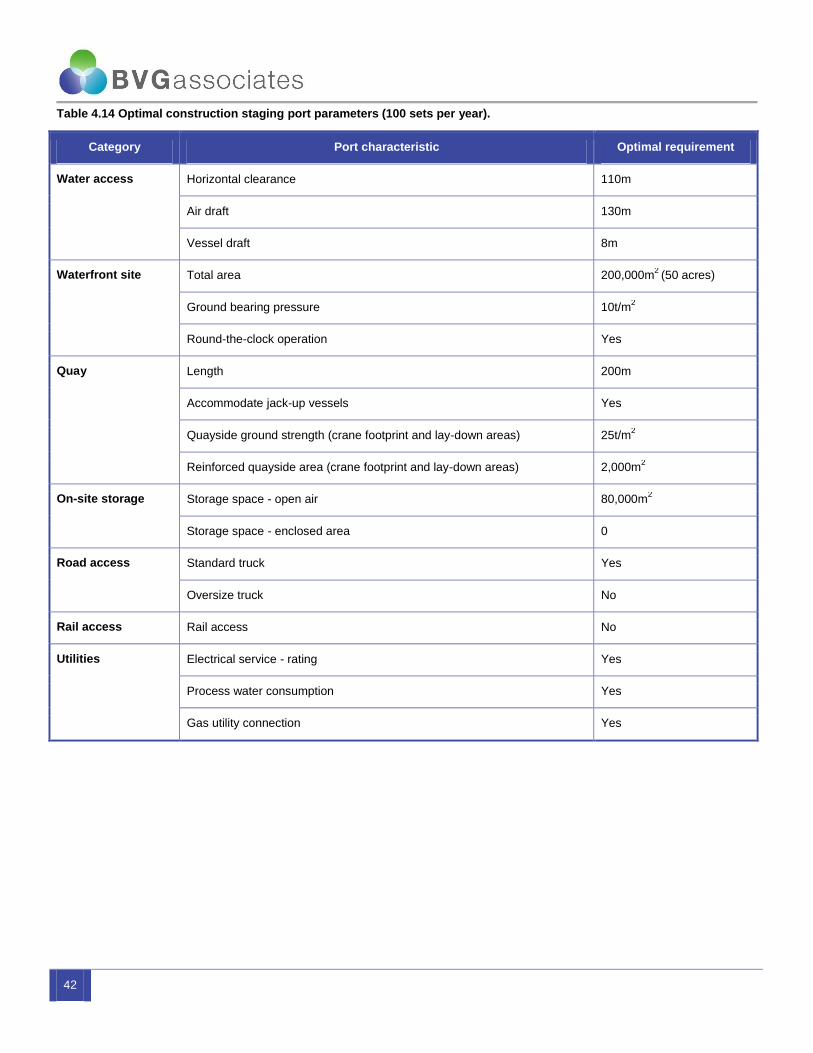
42
Table 4.14 Optimal construction staging port parameters (100 sets per year).
Category Port characteristic Optimal requirement
Water access Horizontal clearance 110m
Air draft 130m
Vessel draft 8m
Waterfront site Total area 200,000m2
(50 acres)
Ground bearing pressure 10t/m2
Round-the-clock operation Yes
Quay Length 200m
Accommodate jack-up vessels Yes
Quayside ground strength (crane footprint and lay-down areas) 25t/m2
Reinforced quayside area (crane footprint and lay-down areas) 2,000m2
On-site storage Storage space - open air 80,000m2
Storage space - enclosed area 0
Road access Standard truck Yes
Oversize truck No
Rail access Rail access No
Utilities Electrical service - rating Yes
Process water consumption Yes
Gas utility connection Yes
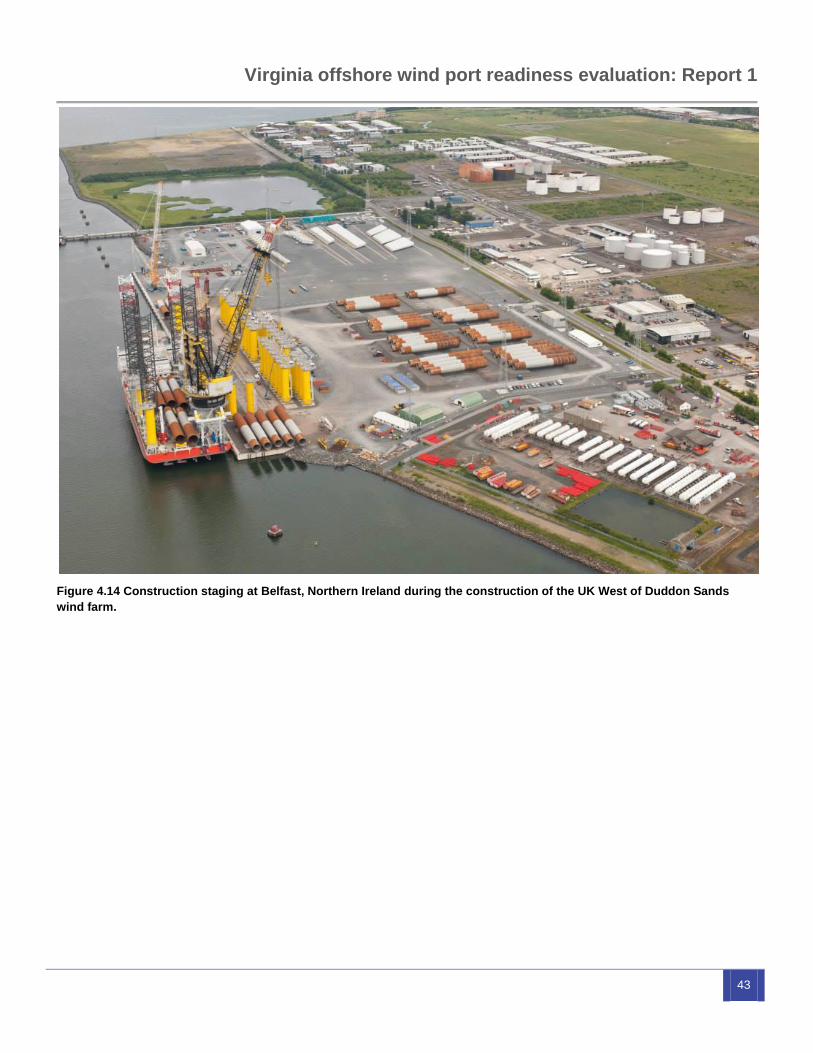
Virginia offshore wind port readiness evaluation: Report 1
43
Figure 4.14 Construction staging at Belfast, Northern Ireland during the construction of the UK West of Duddon Sands
wind farm.
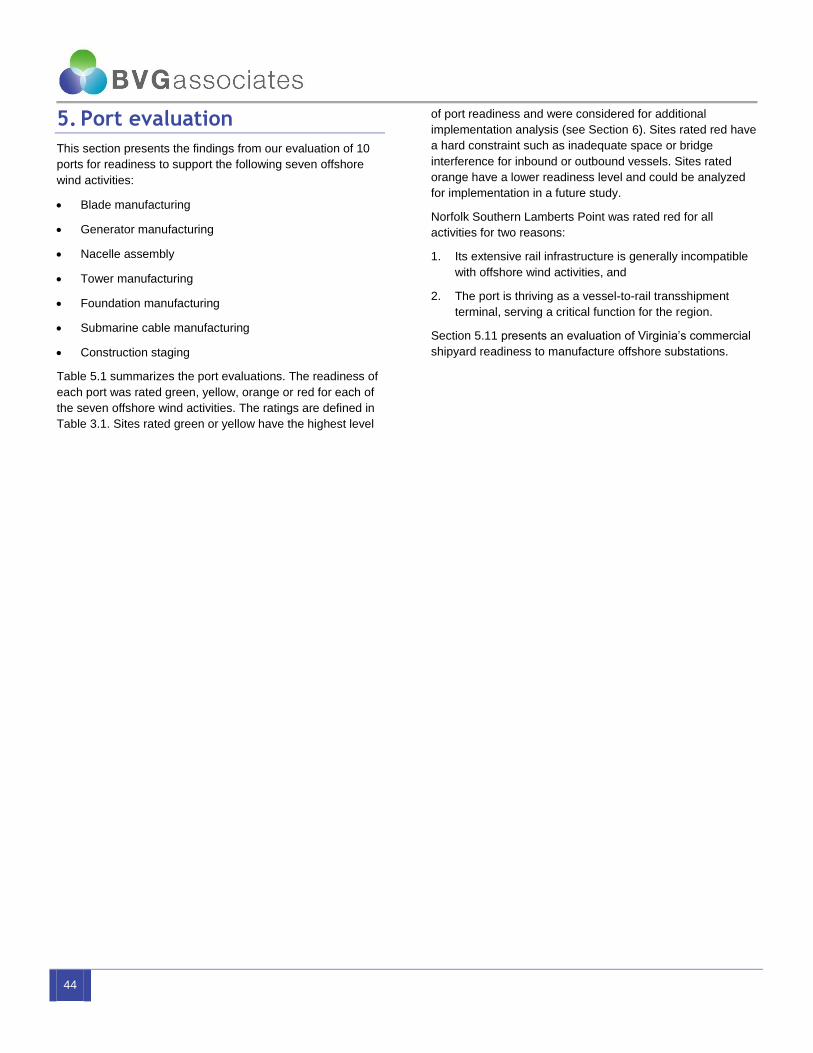
44
5. Port evaluation
This section presents the findings from our evaluation of 10
ports for readiness to support the following seven offshore
wind activities:
Blade manufacturing
Generator manufacturing
Nacelle assembly
Tower manufacturing
Foundation manufacturing
Submarine cable manufacturing
Construction staging
Table 5.1 summarizes the port evaluations. The readiness of
each port was rated green, yellow, orange or red for each of
the seven offshore wind activities. The ratings are defined in
Table 3.1. Sites rated green or yellow have the highest level
of port readiness and were considered for additional
implementation analysis (see Section 6). Sites rated red have
a hard constraint such as inadequate space or bridge
interference for inbound or outbound vessels. Sites rated
orange have a lower readiness level and could be analyzed
for implementation in a future study.
Norfolk Southern Lamberts Point was rated red for all
activities for two reasons:
1. Its extensive rail infrastructure is generally incompatible
with offshore wind activities, and
2. The port is thriving as a vessel-to-rail transshipment
terminal, serving a critical function for the region.
Section 5.11 presents an evaluation of Virginia’s commercial
shipyard readiness to manufacture offshore substations.

Virginia offshore wind port readiness evaluation: Report 1
45
Table 5.1 Summary evaluation of the ports.
Green = Site is suitable with few or no upgrades
Yellow = Site is suitable with upgrades
Orange = Site is suitable with major improvements
Red = Site is unsuitable
See Table 3.1 for rating definitions
Po
rts
mo
uth
Ma
rin
e T
erm
ina
l
Ne
wp
ort
Ne
ws
Ma
rin
e T
erm
ina
l
Ca
pe
Ch
arl
es
Ha
rbo
r
No
rfo
lk S
ou
the
rn
La
mb
ert
s P
oin
t
Pe
ck
Ma
rin
e T
erm
ina
l
BA
SF
Ja
me
s C
ity
Gra
ve
l N
ec
k
Vir
gin
ia
Re
na
issa
nc
e C
en
ter
Ste
el
Str
ee
t
Ch
es
ap
ea
ke
BA
SF
Po
rts
mo
uth
Blade
manufacturing Y Y O R Y O O Y O Y
Generator
manufacturing Y Y O R Y O O O O Y
Nacelle
assembly Y Y O R Y O O R O Y
Tower
manufacturing Y Y O R Y O O R O Y
Foundation
manufacturing Y Y O R R R R R R Y
Submarine
cable
manufacturing
G G O R G O O G O G
Construction
staging Y Y R R R R R R R Y
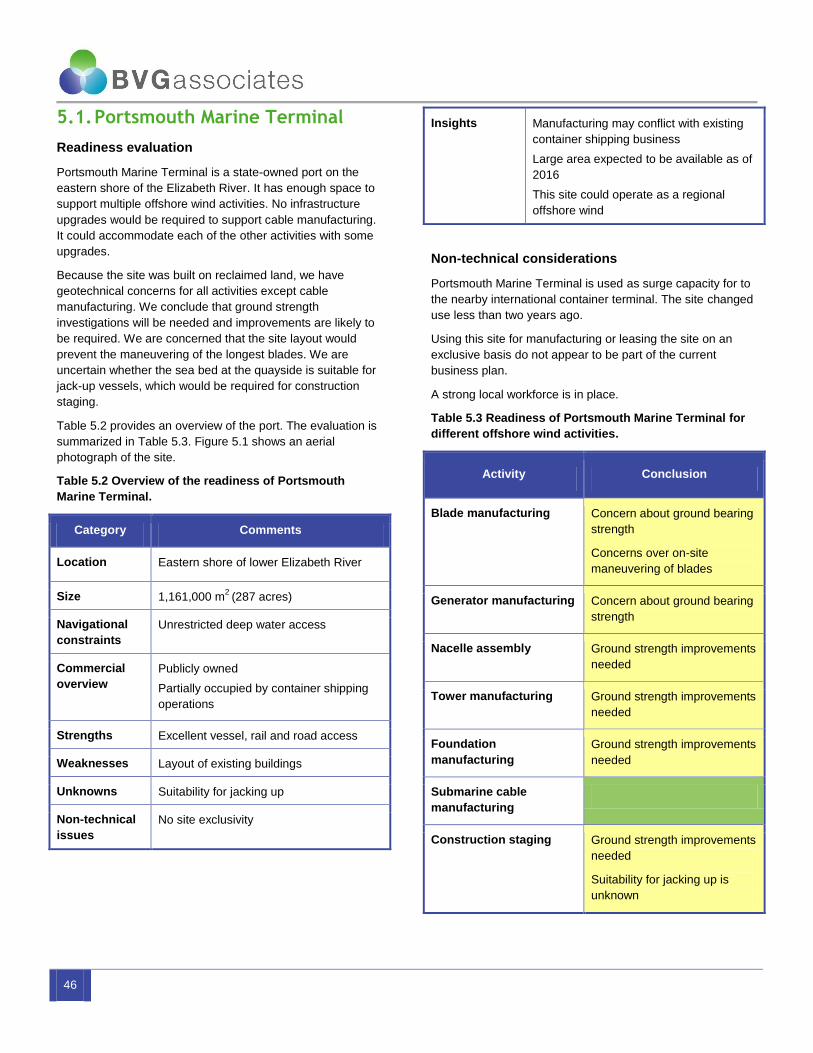
46
5.1. Portsmouth Marine Terminal
Readiness evaluation
Portsmouth Marine Terminal is a state-owned port on the
eastern shore of the Elizabeth River. It has enough space to
support multiple offshore wind activities. No infrastructure
upgrades would be required to support cable manufacturing.
It could accommodate each of the other activities with some
upgrades.
Because the site was built on reclaimed land, we have
geotechnical concerns for all activities except cable
manufacturing. We conclude that ground strength
investigations will be needed and improvements are likely to
be required. We are concerned that the site layout would
prevent the maneuvering of the longest blades. We are
uncertain whether the sea bed at the quayside is suitable for
jack-up vessels, which would be required for construction
staging.
Table 5.2 provides an overview of the port. The evaluation is
summarized in Table 5.3. Figure 5.1 shows an aerial
photograph of the site.
Table 5.2 Overview of the readiness of Portsmouth
Marine Terminal.
Category Comments
Location Eastern shore of lower Elizabeth River
Size 1,161,000 m2
(287 acres)
Navigational
constraints
Unrestricted deep water access
Commercial
overview
Publicly owned
Partially occupied by container shipping
operations
Strengths Excellent vessel, rail and road access
Weaknesses Layout of existing buildings
Unknowns Suitability for jacking up
Non-technical
issues
No site exclusivity
Insights Manufacturing may conflict with existing
container shipping business
Large area expected to be available as of
2016
This site could operate as a regional
offshore wind
Non-technical considerations
Portsmouth Marine Terminal is used as surge capacity for to
the nearby international container terminal. The site changed
use less than two years ago.
Using this site for manufacturing or leasing the site on an
exclusive basis do not appear to be part of the current
business plan.
A strong local workforce is in place.
Table 5.3 Readiness of Portsmouth Marine Terminal for
different offshore wind activities.
Activity Conclusion
Blade manufacturing Concern about ground bearing
strength
Concerns over on-site
maneuvering of blades
Generator manufacturing Concern about ground bearing
strength
Nacelle assembly Ground strength improvements
needed
Tower manufacturing Ground strength improvements
needed
Foundation
manufacturing
Ground strength improvements
needed
Submarine cable
manufacturing
Construction staging Ground strength improvements
needed
Suitability for jacking up is
unknown
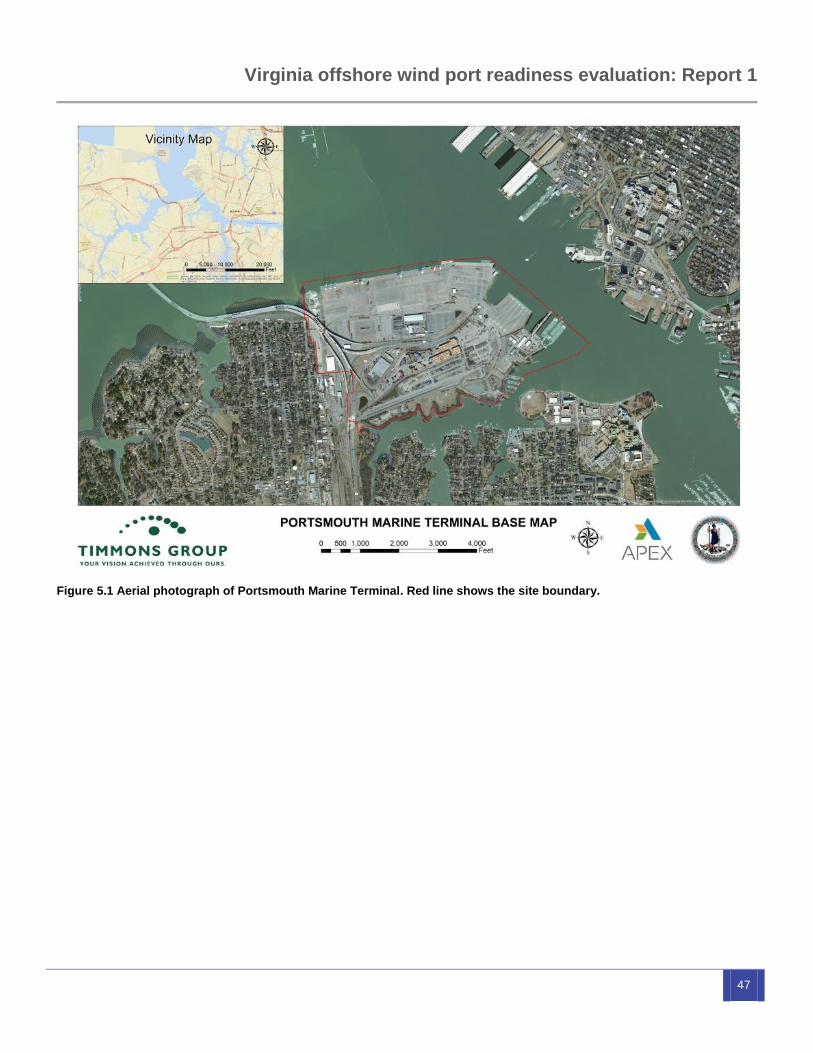
Virginia offshore wind port readiness evaluation: Report 1
47
Figure 5.1 Aerial photograph of Portsmouth Marine Terminal. Red line shows the site boundary.

48
5.2. Newport News Marine Terminal
Readiness evaluation
Newport News Marine Terminal is a state owned port on the
north bank of the James River. It is currently used for car
storage. No infrastructure upgrades would be required to
support cable manufacturing. Other activities could be
accommodated here with some upgrade. Significant lay-
down area is available at Pier C, which would be suitable for
blade storage. The neighboring coal storage facility is
watered four times per day.
Ground strength investigations and subsequent
improvements are likely to be required for most functions.
Specifically, we have concerns over the load-bearing
capacity of the piers. Also, existing buildings on the site may
constrain the maneuvering of larger items such as towers,
blades and foundations. We are uncertain whether the sea
bed at the quayside is suitable for jacking up vessels, which
would be required for construction staging.
Table 5.4 provides an overview of the port. Table 5.5
summarizes the evaluation. Figure 5.2 shows an aerial
photograph of the site.
Table 5.4 Overview of the readiness of Newport News
Marine Terminal
Category Comments
Location North bank of James River
Size 670,000 m2
(165 acres)
Navigational
constraints
Unrestricted deep water access
Commercial
overview
Publicly owned
Occupied by car import business
Strengths Excellent vessel, rail and road
access
Weaknesses Aging infrastructure
Unknowns Suitability for jacking up
Ground strength
Non-technical issues Site currently occupied
Insights Manufacturing is not consistent with
business model
Neighboring coal facility is a
concern
Non-technical considerations
Newport News Marine Terminal is currently used as a car
import terminal. Offshore wind manufacturing would
potentially displace this activity.
Using this site for manufacturing or leasing the site on an
exclusive basis do not appear to be part of the current
business plan.
A capable local workforce is in place.
Table 5.5 Readiness of Newport News Marine Terminal
for different offshore wind activities.
Activity Conclusion
Blade manufacturing Concern about ground bearing
strength
No site exclusivity
Existing buildings constrain
maneuverability
Generator
manufacturing
Concern about ground bearing
strength
Nacelle assembly Load-bearing concerns for piers;
unlikely to be usable for heavier
components
Tower manufacturing Load-bearing concerns for piers;
unlikely to be usable for heavier
components
Existing buildings interfere with
maneuverability
Foundation
manufacturing
Load-bearing concerns for piers;
unlikely to be usable for heavier
components
Existing buildings constrain
maneuverability
Submarine cable
manufacturing
Few or no upgrade needed
Construction staging Load-bearing concerns for piers;
unlikely to be usable for heavier
components
Suitability for jacking up is
unknown
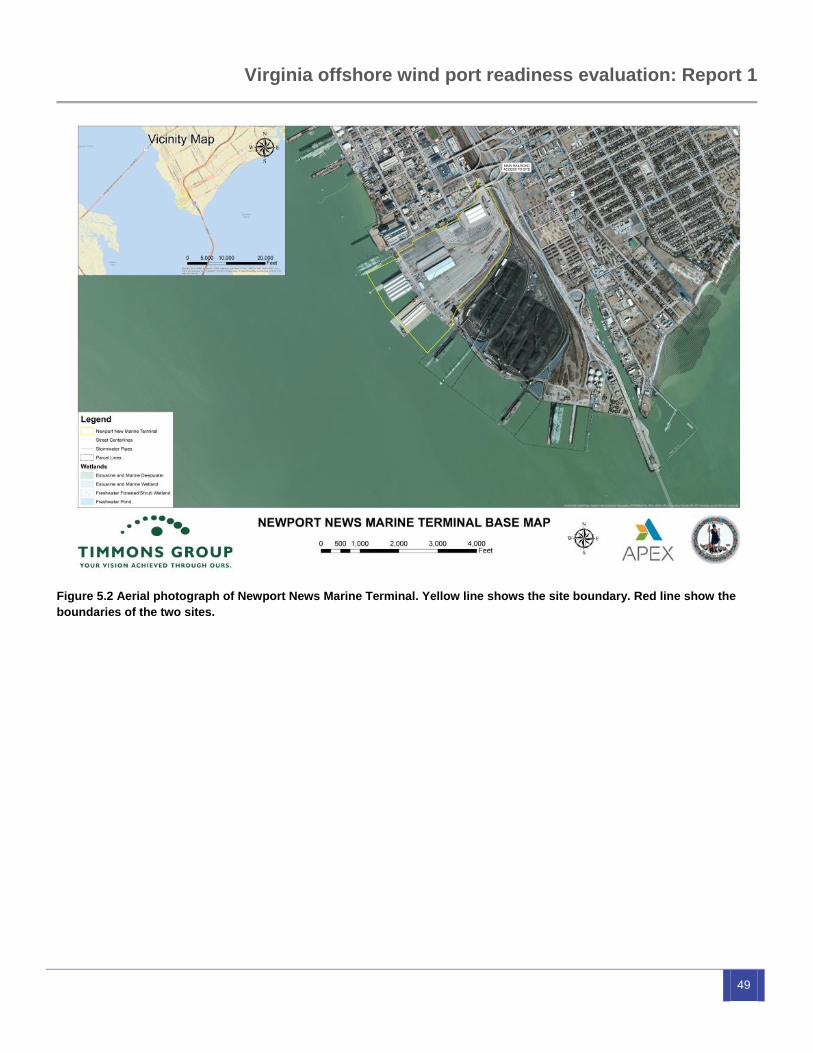
Virginia offshore wind port readiness evaluation: Report 1
49
Figure 5.2 Aerial photograph of Newport News Marine Terminal. Yellow line shows the site boundary. Red line show the
boundaries of the two sites.
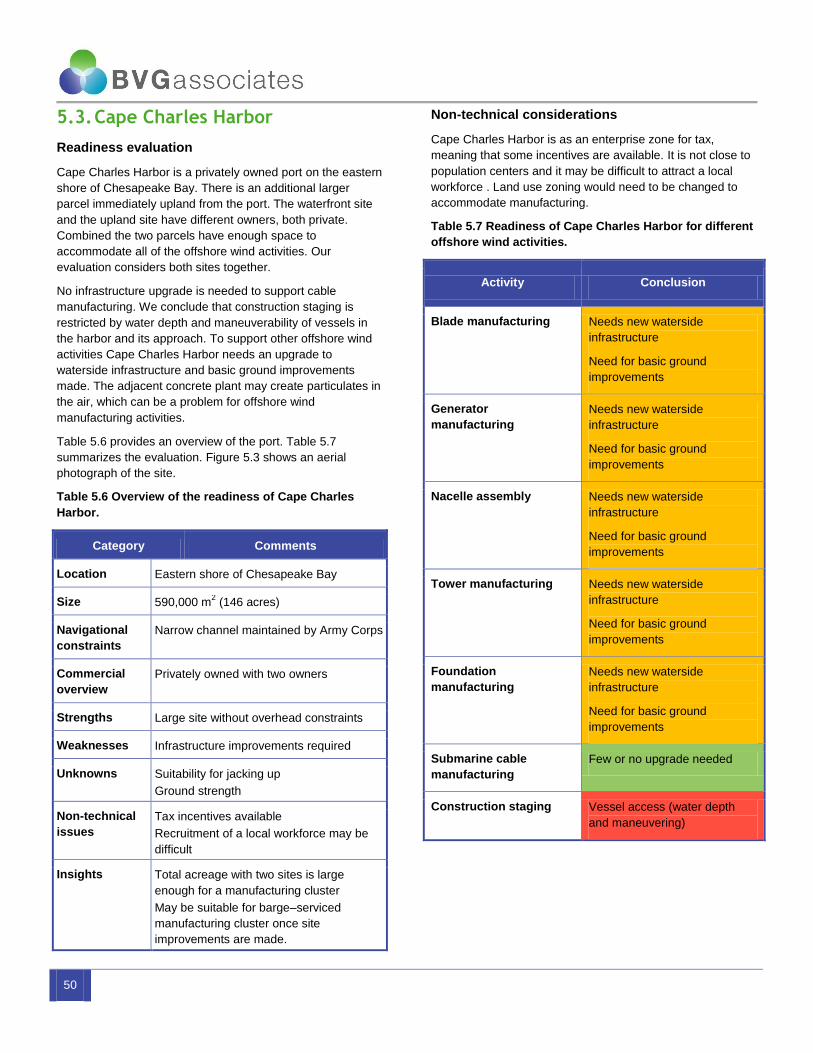
50
5.3. Cape Charles Harbor
Readiness evaluation
Cape Charles Harbor is a privately owned port on the eastern
shore of Chesapeake Bay. There is an additional larger
parcel immediately upland from the port. The waterfront site
and the upland site have different owners, both private.
Combined the two parcels have enough space to
accommodate all of the offshore wind activities. Our
evaluation considers both sites together.
No infrastructure upgrade is needed to support cable
manufacturing. We conclude that construction staging is
restricted by water depth and maneuverability of vessels in
the harbor and its approach. To support other offshore wind
activities Cape Charles Harbor needs an upgrade to
waterside infrastructure and basic ground improvements
made. The adjacent concrete plant may create particulates in
the air, which can be a problem for offshore wind
manufacturing activities.
Table 5.6 provides an overview of the port. Table 5.7
summarizes the evaluation. Figure 5.3 shows an aerial
photograph of the site.
Table 5.6 Overview of the readiness of Cape Charles
Harbor.
Category Comments
Location Eastern shore of Chesapeake Bay
Size 590,000 m2 (146 acres)
Navigational
constraints
Narrow channel maintained by Army Corps
Commercial
overview
Privately owned with two owners
Strengths Large site without overhead constraints
Weaknesses Infrastructure improvements required
Unknowns Suitability for jacking up
Ground strength
Non-technical
issues
Tax incentives available
Recruitment of a local workforce may be
difficult
Insights Total acreage with two sites is large
enough for a manufacturing cluster
May be suitable for barge–serviced
manufacturing cluster once site
improvements are made.
Non-technical considerations
Cape Charles Harbor is as an enterprise zone for tax,
meaning that some incentives are available. It is not close to
population centers and it may be difficult to attract a local
workforce . Land use zoning would need to be changed to
accommodate manufacturing.
Table 5.7 Readiness of Cape Charles Harbor for different
offshore wind activities.
Activity Conclusion
Blade manufacturing Needs new waterside
infrastructure
Need for basic ground
improvements
Generator
manufacturing
Needs new waterside
infrastructure
Need for basic ground
improvements
Nacelle assembly Needs new waterside
infrastructure
Need for basic ground
improvements
Tower manufacturing Needs new waterside
infrastructure
Need for basic ground
improvements
Foundation
manufacturing
Needs new waterside
infrastructure
Need for basic ground
improvements
Submarine cable
manufacturing
Few or no upgrade needed
Construction staging Vessel access (water depth
and maneuvering)
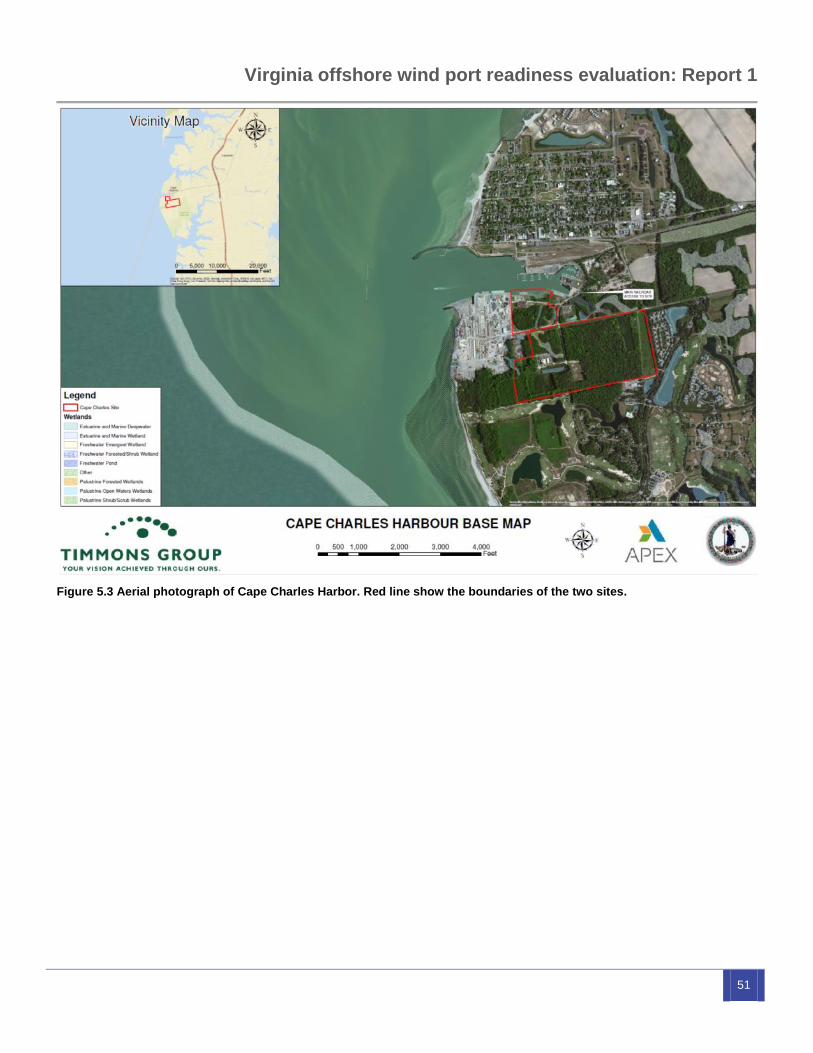
Virginia offshore wind port readiness evaluation: Report 1
51
Figure 5.3 Aerial photograph of Cape Charles Harbor. Red line show the boundaries of the two sites.
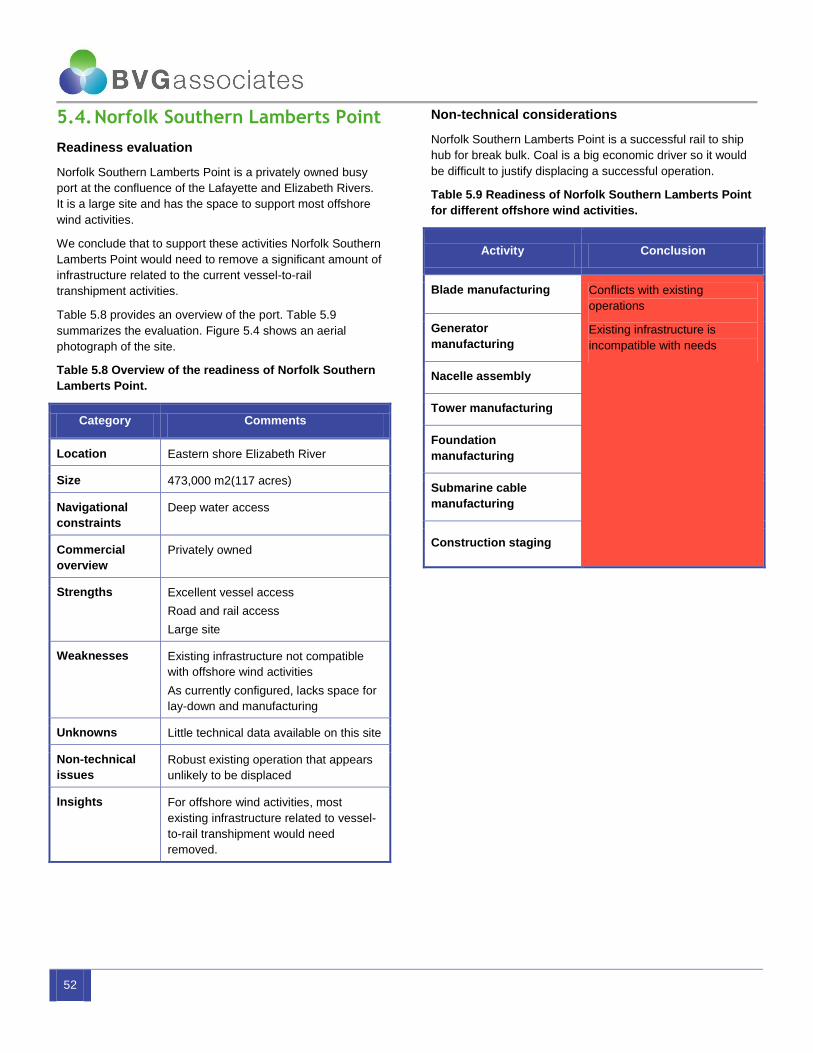
52
5.4. Norfolk Southern Lamberts Point
Readiness evaluation
Norfolk Southern Lamberts Point is a privately owned busy
port at the confluence of the Lafayette and Elizabeth Rivers.
It is a large site and has the space to support most offshore
wind activities.
We conclude that to support these activities Norfolk Southern
Lamberts Point would need to remove a significant amount of
infrastructure related to the current vessel-to-rail
transhipment activities.
Table 5.8 provides an overview of the port. Table 5.9
summarizes the evaluation. Figure 5.4 shows an aerial
photograph of the site.
Table 5.8 Overview of the readiness of Norfolk Southern
Lamberts Point.
Category Comments
Location Eastern shore Elizabeth River
Size 473,000 m2(117 acres)
Navigational
constraints
Deep water access
Commercial
overview
Privately owned
Strengths Excellent vessel access
Road and rail access
Large site
Weaknesses Existing infrastructure not compatible
with offshore wind activities
As currently configured, lacks space for
lay-down and manufacturing
Unknowns Little technical data available on this site
Non-technical
issues
Robust existing operation that appears
unlikely to be displaced
Insights For offshore wind activities, most
existing infrastructure related to vessel-
to-rail transhipment would need
removed.
Non-technical considerations
Norfolk Southern Lamberts Point is a successful rail to ship
hub for break bulk. Coal is a big economic driver so it would
be difficult to justify displacing a successful operation.
Table 5.9 Readiness of Norfolk Southern Lamberts Point
for different offshore wind activities.
Activity Conclusion
Blade manufacturing Conflicts with existing
operations
Existing infrastructure is
incompatible with needs
Generator
manufacturing
Nacelle assembly
Tower manufacturing
Foundation
manufacturing
Submarine cable
manufacturing
Construction staging
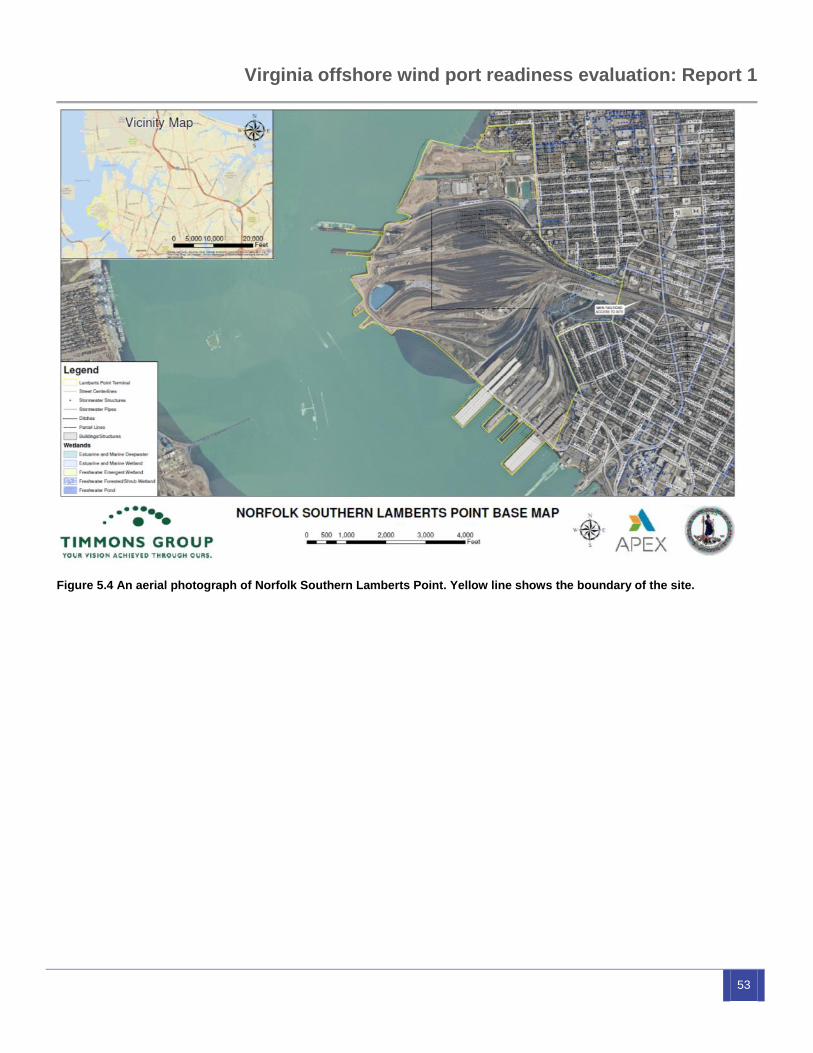
Virginia offshore wind port readiness evaluation: Report 1
53
Figure 5.4 An aerial photograph of Norfolk Southern Lamberts Point. Yellow line shows the boundary of the site.
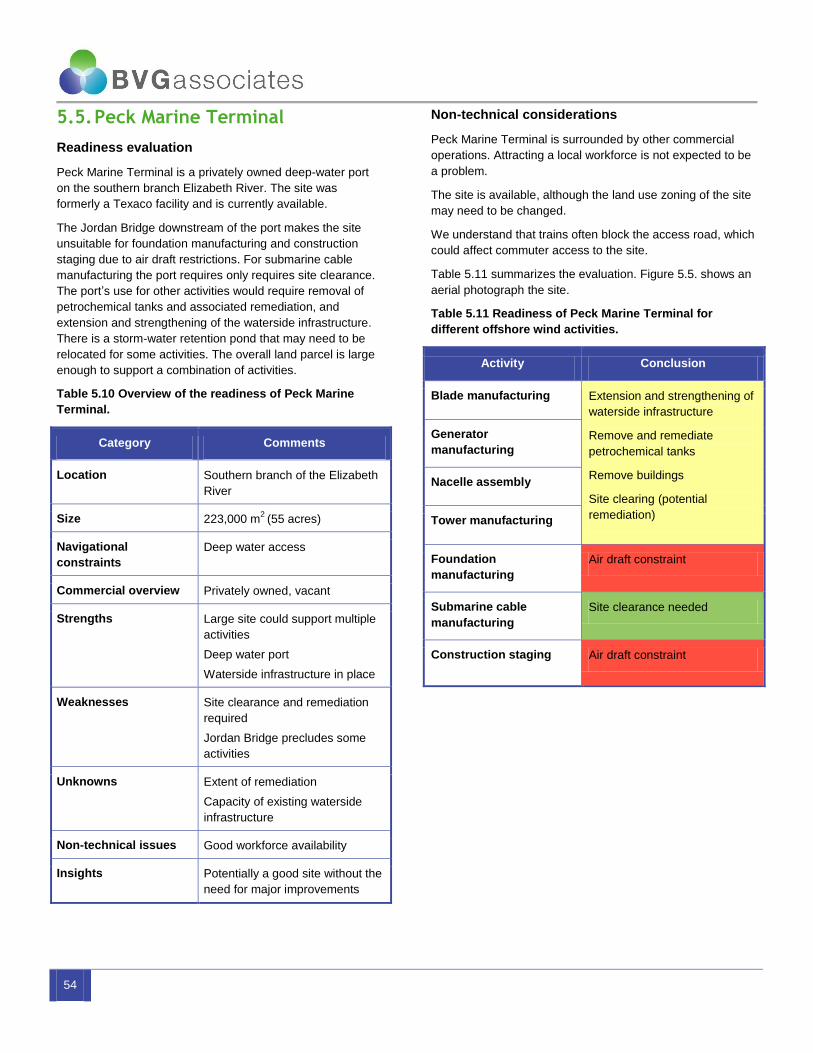
54
5.5. Peck Marine Terminal
Readiness evaluation
Peck Marine Terminal is a privately owned deep-water port
on the southern branch Elizabeth River. The site was
formerly a Texaco facility and is currently available.
The Jordan Bridge downstream of the port makes the site
unsuitable for foundation manufacturing and construction
staging due to air draft restrictions. For submarine cable
manufacturing the port requires only requires site clearance.
The port’s use for other activities would require removal of
petrochemical tanks and associated remediation, and
extension and strengthening of the waterside infrastructure.
There is a storm-water retention pond that may need to be
relocated for some activities. The overall land parcel is large
enough to support a combination of activities.
Table 5.10 Overview of the readiness of Peck Marine
Terminal.
Category Comments
Location Southern branch of the Elizabeth
River
Size 223,000 m2
(55 acres)
Navigational
constraints
Deep water access
Commercial overview Privately owned, vacant
Strengths Large site could support multiple
activities
Deep water port
Waterside infrastructure in place
Weaknesses Site clearance and remediation
required
Jordan Bridge precludes some
activities
Unknowns Extent of remediation
Capacity of existing waterside
infrastructure
Non-technical issues Good workforce availability
Insights Potentially a good site without the
need for major improvements
Non-technical considerations
Peck Marine Terminal is surrounded by other commercial
operations. Attracting a local workforce is not expected to be
a problem.
The site is available, although the land use zoning of the site
may need to be changed.
We understand that trains often block the access road, which
could affect commuter access to the site.
Table 5.11 summarizes the evaluation. Figure 5.5. shows an
aerial photograph the site.
Table 5.11 Readiness of Peck Marine Terminal for
different offshore wind activities.
Activity Conclusion
Blade manufacturing Extension and strengthening of
waterside infrastructure
Remove and remediate
petrochemical tanks
Remove buildings
Site clearing (potential
remediation)
Generator
manufacturing
Nacelle assembly
Tower manufacturing
Foundation
manufacturing
Air draft constraint
Submarine cable
manufacturing
Site clearance needed
Construction staging Air draft constraint
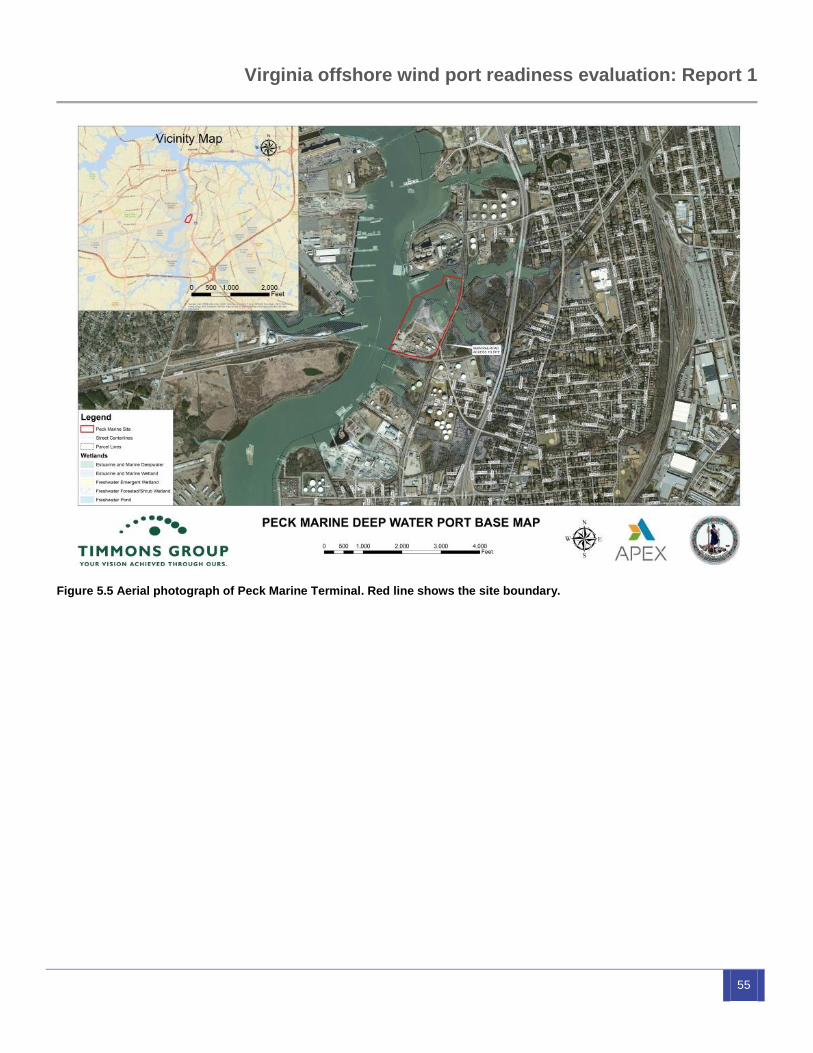
Virginia offshore wind port readiness evaluation: Report 1
55
Figure 5.5 Aerial photograph of Peck Marine Terminal. Red line shows the site boundary.
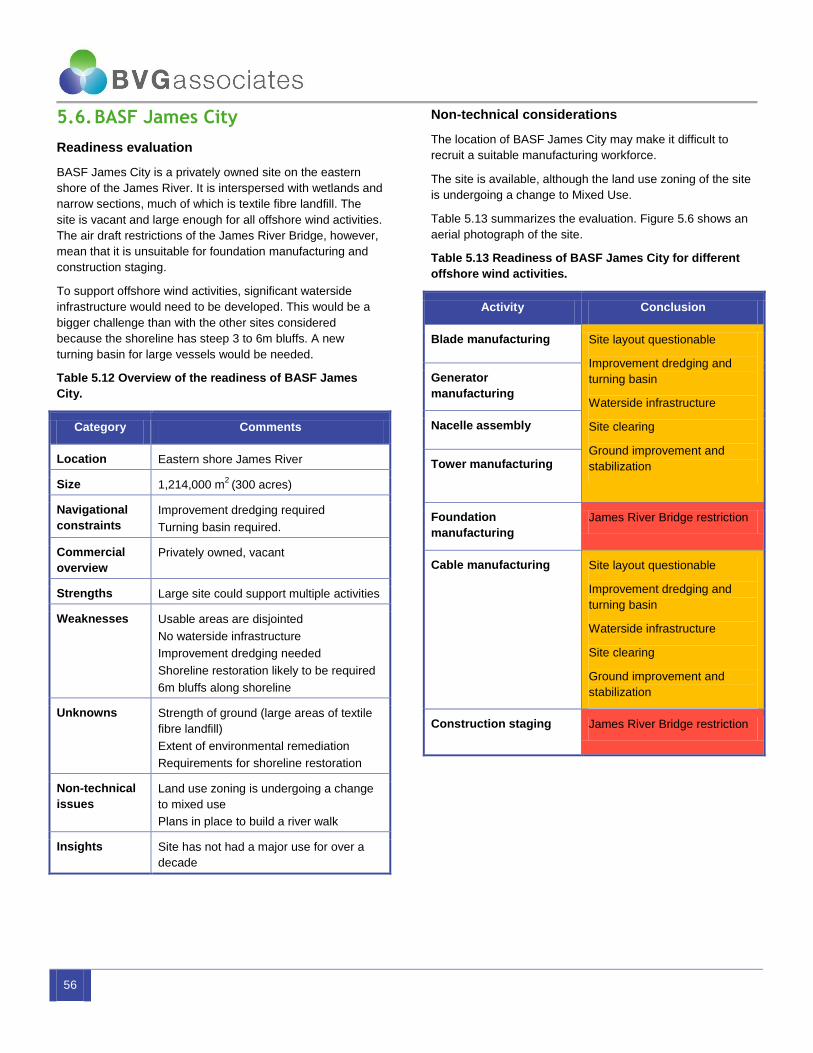
56
5.6. BASF James City
Readiness evaluation
BASF James City is a privately owned site on the eastern
shore of the James River. It is interspersed with wetlands and
narrow sections, much of which is textile fibre landfill. The
site is vacant and large enough for all offshore wind activities.
The air draft restrictions of the James River Bridge, however,
mean that it is unsuitable for foundation manufacturing and
construction staging.
To support offshore wind activities, significant waterside
infrastructure would need to be developed. This would be a
bigger challenge than with the other sites considered
because the shoreline has steep 3 to 6m bluffs. A new
turning basin for large vessels would be needed.
Table 5.12 Overview of the readiness of BASF James
City.
Category Comments
Location Eastern shore James River
Size 1,214,000 m2
(300 acres)
Navigational
constraints
Improvement dredging required
Turning basin required.
Commercial
overview
Privately owned, vacant
Strengths Large site could support multiple activities
Weaknesses Usable areas are disjointed
No waterside infrastructure
Improvement dredging needed
Shoreline restoration likely to be required
6m bluffs along shoreline
Unknowns Strength of ground (large areas of textile
fibre landfill)
Extent of environmental remediation
Requirements for shoreline restoration
Non-technical
issues
Land use zoning is undergoing a change
to mixed use
Plans in place to build a river walk
Insights Site has not had a major use for over a
decade
Non-technical considerations
The location of BASF James City may make it difficult to
recruit a suitable manufacturing workforce.
The site is available, although the land use zoning of the site
is undergoing a change to Mixed Use.
Table 5.13 summarizes the evaluation. Figure 5.6 shows an
aerial photograph of the site.
Table 5.13 Readiness of BASF James City for different
offshore wind activities.
Activity Conclusion
Blade manufacturing Site layout questionable
Improvement dredging and
turning basin
Waterside infrastructure
Site clearing
Ground improvement and
stabilization
Generator
manufacturing
Nacelle assembly
Tower manufacturing
Foundation
manufacturing
James River Bridge restriction
Cable manufacturing Site layout questionable
Improvement dredging and
turning basin
Waterside infrastructure
Site clearing
Ground improvement and
stabilization
Construction staging James River Bridge restriction
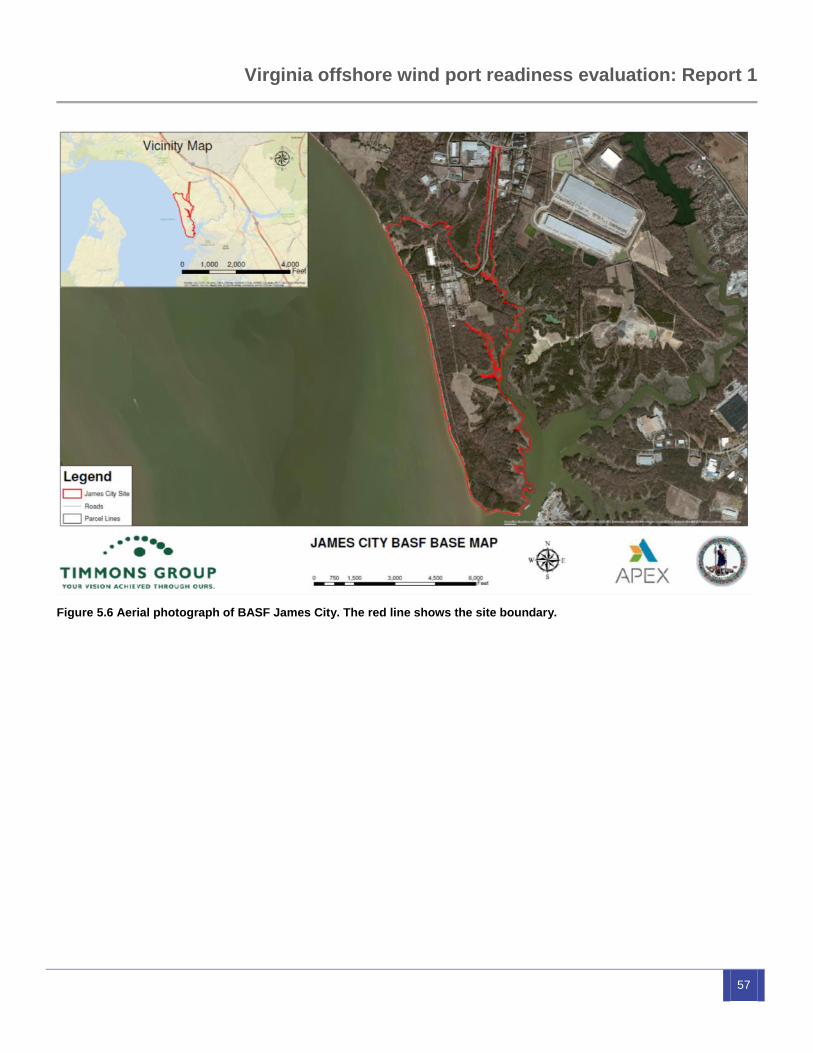
Virginia offshore wind port readiness evaluation: Report 1
57
Figure 5.6 Aerial photograph of BASF James City. The red line shows the site boundary.

58
5.7. Gravel Neck
Readiness evaluation
Gravel Neck is a privately owned forested site with wetlands.
The site is vacant and large enough for all offshore wind
activities and could host a manufacturing cluster.
To support offshore wind activities, significant waterside
infrastructure would need to be developed. Improvement
dredging would be required and access would need to be
improved.
Table 5.14 Overview of the readiness of Gravel Neck
Category Comments
Location James River
Size 2,400,000m2
(590 acres)
Navigational
constraints
Improvement dredging required
Navigational draft of Tribell Shoal
Channel is marginal for vessels
Commercial
overview
Privately owned, vacant
Strengths Large site could support multiple
activities
Weaknesses No waterside infrastructure
Improvement dredging needed
No road and rail access
Unknowns Extent of wetlands
Limited technical data available
Non-technical issues
Insights More attractive Greenfield option
than nearby BASF James City
Non-technical considerations
The location of Gravel Neck may make it difficult to recruit a
suitable manufacturing workforce.
The site is available and neighbors a nuclear power station
which may impose some restrictions.
Table 5.15 summarizes the evaluation. Figure 5.7 shows an
aerial photograph of the site.
Table 5.15 Readiness of Gravel Neck for different
offshore wind activities.
Activity Conclusion
Blade manufacturing Improvement dredging
Waterside infrastructure
Site clearing (deforestation,
wetlands, full green field
process)
Water and sewer to site
Generator
manufacturing
Nacelle assembly
Tower manufacturing
Foundation
manufacturing
James River Bridge restriction
Cable manufacturing Site clearing
Water and sewer to site
Construction staging James River Bridge restriction
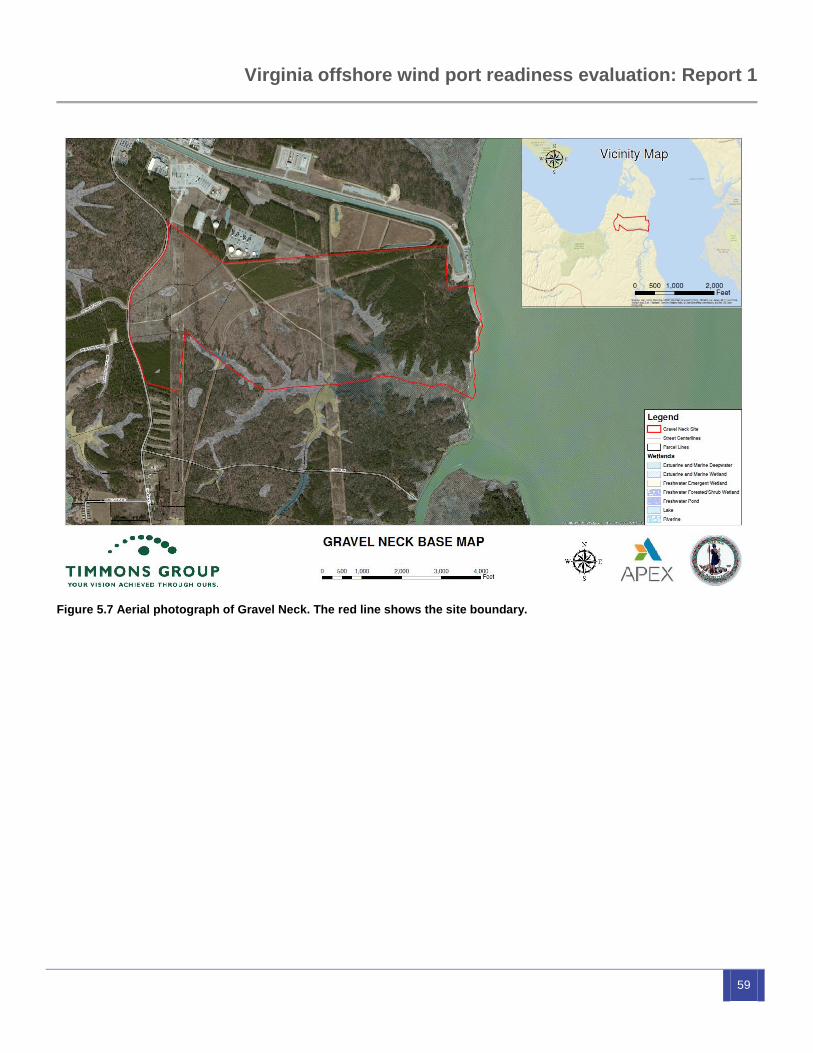
Virginia offshore wind port readiness evaluation: Report 1
59
Figure 5.7 Aerial photograph of Gravel Neck. The red line shows the site boundary.
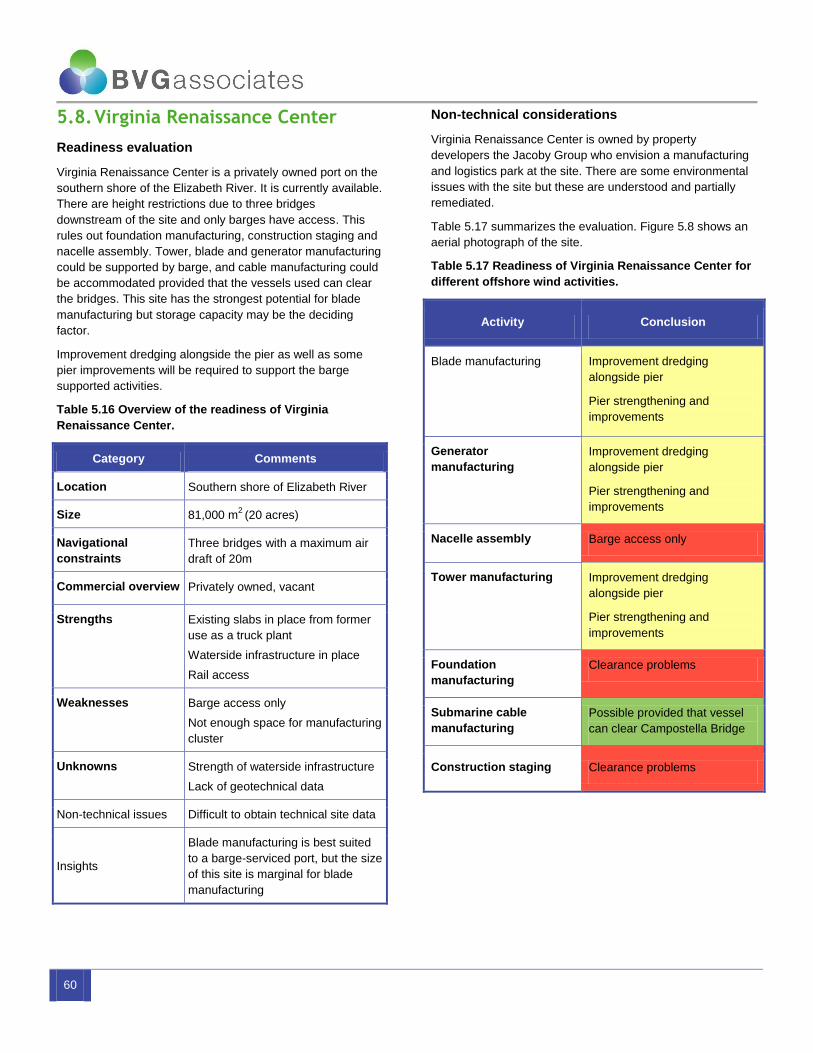
60
5.8. Virginia Renaissance Center
Readiness evaluation
Virginia Renaissance Center is a privately owned port on the
southern shore of the Elizabeth River. It is currently available.
There are height restrictions due to three bridges
downstream of the site and only barges have access. This
rules out foundation manufacturing, construction staging and
nacelle assembly. Tower, blade and generator manufacturing
could be supported by barge, and cable manufacturing could
be accommodated provided that the vessels used can clear
the bridges. This site has the strongest potential for blade
manufacturing but storage capacity may be the deciding
factor.
Improvement dredging alongside the pier as well as some
pier improvements will be required to support the barge
supported activities.
Table 5.16 Overview of the readiness of Virginia
Renaissance Center.
Category Comments
Location Southern shore of Elizabeth River
Size 81,000 m2 (20 acres)
Navigational
constraints
Three bridges with a maximum air
draft of 20m
Commercial overview Privately owned, vacant
Strengths Existing slabs in place from former
use as a truck plant
Waterside infrastructure in place
Rail access
Weaknesses Barge access only
Not enough space for manufacturing
cluster
Unknowns Strength of waterside infrastructure
Lack of geotechnical data
Non-technical issues Difficult to obtain technical site data
Insights
Blade manufacturing is best suited
to a barge-serviced port, but the size
of this site is marginal for blade
manufacturing
Non-technical considerations
Virginia Renaissance Center is owned by property
developers the Jacoby Group who envision a manufacturing
and logistics park at the site. There are some environmental
issues with the site but these are understood and partially
remediated.
Table 5.17 summarizes the evaluation. Figure 5.8 shows an
aerial photograph of the site.
Table 5.17 Readiness of Virginia Renaissance Center for
different offshore wind activities.
Activity Conclusion
Blade manufacturing Improvement dredging
alongside pier
Pier strengthening and
improvements
Generator
manufacturing
Improvement dredging
alongside pier
Pier strengthening and
improvements
Nacelle assembly Barge access only
Tower manufacturing Improvement dredging
alongside pier
Pier strengthening and
improvements
Foundation
manufacturing
Clearance problems
Submarine cable
manufacturing
Possible provided that vessel
can clear Campostella Bridge
Construction staging Clearance problems

Virginia offshore wind port readiness evaluation: Report 1
61
Figure 5.8 Aerial photograph of Virginia Renaissance Center. The red line shows the site boundary.
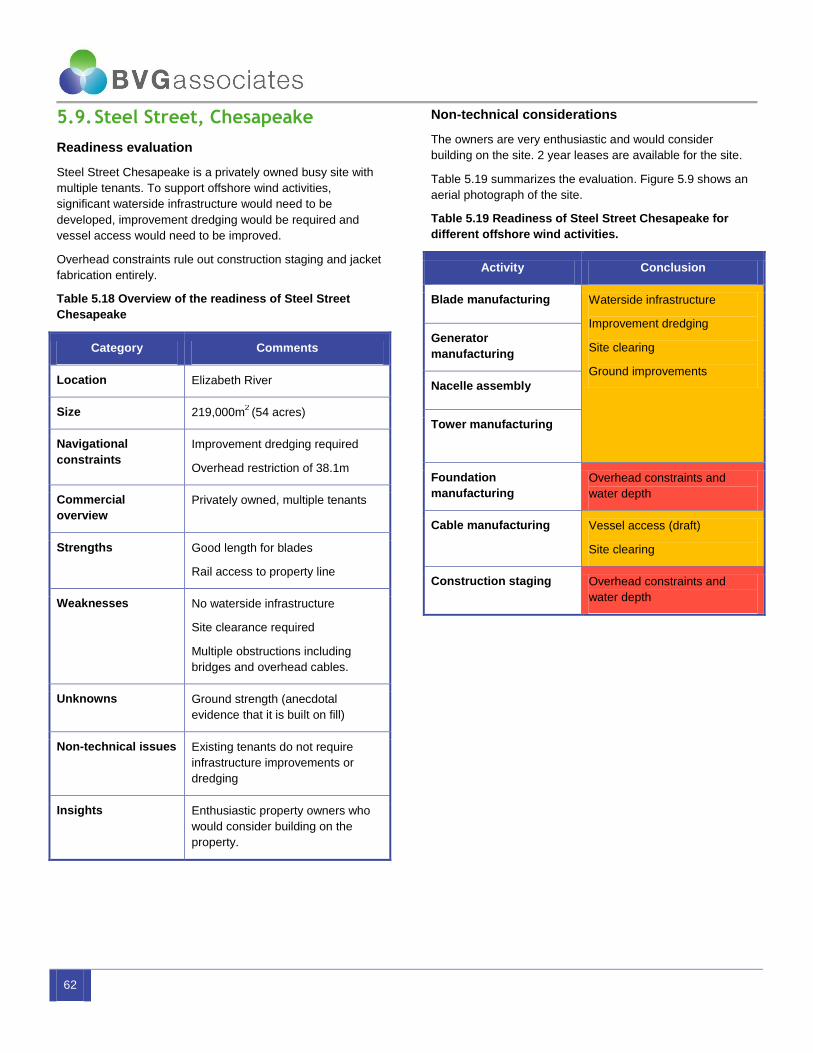
62
5.9. Steel Street, Chesapeake
Readiness evaluation
Steel Street Chesapeake is a privately owned busy site with
multiple tenants. To support offshore wind activities,
significant waterside infrastructure would need to be
developed, improvement dredging would be required and
vessel access would need to be improved.
Overhead constraints rule out construction staging and jacket
fabrication entirely.
Table 5.18 Overview of the readiness of Steel Street
Chesapeake
Category Comments
Location Elizabeth River
Size 219,000m2
(54 acres)
Navigational
constraints
Improvement dredging required
Overhead restriction of 38.1m
Commercial
overview
Privately owned, multiple tenants
Strengths Good length for blades
Rail access to property line
Weaknesses No waterside infrastructure
Site clearance required
Multiple obstructions including
bridges and overhead cables.
Unknowns Ground strength (anecdotal
evidence that it is built on fill)
Non-technical issues Existing tenants do not require
infrastructure improvements or
dredging
Insights Enthusiastic property owners who
would consider building on the
property.
Non-technical considerations
The owners are very enthusiastic and would consider
building on the site. 2 year leases are available for the site.
Table 5.19 summarizes the evaluation. Figure 5.9 shows an
aerial photograph of the site.
Table 5.19 Readiness of Steel Street Chesapeake for
different offshore wind activities.
Activity Conclusion
Blade manufacturing Waterside infrastructure
Improvement dredging
Site clearing
Ground improvements
Generator
manufacturing
Nacelle assembly
Tower manufacturing
Foundation
manufacturing
Overhead constraints and
water depth
Cable manufacturing Vessel access (draft)
Site clearing
Construction staging Overhead constraints and
water depth

Virginia offshore wind port readiness evaluation: Report 1
63
Figure 5.9 Aerial photograph of Steel Street Chesapeake. The red line shows the site boundary.
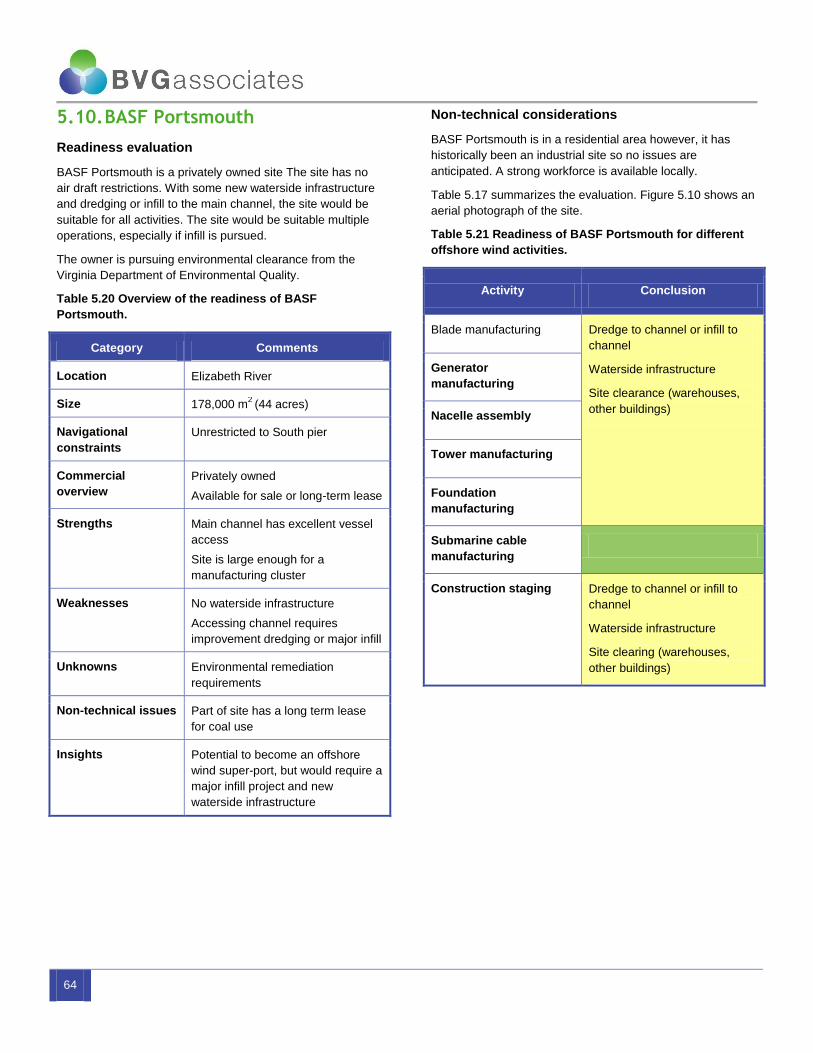
64
5.10. BASF Portsmouth
Readiness evaluation
BASF Portsmouth is a privately owned site The site has no
air draft restrictions. With some new waterside infrastructure
and dredging or infill to the main channel, the site would be
suitable for all activities. The site would be suitable multiple
operations, especially if infill is pursued.
The owner is pursuing environmental clearance from the
Virginia Department of Environmental Quality.
Table 5.20 Overview of the readiness of BASF
Portsmouth.
Category Comments
Location Elizabeth River
Size 178,000 m2
(44 acres)
Navigational
constraints
Unrestricted to South pier
Commercial
overview
Privately owned
Available for sale or long-term lease
Strengths Main channel has excellent vessel
access
Site is large enough for a
manufacturing cluster
Weaknesses No waterside infrastructure
Accessing channel requires
improvement dredging or major infill
Unknowns Environmental remediation
requirements
Non-technical issues Part of site has a long term lease
for coal use
Insights Potential to become an offshore
wind super-port, but would require a
major infill project and new
waterside infrastructure
Non-technical considerations
BASF Portsmouth is in a residential area however, it has
historically been an industrial site so no issues are
anticipated. A strong workforce is available locally.
Table 5.17 summarizes the evaluation. Figure 5.10 shows an
aerial photograph of the site.
Table 5.21 Readiness of BASF Portsmouth for different
offshore wind activities.
Activity Conclusion
Blade manufacturing Dredge to channel or infill to
channel
Waterside infrastructure
Site clearance (warehouses,
other buildings)
Generator
manufacturing
Nacelle assembly
Tower manufacturing
Foundation
manufacturing
Submarine cable
manufacturing
Construction staging Dredge to channel or infill to
channel
Waterside infrastructure
Site clearing (warehouses,
other buildings)
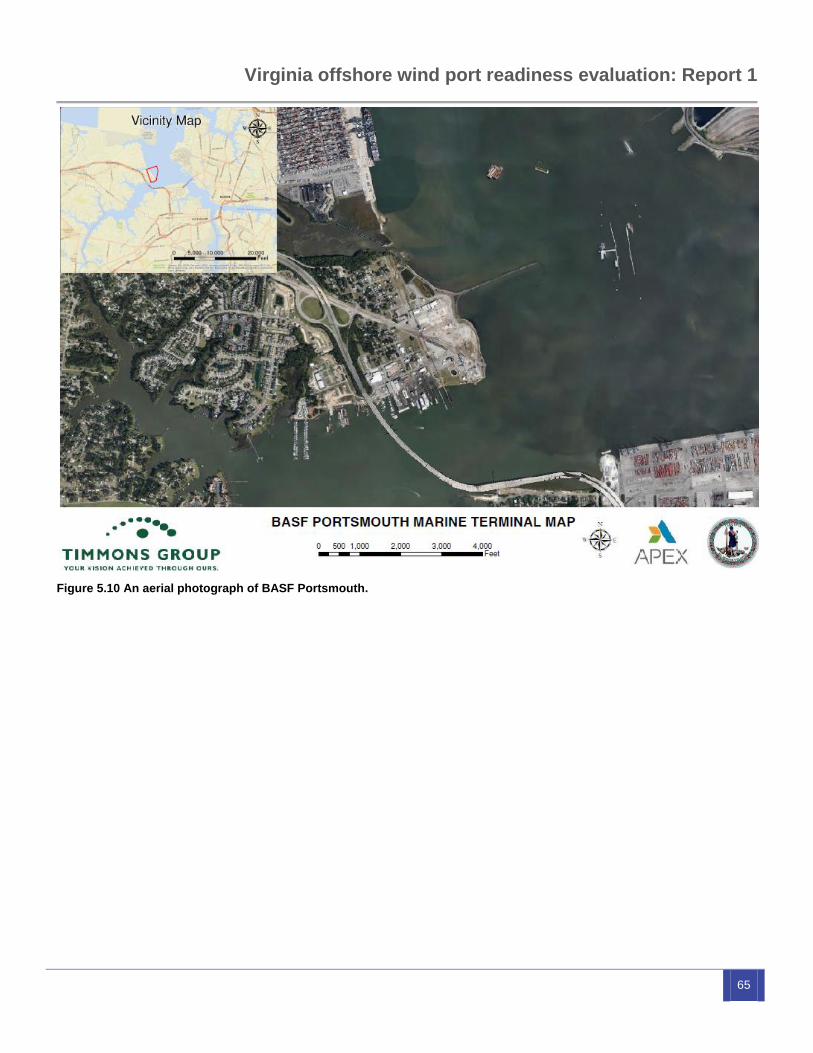
Virginia offshore wind port readiness evaluation: Report 1
65
Figure 5.10 An aerial photograph of BASF Portsmouth.
66
5.11. Commercial shipyard
capabilities for substation
manufacturing
Background
For substations, it has been assumed that orders would be
placed with commercial shipyards (or offshore fabrication
yards) and that new, bespoke manufacturing facilities will not
be developed. We therefore evaluated the readiness of
Virginia’s existing commercial shipbuilding sites, each to build
two substations per year. We evaluated both conventional
and self-installing substations, which have distinctly different
requirements.
Conventional substations comprise a foundation (monopole
or jacket) and a topside facility housing power electronics and
other equipment. The topsides range in mass from about 800
to 2,300t, and are fabricated in a shipyard. The finished
topsides are transported to the offshore site and lifted onto
their pre-installed offshore foundation using an offshore
heavy-lift crane.
For heavier topsides, of mass up to 10,000t, offshore lifting is
exceedingly difficult. Instead, a self-installing substation has
topsides integrated into a barge with jack up legs. The fully
assembled unit is towed to site, where it lowers its legs to the
sea bed and jacks up into its final position.
Virginia Shipyards
The Virginia Ship Repair Association has five members with
commercial shipbuilding facilities. We evaluated these
commercial shipyard facilities for readiness to manufacture
conventional and self-installing substations. The five
shipyards are:
BAE Systems Ship Repair
Colonna’s Shipyard
General Dynamics NASSCO
Marine Hydraulics International
Newport News Shipbuilding
All five facilities have the capability to produce conventional
substations. Two facilities – BAE Systems and Newport
News – have the capability to produce self-installing
substations (see Table 5.22). The other shipyards do not
have dry docks with sufficient beam.
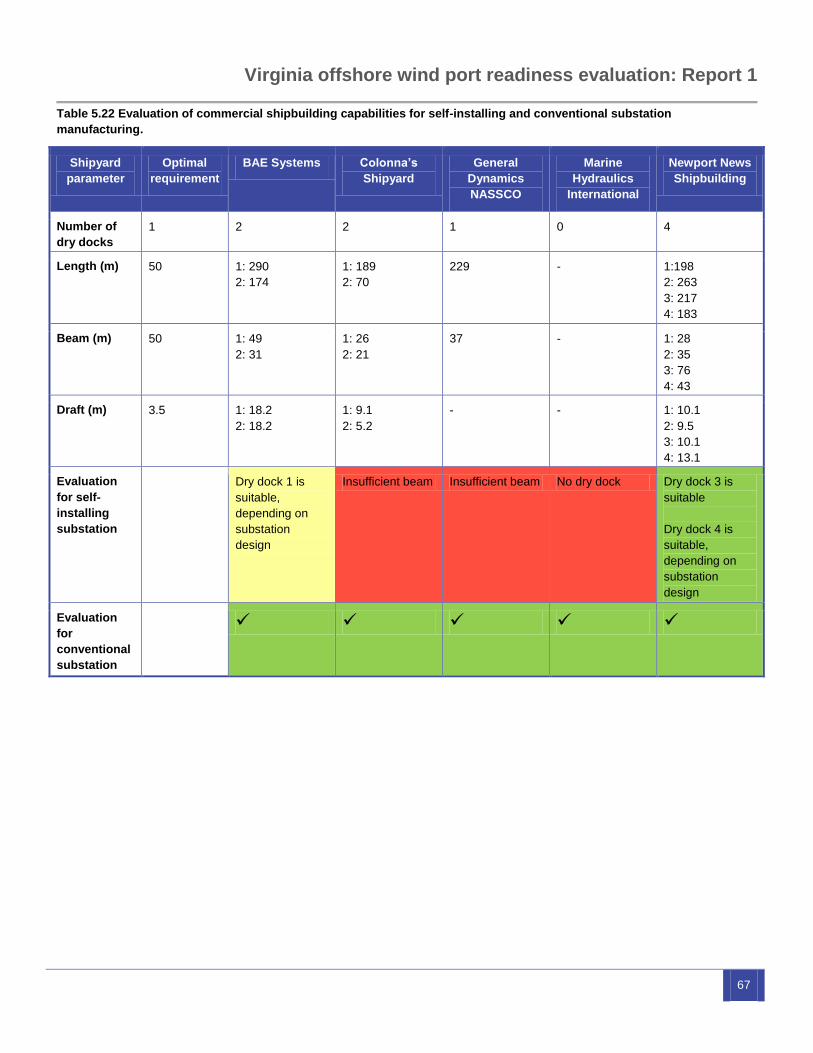
Virginia offshore wind port readiness evaluation: Report 1
67
Table 5.22 Evaluation of commercial shipbuilding capabilities for self-installing and conventional substation
manufacturing.
Shipyard
parameter
Optimal
requirement
BAE Systems Colonna’s
Shipyard
General
Dynamics
NASSCO
Marine
Hydraulics
International
Newport News
Shipbuilding
Number of
dry docks
1 2 2 1 0 4
Length (m) 50 1: 290
2: 174
1: 189
2: 70
229 - 1:198
2: 263
3: 217
4: 183
Beam (m) 50 1: 49
2: 31
1: 26
2: 21
37 - 1: 28
2: 35
3: 76
4: 43
Draft (m) 3.5 1: 18.2
2: 18.2
1: 9.1
2: 5.2
- - 1: 10.1
2: 9.5
3: 10.1
4: 13.1
Evaluation
for self-
installing
substation
Dry dock 1 is
suitable,
depending on
substation
design
Insufficient beam Insufficient beam No dry dock Dry dock 3 is
suitable
Dry dock 4 is
suitable,
depending on
substation
design
Evaluation
for
conventional
substation
68
6. Implementation
This section presents the implementation analysis for the five
ports having offshore wind port readiness rating of green or
yellow for at least one offshore wind activity. The five ports
are:
Portsmouth Marine Terminal
Newport News Marine Terminal
Peck Marine Terminal
Virginia Renaissance Center, and
BASF Portsmouth.
Table 6.1 summarizes the implementation costs, time lines
and associated construction jobs for upgrading each of the
five ports for each of the activities.
Three of the ports -- Portsmouth Marine Terminal, Newport
News Marine Terminal and BASF Portsmouth -- were
suitable for all seven offshore wind activities. All the ports
were suitable for blade manufacturing.
Submarine cable manufacturing has a low requirement for
quayside infrastructure and all of the five ports could be used
for this activity could be used without significant upgrade.
Portsmouth Marine Terminal, Peck Marine Terminal and
BASF Portsmouth have enough space to accommodate
multiple activities and these would be particularly suited to
turbine assembly, manufacturing and construction staging.
Two of the five of the sites -- Peck Marine Terminal and
Virginia Renaissance Center -- have an air draft constraint,
which means that these sites cannot be used for jacket
foundation manufacturing and construction staging.
BASF Portsmouth has the highest implementation costs,
typically five times higher than for the other four ports. This is
because of the high cost of dredging to meet requirements
for vessel draughts.
Tower manufacturing, foundation manufacturing and
construction staging typically have the highest
implementation costs. This is typically to upgrade the load-
bearing capacity of the quaysides.
Construction staging and potentially foundation
manufacturing and are likely to involve the use of jack-up
vessels to collect components and transport to the offshore
construction site for installation. To do so, jack-up vessels
need suitably firm ground conditions beside the quay to raise
the hull. Such an assessment requires geotechnical analysis
beyond the scope of this evaluation. An early stage in
exploring the feasibility of sites for these activities will be
undertaking this geotechnical work.
Sections 6.1 to 6.5 present detail for the implementation
costs, time lines, and construction jobs at each port, for each
activity and for each type of upgrade.
Appendix A provides the assumptions used to derive these
estimates.
All construction jobs are reported in FTE-years (full time jobs
lasting one year).
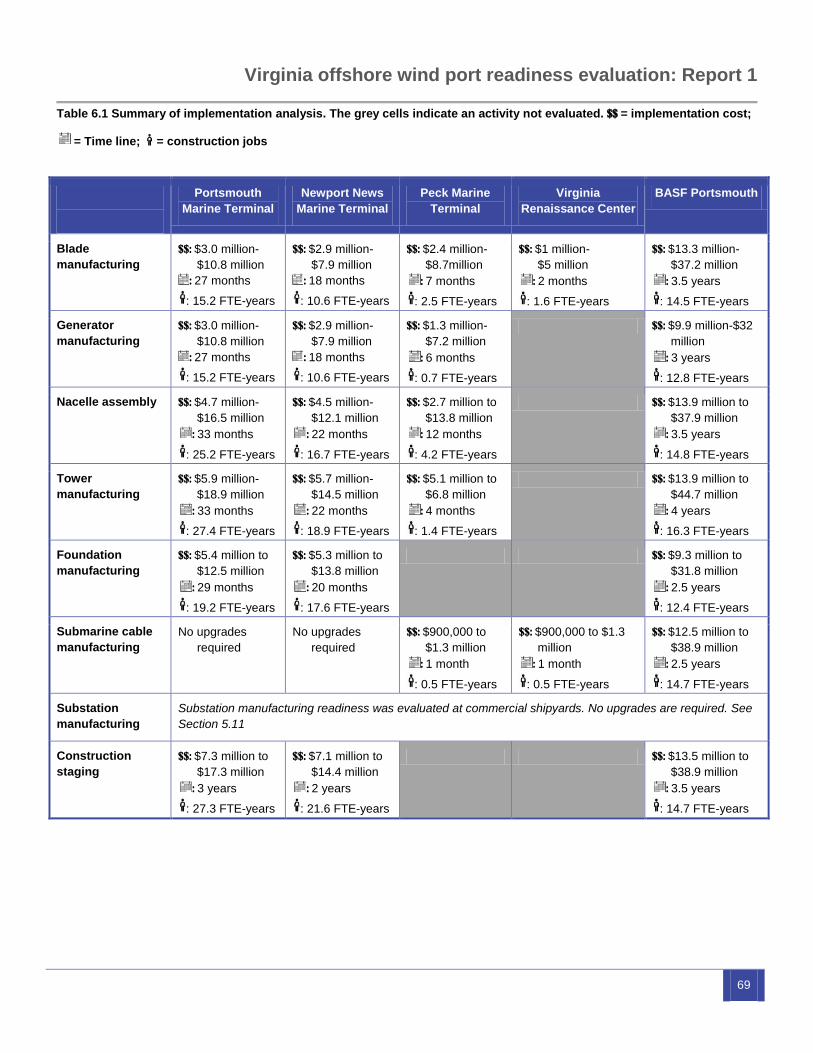
Virginia offshore wind port readiness evaluation: Report 1
69
Table 6.1 Summary of implementation analysis. The grey cells indicate an activity not evaluated. $$ = implementation cost;
= Time line; = construction jobs
Portsmouth
Marine Terminal
Newport News
Marine Terminal
Peck Marine
Terminal
Virginia
Renaissance Center
BASF Portsmouth
Blade
manufacturing
$$: $3.0 million-
$10.8 million
: 27 months
: 15.2 FTE-years
$$: $2.9 million-
$7.9 million
: 18 months
: 10.6 FTE-years
$$: $2.4 million-
$8.7million
: 7 months
: 2.5 FTE-years
$$: $1 million-
$5 million
: 2 months
: 1.6 FTE-years
$$: $13.3 million-
$37.2 million
: 3.5 years
: 14.5 FTE-years
Generator
manufacturing
$$: $3.0 million-
$10.8 million
: 27 months
: 15.2 FTE-years
$$: $2.9 million-
$7.9 million
: 18 months
: 10.6 FTE-years
$$: $1.3 million-
$7.2 million
: 6 months
: 0.7 FTE-years
$$: $9.9 million-$32
million
: 3 years
: 12.8 FTE-years
Nacelle assembly $$: $4.7 million-
$16.5 million
: 33 months
: 25.2 FTE-years
$$: $4.5 million-
$12.1 million
: 22 months
: 16.7 FTE-years
$$: $2.7 million to
$13.8 million
: 12 months
: 4.2 FTE-years
$$: $13.9 million to
$37.9 million
: 3.5 years
: 14.8 FTE-years
Tower
manufacturing
$$: $5.9 million-
$18.9 million
: 33 months
: 27.4 FTE-years
$$: $5.7 million-
$14.5 million
: 22 months
: 18.9 FTE-years
$$: $5.1 million to
$6.8 million
: 4 months
: 1.4 FTE-years
$$: $13.9 million to
$44.7 million
: 4 years
: 16.3 FTE-years
Foundation
manufacturing
$$: $5.4 million to
$12.5 million
: 29 months
: 19.2 FTE-years
$$: $5.3 million to
$13.8 million
: 20 months
: 17.6 FTE-years
$$: $9.3 million to
$31.8 million
: 2.5 years
: 12.4 FTE-years
Submarine cable
manufacturing
No upgrades
required
No upgrades
required
$$: $900,000 to
$1.3 million
: 1 month
: 0.5 FTE-years
$$: $900,000 to $1.3
million
: 1 month
: 0.5 FTE-years
$$: $12.5 million to
$38.9 million
: 2.5 years
: 14.7 FTE-years
Substation
manufacturing
Substation manufacturing readiness was evaluated at commercial shipyards. No upgrades are required. See
Section 5.11
Construction
staging
$$: $7.3 million to
$17.3 million
: 3 years
: 27.3 FTE-years
$$: $7.1 million to
$14.4 million
: 2 years
: 21.6 FTE-years
$$: $13.5 million to
$38.9 million
: 3.5 years
: 14.7 FTE-years
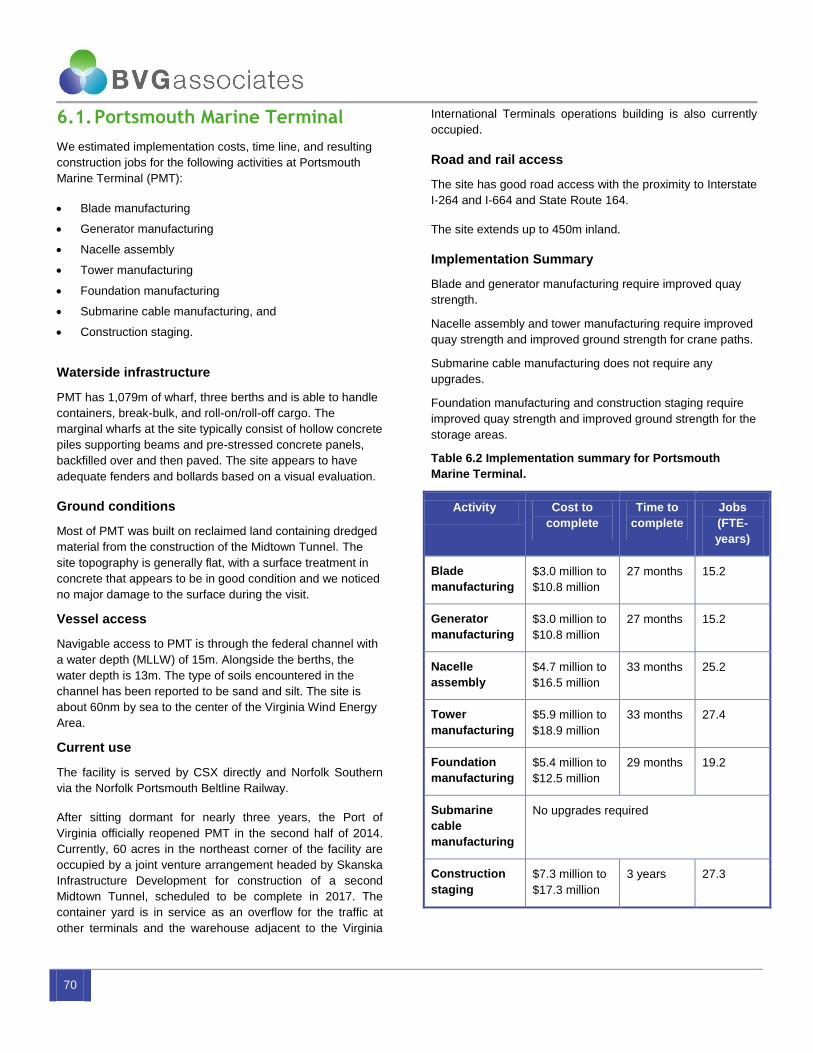
70
6.1. Portsmouth Marine Terminal
We estimated implementation costs, time line, and resulting
construction jobs for the following activities at Portsmouth
Marine Terminal (PMT):
Blade manufacturing
Generator manufacturing
Nacelle assembly
Tower manufacturing
Foundation manufacturing
Submarine cable manufacturing, and
Construction staging.
Waterside infrastructure
PMT has 1,079m of wharf, three berths and is able to handle
containers, break-bulk, and roll-on/roll-off cargo. The
marginal wharfs at the site typically consist of hollow concrete
piles supporting beams and pre-stressed concrete panels,
backfilled over and then paved. The site appears to have
adequate fenders and bollards based on a visual evaluation.
Ground conditions
Most of PMT was built on reclaimed land containing dredged
material from the construction of the Midtown Tunnel. The
site topography is generally flat, with a surface treatment in
concrete that appears to be in good condition and we noticed
no major damage to the surface during the visit.
Vessel access
Navigable access to PMT is through the federal channel with
a water depth (MLLW) of 15m. Alongside the berths, the
water depth is 13m. The type of soils encountered in the
channel has been reported to be sand and silt. The site is
about 60nm by sea to the center of the Virginia Wind Energy
Area.
Current use
The facility is served by CSX directly and Norfolk Southern
via the Norfolk Portsmouth Beltline Railway.
After sitting dormant for nearly three years, the Port of
Virginia officially reopened PMT in the second half of 2014.
Currently, 60 acres in the northeast corner of the facility are
occupied by a joint venture arrangement headed by Skanska
Infrastructure Development for construction of a second
Midtown Tunnel, scheduled to be complete in 2017. The
container yard is in service as an overflow for the traffic at
other terminals and the warehouse adjacent to the Virginia
International Terminals operations building is also currently
occupied.
Road and rail access
The site has good road access with the proximity to Interstate
I-264 and I-664 and State Route 164.
The site extends up to 450m inland.
Implementation Summary
Blade and generator manufacturing require improved quay
strength.
Nacelle assembly and tower manufacturing require improved
quay strength and improved ground strength for crane paths.
Submarine cable manufacturing does not require any
upgrades.
Foundation manufacturing and construction staging require
improved quay strength and improved ground strength for the
storage areas.
Table 6.2 Implementation summary for Portsmouth
Marine Terminal.
Activity Cost to
complete
Time to
complete
Jobs
(FTE-
years)
Blade
manufacturing
$3.0 million to
$10.8 million
27 months 15.2
Generator
manufacturing
$3.0 million to
$10.8 million
27 months 15.2
Nacelle
assembly
$4.7 million to
$16.5 million
33 months 25.2
Tower
manufacturing
$5.9 million to
$18.9 million
33 months 27.4
Foundation
manufacturing
$5.4 million to
$12.5 million
29 months 19.2
Submarine
cable
manufacturing
No upgrades required
Construction
staging
$7.3 million to
$17.3 million
3 years 27.3
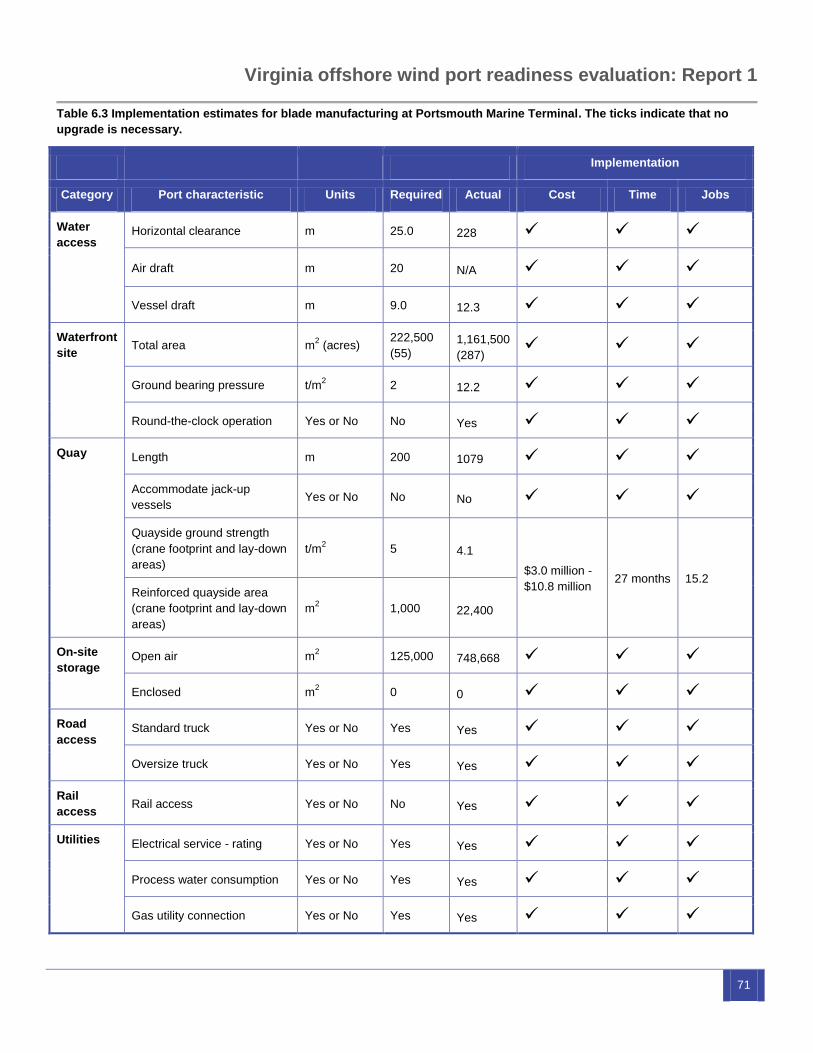
Virginia offshore wind port readiness evaluation: Report 1
71
Table 6.3 Implementation estimates for blade manufacturing at Portsmouth Marine Terminal. The ticks indicate that no
upgrade is necessary.
Implementation
Category Port characteristic Units Required Actual Cost Time Jobs
Water
access Horizontal clearance m 25.0 228
Air draft m 20 N/A
Vessel draft m 9.0 12.3
Waterfront
site Total area m
2 (acres)
222,500
(55) 1,161,500
(287)
Ground bearing pressure t/m2 2 12.2
Round-the-clock operation Yes or No No Yes
Quay Length m 200 1079
Accommodate jack-up
vessels Yes or No No No
Quayside ground strength
(crane footprint and lay-down
areas)
t/m2
5 4.1
$3.0 million -
$10.8 million 27 months 15.2
Reinforced quayside area
(crane footprint and lay-down
areas)
m2
1,000 22,400
On-site
storage Open air m
2 125,000 748,668
Enclosed m2 0 0
Road
access Standard truck Yes or No Yes Yes
Oversize truck Yes or No Yes Yes
Rail
access Rail access Yes or No No Yes
Utilities Electrical service - rating Yes or No Yes Yes
Process water consumption Yes or No Yes Yes
Gas utility connection Yes or No Yes Yes
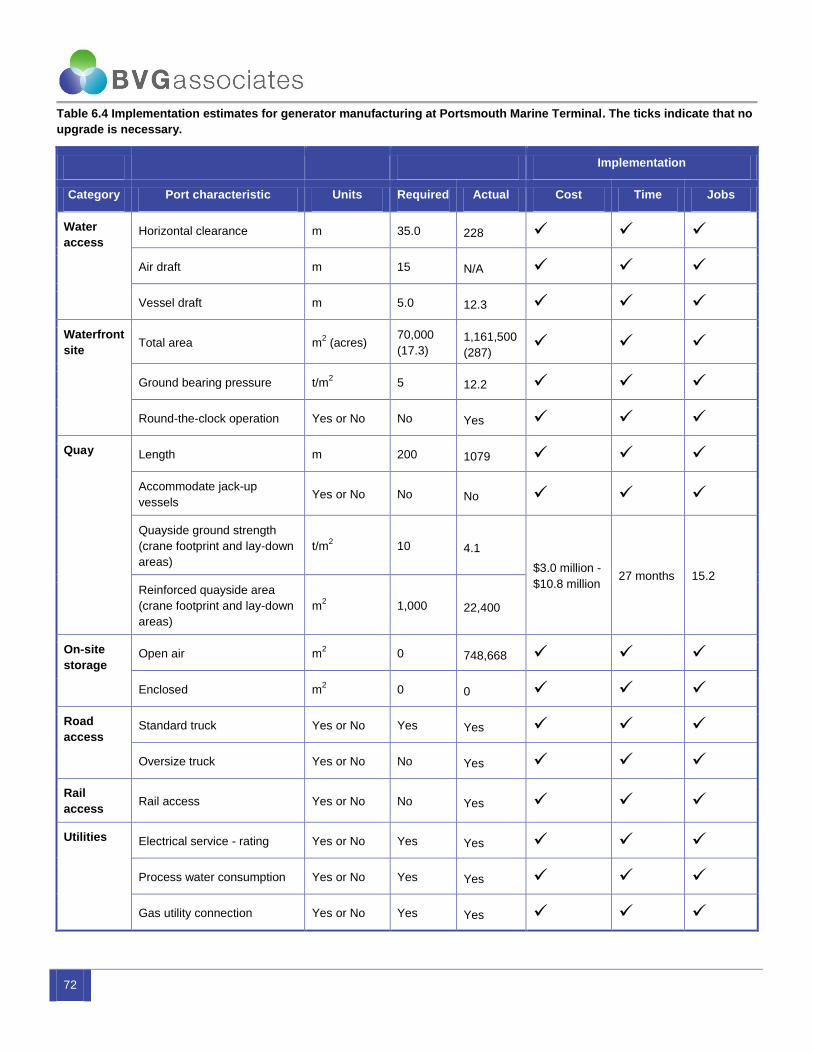
72
Table 6.4 Implementation estimates for generator manufacturing at Portsmouth Marine Terminal. The ticks indicate that no
upgrade is necessary.
Implementation
Category Port characteristic Units Required Actual Cost Time Jobs
Water
access Horizontal clearance m 35.0 228
Air draft m 15 N/A
Vessel draft m 5.0 12.3
Waterfront
site Total area m
2 (acres)
70,000
(17.3) 1,161,500
(287)
Ground bearing pressure t/m2 5 12.2
Round-the-clock operation Yes or No No Yes
Quay Length m 200 1079
Accommodate jack-up
vessels Yes or No No No
Quayside ground strength
(crane footprint and lay-down
areas)
t/m2
10 4.1
$3.0 million -
$10.8 million 27 months 15.2
Reinforced quayside area
(crane footprint and lay-down
areas)
m2
1,000 22,400
On-site
storage Open air m
2 0 748,668
Enclosed m2 0 0
Road
access Standard truck Yes or No Yes Yes
Oversize truck Yes or No No Yes
Rail
access Rail access Yes or No No Yes
Utilities Electrical service - rating Yes or No Yes Yes
Process water consumption Yes or No Yes Yes
Gas utility connection Yes or No Yes Yes
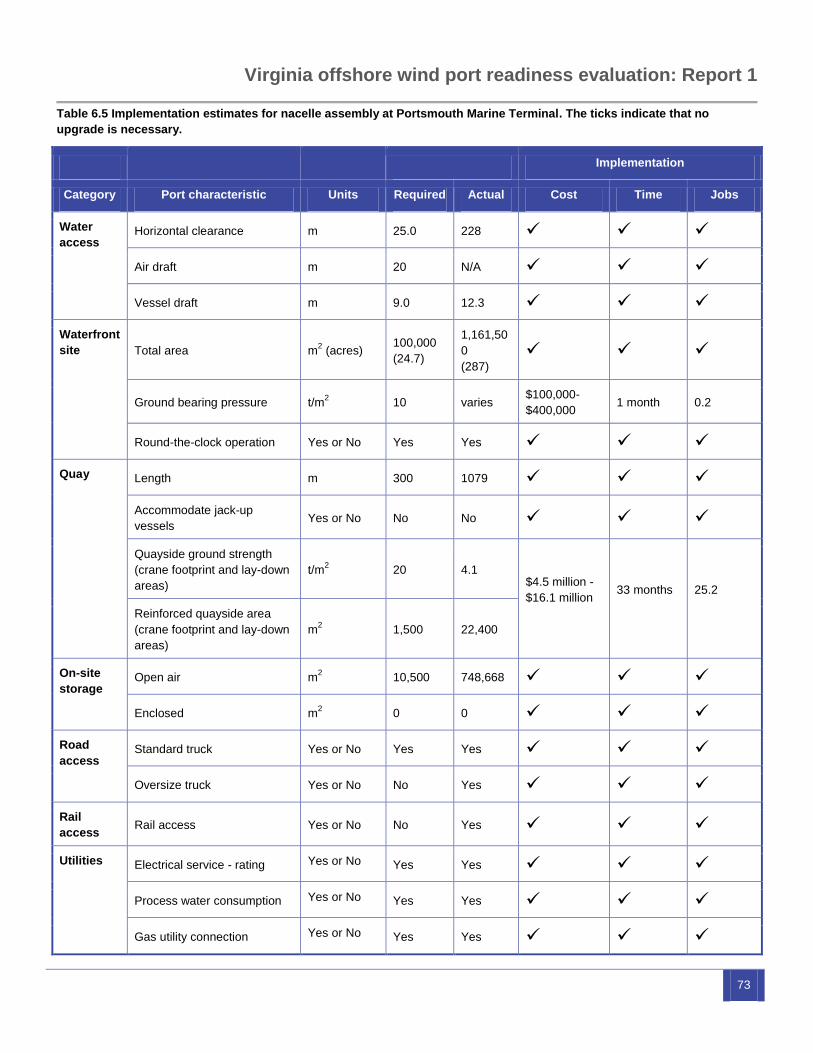
Virginia offshore wind port readiness evaluation: Report 1
73
Table 6.5 Implementation estimates for nacelle assembly at Portsmouth Marine Terminal. The ticks indicate that no
upgrade is necessary.
Implementation
Category Port characteristic Units Required Actual Cost Time Jobs
Water
access Horizontal clearance m 25.0 228
Air draft m 20 N/A
Vessel draft m 9.0 12.3
Waterfront
site Total area m2 (acres)
100,000
(24.7)
1,161,50
0
(287)
Ground bearing pressure t/m2 10 varies
$100,000-
$400,000 1 month 0.2
Round-the-clock operation Yes or No Yes Yes
Quay Length m 300 1079
Accommodate jack-up
vessels Yes or No No No
Quayside ground strength
(crane footprint and lay-down
areas)
t/m2
20 4.1 $4.5 million -
$16.1 million
33 months
25.2
Reinforced quayside area
(crane footprint and lay-down
areas)
m2
1,500 22,400
On-site
storage Open air m
2 10,500 748,668
Enclosed m2 0 0
Road
access Standard truck Yes or No Yes Yes
Oversize truck Yes or No No Yes
Rail
access Rail access Yes or No No Yes
Utilities Electrical service - rating Yes or No Yes Yes
Process water consumption Yes or No Yes Yes
Gas utility connection Yes or No Yes Yes
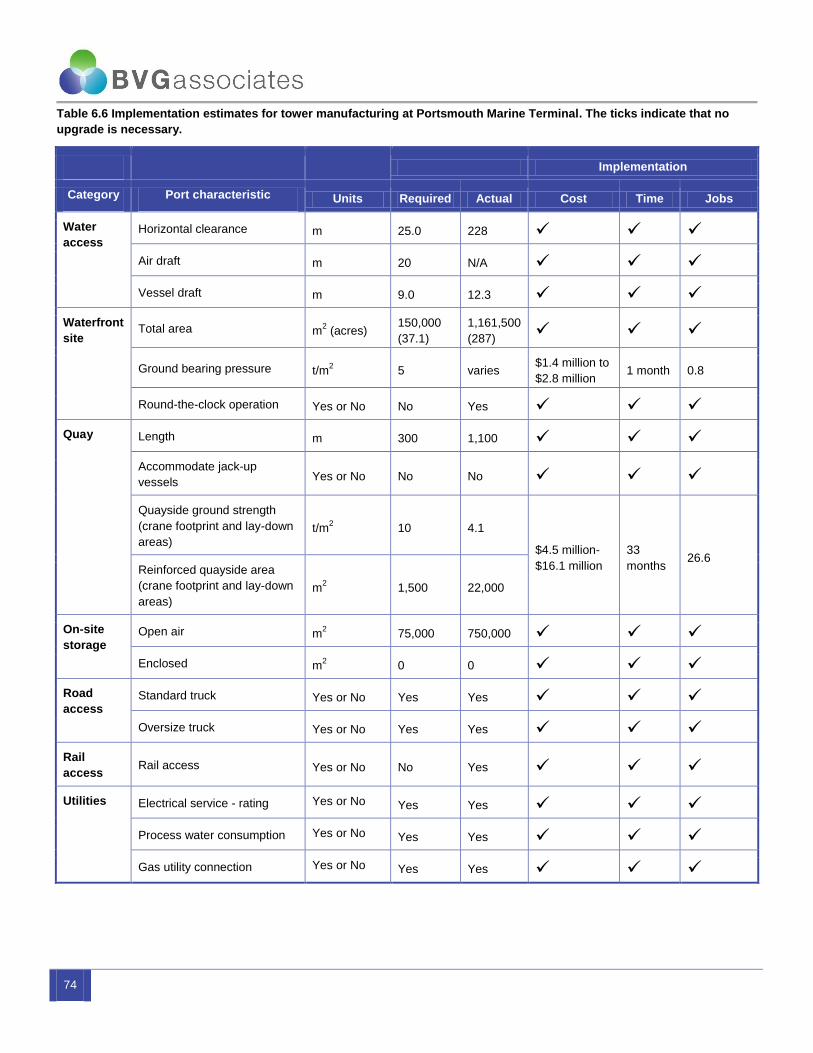
74
Table 6.6 Implementation estimates for tower manufacturing at Portsmouth Marine Terminal. The ticks indicate that no
upgrade is necessary.
Implementation
Category Port characteristic Units Required Actual Cost Time Jobs
Water
access Horizontal clearance m 25.0 228
Air draft m 20 N/A
Vessel draft m 9.0 12.3
Waterfront
site Total area m
2 (acres)
150,000
(37.1)
1,161,500
(287)
Ground bearing pressure t/m2 5 varies
$1.4 million to
$2.8 million 1 month 0.8
Round-the-clock operation Yes or No No Yes
Quay Length m 300 1,100
Accommodate jack-up
vessels Yes or No No No
Quayside ground strength
(crane footprint and lay-down
areas) t/m
2 10 4.1
$4.5 million-
$16.1 million
33
months 26.6
Reinforced quayside area
(crane footprint and lay-down
areas) m
2 1,500 22,000
On-site
storage Open air m
2 75,000 750,000
Enclosed m2 0 0
Road
access Standard truck Yes or No Yes Yes
Oversize truck Yes or No Yes Yes
Rail
access Rail access Yes or No No Yes
Utilities Electrical service - rating Yes or No Yes Yes
Process water consumption Yes or No Yes Yes
Gas utility connection Yes or No Yes Yes
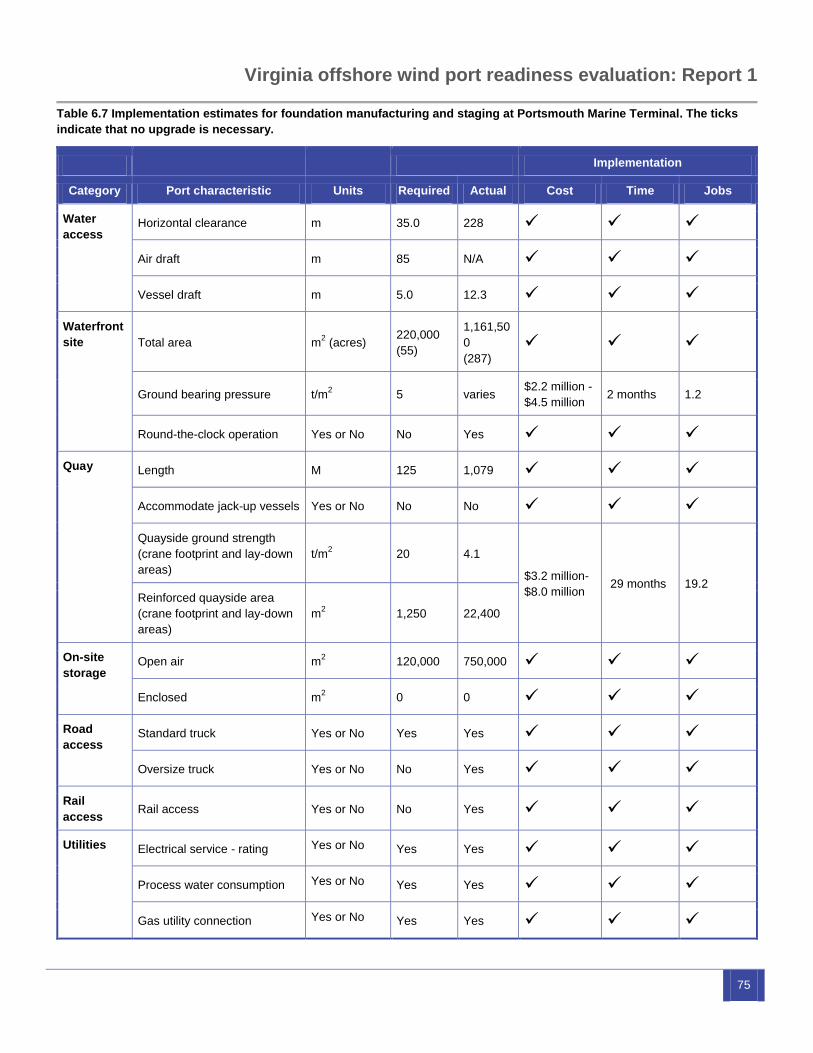
Virginia offshore wind port readiness evaluation: Report 1
75
Table 6.7 Implementation estimates for foundation manufacturing and staging at Portsmouth Marine Terminal. The ticks
indicate that no upgrade is necessary.
Implementation
Category Port characteristic Units Required Actual Cost Time Jobs
Water
access Horizontal clearance m 35.0 228
Air draft m 85 N/A
Vessel draft m 5.0 12.3
Waterfront
site Total area m2 (acres)
220,000
(55)
1,161,50
0
(287)
Ground bearing pressure t/m2 5 varies
$2.2 million -
$4.5 million 2 months 1.2
Round-the-clock operation Yes or No No Yes
Quay Length M 125 1,079
Accommodate jack-up vessels Yes or No No No
Quayside ground strength
(crane footprint and lay-down
areas)
t/m2
20 4.1
$3.2 million-
$8.0 million 29 months 19.2
Reinforced quayside area
(crane footprint and lay-down
areas)
m2
1,250 22,400
On-site
storage Open air m
2 120,000 750,000
Enclosed m2 0 0
Road
access Standard truck Yes or No Yes Yes
Oversize truck Yes or No No Yes
Rail
access Rail access Yes or No No Yes
Utilities Electrical service - rating Yes or No Yes Yes
Process water consumption Yes or No Yes Yes
Gas utility connection Yes or No Yes Yes
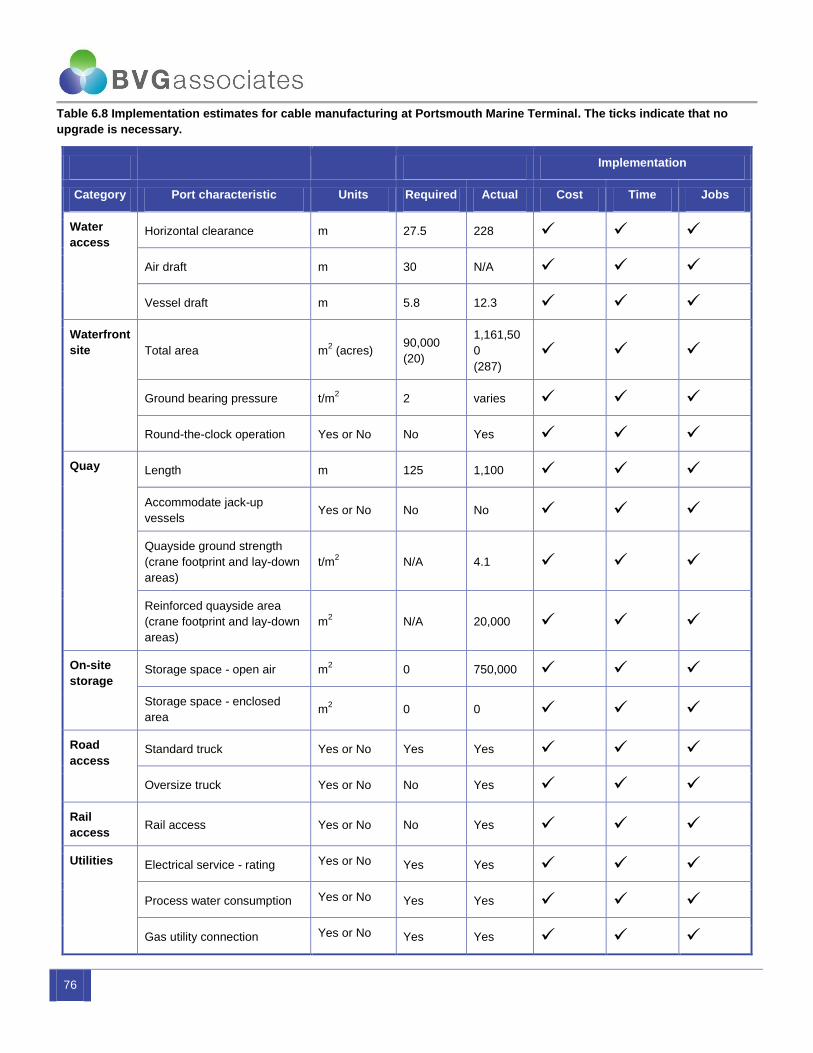
76
Table 6.8 Implementation estimates for cable manufacturing at Portsmouth Marine Terminal. The ticks indicate that no
upgrade is necessary.
Implementation
Category Port characteristic Units Required Actual Cost Time Jobs
Water
access Horizontal clearance m 27.5 228
Air draft m 30 N/A
Vessel draft m 5.8 12.3
Waterfront
site Total area m2 (acres)
90,000
(20)
1,161,50
0
(287)
Ground bearing pressure t/m2 2 varies
Round-the-clock operation Yes or No No Yes
Quay Length m 125 1,100
Accommodate jack-up
vessels Yes or No No No
Quayside ground strength
(crane footprint and lay-down
areas)
t/m2
N/A 4.1
Reinforced quayside area
(crane footprint and lay-down
areas)
m2
N/A 20,000
On-site
storage Storage space - open air m
2 0 750,000
Storage space - enclosed
area m
2 0 0
Road
access Standard truck Yes or No Yes Yes
Oversize truck Yes or No No Yes
Rail
access Rail access Yes or No No Yes
Utilities Electrical service - rating Yes or No Yes Yes
Process water consumption Yes or No Yes Yes
Gas utility connection Yes or No Yes Yes
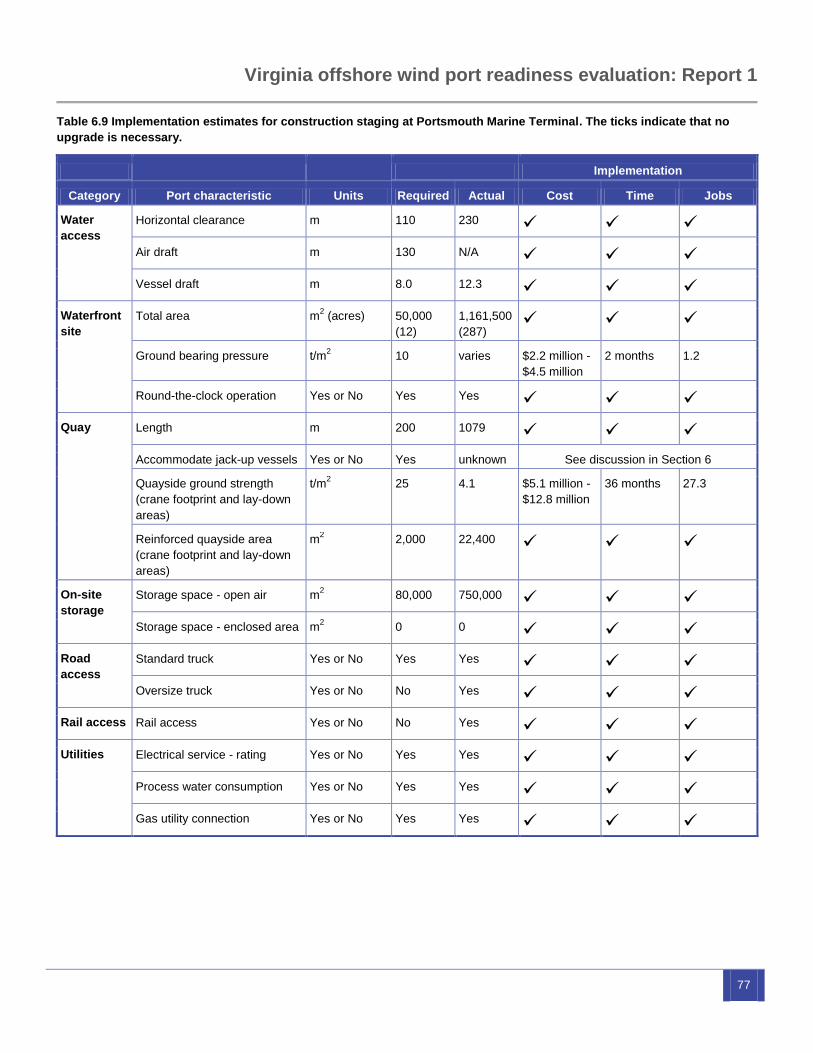
Virginia offshore wind port readiness evaluation: Report 1
77
Table 6.9 Implementation estimates for construction staging at Portsmouth Marine Terminal. The ticks indicate that no
upgrade is necessary.
Implementation
Category Port characteristic Units Required Actual Cost Time Jobs
Water
access
Horizontal clearance m 110 230
Air draft m 130 N/A
Vessel draft m 8.0 12.3
Waterfront
site
Total area m2 (acres) 50,000
(12)
1,161,500
(287)
Ground bearing pressure t/m2 10 varies $2.2 million -
$4.5 million
2 months 1.2
Round-the-clock operation Yes or No Yes Yes
Quay Length m 200 1079
Accommodate jack-up vessels Yes or No Yes unknown See discussion in Section 6
Quayside ground strength
(crane footprint and lay-down
areas)
t/m2
25 4.1 $5.1 million -
$12.8 million
36 months 27.3
Reinforced quayside area
(crane footprint and lay-down
areas)
m2
2,000 22,400
On-site
storage
Storage space - open air m2 80,000 750,000
Storage space - enclosed area m2 0 0
Road
access
Standard truck Yes or No Yes Yes
Oversize truck Yes or No No Yes
Rail access Rail access Yes or No No Yes
Utilities Electrical service - rating Yes or No Yes Yes
Process water consumption Yes or No Yes Yes
Gas utility connection Yes or No Yes Yes
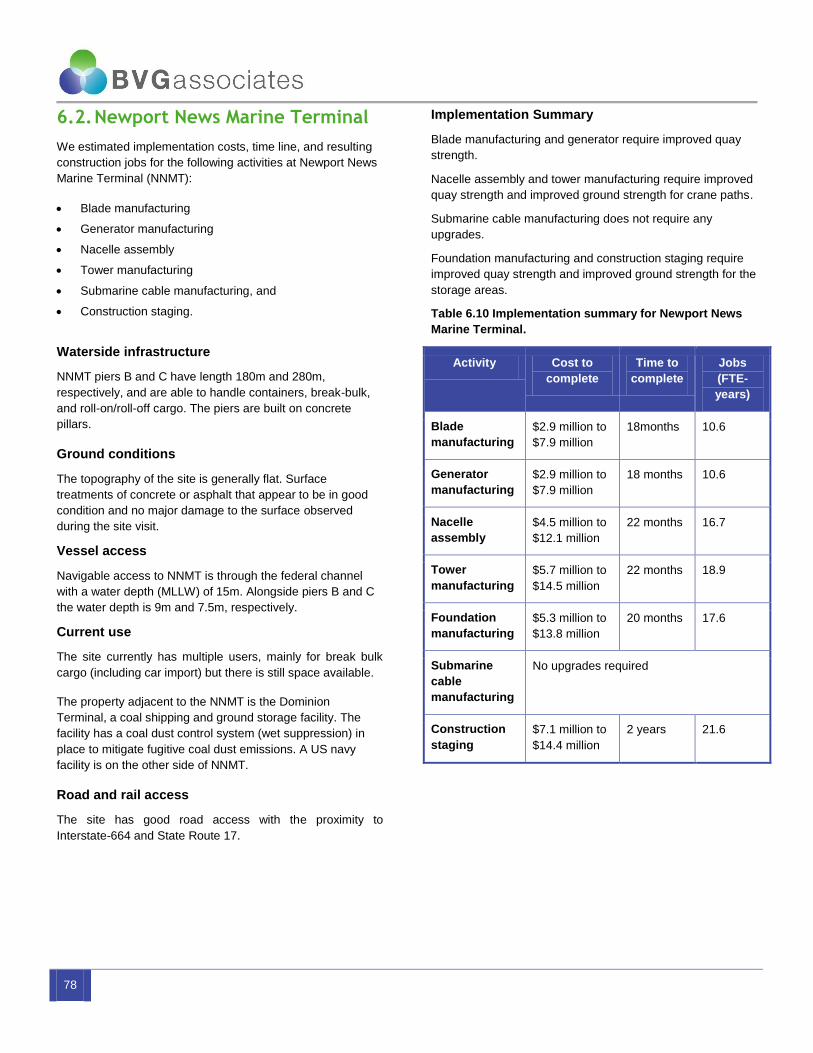
78
6.2. Newport News Marine Terminal
We estimated implementation costs, time line, and resulting
construction jobs for the following activities at Newport News
Marine Terminal (NNMT):
Blade manufacturing
Generator manufacturing
Nacelle assembly
Tower manufacturing
Submarine cable manufacturing, and
Construction staging.
Waterside infrastructure
NNMT piers B and C have length 180m and 280m,
respectively, and are able to handle containers, break-bulk,
and roll-on/roll-off cargo. The piers are built on concrete
pillars.
Ground conditions
The topography of the site is generally flat. Surface
treatments of concrete or asphalt that appear to be in good
condition and no major damage to the surface observed
during the site visit.
Vessel access
Navigable access to NNMT is through the federal channel
with a water depth (MLLW) of 15m. Alongside piers B and C
the water depth is 9m and 7.5m, respectively.
Current use
The site currently has multiple users, mainly for break bulk
cargo (including car import) but there is still space available.
The property adjacent to the NNMT is the Dominion
Terminal, a coal shipping and ground storage facility. The
facility has a coal dust control system (wet suppression) in
place to mitigate fugitive coal dust emissions. A US navy
facility is on the other side of NNMT.
Road and rail access
The site has good road access with the proximity to
Interstate-664 and State Route 17.
Implementation Summary
Blade manufacturing and generator require improved quay
strength.
Nacelle assembly and tower manufacturing require improved
quay strength and improved ground strength for crane paths.
Submarine cable manufacturing does not require any
upgrades.
Foundation manufacturing and construction staging require
improved quay strength and improved ground strength for the
storage areas.
Table 6.10 Implementation summary for Newport News
Marine Terminal.
Activity Cost to
complete
Time to
complete
Jobs
(FTE-
years)
Blade
manufacturing
$2.9 million to
$7.9 million
18months 10.6
Generator
manufacturing
$2.9 million to
$7.9 million
18 months 10.6
Nacelle
assembly
$4.5 million to
$12.1 million
22 months 16.7
Tower
manufacturing
$5.7 million to
$14.5 million
22 months 18.9
Foundation
manufacturing
$5.3 million to
$13.8 million
20 months 17.6
Submarine
cable
manufacturing
No upgrades required
Construction
staging
$7.1 million to
$14.4 million
2 years 21.6

Virginia offshore wind port readiness evaluation: Report 1
79
Table 6.11 Implementation estimates for blade manufacturing at Newport News Marine Terminal. The ticks indicate that no
upgrade is necessary.
Implementation
Category Port characteristic Units Required Actual Cost Time Jobs
Water
access Horizontal clearance m 25.0 244
Air draft m 20 N/A
Vessel draft m 9.0 14.3
Waterfront
site Total area m
2 (acres)
222,500
(55)
668,000
(165)
Ground bearing pressure t/m2 2 varies
Round-the-clock operation Yes or No No Yes
Quay Length m 200 2,400
Accommodate jack-up
vessels Yes or No No No
Quayside ground strength
(crane footprint and lay-down
areas)
t/m2
5 4.1
$2.9 million -
$7.9 million 18 months 10.6
Reinforced quayside area
(crane footprint and lay-down
areas)
m2
1,000 38,000
On-site
storage Open air m
2 125,000 240,000
Enclosed m2 0 0
Road
access Standard truck Yes or No Yes Yes
Oversize truck Yes or No Yes Yes
Rail
access Rail access Yes or No No Yes
Utilities Electrical service - rating Yes or No Yes Yes
Process water consumption Yes or No Yes Yes
Gas utility connection Yes or No Yes Yes

80
Table 6.12 Implementation estimates for generator manufacturing at Newport News Marine Terminal. The ticks indicate that
no upgrade is necessary.
Implementation
Category Port characteristic Units Required Actual Cost Time Jobs
Water
access Horizontal clearance m 35.0 244
Air draft m 15 N/A
Vessel draft m 5.0 14.3
Waterfront
site Total area m
2 (acres)
70,000
(17.3)
668,000
(165)
Ground bearing pressure t/m2 5 12.2
Round-the-clock operation Yes or No No Yes
Quay Length m 200 2,400
Accommodate jack-up
vessels Yes or No No No
Quayside ground strength
(crane footprint and lay-down
areas)
t/m2
10 4.1 $2.9 million-
$7.9 million
18 months
10.6
Reinforced quayside area
(crane footprint and lay-down
areas)
m2
1,000 38,000
On-site
storage Open air m
2 0 240,000
Enclosed m2 0 0
Road
access Standard truck Yes or No Yes Yes
Oversize truck Yes or No No Yes
Rail
access Rail access Yes or No No Yes
Utilities Electrical service - rating Yes or No Yes Yes
Process water consumption Yes or No Yes Yes
Gas utility connection Yes or No Yes Yes

Virginia offshore wind port readiness evaluation: Report 1
81
Table 6.13 Implementation estimates for nacelle assembly at Newport News Marine Terminal. The ticks indicate that no
upgrade is necessary.
Implementation
Category Port characteristic Units Required Actual Cost Time Jobs
Water
access Horizontal clearance m 25.0 244
Air draft m 20 N/A
Vessel draft m 9.0 14.3
Waterfront
site Total area m
2 (acres)
100,000
(24.7)
668,000
(165)
Ground bearing pressure t/m2 10 12.2
$200,000-
$400,000 1 month 0.2
Round-the-clock operation Yes or No Yes Yes
Quay Length m 300 2,400
Accommodate jack-up
vessels Yes or No No No
Quayside ground strength
(crane footprint and lay-down
areas)
t/m2
20 4.1 $4.3 million-
$11.7 million
22
months
16.5
Reinforced quayside area
(crane footprint and lay-down
areas)
m2
1,500 38,000
On-site
storage Open air m
2 10,500 240,000
Enclosed m2 0 0
Road
access Standard truck Yes or No Yes Yes
Oversize truck Yes or No No Yes
Rail
access Rail access Yes or No No Yes
Utilities Electrical service - rating Yes or No Yes Yes
Process water consumption Yes or No Yes Yes
Gas utility connection Yes or No Yes Yes

82
Table 6.14 Implementation estimates for tower manufacturing at Newport News Marine Terminal. The ticks indicate that no
upgrade is necessary.
Implementation
Category Port characteristic Units Required Actual Cost Time Jobs
Water
access Horizontal clearance m 25.0 244
Air draft m 20 N/A
Vessel draft m 9.0 14.3
Waterfront
site Total area m
2 (acres)
150,000
(37.1)
668,000
(165)
Ground bearing pressure t/m2 5 12.2
$1.4 million -
$2.8 million 2 month 0.8
Round-the-clock operation Yes or No No Yes
Quay Length m 300 2,400
Accommodate jack-up
vessels Yes or No No No
Quayside ground strength
(crane footprint and lay-down
areas) t/m
2 10 4.1
$4.3 million-
$11.7 million
22
months 18.1
Reinforced quayside area
(crane footprint and lay-down
areas) m
2 1,500 38,000
On-site
storage Open air m
2 75,000 240,000
Enclosed m2 0 0
Road
access Standard truck Yes or No Yes Yes
Oversize truck Yes or No Yes Yes
Rail
access Rail access Yes or No No Yes
Utilities Electrical service - rating Yes or No Yes Yes
Process water consumption Yes or No Yes Yes
Gas utility connection Yes or No Yes Yes
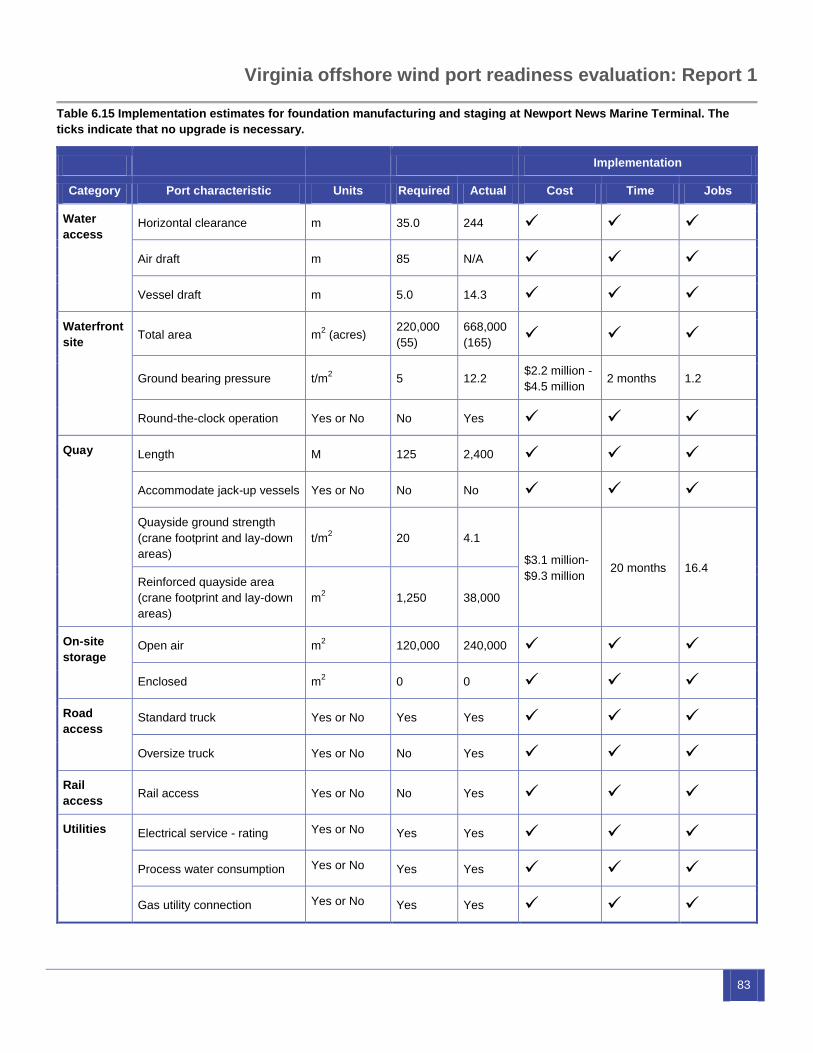
Virginia offshore wind port readiness evaluation: Report 1
83
Table 6.15 Implementation estimates for foundation manufacturing and staging at Newport News Marine Terminal. The
ticks indicate that no upgrade is necessary.
Implementation
Category Port characteristic Units Required Actual Cost Time Jobs
Water
access Horizontal clearance m 35.0 244
Air draft m 85 N/A
Vessel draft m 5.0 14.3
Waterfront
site Total area m
2 (acres)
220,000
(55)
668,000
(165)
Ground bearing pressure t/m2 5 12.2
$2.2 million -
$4.5 million 2 months 1.2
Round-the-clock operation Yes or No No Yes
Quay Length M 125 2,400
Accommodate jack-up vessels Yes or No No No
Quayside ground strength
(crane footprint and lay-down
areas)
t/m2
20 4.1
$3.1 million-
$9.3 million 20 months 16.4
Reinforced quayside area
(crane footprint and lay-down
areas)
m2
1,250 38,000
On-site
storage Open air m
2 120,000 240,000
Enclosed m2 0 0
Road
access Standard truck Yes or No Yes Yes
Oversize truck Yes or No No Yes
Rail
access Rail access Yes or No No Yes
Utilities Electrical service - rating Yes or No Yes Yes
Process water consumption Yes or No Yes Yes
Gas utility connection Yes or No Yes Yes
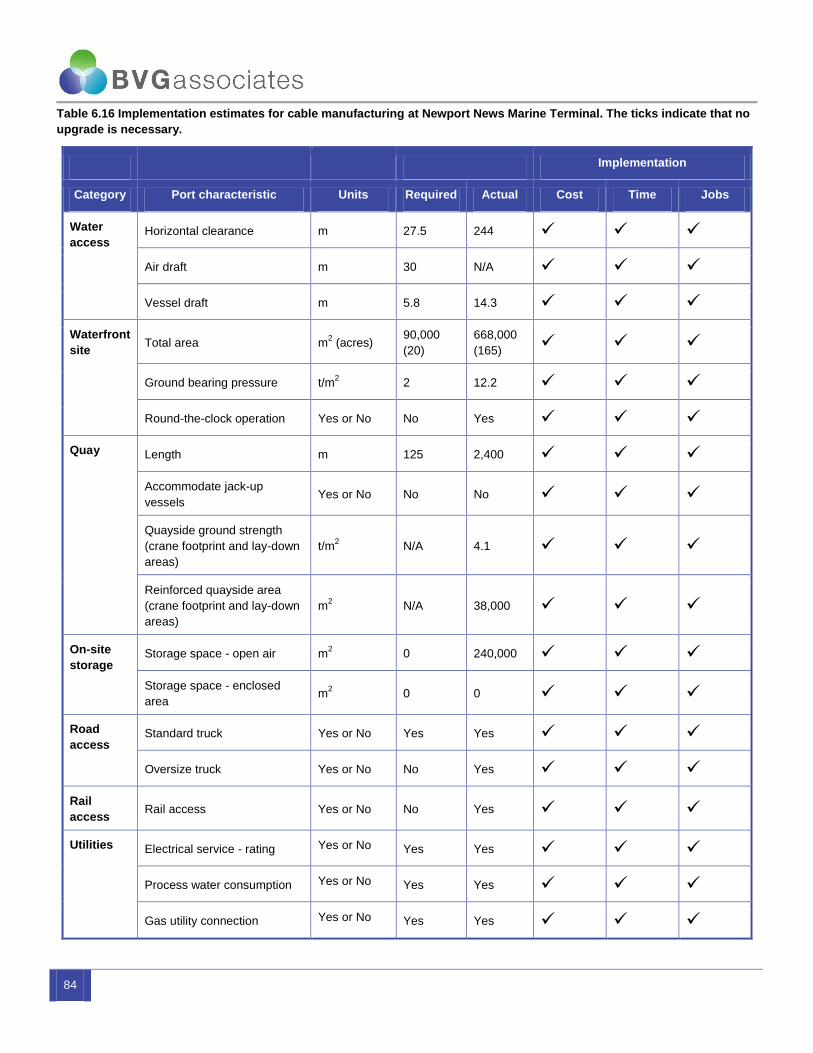
84
Table 6.16 Implementation estimates for cable manufacturing at Newport News Marine Terminal. The ticks indicate that no
upgrade is necessary.
Implementation
Category Port characteristic Units Required Actual Cost Time Jobs
Water
access Horizontal clearance m 27.5 244
Air draft m 30 N/A
Vessel draft m 5.8 14.3
Waterfront
site Total area m
2 (acres)
90,000
(20)
668,000
(165)
Ground bearing pressure t/m2 2 12.2
Round-the-clock operation Yes or No No Yes
Quay Length m 125 2,400
Accommodate jack-up
vessels Yes or No No No
Quayside ground strength
(crane footprint and lay-down
areas)
t/m2
N/A 4.1
Reinforced quayside area
(crane footprint and lay-down
areas)
m2
N/A 38,000
On-site
storage Storage space - open air m
2 0 240,000
Storage space - enclosed
area m
2 0 0
Road
access Standard truck Yes or No Yes Yes
Oversize truck Yes or No No Yes
Rail
access Rail access Yes or No No Yes
Utilities Electrical service - rating Yes or No Yes Yes
Process water consumption Yes or No Yes Yes
Gas utility connection Yes or No Yes Yes
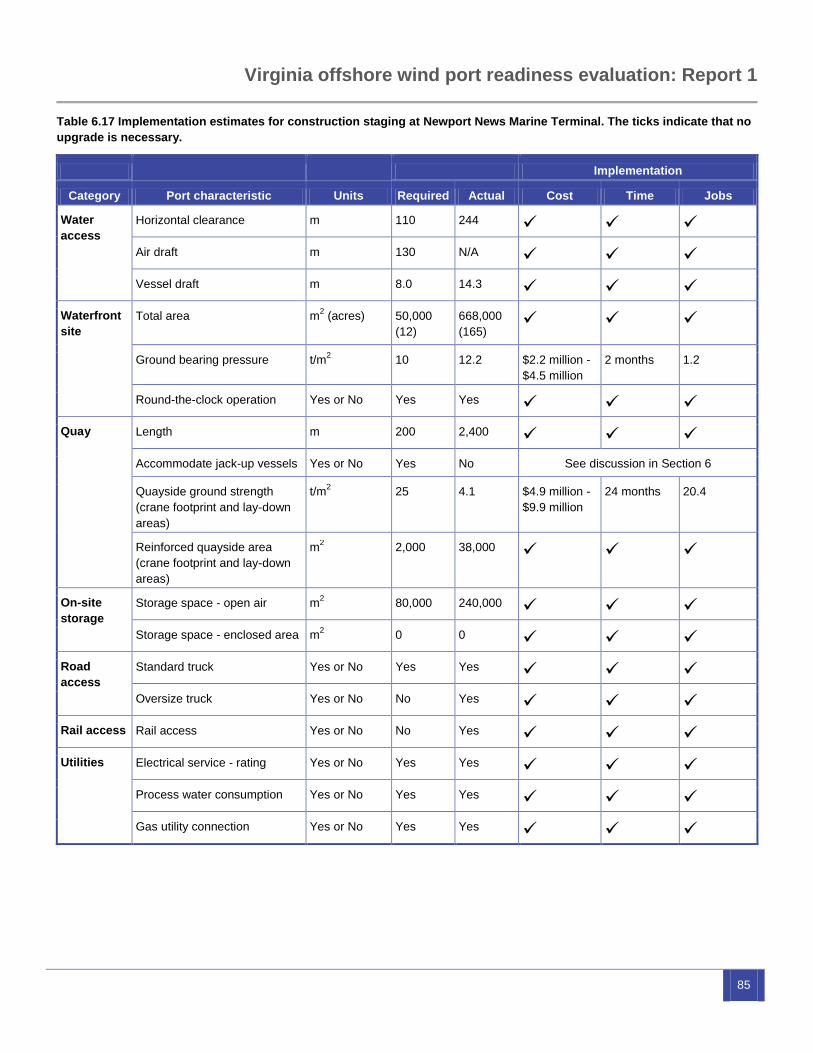
Virginia offshore wind port readiness evaluation: Report 1
85
Table 6.17 Implementation estimates for construction staging at Newport News Marine Terminal. The ticks indicate that no
upgrade is necessary.
Implementation
Category Port characteristic Units Required Actual Cost Time Jobs
Water
access
Horizontal clearance m 110 244
Air draft m 130 N/A
Vessel draft m 8.0 14.3
Waterfront
site
Total area m2 (acres) 50,000
(12)
668,000
(165)
Ground bearing pressure t/m2 10 12.2 $2.2 million -
$4.5 million
2 months 1.2
Round-the-clock operation Yes or No Yes Yes
Quay Length m 200 2,400
Accommodate jack-up vessels Yes or No Yes No See discussion in Section 6
Quayside ground strength
(crane footprint and lay-down
areas)
t/m2
25 4.1 $4.9 million -
$9.9 million
24 months 20.4
Reinforced quayside area
(crane footprint and lay-down
areas)
m2
2,000 38,000
On-site
storage
Storage space - open air m2 80,000 240,000
Storage space - enclosed area m2 0 0
Road
access
Standard truck Yes or No Yes Yes
Oversize truck Yes or No No Yes
Rail access Rail access Yes or No No Yes
Utilities Electrical service - rating Yes or No Yes Yes
Process water consumption Yes or No Yes Yes
Gas utility connection Yes or No Yes Yes
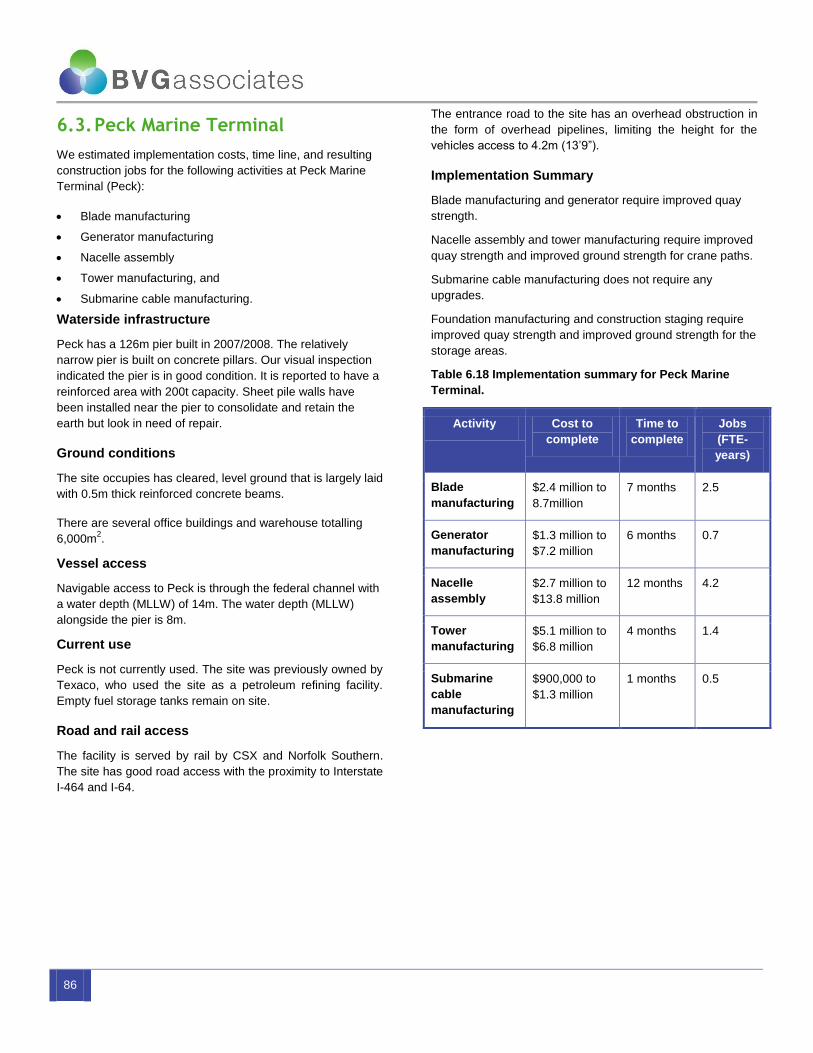
86
6.3. Peck Marine Terminal
We estimated implementation costs, time line, and resulting
construction jobs for the following activities at Peck Marine
Terminal (Peck):
Blade manufacturing
Generator manufacturing
Nacelle assembly
Tower manufacturing, and
Submarine cable manufacturing.
Waterside infrastructure
Peck has a 126m pier built in 2007/2008. The relatively
narrow pier is built on concrete pillars. Our visual inspection
indicated the pier is in good condition. It is reported to have a
reinforced area with 200t capacity. Sheet pile walls have
been installed near the pier to consolidate and retain the
earth but look in need of repair.
Ground conditions
The site occupies has cleared, level ground that is largely laid
with 0.5m thick reinforced concrete beams.
There are several office buildings and warehouse totalling
6,000m2.
Vessel access
Navigable access to Peck is through the federal channel with
a water depth (MLLW) of 14m. The water depth (MLLW)
alongside the pier is 8m.
Current use
Peck is not currently used. The site was previously owned by
Texaco, who used the site as a petroleum refining facility.
Empty fuel storage tanks remain on site.
Road and rail access
The facility is served by rail by CSX and Norfolk Southern.
The site has good road access with the proximity to Interstate
I-464 and I-64.
The entrance road to the site has an overhead obstruction in
the form of overhead pipelines, limiting the height for the
vehicles access to 4.2m (13’9”).
Implementation Summary
Blade manufacturing and generator require improved quay
strength.
Nacelle assembly and tower manufacturing require improved
quay strength and improved ground strength for crane paths.
Submarine cable manufacturing does not require any
upgrades.
Foundation manufacturing and construction staging require
improved quay strength and improved ground strength for the
storage areas.
Table 6.18 Implementation summary for Peck Marine
Terminal.
Activity Cost to
complete
Time to
complete
Jobs
(FTE-
years)
Blade
manufacturing
$2.4 million to
8.7million
7 months 2.5
Generator
manufacturing
$1.3 million to
$7.2 million
6 months 0.7
Nacelle
assembly
$2.7 million to
$13.8 million
12 months 4.2
Tower
manufacturing
$5.1 million to
$6.8 million
4 months 1.4
Submarine
cable
manufacturing
$900,000 to
$1.3 million
1 months 0.5
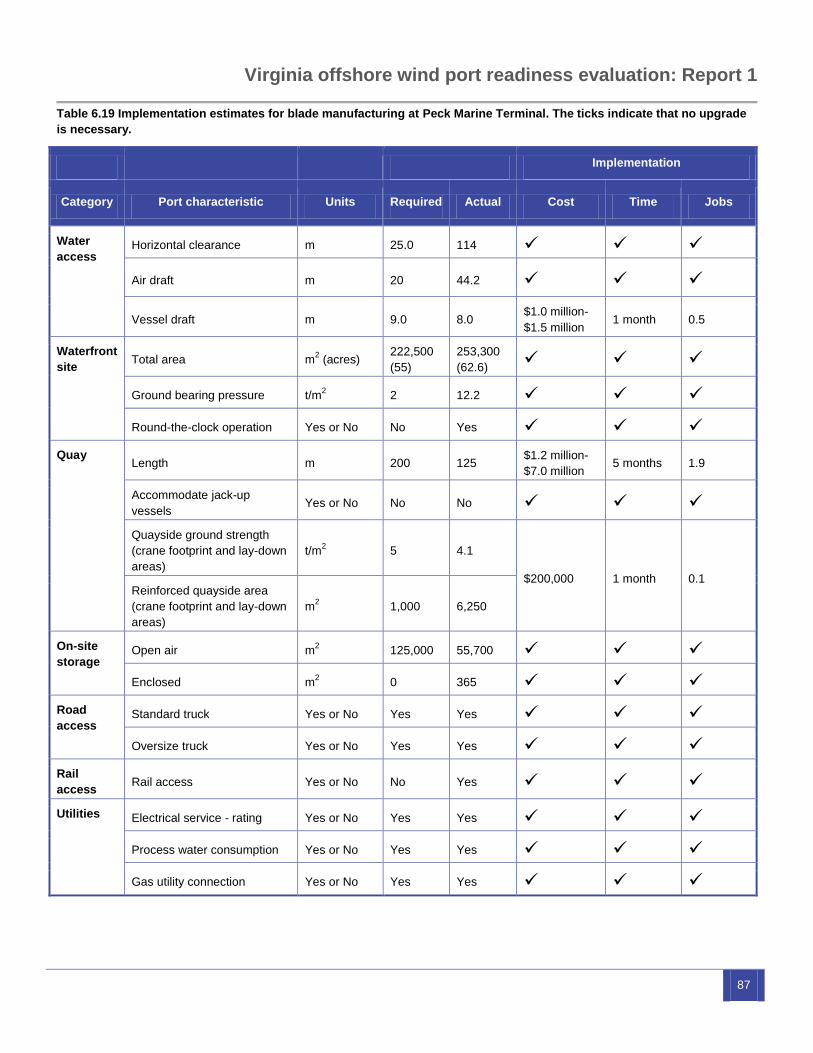
Virginia offshore wind port readiness evaluation: Report 1
87
Table 6.19 Implementation estimates for blade manufacturing at Peck Marine Terminal. The ticks indicate that no upgrade
is necessary.
Implementation
Category Port characteristic Units Required Actual Cost Time Jobs
Water
access Horizontal clearance m 25.0 114
Air draft m 20 44.2
Vessel draft m 9.0 8.0 $1.0 million-
$1.5 million 1 month 0.5
Waterfront
site Total area m
2 (acres)
222,500
(55)
253,300
(62.6)
Ground bearing pressure t/m2 2 12.2
Round-the-clock operation Yes or No No Yes
Quay Length m 200 125
$1.2 million-
$7.0 million 5 months 1.9
Accommodate jack-up
vessels Yes or No No No
Quayside ground strength
(crane footprint and lay-down
areas)
t/m2
5 4.1
$200,000 1 month 0.1 Reinforced quayside area
(crane footprint and lay-down
areas)
m2
1,000 6,250
On-site
storage Open air m
2 125,000 55,700
Enclosed m2 0 365
Road
access Standard truck Yes or No Yes Yes
Oversize truck Yes or No Yes Yes
Rail
access Rail access Yes or No No Yes
Utilities Electrical service - rating Yes or No Yes Yes
Process water consumption Yes or No Yes Yes
Gas utility connection Yes or No Yes Yes
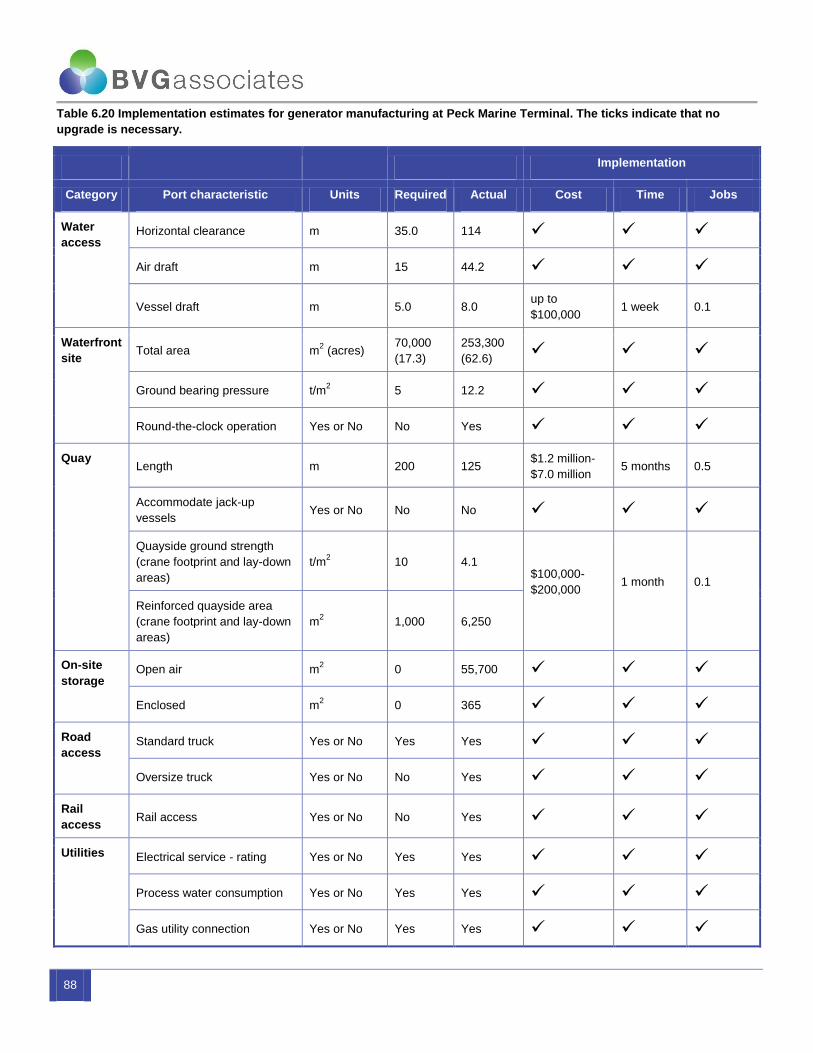
88
Table 6.20 Implementation estimates for generator manufacturing at Peck Marine Terminal. The ticks indicate that no
upgrade is necessary.
Implementation
Category Port characteristic Units Required Actual Cost Time Jobs
Water
access Horizontal clearance m 35.0 114
Air draft m 15 44.2
Vessel draft m 5.0 8.0 up to
$100,000 1 week 0.1
Waterfront
site Total area m
2 (acres)
70,000
(17.3)
253,300
(62.6)
Ground bearing pressure t/m2 5 12.2
Round-the-clock operation Yes or No No Yes
Quay Length m 200 125
$1.2 million-
$7.0 million 5 months 0.5
Accommodate jack-up
vessels Yes or No No No
Quayside ground strength
(crane footprint and lay-down
areas)
t/m2
10 4.1 $100,000-
$200,000
1 month
0.1
Reinforced quayside area
(crane footprint and lay-down
areas)
m2
1,000 6,250
On-site
storage Open air m
2 0 55,700
Enclosed m2 0 365
Road
access Standard truck Yes or No Yes Yes
Oversize truck Yes or No No Yes
Rail
access Rail access Yes or No No Yes
Utilities Electrical service - rating Yes or No Yes Yes
Process water consumption Yes or No Yes Yes
Gas utility connection Yes or No Yes Yes
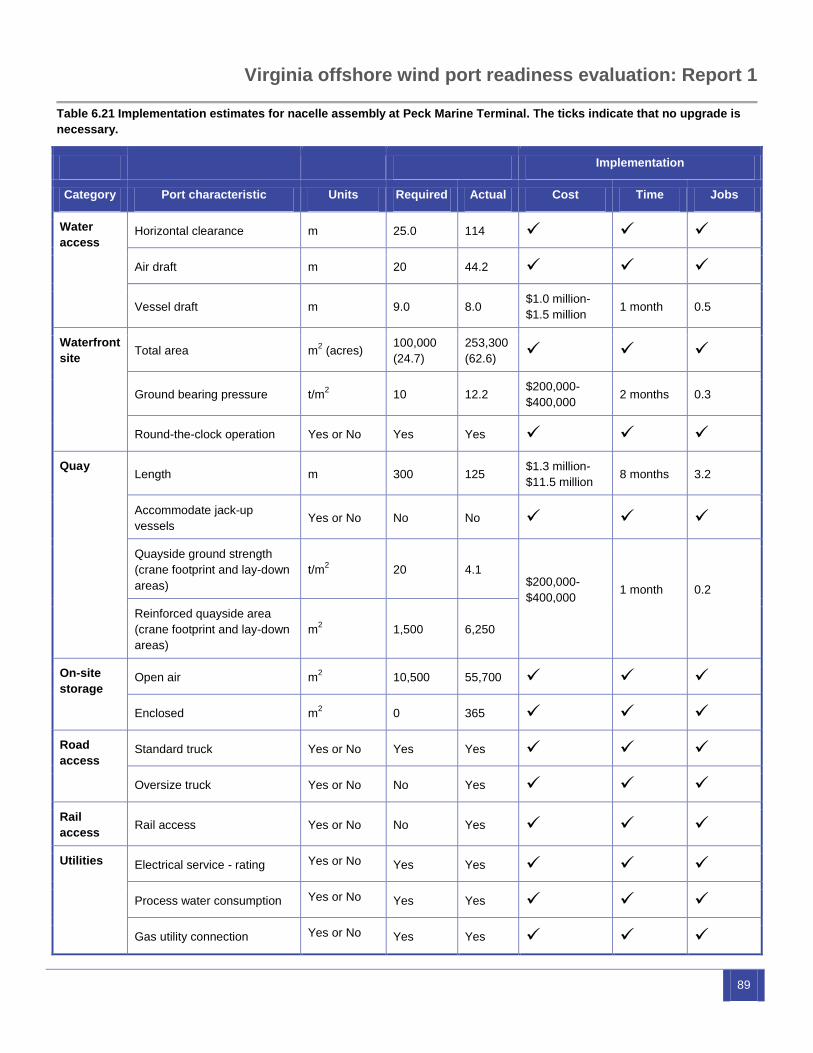
Virginia offshore wind port readiness evaluation: Report 1
89
Table 6.21 Implementation estimates for nacelle assembly at Peck Marine Terminal. The ticks indicate that no upgrade is
necessary.
Implementation
Category Port characteristic Units Required Actual Cost Time Jobs
Water
access Horizontal clearance m 25.0 114
Air draft m 20 44.2
Vessel draft m 9.0 8.0 $1.0 million-
$1.5 million 1 month 0.5
Waterfront
site Total area m
2 (acres)
100,000
(24.7)
253,300
(62.6)
Ground bearing pressure t/m2 10 12.2
$200,000-
$400,000 2 months 0.3
Round-the-clock operation Yes or No Yes Yes
Quay Length m 300 125
$1.3 million-
$11.5 million 8 months 3.2
Accommodate jack-up
vessels Yes or No No No
Quayside ground strength
(crane footprint and lay-down
areas)
t/m2
20 4.1 $200,000-
$400,000
1 month
0.2
Reinforced quayside area
(crane footprint and lay-down
areas)
m2
1,500 6,250
On-site
storage Open air m
2 10,500 55,700
Enclosed m2 0 365
Road
access Standard truck Yes or No Yes Yes
Oversize truck Yes or No No Yes
Rail
access Rail access Yes or No No Yes
Utilities Electrical service - rating Yes or No Yes Yes
Process water consumption Yes or No Yes Yes
Gas utility connection Yes or No Yes Yes
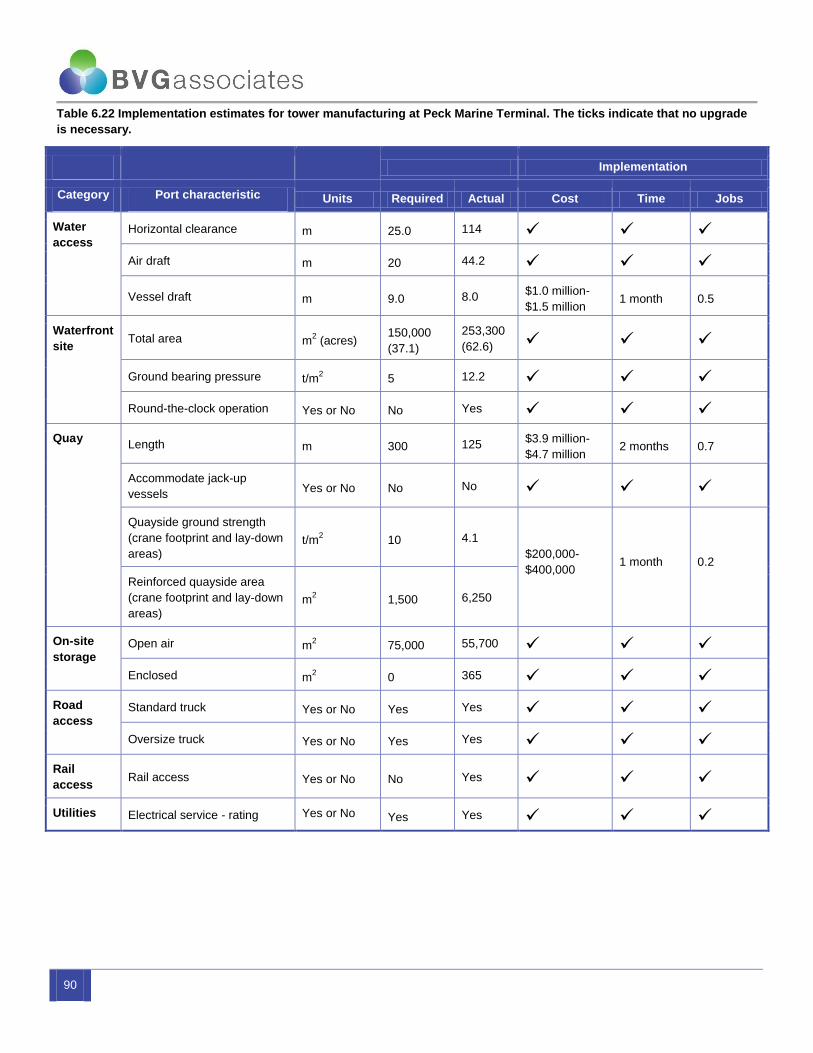
90
Table 6.22 Implementation estimates for tower manufacturing at Peck Marine Terminal. The ticks indicate that no upgrade
is necessary.
Implementation
Category Port characteristic Units Required Actual Cost Time Jobs
Water
access Horizontal clearance m 25.0 114
Air draft m 20 44.2
Vessel draft m 9.0 8.0 $1.0 million-
$1.5 million 1 month 0.5
Waterfront
site Total area m
2 (acres)
150,000
(37.1)
253,300
(62.6)
Ground bearing pressure t/m2 5 12.2
Round-the-clock operation Yes or No No Yes
Quay Length m 300 125
$3.9 million-
$4.7 million 2 months 0.7
Accommodate jack-up
vessels Yes or No No No
Quayside ground strength
(crane footprint and lay-down
areas) t/m
2 10 4.1
$200,000-
$400,000
1 month
0.2
Reinforced quayside area
(crane footprint and lay-down
areas) m
2 1,500 6,250
On-site
storage Open air m
2 75,000 55,700
Enclosed m2 0 365
Road
access Standard truck Yes or No Yes Yes
Oversize truck Yes or No Yes Yes
Rail
access Rail access Yes or No No Yes
Utilities Electrical service - rating Yes or No Yes Yes
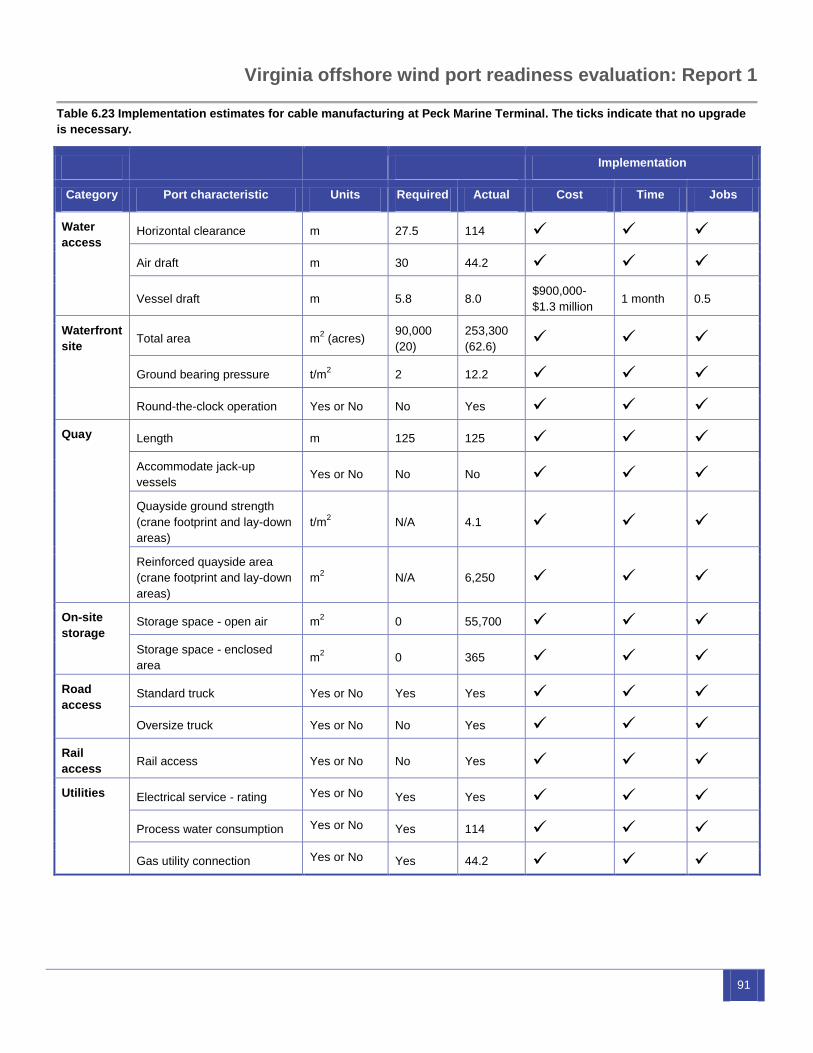
Virginia offshore wind port readiness evaluation: Report 1
91
Table 6.23 Implementation estimates for cable manufacturing at Peck Marine Terminal. The ticks indicate that no upgrade
is necessary.
Implementation
Category Port characteristic Units Required Actual Cost Time Jobs
Water
access Horizontal clearance m 27.5 114
Air draft m 30 44.2
Vessel draft m 5.8 8.0 $900,000-
$1.3 million 1 month 0.5
Waterfront
site Total area m
2 (acres)
90,000
(20)
253,300
(62.6)
Ground bearing pressure t/m2 2 12.2
Round-the-clock operation Yes or No No Yes
Quay Length m 125 125
Accommodate jack-up
vessels Yes or No No No
Quayside ground strength
(crane footprint and lay-down
areas)
t/m2
N/A 4.1
Reinforced quayside area
(crane footprint and lay-down
areas)
m2
N/A 6,250
On-site
storage Storage space - open air m
2 0 55,700
Storage space - enclosed
area m
2 0 365
Road
access Standard truck Yes or No Yes Yes
Oversize truck Yes or No No Yes
Rail
access Rail access Yes or No No Yes
Utilities Electrical service - rating Yes or No Yes Yes
Process water consumption Yes or No Yes 114
Gas utility connection Yes or No Yes 44.2

92
6.4. Virginia Renaissance Center
We estimated implementation costs, time line, and resulting
construction jobs for the following activities at Virginia
Renaissance Venter (VRC):
Blade manufacturing and
Submarine cable manufacturing.
Waterside infrastructure
VRC has a 137m pier.
Ground conditions
The buildings from the former Ford Plant have been razed
and only the concrete slabs and asphalt parking remain.
Vessel access
Between VRC and the open sea, vessels dimensions and
movement would be restricted by a series of bridges: the
Berkley Bridge, the Norfolk Southern railway bridge and the
Campostella bridge.
Current use
VRC is not currently used. The site was previously a Ford
truck plant. Concrete slabs from the truck plant remain on
site.
Road and rail access
VRC has good highway access, located just off Route 407
with quick access to interstate highways 264 and 464.
VRC has a Norfolk Southern Rail connection.
Implementation Summary
Blade manufacturing requires improved quay strength.
Submarine cable manufacturing requires dredging.
Table 6.24 Implementation summary for Peck Marine
Terminal.
Activity Cost to
complete
Time to
complete
Jobs
(FTE-
years)
Blade
manufacturing
$1 million to
$1.5 million
2 months 1.6
Submarine
cable
manufacturing
$900,000 to
$1.3 million
1 month 0.5
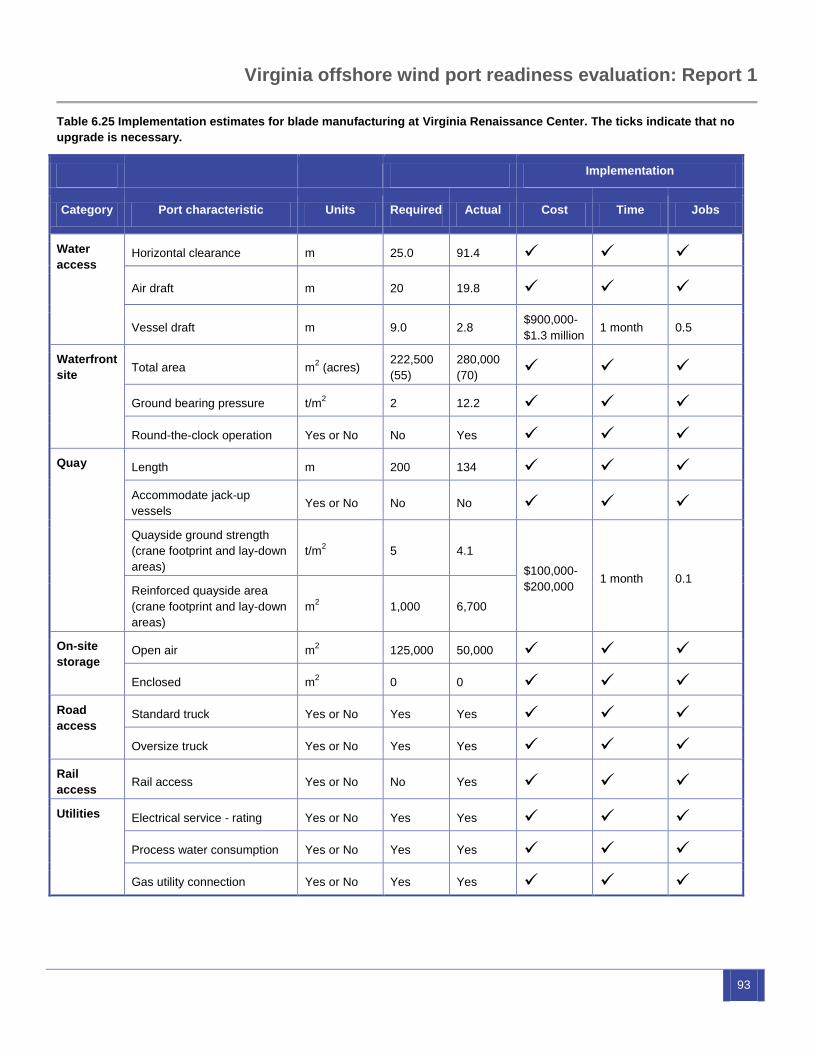
Virginia offshore wind port readiness evaluation: Report 1
93
Table 6.25 Implementation estimates for blade manufacturing at Virginia Renaissance Center. The ticks indicate that no
upgrade is necessary.
Implementation
Category Port characteristic Units Required Actual Cost Time Jobs
Water
access Horizontal clearance m 25.0 91.4
Air draft m 20 19.8
Vessel draft m 9.0 2.8 $900,000-
$1.3 million 1 month 0.5
Waterfront
site Total area m
2 (acres)
222,500
(55)
280,000
(70)
Ground bearing pressure t/m2 2 12.2
Round-the-clock operation Yes or No No Yes
Quay Length m 200 134
Accommodate jack-up
vessels Yes or No No No
Quayside ground strength
(crane footprint and lay-down
areas)
t/m2
5 4.1
$100,000-
$200,000 1 month 0.1
Reinforced quayside area
(crane footprint and lay-down
areas)
m2
1,000 6,700
On-site
storage Open air m
2 125,000 50,000
Enclosed m2 0 0
Road
access Standard truck Yes or No Yes Yes
Oversize truck Yes or No Yes Yes
Rail
access Rail access Yes or No No Yes
Utilities Electrical service - rating Yes or No Yes Yes
Process water consumption Yes or No Yes Yes
Gas utility connection Yes or No Yes Yes

94
Table 6.26 Implementation estimates for cable manufacturing at Virginia Renaissance Center. The ticks indicate that no
upgrade is necessary.
Implementation
Category Port characteristic Units Required Actual Cost Time Jobs
Water
access Horizontal clearance m 27.5 91.4
Air draft m 30 19.8 Barge access only
Vessel draft m 5.8 2.8
$900,000-
$1.3
million
1 month 0.5
Waterfront
site Total area m
2 (acres)
90,000
(20)
280,000
(70)
Ground bearing pressure t/m2 2 12.2
Round-the-clock operation Yes or No No Yes
Quay Length m 125 134
Accommodate jack-up
vessels Yes or No No No
Quayside ground strength
(crane footprint and lay-down
areas)
t/m2
N/A 4.1
Reinforced quayside area
(crane footprint and lay-down
areas)
m2
N/A 6,700
On-site
storage Storage space - open air m
2 0 50,000
Storage space - enclosed
area m
2 0 0
Road
access Standard truck Yes or No Yes Yes
Oversize truck Yes or No No Yes
Rail
access Rail access Yes or No No Yes
Utilities Electrical service - rating Yes or No Yes Yes
Process water consumption Yes or No Yes Yes
Gas utility connection Yes or No Yes Yes
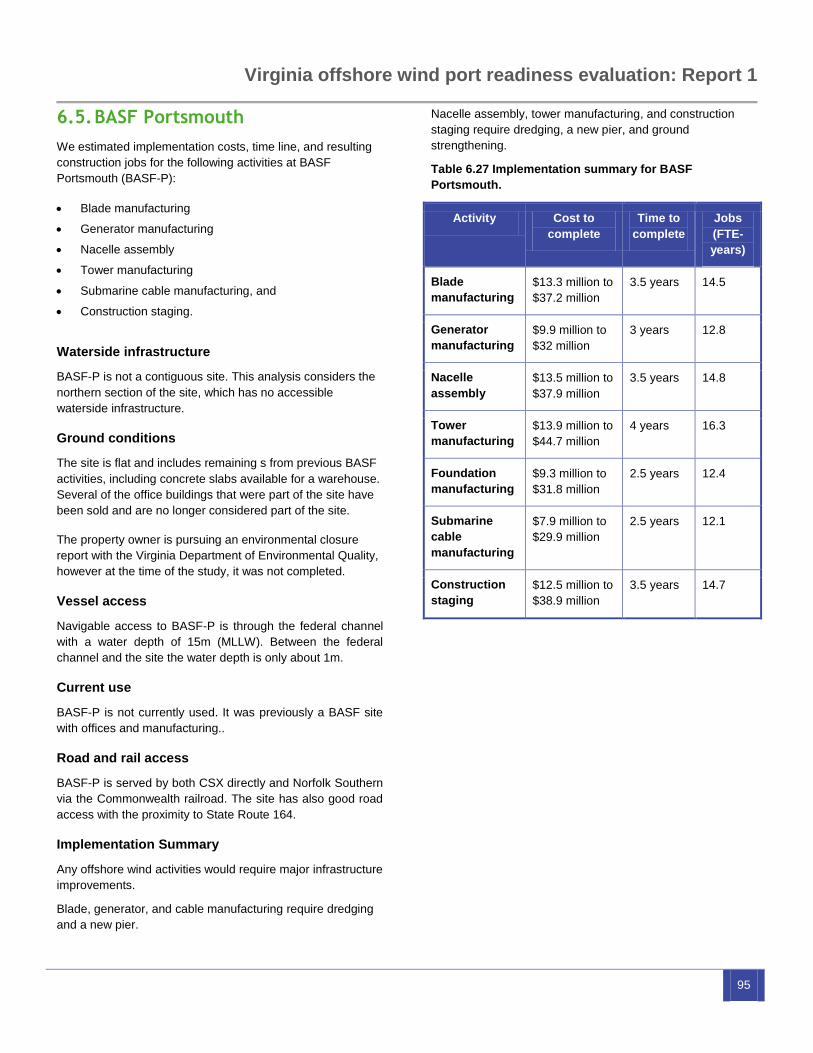
Virginia offshore wind port readiness evaluation: Report 1
95
6.5. BASF Portsmouth
We estimated implementation costs, time line, and resulting
construction jobs for the following activities at BASF
Portsmouth (BASF-P):
Blade manufacturing
Generator manufacturing
Nacelle assembly
Tower manufacturing
Submarine cable manufacturing, and
Construction staging.
Waterside infrastructure
BASF-P is not a contiguous site. This analysis considers the
northern section of the site, which has no accessible
waterside infrastructure.
Ground conditions
The site is flat and includes remaining s from previous BASF
activities, including concrete slabs available for a warehouse.
Several of the office buildings that were part of the site have
been sold and are no longer considered part of the site.
The property owner is pursuing an environmental closure
report with the Virginia Department of Environmental Quality,
however at the time of the study, it was not completed.
Vessel access
Navigable access to BASF-P is through the federal channel
with a water depth of 15m (MLLW). Between the federal
channel and the site the water depth is only about 1m.
Current use
BASF-P is not currently used. It was previously a BASF site
with offices and manufacturing..
Road and rail access
BASF-P is served by both CSX directly and Norfolk Southern
via the Commonwealth railroad. The site has also good road
access with the proximity to State Route 164.
Implementation Summary
Any offshore wind activities would require major infrastructure
improvements.
Blade, generator, and cable manufacturing require dredging
and a new pier.
Nacelle assembly, tower manufacturing, and construction
staging require dredging, a new pier, and ground
strengthening.
Table 6.27 Implementation summary for BASF
Portsmouth.
Activity Cost to
complete
Time to
complete
Jobs
(FTE-
years)
Blade
manufacturing
$13.3 million to
$37.2 million
3.5 years 14.5
Generator
manufacturing
$9.9 million to
$32 million
3 years 12.8
Nacelle
assembly
$13.5 million to
$37.9 million
3.5 years 14.8
Tower
manufacturing
$13.9 million to
$44.7 million
4 years 16.3
Foundation
manufacturing
$9.3 million to
$31.8 million
2.5 years 12.4
Submarine
cable
manufacturing
$7.9 million to
$29.9 million
2.5 years 12.1
Construction
staging
$12.5 million to
$38.9 million
3.5 years 14.7

96
Table 6.28 Implementation estimates for blade manufacturing at BASF Portsmouth. The ticks indicate that no upgrade is
necessary.
Implementation
Category Port characteristic Units Required Actual Cost Time Jobs
Water
access Horizontal clearance m 25.0 228
Air draft m 20 N/A
Vessel draft m 9.0 4.2 $6.3 million -
$9.7 million 7 months 3.3
Waterfront
site Total area m
2 (acres)
222,500
(55)
178,000
(44)
Ground bearing pressure t/m2 2 12.2
Round-the-clock operation Yes or No No Yes
Quay Length m 200 0
$7.0 million -
$27.5 million 2 .5 years 11.2
Accommodate jack-up
vessels Yes or No No No
Quayside ground strength
(crane footprint and lay-down
areas)
t/m2
5 4.1
Included with quay length extension Reinforced quayside area
(crane footprint and lay-down
areas)
m2
1,000 7,000
On-site
storage Open air m
2 125,000 51,000
Enclosed m2 0 365
Road
access Standard truck Yes or No Yes Yes
Oversize truck Yes or No Yes Yes
Rail
access Rail access Yes or No No Yes
Utilities Electrical service - rating Yes or No Yes Yes
Process water consumption Yes or No Yes Yes
Gas utility connection Yes or No Yes Yes
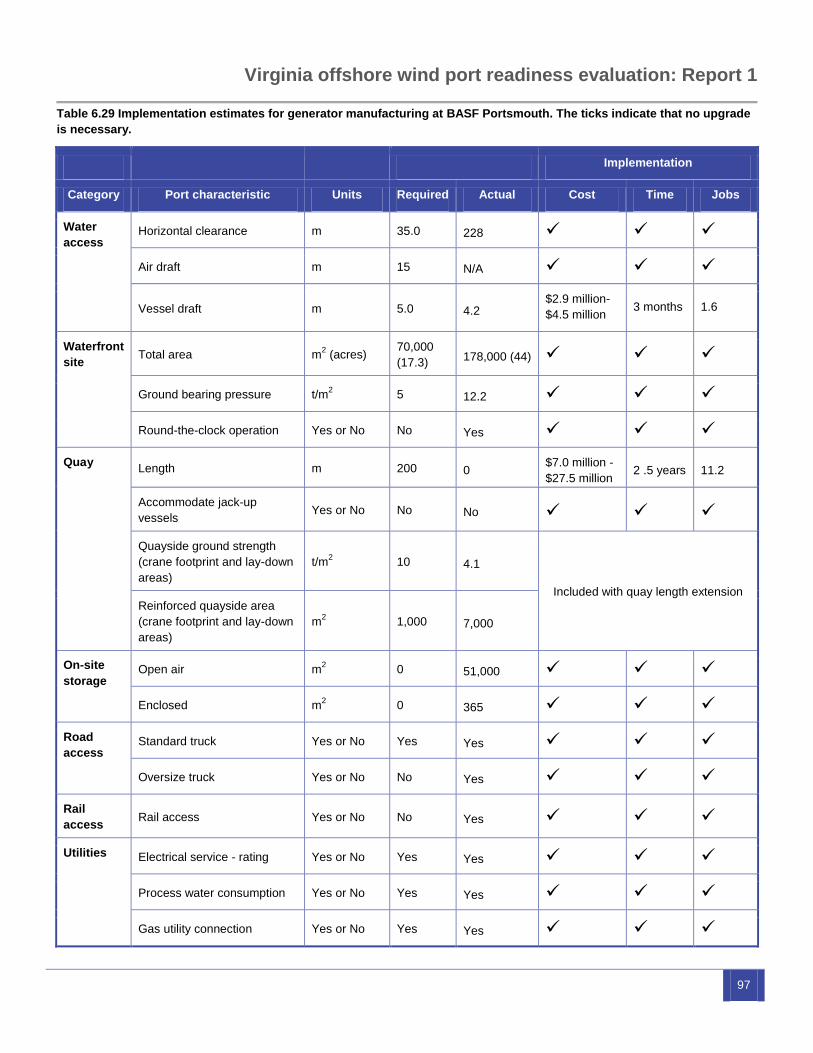
Virginia offshore wind port readiness evaluation: Report 1
97
Table 6.29 Implementation estimates for generator manufacturing at BASF Portsmouth. The ticks indicate that no upgrade
is necessary.
Implementation
Category Port characteristic Units Required Actual Cost Time Jobs
Water
access Horizontal clearance m 35.0 228
Air draft m 15 N/A
Vessel draft m 5.0 4.2 $2.9 million-
$4.5 million 3 months 1.6
Waterfront
site Total area m
2 (acres)
70,000
(17.3) 178,000 (44)
Ground bearing pressure t/m2 5 12.2
Round-the-clock operation Yes or No No Yes
Quay Length m 200 0
$7.0 million -
$27.5 million 2 .5 years 11.2
Accommodate jack-up
vessels Yes or No No No
Quayside ground strength
(crane footprint and lay-down
areas)
t/m2
10 4.1
Included with quay length extension
Reinforced quayside area
(crane footprint and lay-down
areas)
m2
1,000 7,000
On-site
storage Open air m
2 0 51,000
Enclosed m2 0 365
Road
access Standard truck Yes or No Yes Yes
Oversize truck Yes or No No Yes
Rail
access Rail access Yes or No No Yes
Utilities Electrical service - rating Yes or No Yes Yes
Process water consumption Yes or No Yes Yes
Gas utility connection Yes or No Yes Yes
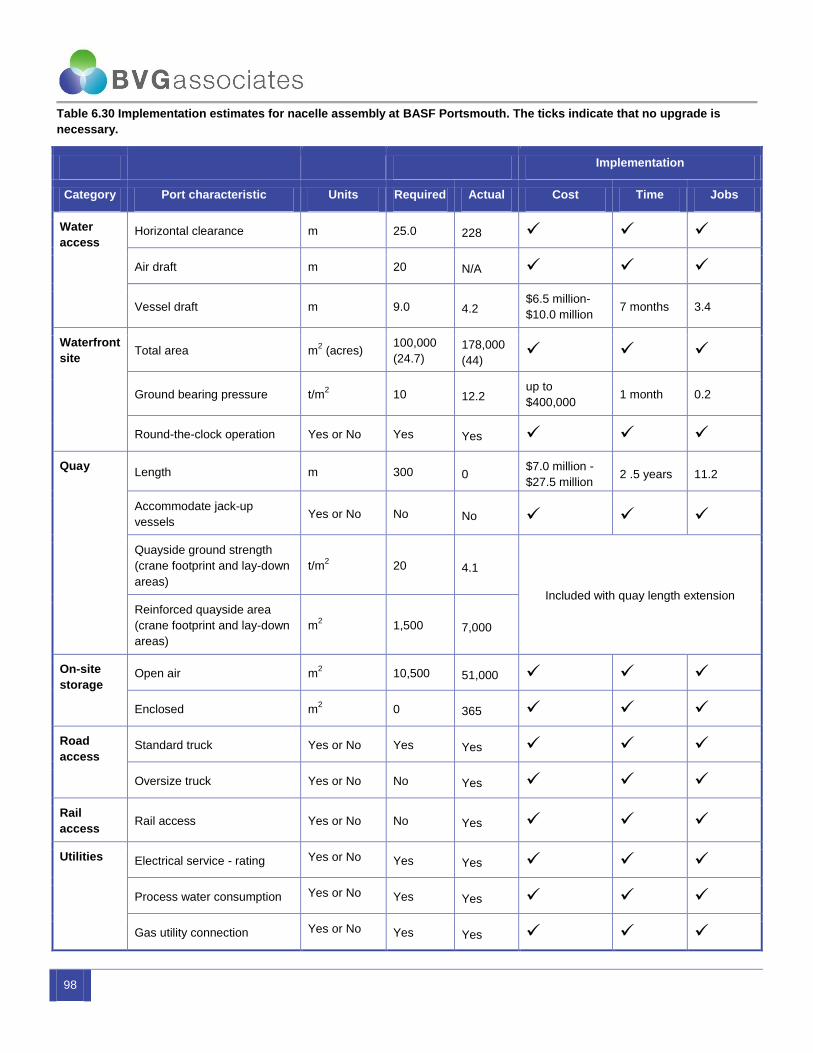
98
Table 6.30 Implementation estimates for nacelle assembly at BASF Portsmouth. The ticks indicate that no upgrade is
necessary.
Implementation
Category Port characteristic Units Required Actual Cost Time Jobs
Water
access Horizontal clearance m 25.0 228
Air draft m 20 N/A
Vessel draft m 9.0 4.2 $6.5 million-
$10.0 million 7 months 3.4
Waterfront
site Total area m
2 (acres)
100,000
(24.7) 178,000
(44)
Ground bearing pressure t/m2 10 12.2
up to
$400,000 1 month 0.2
Round-the-clock operation Yes or No Yes Yes
Quay Length m 300 0
$7.0 million -
$27.5 million 2 .5 years 11.2
Accommodate jack-up
vessels Yes or No No No
Quayside ground strength
(crane footprint and lay-down
areas)
t/m2
20 4.1
Included with quay length extension
Reinforced quayside area
(crane footprint and lay-down
areas)
m2
1,500 7,000
On-site
storage Open air m
2 10,500 51,000
Enclosed m2 0 365
Road
access Standard truck Yes or No Yes Yes
Oversize truck Yes or No No Yes
Rail
access Rail access Yes or No No Yes
Utilities Electrical service - rating Yes or No Yes Yes
Process water consumption Yes or No Yes Yes
Gas utility connection Yes or No Yes Yes
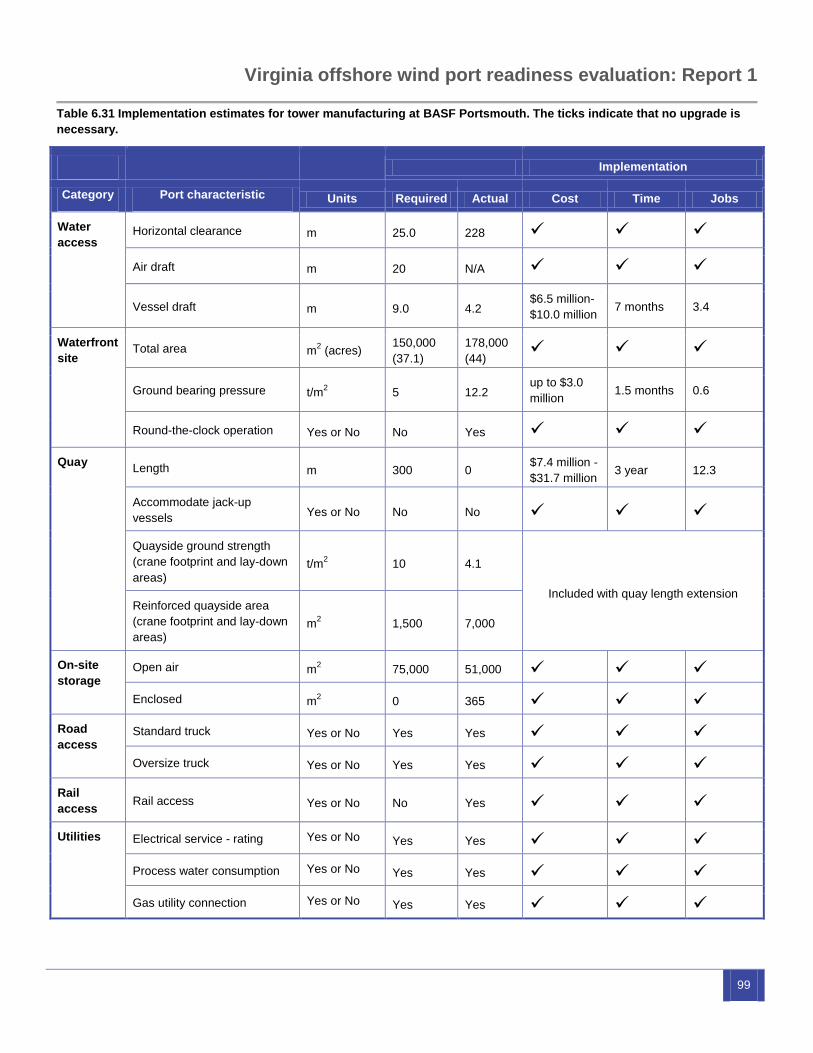
Virginia offshore wind port readiness evaluation: Report 1
99
Table 6.31 Implementation estimates for tower manufacturing at BASF Portsmouth. The ticks indicate that no upgrade is
necessary.
Implementation
Category Port characteristic Units Required Actual Cost Time Jobs
Water
access Horizontal clearance m 25.0 228
Air draft m 20 N/A
Vessel draft m 9.0 4.2 $6.5 million-
$10.0 million 7 months 3.4
Waterfront
site Total area m
2 (acres)
150,000
(37.1)
178,000
(44)
Ground bearing pressure t/m2 5 12.2
up to $3.0
million 1.5 months 0.6
Round-the-clock operation Yes or No No Yes
Quay Length m 300 0
$7.4 million -
$31.7 million 3 year 12.3
Accommodate jack-up
vessels Yes or No No No
Quayside ground strength
(crane footprint and lay-down
areas) t/m
2 10 4.1
Included with quay length extension Reinforced quayside area
(crane footprint and lay-down
areas) m
2 1,500 7,000
On-site
storage Open air m
2 75,000 51,000
Enclosed m2 0 365
Road
access Standard truck Yes or No Yes Yes
Oversize truck Yes or No Yes Yes
Rail
access Rail access Yes or No No Yes
Utilities Electrical service - rating Yes or No Yes Yes
Process water consumption Yes or No Yes Yes
Gas utility connection Yes or No Yes Yes
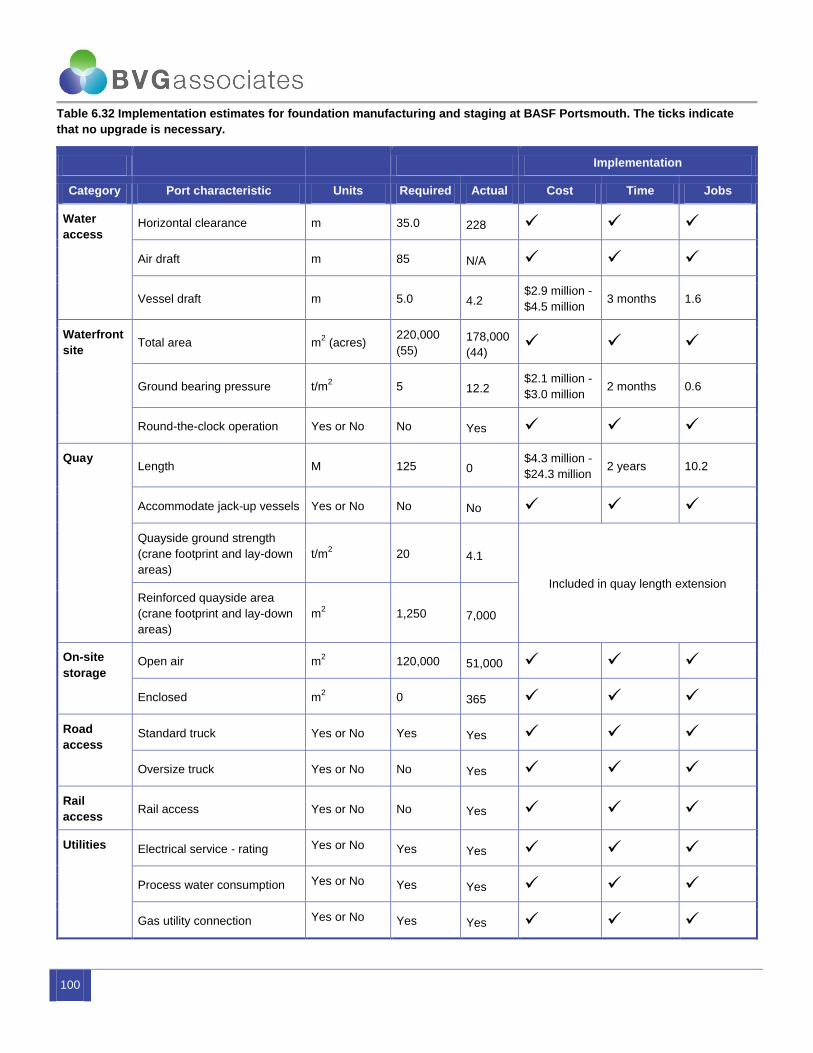
100
Table 6.32 Implementation estimates for foundation manufacturing and staging at BASF Portsmouth. The ticks indicate
that no upgrade is necessary.
Implementation
Category Port characteristic Units Required Actual Cost Time Jobs
Water
access Horizontal clearance m 35.0 228
Air draft m 85 N/A
Vessel draft m 5.0 4.2 $2.9 million -
$4.5 million 3 months 1.6
Waterfront
site Total area m
2 (acres)
220,000
(55) 178,000
(44)
Ground bearing pressure t/m2 5 12.2
$2.1 million -
$3.0 million 2 months 0.6
Round-the-clock operation Yes or No No Yes
Quay Length M 125 0
$4.3 million -
$24.3 million 2 years 10.2
Accommodate jack-up vessels Yes or No No No
Quayside ground strength
(crane footprint and lay-down
areas)
t/m2
20 4.1
Included in quay length extension
Reinforced quayside area
(crane footprint and lay-down
areas)
m2
1,250 7,000
On-site
storage Open air m
2 120,000 51,000
Enclosed m2 0 365
Road
access Standard truck Yes or No Yes Yes
Oversize truck Yes or No No Yes
Rail
access Rail access Yes or No No Yes
Utilities Electrical service - rating Yes or No Yes Yes
Process water consumption Yes or No Yes Yes
Gas utility connection Yes or No Yes Yes
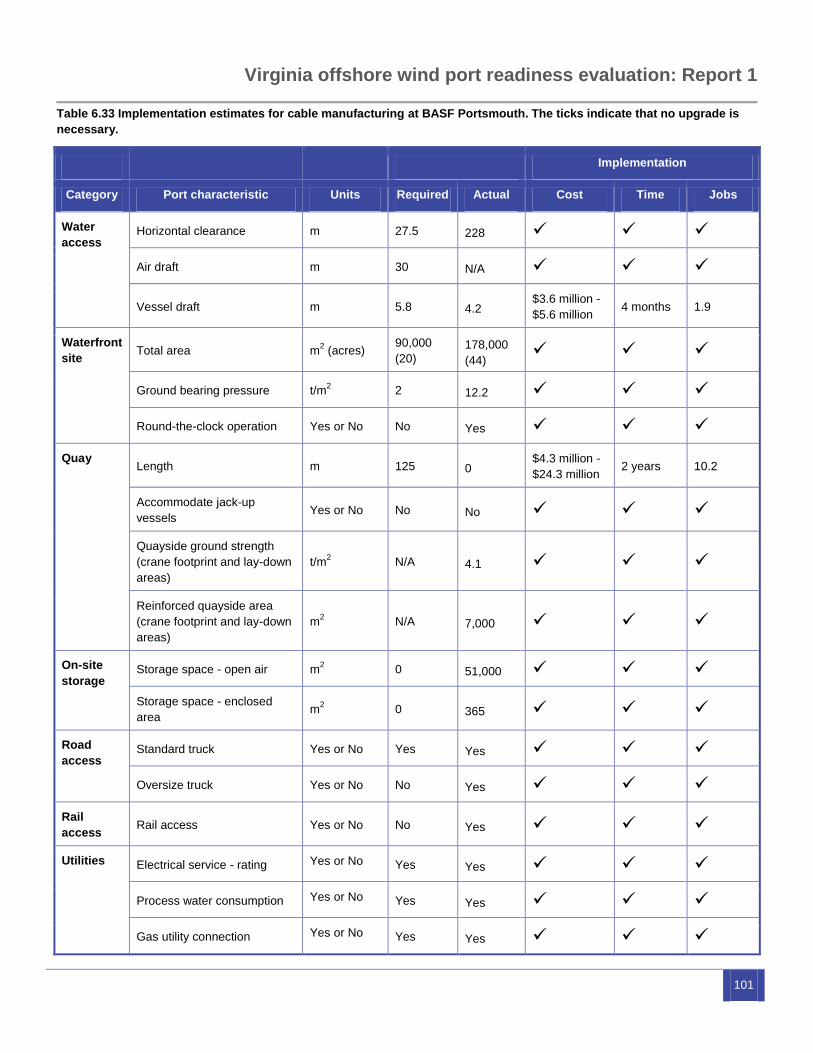
Virginia offshore wind port readiness evaluation: Report 1
101
Table 6.33 Implementation estimates for cable manufacturing at BASF Portsmouth. The ticks indicate that no upgrade is
necessary.
Implementation
Category Port characteristic Units Required Actual Cost Time Jobs
Water
access Horizontal clearance m 27.5 228
Air draft m 30 N/A
Vessel draft m 5.8 4.2 $3.6 million -
$5.6 million 4 months 1.9
Waterfront
site Total area m
2 (acres)
90,000
(20) 178,000
(44)
Ground bearing pressure t/m2 2 12.2
Round-the-clock operation Yes or No No Yes
Quay Length m 125 0
$4.3 million -
$24.3 million 2 years 10.2
Accommodate jack-up
vessels Yes or No No No
Quayside ground strength
(crane footprint and lay-down
areas)
t/m2
N/A 4.1
Reinforced quayside area
(crane footprint and lay-down
areas)
m2
N/A 7,000
On-site
storage Storage space - open air m
2 0 51,000
Storage space - enclosed
area m
2 0 365
Road
access Standard truck Yes or No Yes Yes
Oversize truck Yes or No No Yes
Rail
access Rail access Yes or No No Yes
Utilities Electrical service - rating Yes or No Yes Yes
Process water consumption Yes or No Yes Yes
Gas utility connection Yes or No Yes Yes
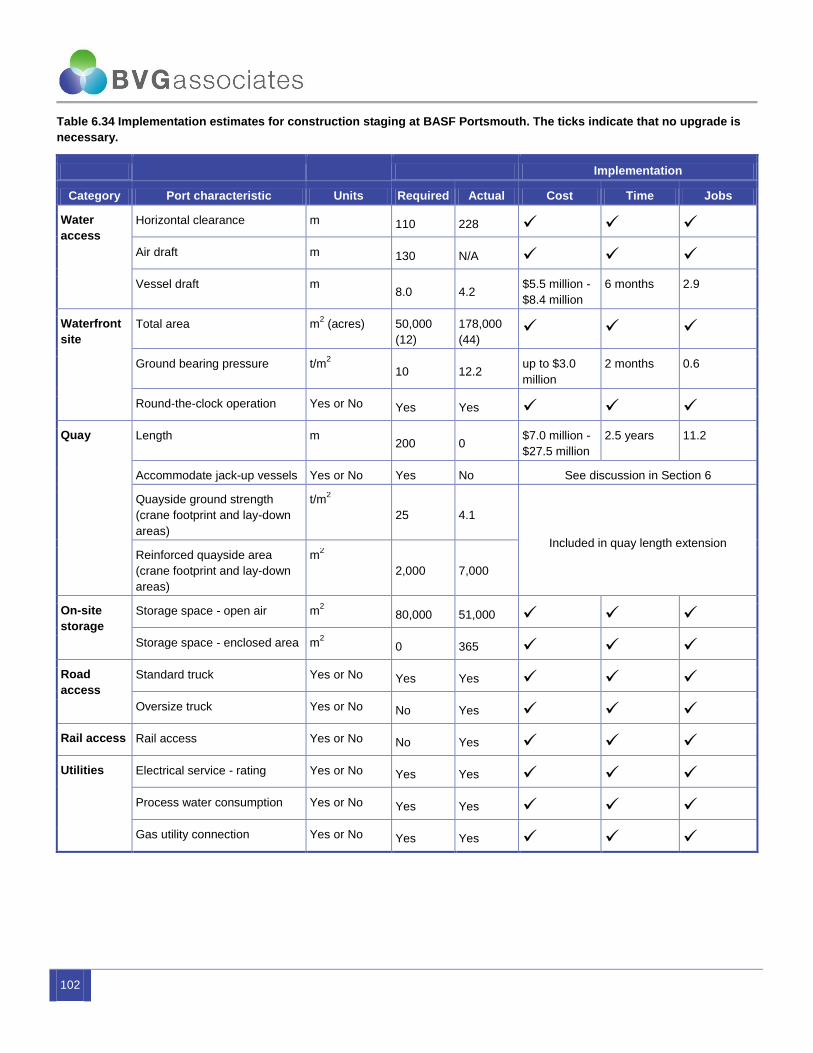
102
Table 6.34 Implementation estimates for construction staging at BASF Portsmouth. The ticks indicate that no upgrade is
necessary.
Implementation
Category Port characteristic Units Required Actual Cost Time Jobs
Water
access
Horizontal clearance m 110 228
Air draft m 130 N/A
Vessel draft m 8.0 4.2
$5.5 million -
$8.4 million
6 months 2.9
Waterfront
site
Total area m2 (acres) 50,000
(12)
178,000
(44)
Ground bearing pressure t/m2
10 12.2 up to $3.0
million
2 months 0.6
Round-the-clock operation Yes or No Yes Yes
Quay Length m 200 0
$7.0 million -
$27.5 million
2.5 years 11.2
Accommodate jack-up vessels Yes or No Yes No See discussion in Section 6
Quayside ground strength
(crane footprint and lay-down
areas)
t/m2
25 4.1
Included in quay length extension Reinforced quayside area
(crane footprint and lay-down
areas)
m2
2,000 7,000
On-site
storage
Storage space - open air m2 80,000 51,000
Storage space - enclosed area m2 0 365
Road
access
Standard truck Yes or No Yes Yes
Oversize truck Yes or No No Yes
Rail access Rail access Yes or No No Yes
Utilities Electrical service - rating Yes or No Yes Yes
Process water consumption Yes or No Yes Yes
Gas utility connection Yes or No Yes Yes
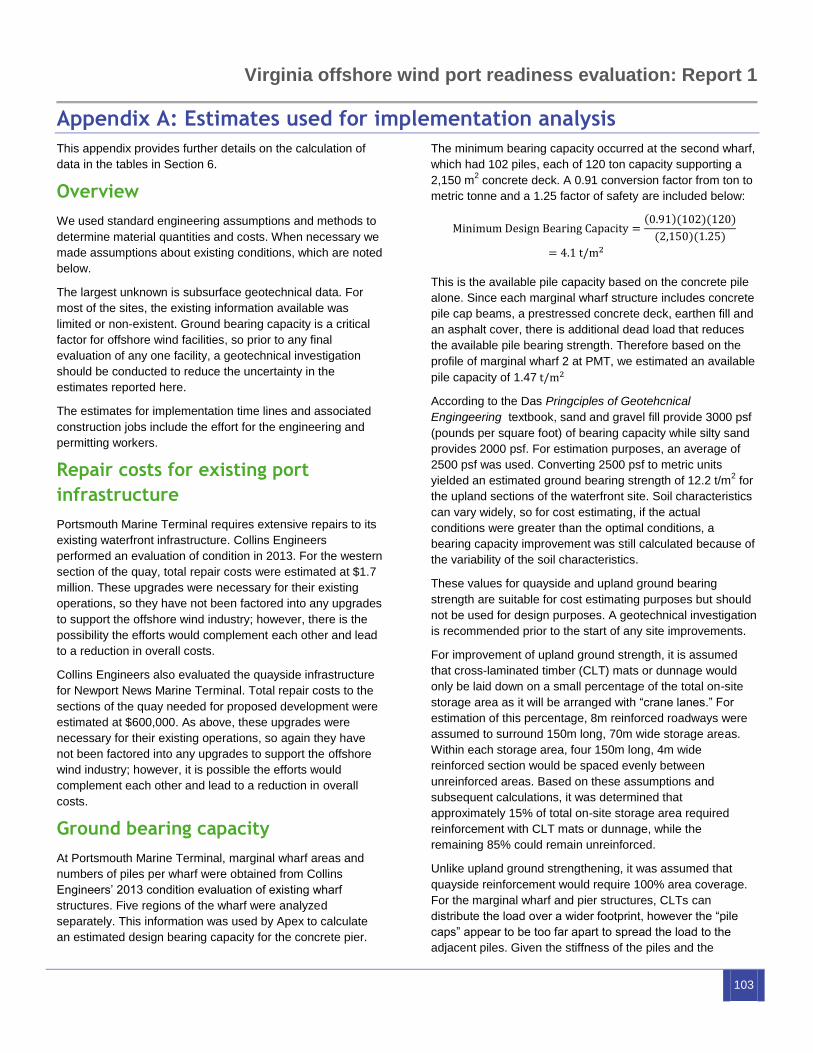
Virginia offshore wind port readiness evaluation: Report 1
103
Appendix A: Estimates used for implementation analysis
This appendix provides further details on the calculation of
data in the tables in Section 6.
Overview
We used standard engineering assumptions and methods to
determine material quantities and costs. When necessary we
made assumptions about existing conditions, which are noted
below.
The largest unknown is subsurface geotechnical data. For
most of the sites, the existing information available was
limited or non-existent. Ground bearing capacity is a critical
factor for offshore wind facilities, so prior to any final
evaluation of any one facility, a geotechnical investigation
should be conducted to reduce the uncertainty in the
estimates reported here.
The estimates for implementation time lines and associated
construction jobs include the effort for the engineering and
permitting workers.
Repair costs for existing port
infrastructure
Portsmouth Marine Terminal requires extensive repairs to its
existing waterfront infrastructure. Collins Engineers
performed an evaluation of condition in 2013. For the western
section of the quay, total repair costs were estimated at $1.7
million. These upgrades were necessary for their existing
operations, so they have not been factored into any upgrades
to support the offshore wind industry; however, there is the
possibility the efforts would complement each other and lead
to a reduction in overall costs.
Collins Engineers also evaluated the quayside infrastructure
for Newport News Marine Terminal. Total repair costs to the
sections of the quay needed for proposed development were
estimated at $600,000. As above, these upgrades were
necessary for their existing operations, so again they have
not been factored into any upgrades to support the offshore
wind industry; however, it is possible the efforts would
complement each other and lead to a reduction in overall
costs.
Ground bearing capacity
At Portsmouth Marine Terminal, marginal wharf areas and
numbers of piles per wharf were obtained from Collins
Engineers’ 2013 condition evaluation of existing wharf
structures. Five regions of the wharf were analyzed
separately. This information was used by Apex to calculate
an estimated design bearing capacity for the concrete pier.
The minimum bearing capacity occurred at the second wharf,
which had 102 piles, each of 120 ton capacity supporting a
2,150 m2 concrete deck. A 0.91 conversion factor from ton to
metric tonne and a 1.25 factor of safety are included below:
This is the available pile capacity based on the concrete pile
alone. Since each marginal wharf structure includes concrete
pile cap beams, a prestressed concrete deck, earthen fill and
an asphalt cover, there is additional dead load that reduces
the available pile bearing strength. Therefore based on the
profile of marginal wharf 2 at PMT, we estimated an available
pile capacity of 1.47
According to the Das Pringciples of Geotehcnical
Engingeering textbook, sand and gravel fill provide 3000 psf
(pounds per square foot) of bearing capacity while silty sand
provides 2000 psf. For estimation purposes, an average of
2500 psf was used. Converting 2500 psf to metric units
yielded an estimated ground bearing strength of 12.2 t/m2 for
the upland sections of the waterfront site. Soil characteristics
can vary widely, so for cost estimating, if the actual
conditions were greater than the optimal conditions, a
bearing capacity improvement was still calculated because of
the variability of the soil characteristics.
These values for quayside and upland ground bearing
strength are suitable for cost estimating purposes but should
not be used for design purposes. A geotechnical investigation
is recommended prior to the start of any site improvements.
For improvement of upland ground strength, it is assumed
that cross-laminated timber (CLT) mats or dunnage would
only be laid down on a small percentage of the total on-site
storage area as it will be arranged with “crane lanes.” For
estimation of this percentage, 8m reinforced roadways were
assumed to surround 150m long, 70m wide storage areas.
Within each storage area, four 150m long, 4m wide
reinforced section would be spaced evenly between
unreinforced areas. Based on these assumptions and
subsequent calculations, it was determined that
approximately 15% of total on-site storage area required
reinforcement with CLT mats or dunnage, while the
remaining 85% could remain unreinforced.
Unlike upland ground strengthening, it was assumed that
quayside reinforcement would require 100% area coverage.
For the marginal wharf and pier structures, CLTs can
distribute the load over a wider footprint, however the “pile
caps” appear to be too far apart to spread the load to the
adjacent piles. Given the stiffness of the piles and the
104
elasticity of the timber, a heavy load such as used in offshore
wind would create an incompatability to transfer the loads. In
order to be able to effectively transfer the load, the upgrade
would need to be made with a material with similar stiffness
properties, such as a steel girder, or to raze and rebuild the
wharf structure to better handle the loads.
The bulkheads at PMT and NNMT are sheet pile supported
structures. As an upgrade to the bearing strength of the
bulkheads, we have assumed soil nails with threaded rods
were sufficient to provide additional strength under the heavy
loading conditions of moving OSW components.
Ground strength improvements
CLT Materials
Cross laminated timber (CLT) mats were chosen as one
ground strengthening alternative after researching its prior
uses and speaking with a few manufacturers. CLT mats were
rated at 70,000 psf of down pressure according to the Rig
Mats of America company brochure.
The manufacturer estimated costs at $4,300 per 8’x40’
section.
RS Means Online was used to obtain crew estimates and
daily output projections. Crew and equipment costs were
then factored into the total cost of CLT.
CLT was determined to have a total unit cost of $153/m2 per
single crew.
Dunnage materials
Dunnage costs were calculated using RS Means online. The
estimated total unit cost was calculated to be $68.70/m2 per
single crew. A strength rating for dunnage was not readily
available.
Cost and spacing assumptions for pier and
quayside improvements
Most of the quayside costs were estimated using cost figures
from current/recent marine construction projects that involve
large scale pier construction. When this information was
unavailable, data from RS Means was used.
Cost per cofferdam cell unit (1 major cell, 1 minor cell):
$651,000
Cofferdam unit spacing: 25m
Cost per pipe pile: $12,185
Pipe pile spacing: 3.2m
Cost per socketed pile: $69,260
Socketed pile spacing: 3.5m
Cost per pile cap: $2,700
Cost per Bollard: $19,600
Bollard spacing: 14m
Cost per fender: $17,300
Fender spacing: 14m
Cost per dolphin, with 6 x 18m long wooden, treated
piles priced at $158.50 per pile per meter:
(158.50)(6)(18) = $17,000/dolphin
Cost of structural backfill, using RS means unit values of
$32.05/m3 for backfill furnishing and delivery, $2.56/m
3
for backfill installation including crew and equipment, and
$1.00/m3 for compaction of the backfill: $35.61/m
3
Additional pier and quayside improvement
assumptions
Estimate for Peck Marine Terminal’s needed backfill for
quayside improvements assumed a 15m average width
between the pier and the existing shoreline, a 4m average
water depth behind the pier with length dependent on the
needed quay length of the manufacturing component being
analyzed.
BASF Portsmouth proposed pier length was chosen to be
550m, with a width of 70m for the higher cost option that
used cofferdam cells and structural backfill, or width of 15m
for the lower cost option that used only concrete piles to
support the proposed pier.
For the higher cost option, the estimate for BASF
Portsmouth’s needed backfill for quayside improvements
used a 50m width after accounting for the space used by the
cofferdam cells, an average depth of fill of 4 m and length of
550m. Total fill needed was estimated to be 110,000m3.
Cultec materials for drainage upgrades
Cultec plastic drainage chambers were used to estimate the
cost of filling the storm water ponds that were present at
Peck and BASF Portsmouth Marine Terminals. Installation of
Cultec was assumed to include 12” of structural backfill below
the Cultec chambers as well as 10” of structural backfill
above. Based on the size of the storm water ponds, it was
estimated that an additional foot of structural backfill would
be needed to level the ground after filling the ponds.
Cultec unit cost: $275 per 8’x3’ section.
In addition, a cost of backfill estimate of $35.61/m3 (see Cost
and Spacing Assumptions for Pier and Quayside
Improvements) including crew and equipment costs were
used to estimate a total Cultec unit price.
Cultec was determined to have a total unit cost of $155/m2.
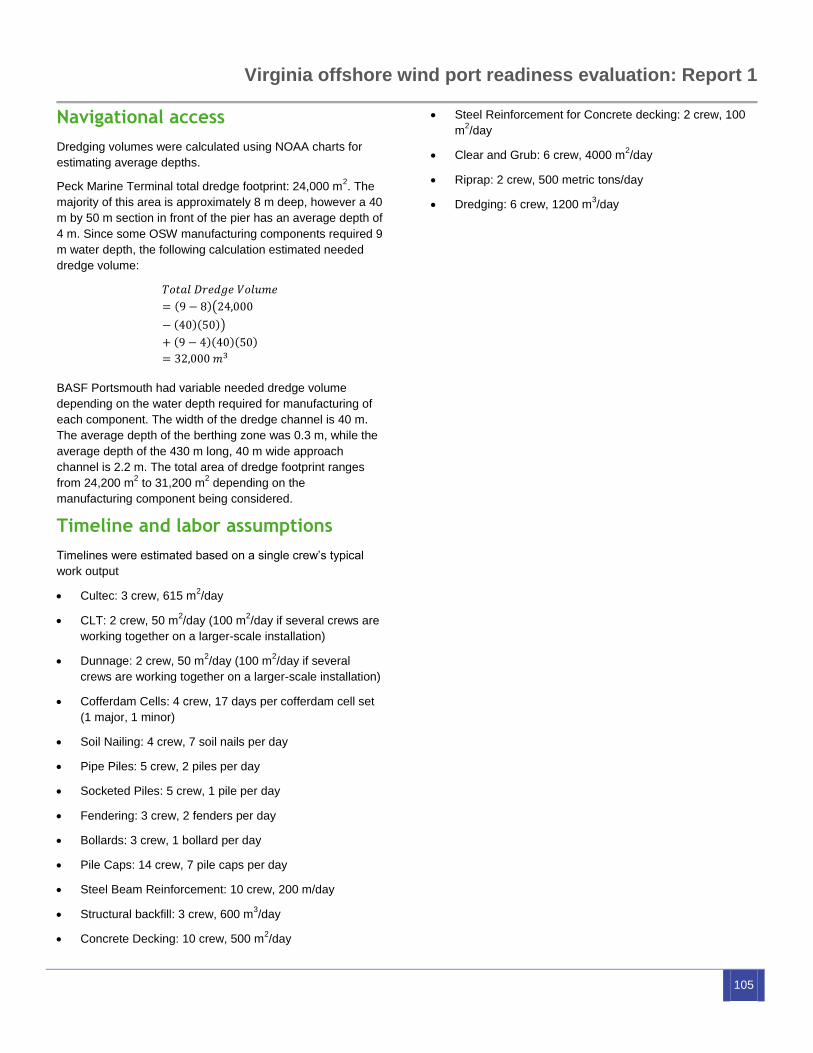
Virginia offshore wind port readiness evaluation: Report 1
105
Navigational access
Dredging volumes were calculated using NOAA charts for
estimating average depths.
Peck Marine Terminal total dredge footprint: 24,000 m2. The
majority of this area is approximately 8 m deep, however a 40
m by 50 m section in front of the pier has an average depth of
4 m. Since some OSW manufacturing components required 9
m water depth, the following calculation estimated needed
dredge volume:
BASF Portsmouth had variable needed dredge volume
depending on the water depth required for manufacturing of
each component. The width of the dredge channel is 40 m.
The average depth of the berthing zone was 0.3 m, while the
average depth of the 430 m long, 40 m wide approach
channel is 2.2 m. The total area of dredge footprint ranges
from 24,200 m2 to 31,200 m
2 depending on the
manufacturing component being considered.
Timeline and labor assumptions
Timelines were estimated based on a single crew’s typical
work output
Cultec: 3 crew, 615 m2/day
CLT: 2 crew, 50 m2/day (100 m
2/day if several crews are
working together on a larger-scale installation)
Dunnage: 2 crew, 50 m2/day (100 m
2/day if several
crews are working together on a larger-scale installation)
Cofferdam Cells: 4 crew, 17 days per cofferdam cell set
(1 major, 1 minor)
Soil Nailing: 4 crew, 7 soil nails per day
Pipe Piles: 5 crew, 2 piles per day
Socketed Piles: 5 crew, 1 pile per day
Fendering: 3 crew, 2 fenders per day
Bollards: 3 crew, 1 bollard per day
Pile Caps: 14 crew, 7 pile caps per day
Steel Beam Reinforcement: 10 crew, 200 m/day
Structural backfill: 3 crew, 600 m3/day
Concrete Decking: 10 crew, 500 m2/day
Steel Reinforcement for Concrete decking: 2 crew, 100
m2/day
Clear and Grub: 6 crew, 4000 m2/day
Riprap: 2 crew, 500 metric tons/day
Dredging: 6 crew, 1200 m3/day