virtual analyst day - pacific basin shipping limited
TRANSCRIPT

Pacific Basin

Pacific Basin
Virtual Analyst Day
21 April 2021, Wednesday
2.30pm-5.45pm HKT
Mats
Berglund
Peter
SchulzSurinder
Brrar
Morten
Ingebrigtsen
The above timing for each presentation is just for reference only
2.30pm
Mats Berglund, CEO – Introduction
3.00pm
Morten Ingebrigtsen, Director, Asset Management
– Supply and Demand Fundamentals
4.00pm
Coffee Break
4.15pm
Surinder Brrar, Director, Chartering (Pacific)
– Charter Market
5.15pm
Peter Schulz, CFO
– Forecasting Our Business
2

Pacific Basin

Pacific Basin
www.pacificbasin.com
Pacific Basin business principles
and our Corporate Video
Pacific Basin Overview
We operate the world’s largest fleet of interchangeable high-quality Handysize and Supramaxships, equipping us for efficient trading and reliable service any time and anywhere
Cargo system business model – with long track record outperforming market rates
Own 117* Handysize and Supramax vessels, with 271 owned and chartered ships on the water serving major industrial customers around the world
Hong Kong headquartered and HKEx listed, 12 offices worldwide, 343+ shore-based staff, 4,100+ seafarers
Strong balance sheet with US$362.5 million committed liquidity as of 31 December 2020
Our vision: To be a shipping industry leader and the partner of choice for customers, staff, shareholders and other stakeholders
4
*Including ships committed and excluding ships sold

Pacific Basin
Experienced Board & Management Team
Chairman & BOD
Finance & Accounting, CFO
Peter Schulz
4/6 (+20 years in finance)
Asset Management
Morten Ingebrigtsen 32/35
Daigoro Oyama 17/22
HR
P.B. Subbiah
18/27
Chartering
Pacific & Global
Handysize
Surinder Brrar
14/36
Chartering
Atlantic & Global
Supramax
Kristian Helt
19/21
Commercial Operation
Suresh Prabhakar
21/45
Technical & Crewing
Harsh Bhave
8/26
5
Numbers Indicate
Years in Company / Years in Shipping
Company Secretary & Risk
Kitty Mok
25/25
CEO
Mats Berglund(Until 31 July 2021)
9/35
Martin Fruergaard 0/32

Pacific Basin 6
Understanding Our Core Market

Pacific Basin
Key Components of Our Business Model
Our business model has been refined over many years. We generate a TCE earnings premium over
market rates primarily because of our high laden percentage (minimum ballast legs), which is made
possible by a combination of
Versatile ships and diverse trades in minor bulk
Large fleet scale with high-quality interchangeable ships
Experienced staff – In our segments, skill and expertise makes a difference
Global office network – empowered local chartering and operations teams close to customers
Cargo contracts, relationships and direct interaction with end users
We are both asset heavy and asset light but have a high proportion of owned and in-house managed
vessels facilitating greater safety, reliability and control over the service to our customers
7

Pacific Basin
0
500
1,000
1,500
2,000
2,500
3,000
3,500
TCE Opex G&A Finance Cost Total
0
200
400
600
800
1,000
1,200
1,400
1,600
TCE Opex G&A Finance Cost Total
0
2,000
4,000
6,000
8,000
10,000
12,000
2016 2017 2018 2019 2020
$11,140
$7,780
$11,720
0
2,000
4,000
6,000
8,000
10,000
12,000
2016 2017 2018 2019 2020
$9,630
$7,860
$6,720
8
We Continue to Outperform on Every Level
Handysize Performance vs Market Supramax Performance vs Market
* Peer Group consists of all companies active in our Handysize and Supramax segments with sufficient publicly available information
to make a relevant comparison. Comparable finance costs per day are estimated using specific company lending rates but generic
vessel values and leverage levels
US$1,720/day average premium
in last 5 years
Supramax Outperformance vs Peer Group (2020)*Handysize Outperformance vs Peer Group (2020)*
US$/day$1,523
$3,046
US$/day US$/dayPB Performance
BHSI
US$1,490/day average premium
in last 5 years
PB Performance
BSI
US$/day
Note: Historical data has not been restated to split operating activity from core business Note: Historical data has not been restated to split operating activity from core business

Pacific Basin
14,630
18,000
5,000
7,000
9,000
11,000
13,000
15,000
17,000
19,000
1H20 2H20 1Q21 Actual TCE 2Q21 ForwardCover
Indicative Core Fleet P&L Breakeven Level incl G&A for 2020 = US$10,120
79%
of
days
10,950
16,100
5,000
7,000
9,000
11,000
13,000
15,000
17,000
19,000
1H20 2H20 1Q21 Actual TCE 2Q21 ForwardCover
Indicative Core Fleet P&L Breakeven Level incl G&A for 2020 = US$8,720
77%
of
days
9
Positive TCE Trend Continues
Handysize Core Business TCE Supramax Core Business TCE
Indicative 2Q21 TCE only, voyages are still in progress
Cover data as at 9 April 2021
US$/day net US$/day net

Pacific Basin
BHSI 38,000 dwt (tonnage adjusted)
* Excludes 5% commission
10
Exceptionally Strong Start to 2021
Source: Baltic Exchange
BSI 58,000 dwt
0
2,000
4,000
6,000
8,000
10,000
12,000
14,000
16,000
18,000
20,000
22,000
24,000
Jan Feb Mar Apr May Jun Jul Aug Sep Oct Nov Dec
Handysize Market Spot Rates in 2017-2021
US$/day net*
19 Apr 2021
$15,260
0
2,000
4,000
6,000
8,000
10,000
12,000
14,000
16,000
18,000
20,000
22,000
24,000
Jan Feb Mar Apr May Jun Jul Aug Sep Oct Nov Dec
Supramax Market Spot Rates in 2017-2021
US$/day net*
19 April 2021
$19,630

Pacific Basin 11
Demand Fundamentals have Driven the Market
Core Market Drivers
Continued strong Chinese demand for dry bulk imports even through the normally weaker Chinese New Year period but also
good demand from non-Chinese destinations
Global grain loadings in the first quarter were 15% higher than the same period last year, benefitting from record high US
soybean exports in the fourth quarter 2020 continuing into 2021 as well as significant corn exports to China which is a new and
very encouraging trend
Minor bulk loadings were up 10% in the first quarter compared to last year with strong demand for construction materials
Coal loadings have recovered following the pandemic induced weakness particularly due to recovery in Indian demand. Global
coal loading volumes are now about 20% higher than in the summer of 2020 and back up to prior year levels
Temporary Market Drivers
The cold northern hemisphere winter drove coal imports
Trade friction between Australia and China also benefitted the dry bulk market with large ships stuck at Chinese ports with
Australian coal and China requiring imports from further afield while Australian coal moved elsewhere in smaller vessels
Exceptionally high container rates making it economical for shippers to shift some cargoes such as steel, logs and break bulk
from containers to dry bulk ships (there is no indication of this stopping)
General Covid related restriction affecting the efficiency of the global dry bulk fleet (quarantines, crew change restrictions etc.)
Future Market Drivers
As is usual we are now seeing the beginning of the South American grain season with expectations of a strong soybean
harvest in Brazil in particular
For the remainder of 2021 and 2022 GDP growth forecasts are revised up and we expect the market to be supported by
significant economic stimulus incl. infrastructure projects and the roll-out of vaccines
It’s encouraging to see that the order book continues to reduce despite the current market exuberance and we expect lower
deliveries in the second half of 2021 and into 2022 which is expected to result in reduced net fleet growth across the whole dry
bulk sector and especially in our segments

Pacific Basin
17
18
19
20
21
22
23
24
Jan-20 Apr-20 Jul-20 Oct-20 Jan-21 Apr-21
US$ Million
Well Timed Acquisition of Four Ultramaxes in November 2020
Second-hand 5-year old benchmark
(60-61,000 dwt): US$22.5m
12
Significant Leverage from Our Larger Owned Fleet
Pacific Basin has grown its owned fleet significantly in recent years particularly in Supramaxes and Ultramaxes,
while continuing to divest older, smaller Handysize vessels
Supramaxes and Ultramaxes have larger earnings upside in strong markets
On the back of improving freight rates, second hand vessel values have rebounded by 20%-30% since the lows
of last year
This is the market we have been working so hard over many years to set up for and our current core fleet of 91
Handysize and 41 Supramax ships is now generating very attractive returns
4.8*
0.0
0.5
1.0
1.5
2.0
2.5
3.0
3.5
4.0
4.5
5.0
2012 2013 2014 2015 2016 2017 2018 2019 2020 2021
Significant Growth of Overall Fleet and SupramaxProportion
Supramax Handysize
Million dwt
*Including purchased and sold vessels scheduled to deliver in the first half of 2021Source: Clarksons Research

Pacific Basin 13
Source: Baltic Exchange
* Excludes 5% commission
A Remarkable Recovery – Back to 2010 Rate Levels
$0
$5,000
$10,000
$15,000
$20,000
$25,000
$30,000
2010 2011 2012 2013 2014 2015 2016 2017 2018 2019 2020 2021
US$/day (net*)
Baltic Handysize Index (BHSI 28,000 dwt)
$0
$5,000
$10,000
$15,000
$20,000
$25,000
$30,000
2010 2011 2012 2013 2014 2015 2016 2017 2018 2019 2020 2021
US$/day (net*)
Baltic Supramax Index (BSI 58,000 dwt) Net

Pacific Basin 14
Handysize Values and Earnings
Newbuilding Second Hand
Resale Contract 5 YO 10 YO 15 YO
Value end 2010 (mill) 30.0 26.5 25.0 21.5 15.0Value now (mill) 24.8 25.0 19.5 11.5 6.8Upside to 2010 value 21% 6% 28% 87% 121%
Approx Q2 Rate/day ($) 18,000 17,000 16,000 15,000
EBITDA*/year (mill) 4.2 3.8 3.5 3.1
EBITDA/value 17% 20% 30% 46%
Note that the scrap value of a typical Handysize vessel today is around US$3.3 million
Cash cost assumed to be about US$6,000 per day (Opex, dry-dock & G&A)

Pacific Basin
Note that the scrap value of a typical Supramax vessel today is around US$4.8 million
Cash cost assumed to be about US$6,000 per day (Opex, dry-dock & G&A)
15
Supramax Values and Earnings
Newbuilding Second Hand
Resale Contract 5 YO 10 YO 15 YO
Value end 2010 (mill) 37.0 31.0 29.0 24.0 19.0Value now (mill) 29.5 27.0 22.5 14.5 10.3Upside to 2010 value 25% 15% 29% 66% 84%
Approx Q2 Rate/day ($) 20,000 19,000 18,000 18,000
EBITDA*/year (mill) 4.9 4.6 4.2 4.2
EBITDA/value 17% 20% 29% 41%

Pacific Basin 16
Orderbook as a % of Existing Fleet
23.6%
16.3%
13.5%
8.9%
6.0% 5.6%
3.5%
0%
5%
10%
15%
20%
25%
LNG LPG Container Crude Product Dry Bulk Handysize

Pacific Basin 17
+/- US$1000
daily TCE
+/- US$35-40m
in underlying
earnings
Earnings
sensitivity to
rates*
• Vaccine and
economic
stimulus expected
to lead demand
recovery
• IMF forecast
global growth of
6.0% in 2021
• Clarkson
Research expects
4.8% minor bulk
demand growth in
2021
Healthy Demand
Outlook
Favourable Supply
Fundamentals
Pacific Basin
Operating Leverage
• Dry bulk
orderbook at 5.6%
(lowest in modern
time)
• Handy/Supra
expected fleet
growth of 1.8% in
2021 and lower in
2022
• Environmental
regulations
discouraging new
ordering
• Regulation will
lead to lower
speeds
• Large owned fleet
with fixed costs
including increasing
Supramax
proportion means
significant leverage
• Competitive costs
and track record of
TCE
outperformance
• Strong balance
sheet allowing
strategically timed
investment
We are Well Positioned for the Future
* Based on current fleet and commitments, and all other things equal

Pacific Basin
Q&A

Pacific Basin

Pacific Basin
Dry Bulk Market Overview
Supply / demand balance reached a tipping point in 1Q21 evidenced by Handysize and Supramax
earnings reaching 10-year highs
Dry bulk net fleet growth peaked mid last year and is now in a decline that will continue
Dry bulk orderbook is record low and new contracting is held back by uncertainty over future vessel
design required to meet emission reduction targets
In light of Covid lockdowns, dry bulk demand was resilient last year and has shown good growth in
1Q21, especially grain and minor bulks with support from a tight container market shifting cargo
volume to dry bulk
Seasonality and stimulus will support demand growth futher into 2021
20

Pacific Basin 21
Source: Baltic Exchange
* Excludes 5% commission
It’s Worth Mentioning it Again….
A Remarkable Recovery – Back to 2010 Rate Levels
$0
$5,000
$10,000
$15,000
$20,000
$25,000
$30,000
2010 2011 2012 2013 2014 2015 2016 2017 2018 2019 2020 2021
US$/day (net*)
Baltic Handysize Index (BHSI 28,000 dwt)
$0
$5,000
$10,000
$15,000
$20,000
$25,000
$30,000
2010 2011 2012 2013 2014 2015 2016 2017 2018 2019 2020 2021
US$/day (net*)
Baltic Supramax Index (BSI 58,000 dwt) Net
This is not caused by any specific event but driven by a broad based demand improvement while
supply net fleet growth is reducing

Pacific Basin 22
Dry Bulk Orderbook is at a Multi-Decade Low
% of Fleet
Handysize
(25,000-
41,999 dwt)
Supramax
(42,000-
64,999 dwt)
Panamax
(65,000-
119,999dwt)
Capesize
(120,000+
dwt)
Source: Clarksons Research
0%
10%
20%
30%
40%
50%
60%
70%
80%
90%
1995 2000 2005 2010 2015 2020
8.0% 7.2% 8.4%
5.6%
3.5%
5.4%
6.0% 6.0%
Total Dry Bulk Orderbook 5.6%

Pacific Basin
3.7%
2.6%
0.9%
0.2%
3.7%
2.8%
-2%
-1%
0%
1%
2%
3%
4%
5%
6%
2016 2017 2018 2019 2020E 2021F 2022+F
% YOY Change
Total Dry Bulk Supply and Demand
Net Fleet Growth Overall Dry Bulk Tonne-mile demand
2.9%
1.8%
1.0%
-1.3%
4.8%
3.7%
-2%
-1%
0%
1%
2%
3%
4%
5%
6%
2016 2017 2018 2019 2020E 2021F 2022+F
Minor Bulk Demand and Supply
Net Fleet Growth Tonne-Mile Demand
% YOY Change
23
IMF forecasts global GDP growth of 6.0% for 2021, moderating to 4.4% in 2022
Clarksons Research forecasts minor bulk demand growth of 4.8% and 3.7% in 2021 and 2022,
versus minor bulk net supply growth of only 1.8% and 1.0% respectively
Improving Demand / Supply Balance
Source: Clarksons Research

Pacific Basin
1,100
1,150
1,200
1,250
1,300
1,350
1,400
1,450
1,500
1,550
Jan Feb Mar Apr May Jun Jul Aug Sep Oct Nov Dec
2018201920202021
300
350
400
450
500
550
600
650
Jan Feb Mar Apr May Jun Jul Aug Sep Oct Nov Dec
2018201920202021
24
Source: Indicative data and material from AXS Marine, all rights reserved
Data is subject to revision
Minor BulksMillion tonnes (annualised)
GrainsMillion tonnes (annualised)
Note: Percentage changes are year-on-year comparisons
3M 2021 +10.2% YoY
3M 2021 +16.8% YoY
Loading Data Explains the Strong Start to 2021
1,200
1,300
1,400
1,500
1,600
1,700
1,800
Jan Feb Mar Apr May Jun Jul Aug Sep Oct Nov Dec
2018201920202021
Million tonnes (annualised) Iron Ore
3M 2021 +9.0% YoY
1,000
1,050
1,100
1,150
1,200
1,250
1,300
1,350
1,400
Jan Feb Mar Apr May Jun Jul Aug Sep Oct Nov Dec
2018201920202021
Million tonnes (annualised)
3M 2021 -0.5% YoY
Coal

Pacific Basin
0.0
2.0
4.0
6.0
8.0
10.0
12.0
Jan Feb Mar Apr May Jun Jul Aug Sep Oct Nov Dec
2016
2017
2018
2019
2020
2021
Black Sea Grain/Soybean Loadings
3M 2021 -20% YoY
Million tonnes
(per month)
25
8
10
12
14
16
18
20
22
24
Jan Feb Mar Apr May Jun Jul Aug Sep Oct Nov Dec
2016
2017
2018
2019
2020
2021
US and Canadian Grain, Soybean and
Soymeal Loadings
3M 2021 +57% YoY
Million tonnes
(per month)
0
5
10
15
20
25
30
Jan Feb Mar Apr May Jun Jul Aug Sep Oct Nov Dec
2016
2017
2018
2019
2020
2021
Brazil and Argentina Grain, Soybean
and Soymeal Loadings
3M 2021 +0% YoY
Million tonnes
(per month)
0.0
0.5
1.0
1.5
2.0
2.5
3.0
3.5
4.0
4.5
Jan Feb Mar Apr May Jun Jul Aug Sep Oct Nov Dec
2016
2017
2018
2019
2020
2021
Australian Grain/Soybean
Loadings
3M 2021 +141% YoY
Million tonnes
(per month)
Good Growth for Key Grain Trades in 2021
Source: AXS Marine cargo tracking

Pacific Basin 26
Source: Bloomberg and Platts
Data is subject to revision
Copper
Iron OreUS$/tonne
SteelRMB$/tonne
CornRMB$/Bushel
Commodity Prices
US$/tonne
0
25
50
75
100
125
150
175
200
2005 2008 2011 2014 2017 2020
0
750
1,500
2,250
3,000
3,750
4,500
5,250
6,000
2010 2012 2014 2016 2018 2020
0
500
1,000
1,500
2,000
2,500
3,000
3,500
2010 2012 2014 2016 2018 2020
0
2,000
4,000
6,000
8,000
10,000
12,000
2009 2011 2013 2015 2017 2019 2021

Pacific Basin 27
0
10
20
30
40
50
60
70
80
90
2015 2016 2017 2018 2019 2020 2021
Trade by Oceanic basin for 25-65k dwt
Million tonnes
(per month)
Inter Pacific
+16.6Mt YoY
Front haul Atlantic to
Pacific(1.4Mt)
YoY
Inter Atlantic+11.6Mt
YoY
Back haul Pacific to Atlantic+12.3Mt
YoY
Inter Pacific represents the greatest volume and has
seen the largest volume growth in 1Q21
Inter Atlantic trade saw a decline in 2020 however
showing strong growth in 1Q21
Front haul Atlantic to Pacific represents trades for
vessels with Atlantic cargoes to the Far East which
have declined in 1Q21
Back haul Pacific to Atlantic represents trades with
Pacific cargoes to the Atlantic which have seen strong
growth in 1Q21
Handysize and Supramax Trades by Oceanic Basin
Source: AXS Marine cargo tracking

Pacific Basin
0
2
4
6
8
10
12
14
16
18
Jan Feb Mar Apr May Jun Jul Aug Sep Oct Nov Dec
2016
2017
2018
2019
2020
2021
World Total Grain Loadings for China Discharge
3M 2021 +43% YoY
28
US Grain Exports to China Taking a Larger Share of a
Growing Trade
Source: AXS Marine cargo tracking
26.0
2.03.6
-2.7
1.7
6.5
2.8
-0.1
US Canada Brazil Argentina Australia Bl Sea UK/Cont Other
2020 YoY change for China
grain discharge by load area
Total 39.8 mill tonnes / +38%
0
2
4
6
8
10
12
Jan Feb Mar Apr May Jun Jul Aug Sep Oct Nov Dec
2016
2017
2018
2019
2020
2021
US Grain Loadings for China Discharge
3M 2021 +228% YoY
9.8
1.1
-2.3
1.3
-0.9
1.40.8
-0.4
US Canada Brazil Argentina Australia Bl Sea UK/Cont Other
Q1 2021 YoY change for China
grain discharge by load area
Total 10.7 mill tonnes / +43%
Million tonnes
(per month)
Million tonnes
(per month)

Pacific Basin 29
Chinese Strong Minor Bulks Imports
Source: China Customs
+24
(26)
+4
+10
0 0 +1 +2
(1) (1)
-40
-30
-20
-10
0
10
20
30
Iron Ore Coal Soybean Cereal C-conc Ferts Steel Logs Bauxite Ni-ore
+9% -28% +20% +164% +9% +12% +18% +25% -6% -31%
China imports year-to-date 2021 growth
Total up 12Mt / +3% YoY
Covering Jan-Mar Covering Jan-Feb
Million tonnes

Pacific Basin 3030%
35%
40%
45%
50%
55%
60%
65%
70%
75%
2013 2014 2015 2016 2017 2018 2019 2020 2021
Indicative dry bulk share for Chinese
steel exports When combining cargo tracking data with Chinese
Customs trade numbers, the indicative share of steel
exports carried on dry bulk tonnage has gone up in
2021. This makes sense when the container market is
tight and some cargoes, such as steel, is shut out and
therefore coming back to dry bulk
Minor Bulks in Further Detail
Source: AXS Marine cargo tracking and China Customs
Million tonnesMillion tonnes
-2.75.3
-41.6
8.0 0.0 0.5
-3.5
-50
-40
-30
-20
-10
0
10
20
Agri prod Breakbulk Other Fertiliser Iron prod Pellets Steel
Minor Bulks 2020 YoY down 33.9 Mt / -2.5%
(2.6%)
+3.0%
(5.7%)
+5.2%
+0.3% +4.4%
(2.0%)
Global Minor Bulk Loadings 2020 Global Minor Bulk Loadings 1Q21
5.0
8.96.7
2.2
0.0
0.1
11.5
-2
0
2
4
6
8
10
12
14
Agri prod Breakbulk Other Fertiliser Iron prod Pellets Steel
Minor Bulks Q1 2021 YoY up 34.4 Mt / +11.0%
+25.5%
+21.3%
+4.0%
+6.4%
(1.3%)
+4.4%
+27.0%

Pacific Basin 31
0
5
10
15
20
25
30
35
40
2019 2020 2021
China India Japan Korea Oth F East Cont/Med Other
Australian Coal Loadings by Destination
Australian coal volume declined as China disappeared
but supra/ultramax employment has increased
2020 Volume was Down 2021 Volume was Down
Supra/Ultra up in 2020
Supra/Ultra up in 2021
Measured as number of voyage days with
Australian coal - by sector (smaller vessels
are negligible) for this trade
Source: AXS Marine cargo tracking
Million tonnes

Pacific Basin
Looking ahead
With tighter Supply / demand balance we expect greater volatilty from a higher base level
Net fleet growth will continue to decline
Dry bulk cargo volume has a seasonal boost-effect later in the year
Large parts of the world economy has yet to open fully from Covid lockdowns
Wide spread stimulus will continue to support dry bulk trade
Higher newbuilding prices and risk of getting the wrong design for future maritime emission regulation
is keeping new ordering to a lower level than what a bullish market sentiment would normally dictate
32

Pacific Basin
Q&A

Pacific Basin

Pacific Basin
Overview
35
Pacific Basin Business Model
Chartering Market Update
Cover Management
Explaining backhauls
How our backhaul cover works
When to lock in fronthaul cover
Fleet Optimisation
TCE Outperformance

Pacific Basin 36
Pacific Basin Business Model
Our business model has been refined over many years. In the longer term, we are able to generate a TCE
earnings premium over market rates because of our high laden percentage (minimum ballast legs), which is
made possible by a combination of:
Fleet scale and interchangeability
Handysize fleet we are trading up in size and age
Supramax fleet we are growing in number and size
Versatile ships and diverse trades in minor bulk with large proportion of owned fleet
Experienced staff and global office network
We operate globally and connect with customers locally
We speak the local language and are in the same time zone
Positioning the fleet where our customers want it
Arbitraging cargo positions with ships multi-dimensionally (size, location, time, duration, values)
Cargo contracts, relationships and direct interaction with end users
Ongoing optimisation processes
Technical : speed management and fuel consumption
Operations : improving processes and cargo care
Chartering : improving contract clauses, improving port stay management and simplifying systems and
processes

Pacific Basin
14,630
18,000
5,000
7,000
9,000
11,000
13,000
15,000
17,000
19,000
1H20 2H20 1Q21 Actual TCE 2Q21 ForwardCover
Indicative Core Fleet P&L Breakeven Level incl G&A for 2020 = US$10,120
79%
of
days
10,950
16,100
5,000
7,000
9,000
11,000
13,000
15,000
17,000
19,000
1H20 2H20 1Q21 Actual TCE 2Q21 ForwardCover
Indicative Core Fleet P&L Breakeven Level incl G&A for 2020 = US$8,720
77%
of
days
37
It’s Worth Mentioning Again….
Chartering Market Update: Positive TCE Trend Continues
Handysize Core Business TCE Supramax Core Business TCE
Indicative 2Q21 TCE only, voyages are still in progress
Cover data as at 9 April 2021
US$/day net US$/day net

Pacific Basin
Chartering Market Update (cont’d)
39%Minor Bulk
Key drivers of current market are many – all adding to the strong underlying demand story unfolding
Synchronicity in strong cargo demand in almost all global markets
De-containerisation from box into bulk and MPPs largely out of dry bulk sector
Pacific ‘swing cargo’ of Indo-China coal demand may add fuel to the demand story
The market is strong in spite of many vessels speeding up
Some inefficiencies in trading patterns
crew change crisis
vessel quarantine requirements
China/Australia trade dispute
38

Pacific Basin
Chartering Market update (cont’d)
39%Minor Bulk
39
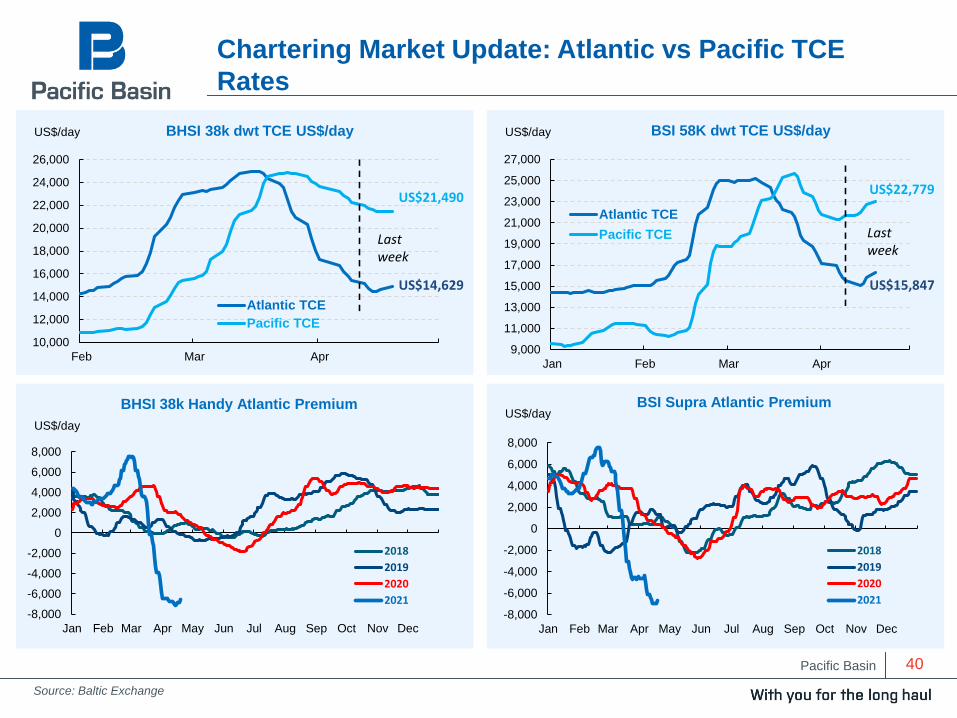
Front haul trades
Pacific: very strong demand in Indian Ocean, Australian, New Zealand and South East Asian markets.
North Pacific last to join this demand story with all key markets now in an upswing
Atlantic: market turned positive after just a few weeks of weakness caused by the US Gulf grain
season concluding despite with the highest fleet count of Handysize and Supramax ever
Back haul trades
Our customer requirements are in the fronthaul regions
Position the fleet to capture the large fronthaul premiums available in strong markets
Cost to position a ship on a backhaul voyage has reduced significantly
Fantastic opportunity to capture strong backhaul rates and then capitalising on fronthaul positioning
Fleet positioning
Dynamic approach in pricing and positioning of our fleet in Atlantic and Pacific
Indian Ocean becoming a premium trading area on the back of stronger Atlantic and Pacific markets
As global operator we can trade anywhere, any time and any duration
Pacific Basin
-8,000
-6,000
-4,000
-2,000
0
2,000
4,000
6,000
8,000
Jan Feb Mar Apr May Jun Jul Aug Sep Oct Nov Dec
BSI Supra Atlantic Premium
2018
2019
2020
2021-8,000
-6,000
-4,000
-2,000
0
2,000
4,000
6,000
8,000
Jan Feb Mar Apr May Jun Jul Aug Sep Oct Nov Dec
BHSI 38k Handy Atlantic Premium
2018
2019
2020
2021
40
Chartering Market Update: Atlantic vs Pacific TCE
Rates
Source: Baltic Exchange
10,000
12,000
14,000
16,000
18,000
20,000
22,000
24,000
26,000
Feb Mar Apr
Atlantic TCE
Pacific TCE
BHSI 38k dwt TCE US$/day
US$21,490
US$14,629
Last week
9,000
11,000
13,000
15,000
17,000
19,000
21,000
23,000
25,000
27,000
Jan Feb Mar Apr
Atlantic TCE
Pacific TCE
BSI 58K dwt TCE US$/day
US$15,847
Last week
US$22,779
US$/day
US$/day
US$/day
US$/day

Pacific Basin 41
Chartering Market Update : Atlantic vs Pacific Fleet
Allocation
Source: Pacific Basin internal AIS system data as at 18 April 2021
1,025
1,050
1,075
1,100
1,125
1,150
1,175
1,200
1,225
Jan Feb Mar Apr May Jun Jul Aug Sep Oct Nov Dec
Number of Handysize Vessels in Atlantic
2017 2018 2019 2020 2021
1,350
1,400
1,450
1,500
1,550
1,600
1,650
Jan Feb Mar Apr May Jun Jul Aug Sep Oct Nov Dec
Number of Handysize Vessels in Pacific
2017 2018 2019 2020 2021
No. of Vessels
750
800
850
900
950
1,000
1,050
1,100
Jan Feb Mar Apr May Jun Jul Aug Sep Oct Nov Dec
Number of Supramax Vessels in Atlantic
2017 2018 2019 2020 2021
No. of Vessels
1,900
2,000
2,100
2,200
2,300
2,400
2,500
2,600
Jan Feb Mar Apr May Jun Jul Aug Sep Oct Nov Dec
Number of Supramax Vessels in Pacific
2017 2018 2019 2020 2021
No. of Vessels
No. of Vessels

Pacific Basin
Cover Management: Explaining Backhauls
42
A normal cargo system comprises 1 empty ballast leg + 1 laden fronthaul leg
By combining backhaul and fronthaul cargoes, we achieve higher utilisation and outperform the market
(Baltic Exchange indices and peer group)

Pacific Basin 43
Cover Management: How Our Backhaul Cover Works (in
$10,000/day market)
Backhaul Voyage Discounted positioning cost for 35 days
Front haul TCE
Round Voyage TCE Premium for 70 days = ($100,000/70 days)
Premium position value for 35 days $200,000
($100,000)
TCE
$7,143
$15,714
$100,000
Value
$11,429
(i.e. $1,429
better than
no backhaul)

Pacific Basin
Shipping Market Cycle
1) Spot trade
2) Medium-term COA
3) Long-term COA
4) Medium-term COA
5) Reduce charter-in exposure
Watch the cycle carefully
Stay close to customers and take cover as they come, step-by-step
Continue positioning our ships to where our customer base requires
44
Cover Management: When to Lock-in Cover?
Pacific Basin 45
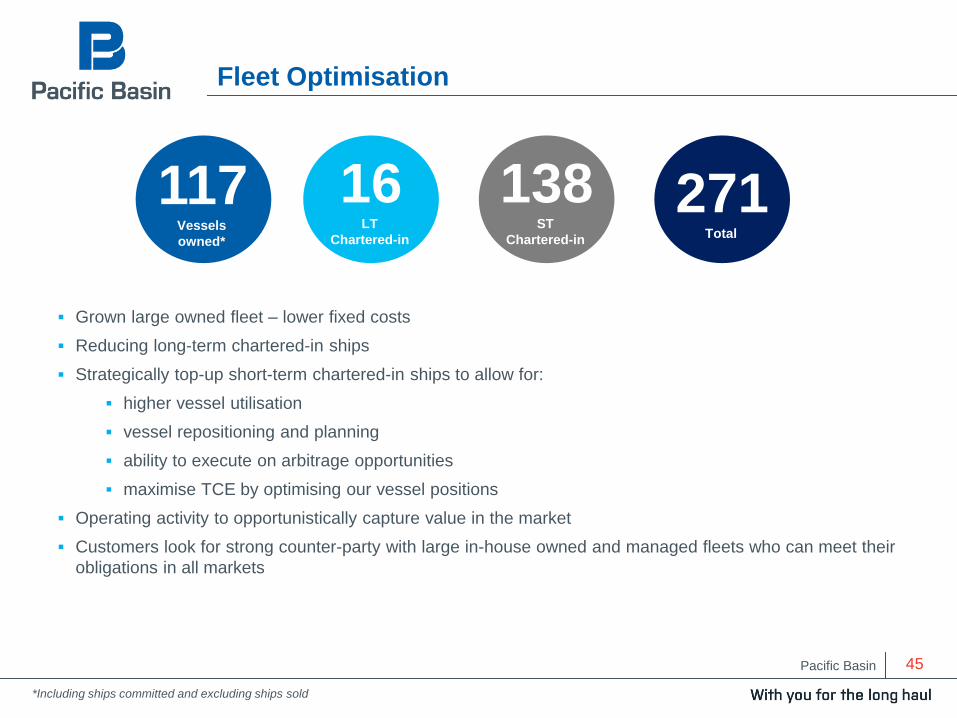
Fleet Optimisation
117Vessels
owned*
138ST
Chartered-in
271Total
16LT
Chartered-in
Grown large owned fleet – lower fixed costs
Reducing long-term chartered-in ships
Strategically top-up short-term chartered-in ships to allow for:
higher vessel utilisation
vessel repositioning and planning
ability to execute on arbitrage opportunities
maximise TCE by optimising our vessel positions
Operating activity to opportunistically capture value in the market
Customers look for strong counter-party with large in-house owned and managed fleets who can meet their
obligations in all markets
*Including ships committed and excluding ships sold
Pacific Basin 46
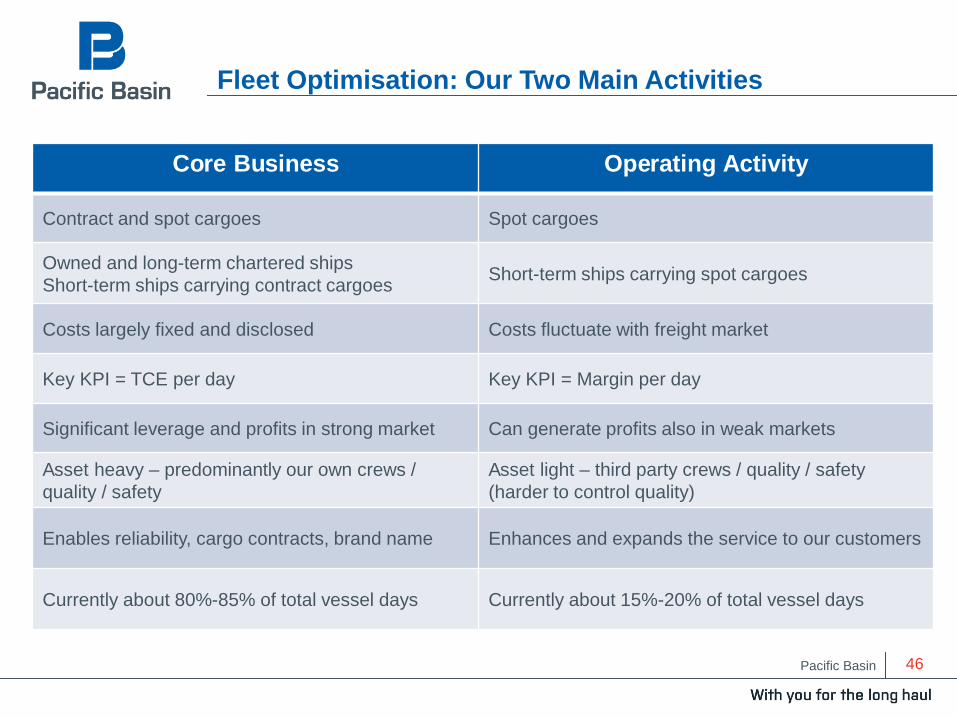
Fleet Optimisation: Our Two Main Activities
Core Business Operating Activity
Contract and spot cargoes Spot cargoes
Owned and long-term chartered ships
Short-term ships carrying contract cargoesShort-term ships carrying spot cargoes
Costs largely fixed and disclosed Costs fluctuate with freight market
Key KPI = TCE per day Key KPI = Margin per day
Significant leverage and profits in strong market Can generate profits also in weak markets
Asset heavy – predominantly our own crews /
quality / safety
Asset light – third party crews / quality / safety
(harder to control quality)
Enables reliability, cargo contracts, brand name Enhances and expands the service to our customers
Currently about 80%-85% of total vessel days Currently about 15%-20% of total vessel days

Pacific Basin
TCE Outperformance
39%Minor Bulk
Our outperformance has been developed over time to primarily optimise in lower markets now swiftly
readjusting to optimise in higher markets
there will always be a lag in both rising and falling markets
market dynamics necessitates re-optimisation of routes
Our fleet interchangeability, together with in-house management, global office network positions Pacific
Basin to capitalise on cover opportunities
Our customer service levels and our fleet size offers us an unprecedented opportunity to lock-in solid
profitable TCE over the longer term
Backhaul business leads to high utilisation rates which in turn leads to long term outperformance
47

Pacific Basin
Q&A

Pacific Basin

Pacific Basin 50
Our Two Main Activities
Core Business Operating Activity
Contract and spot cargoes Spot cargoes
Owned and long-term chartered ships
Short-term ships carrying contract cargoesShort-term ships carrying spot cargoes
Costs largely fixed and disclosed Costs fluctuate with freight market
Key KPI = TCE per day Key KPI = Margin per day
Significant leverage and profits in strong market Can generate profits also in weak markets
Asset heavy – predominantly our own crews /
quality / safety
Asset light – third party crews / quality / safety
(harder to control quality)
Enables reliability, cargo contracts, brand name Enhances and expands the service to our customers
Currently about 80%-85% of total vessel days Currently about 15%-20% of total vessel days

Pacific Basin 51
Our TCE Reporting Methodology
Our “core business” is to optimally combine our owned and long-term chartered ships with multi-shipment contract
cargos and spot cargoes to achieve the highest daily TCE earnings. Our core business also uses short-term
chartered ships to carry contract cargoes to maximise the utilisation and TCE of our owned and long-term chartered
ships. The positive (or negative) margin on these short-term chartered ships is added to the TCE achieved on our
owned and long-term chartered ships.
We also disclose the margin per day generated by our “operating activity” which is separate and complementary to
our core business. Through our operating activity, we provide a service to our customers even if our core ships are
unavailable by matching our customers’ spot cargoes with short-term chartered ships, making a margin and
contributing to our group results regardless of whether the market is weak or strong.
For our core business, daily TCE revenue is the important KPI, as costs per day are substantially fixed and disclosed.
For our operating activity, short-term charter costs fluctuate with the freight market and therefore the important KPI is
the margin per day (the net daily difference between TCE revenue and charter costs), not the TCE level itself.
Owned + Long-Term Chartered TCE Revenue +
Short-Term Chartered (excluding Operating) Result
Owned + Long-Term Chartered Revenue Days
Operating Margin
Operating Days
Deriving our Core Business Daily TCE Deriving our Operating Activity Daily Margin

Pacific Basin 52
How to Model Pacific Basin
Sensitivity:
+/- US$1,000 daily TCE = US$35-40 million per year
Adjusted for ca. 20-25% typical long-term forward cargo cover at any point in time
1 Note that core TCE includes the margin (positive or negative) from short term ships carrying contract cargoes2 Long-Term Chartered in ships3 Revenue days + offhire days = cost days
Handysize contribution Core TCE1 x owned & LTC 2 revenue days +
Blended cost x owned & LTC cost days 3 -
= X
Supramax contribution +
-
= X
Operating Activity Operating margin x operating days X
Post Panamax contribution X
Total G&A - X
Underlying Result = X
Core TCE1 x owned & LTC revenue days
Blended cost x owned & LTC cost days 3

Pacific Basin
1,070
3,590
4,160
11,920
9,180*
-
2,000
4,000
6,000
8,000
10,000
12,000
14,000
Owned Long-Term Chartered Blended
Costs FY20
53
Understanding the Sensitivity
2Q21 Forward TCE rate
US$16,100/day
Handysize
2Q21 Forward TCE rate
US$18,000/day
Supramax
Key Assumptions
• No change in
Operating Activity
profitability
• No change in G&A
Owned Core Fleet as at 31 December 2020
Owned Core Fleet Break-even as at 31 December 2020
*Indicative Core Fleet P&L Breakeven Level incl G&A = US$9,180 + US$940 (Owned G&A) = US$10,120/day
*Indicative Core Fleet P&L Breakeven Level incl G&A = US$7,780 + US$940 (Owned G&A) = US$8,720/day
660
2,620
4,100
7,780*
10,020
-
2,000
4,000
6,000
8,000
10,000
12,000
14,000
Owned Long-Term Chartered Blended
Costs FY20
7,3808,820
Sensitivity
+/-
Underlying Profit
US$35-40m
% of Open
Days in Next
12 Months
(excl. CoA
cover) 75-80%
+/-
US$1,000/day
Market Rate
360
On-hire Days
Number of
Owned + LT
Chartered
Ships

Pacific Basin 54
Capital Allocation
Should the Market Recovery Continue
A) Pacific Basin’s operating cash flow will be healthy (operational leverage)
B) The pace of fleet growth could slow as vessels become more expensive – the pace of selling older tonnage
* might increase
Priorities will be
1) Delever balance sheet in line with amortisation profile
2) Maintain strong liquidity position (underpin unsecured funding and dry powder for opportunistic investments
* in new technology etc.)
3) Shareholder distribution in line with stated policy

Pacific Basin
Q&A

Pacific Basin