virtual star conference investor presentation october 13th
TRANSCRIPT

Virtual STAR Conference | 13 October 2021
Virtual STAR Conference Investor presentationOctober 13th, 2021

2
Agenda
Group Highlights
White Cement Global Leadership
Industrial Plan and ESG commitment
2021 First Half Results
Appendix
3
8
14
24
34

3
Group Highlights
Sky Park, Bratislava (Slovakia)
4
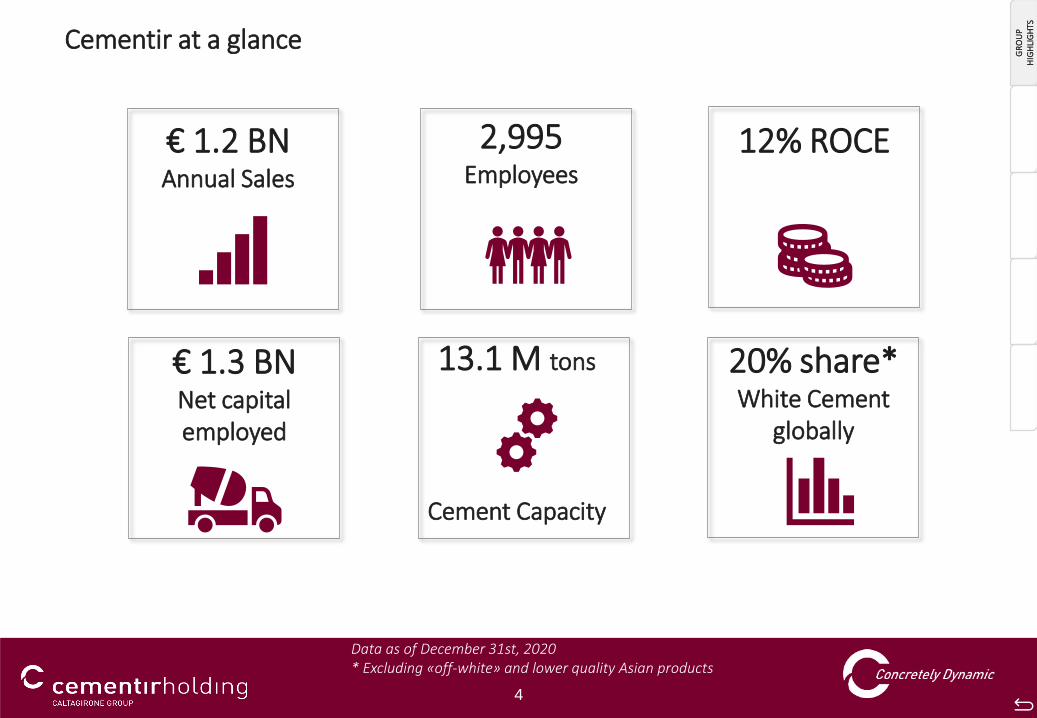
Cementir at a glance
€ 1.3 BNNet capital employed
13.1 M tons
Cement Capacity
€ 1.2 BNAnnual Sales
2,995Employees
20% share*White Cement
globally
12% ROCE
Data as of December 31st, 2020* Excluding «off-white» and lower quality Asian products
GR
OU
P
HIG
HLI
GH
TS

5
Business segments
GREY CEMENT WHITE CEMENT READY-MIXED CONCRETE AGGREGATESWASTE / CONCRETE
PRODUCTS
REVENUE = 779 M€EBITDA = 208 M€
EBITDA margin = 27%
REVENUE = 391 M€EBITDA = 35 M€
EBITDA margin = 9%
REVENUE = 92 M€EBITDA = 31 M€
EBITDA margin = 33%
REVENUE = 26 M€ EBITDA (*) = -0.7 M€
2020 Figures
(*) 2020 EBITDA includes € 3.1M of non-recurring charges due to equipment disposal in Turkey
GR
OU
P
HIG
HLI
GH
TS

6
Industrial Footprint
Plants
Cement plants: 11
Terminals: 32
RMC plants: 100
Quarries: 10
Precast products plants: 1
Waste management facilities: 2
Capacity / Sales
Grey cement capacity: 9.8 mt
White cement capacity: 3.3 mt
Grey cement sales: 7.9 mt
White cement sales: 2.8 mt
RMC sales: 4.4 mm3
Aggregate sales: 9.5 mt
Grey cement plantsWhite cement plantsCountry with operations
Data as of December 31st, 2020
GR
OU
P
HIG
HLI
GH
TS

7
• Strengthen white cement global leadership, focus on high-value added solutions and special cements (FuturecemTM)
• Significant green investments of 107 M€ over the 2021-2023 Industrial Plan
• Improve profitability and operational efficiency with product innovation, digitalization of industrial processes and green investments
• Further diversify business portfolio by region and product
• Leverage on unique vertically integrated platforms in the Nordics, Belgium and Turkey
Strategy based on sustainable growth
Nordic & Baltic58%
Belgium23%
North America8%
Turkey3%
Egypt4%
Asia Pacific9%
Holding and services
-4%
2020 EBITDA breakdown
85% of Ebitda from mature markets (Currencies: EUR, USD, DKK, NOK, SEK)
263.7 M€
GR
OU
P
HIG
HLI
GH
TS

8
White cement global leadership
Deichman Main Library, Norway
WH
ITE
CEM
ENT
LEA
DER
SHIP

9
White Cement: unique competitive position
2.8 Mt White cement and clinker volumes sold in 2020
Global leadership in white cement
3.3 Mt Cement Capacity
Local leadership and production
25%Share of GlobalTraded flows
20+ countriesLocal market presence
#1 in USA, Continental Europe, Oceania and South-East Asia
Global leader in trading flows
In 2020, exports accounted for 1.3 Mt out of 2.8 Mt total volumes sold
Local sales force and/or controlled logistic setup in 20 key target markets
80+ countriesCommercial Presence
Sales in more than 80 countries
WH
ITE
CEM
ENT
LEA
DER
SHIP

10
Source: Cementir estimates, CW Research.
White cement consumption by macro-area
White cement consumption per capita by country (kg)
✓ Per capita consumption is the highest in the Middle East (approx. 14 kg), where consumption is declining
✓ All areas where Cementir Holding is leader recordedthe highest per capita consumption growth in 2014-20
✓ North America, where Cementir is the onlymanufacturer, is the country with the highest growth
Global white cement demand stands at around 19m tons in 2020e
Bubble size and figures show 2020e white cement consumption in Mt. Countries in red are those where Cementir is #1
Red dot shows the «white cement belt»
WH
ITE
CEM
ENT
LEA
DER
SHIP

11
Largest white cement manufacturers’ capacity (Mt)
3,30
2,66
1,61
1,20 0,97
0,90 0,90 0,80 0,71 0,70 0,66
1.2x
~12% ~9% ~3% ~2%~4%~6%
*
*
* Cimsa capacity includes Buñol plant (650kt of capacity) acquired from Cemex in July 2021.
Share of global white cement capacity (Total = 28.4 Mt)
Source: Cementir estimates, CW Research.
WH
ITE
CEM
ENT
LEA
DER
SHIP

12
Segments:
1.Pre-stressed and Ordinary
Reinforced Precast
2.Precast Products
3.Artificial Stones
4.GRC (Glass Fiber Reinforced
Concrete)
5.UHPC (Ultra High-Performances
Concrete)
6.Dry Mix Mortars
7.RMC
Unlimited White Cement applications
1. Pre-stressed concrete façade: Chengdu Jingchuan Office Building, China
2. Paving blocks: Kerb, Poland
7. Cast in-situ concrete: Huai’an Shilian Chemical Plant, China | Architect: Alvaro Siza
6. Skim coat | Tile AdhesivesSelf levelling floor screed | Stucco
4. GRC façade: Changsha Meixihu Art Museum, China| Zaha Hadid Architects
5.UHPC staircase in Per Aarsleff office building, Denmark
3. Artificial stone: Villa façade application, France
WH
ITE
CEM
ENT
LEA
DER
SHIP

13
Sustainable patented solution for cement, RMC and innovative
products. Technology enables concrete with reduced clinker
content (greener) and by exploiting two largely available
materials on earth (sustainable).
Cementir key innovations
Ultra-high Performance
Concrete (UHPC)
Glass Fiber Reinforced
Concrete (GFRC)
3D Concrete printing
FutureCEMTM
Ready-to-use, self-compacting RMC products for very high aesthetical,
mechanical and durability performance – wet-cast casting method – semi-structural or structural
Ready-to-use, high performance mortar
products for very high aesthetical – primary focus is surface detail and finishing –wet-cast casting or sprayed method – semi-structural
Ready-to-use, high performance RMC mortar products for 3D printing
technology – primary focus is buildability and surface
finishing – structural, semi-structural and non-structural
Aalborg Extreme® Light 120 in the market since October
2018
Product in the pipeline: in the market since December
2019
Product under development
Launched in Denmark in January 2021 and soon in
France
WH
ITE
CEM
ENT
LEA
DER
SHIP

14
Industrial Plan&
ESG Commitment
Gaurain Plant, Belgium
IND
UST
RIA
L P
LAN
&
ESG
CO
MM
ITM
ENT

15
Cementir Strategy: main priorities unchanged
✓ Strengthen white cement global leadership, focusing on high-added value solutions and special cements (FuturecemTM)
✓ Improve profitability and operating efficiency
✓ Pursue product and geographic diversification
✓ Leverage on unique vertically integrated platforms in the Nordics, Belgium and Turkey
• Strengthen white cement global leadership
• Improve local industrial and competitve footprint
• Further develop the trading business
• Seek M&A opportunities in core businesses
Growth and PositioningCompetitivenessInnovationSustainability
• Digitalization to drive efficiencies and process improvements
• Focus on operational excellence
• Lean manufacturing, logistics and maintenance the three focus areas
• Leverage high-added value solutions and special cements (FuturecemTM)
• Develop new value-added products through InWhiteSolutionsTM platform
• 107 M€ (9% of 2020 sales) green investments over the 2021-2023 Industrial Plan
• Increased use of alternative fuels and raw materials
• Push on district heating, waste heat recovery
• Full production of FuturecemTM
IND
UST
RIA
L P
LAN
&
ESG
CO
MM
ITM
ENT

16
➢ Cumulative 370M€ Free cash flow generation, thanks also to strict working capital controls
➢ Optimization of investments on plant efficiency, Repair & Maintenance, Environmental and Safety
➢ Capex/Sales ratio between 4-6%
➢ Fuels and electricity increase ahead of inflation in constant currency➢ 30 M€ contribution from green investments➢ Progressive business turnaround in Turkey➢ Free CO2 allowances until the end of 2021. Around 600,000 tons
CO2 yearly emissions, to be purchased at around €30/t, fully covered by price increases
➢ 4% CAGR in volumes of grey and white cement in all main geographical areas; prices in line with relevant markets and price increase in Turkey
➢ 12% aggregates volumes(1) CAGR in 2020-23; 6% CAGR in RMC
Sales 1,225 ~ 1,470
EBITDA 264 ~ 340
Avg. Yearly Capex
55 66
Net (Debt)/Cash -122~ 250
Net Cash
2020 2023EUR million
➢ Efficiency increase thanks to digitalization, sustainability Capex and cost controlEBITDA Margin 21.5% 23%
➢ Cumulative Green investment (Sustainability and digitalization): district heating, heat recovery, alternative fuels, FUTURECEMTM
3 years cumulative
Green Capex2.5 107
Financial targets to 2023
(1) Aggregate volumes include the new aggregate business in Turkey worth ~ 3.6 Mt per annum
IND
UST
RIA
L P
LAN
&
ESG
CO
MM
ITM
ENT

17
Growth drivers of EBITDA vs. 2020
✓ Strong contribution expected from Turkey where trading outlook is brightening
✓ Positive trend in volumes, prices and cost containment underpin 8.8% EBITDA CAGR
✓ € 30m contribution from sustainability and digitalization from 2023
IND
UST
RIA
L P
LAN
&
ESG
CO
MM
ITM
ENT

18
Target validated in July2021
Score 73/100May 2021
Overall rank 22/512; in Materials 1/8
BBB RatingConfirmed in December 2020
VIGEO: Score 43/100Upgraded from 38/100 in 2021
Rank in Sector 7/25
B Rating – ClimateChange
Upgraded from F in March 2021
Sustainability achievements and ratings
B Rating- Score 61/100 Sept. 2021
Rank in Construction Materials18/77
Score 54/100Average industrial sector
51/100
IND
UST
RIA
L P
LAN
&
ESG
CO
MM
ITM
ENT

19
Target of 30% CO2 reduction by 2030 with current technologies
2020 2022 2025 2030
Focus Areas
• Product offering enhancement through FUTURECEM™ technology in both white and grey cement
• Leverage on cementitious materials such as GBFS, fly ash and limestone
• Low clinker cements
Low carbon cements
• Heat Recovery implementation • Increase alternative fuels over 70% (grey cement)• Utilization of natural gas in some countries (Egypt, US)• Specific heat consumption reduction • Renewable energy (scope 2)
Process Efficiency + Alternative materials
• FUTURECEM™ production• Kiln upgrade in Belgium• Windmills in Denmark• Calcination plant• District Heating in Aalborg • Natural gas/biogas usage in Aalborg, Denmark• Green Transportation (Hybrid trucks in Denmark)
Sustainability Capex
-6% grey-26% white
-20% grey-30% white -31% grey
-35% white
CO2 emission reduction path (*)
(*) Reduction target per ton of cement vs. 1990 baseline
Grey cement White cement
2020 2030 2020 2030
Use of alternative fuels in % 28% 77% 3% 6%
Clinker ratio 82% 68% 82% 80%
CO2 emission (kg CO2/ton cement) 718 <500 915 808
• In July 2021 Science Based Targets Initiative validated CO2
emissions reduction targets
• Group roadmap and investments are defined to reach a CO2
reduction target for grey cement below 500kg/t
• Taxonomy Regulation does not apply to white cement
IND
UST
RIA
L P
LAN
&
ESG
CO
MM
ITM
ENT

20
• 107 M€ «green» investments to yield ~30 M€ of annual cost savings from 2023
• Improve profitability and operational efficiencyvia product innovation, digitalisation of industrial processes
• Main initiatives:
― Kiln upgrade in Gaurain, Belgium
― District Heating in Aalborg, Denmark
― FUTURECEM™ for calcining and grinding plant
― Windmills in Denmark (8.4 MW installed capacity)
― Natural gas line in Aalborg, Denmark
Capex: 2021-23 highlights
Industrial Plan cumulative CapexGreen Capex = Sustainability + Digitalization
IND
UST
RIA
L P
LAN
&
ESG
CO
MM
ITM
ENT

21
FutureCemTM is a key pillar of our sustainability strategy
• Calcined clay is a major raw material for FuturecemTM production
• First Step: investment in storage silo, receiving station, grinding facility
• Second step: construction of calcining plant
• Objective: support FuturecemTM to achieve 30% CO2 emission reduction vs. ordinary Portland cement
• Proprietary technology patented worldwide enabling 40% clinker replacement
• Lower clinker content allows a 30% CO2 reduction
• Allows to produce a greener and more sustainable concrete without compromising on resistance / strength
Ordinary Portland Cement
ReductionClinker: -40%
CO2: -30%
IND
UST
RIA
L P
LAN
&
ESG
CO
MM
ITM
ENT

22
FuturecemTM roll-out plan
• Commercialization started in January 2021 in Denmark as special product
• By 2030 FuturecemTM volumes sold are expected to reach around 51% of total volumes sold in Europe and 60% of grey cement volumes
FuturecemTM roll-out plan - volumes sold in ETS countries
IND
UST
RIA
L P
LAN
&
ESG
CO
MM
ITM
ENT

23
New breakthrough technologies: Carbon, capture, usage and storage
• Project period: April 2021 - March 2025
• Over 13 M€ of European funds
• Industrial and academic partners from The Netherlands, Denmark, United Kingdom, Romania, Greece, China and Canada
• Objective is to investigate the potential of the CCUS technology to reduce CO2 industrial emissions
• The pilot project is designed to collect 100 kg of CO2 per hour with a mobile demonstration plant at Aalborg, DK
• Method based on electrochemical gas separation at low temperatures by using an alkaline liquid as binder. The liquid can be reused to capture more carbon
• Captured carbon will be converted into high added-value products (formate, formic acid) with enhanced marketability
Through Aalborg Portland, Cementir participates in several CCUS projects, among which:
• ConsenCUS – CarbOn Neutral cluSters through Electricity-based innovations in Capture, Utilisationand Storage
• Project Greensand: to test carbon capture and storage in 2022
PROJECT GREENSAND
• Aalborg Portland is part of the consortium Project Greensand 2
• Pilot project to test carbon capture and storage in drained oil fields in the Danish North Sea in 2022
• It will be the first carbon capture and storage project in Europe to demonstrate a full value chain from cement production to storage
• Among partners: Ineos Oil & Gas Denmark, Wintershall Dea, Maersk Drilling, GEUS and more than 20 businesses, research institutes and universities, including Aalborg Portland.
IND
UST
RIA
L P
LAN
&
ESG
CO
MM
ITM
ENT

24
2021 First Half results
Youth Olympic Games Center, Nanjing (China)
20
21
FIR
ST H
ALF
R
ESU
LTS

25
• Revenues reached 664.5 M€ (+16.5%) thanks to good performance in all geographies
− Cement volumes up by 18.7% driven by Turkey, Belgium and Denmark
• EBITDA reached 133.5 M€ (+36.6%)
− Higher contribution from Turkey, Belgium, and to a lesser extent, Asia Pacific and Egypt
− EBITDA Margin up to 20.1% from 17.1% in H1 2020
− 2020 figures impacted by Covid19 and 5.6 M€ one-offs
• EBIT reached 79.0 M€ (+83%) from 43.2 M€ in H1 2020
• Group net profit reached 47.9 M€ (20.0 M€ in H1 2020) after 9.7 M€ of financial charges and 16.9 M€ of taxes
• Net Financial Debt reached 137.6 M€, a reduction of 142.9 M€ year on year, including 23.0 M€ of share buyback
• Cementir achieved an investment grade rating BBB- from S&P during 2021
2021 First Half results highlights
20
21
FIR
ST H
ALF
R
ESU
LTS

26
Revenue 305,562 271,698 12.5%
Denmark 204,546 187,610 9.0%
Norway / Sweden 95,746 83,795 14.3%
Others (**) 32,945 27,683 19.0%
Eliminations (27,675) (27,390)
EBITDA 69,221 67,255 2.9%
Denmark 57,689 59,172 (2.5%)
Norway / Sweden 9,312 7,054 32.0%
Others (**) 2,220 1,029 115.7%
EBITDA Margin % 22.7% 24.8%
H1 2021 H1 2020 Chg %EUR '000
• Denmark
− Both grey and white cement volumes up due to increased market activity
− White cement exports up 22% due to higher deliveries to the US, UK, Germany, Poland, Belgium and France; grey cement exports declined by 11% due lower sales in Norway
− RMC volumes up 11% and aggregates up 30%
− EBITDA declined by 2.5%, due to cost inflation on raw materials, electricity and other operating costs
• Norway
− RMC sales volumes up by 3%; from March significant recovery with the kick off of some projects. Public and private sectors activities remain uncertain, more favourable trend in the South of the country
− Norwegian Krone appreciated 5.5% vs. Euro
• Sweden
− Favourable weather and robust construction market, RMC and aggregates sales volumes up 19% and 9% respectively
− Swedish Krone appreciated 3.5% vs. Euro
Nordic & Baltic
(*) Revenue from Sales and Services(**) «Others» Includes: Iceland, Poland, Russia, white cement sales from Denmark to Belgium and France
Share of Group Revenue
H1 2021
Share of Group Ebitda
H1 2021
41%52%
(*)
20
21
FIR
ST H
ALF
R
ESU
LTS

27
• Belgium
• France
− Cement volumes increased by 10%, thanks to favourable weather and comparison base with 2020 impacted by Covid19. Positive trend in Belgium and France while The Netherlands and Germany were weak
− RMC: 30% volumes growth thanks to some important projects getting under way and a new plant in France
− Aggregates: volumes up 10% YoY, with stronger domestic and export to France
− EBITDA increased by 25.2% to 29.1 M€ due to some maintenance costs being postponed and weak March comparable figures due to Covid-19 impact. Negative impact from higher raw materials costs
Belgium and France (*)
19% 22%
(*) Includes Compagnie des Ciments Belges S.A. results only
Share of Group Revenue
H1 2021
Share of Group Ebitda
H1 2021
Revenue 139,902 120,163 16.4%
EBITDA 29,097 23,237 25.2%
EBITDA Margin % 20.8% 19.3%
H1 2021 H1 2020 Chg %EUR '000
20
21
FIR
ST H
ALF
R
ESU
LTS

28
• United States
− Sustained volume growth (+13%) of white cement especially in Florida and York region (PA) also due to a base effect and favorable weather despite a hurricane in Texas and snowfall in York
− 1.2% increase in revenue due to higher volumes despite currency translation impact
− EBITDA up by 8% thanks to good costs control
− 10% USD devaluation vs EUR
North America
10%8%
Share of Group Revenue
H1 2021
Share of Group Ebitda
H1 2021
Revenue 76,183 75,304 1.2%
EBITDA 10,925 10,119 8.0%
EBITDA Margin % 14.3% 13.4%
H1 2021 H1 2020 Chg %EUR '000
20
21
FIR
ST H
ALF
R
ESU
LTS

29
• China
− Strong demand with white cement and clinker sales volumes up 16%, despite a rainy start of the year, supported by several projects
− EBITDA up by 22.6% driven by higher volumes despite higher variable and fixed costs
• Malaysia
− White cement sales increased by 48%, driven by exports, while local market was up 25%, thanks also to easy comparable figures; in June 2021 a new lockdown in Malaysia affected negatively domestic and export activity
− Export volumes grew by 50% with increased exports of cement and clinker to Australia, the Philippines and Bangladesh
− Export prices declined due to mix and FX impact
− EBITDA increased by 79%, despite the negative impact of increasing fuel and other fixed costs
Asia Pacific
7%8%
Share of Group Revenue
H1 2021
Share of Group Ebitda
H1 2021
Revenue 48,602 37,799 28.6%
China 28,231 23,096 22.2%
Malaysia 20,371 14,917 36.6%
Eliminations 0 (214)
EBITDA 10,860 8,159 33.1%
China 8,128 6,630 22.6%
Malaysia 2,732 1,529 78.7%
EBITDA Margin % 22.3% 21.6%
H1 2021 H1 2020EUR '000 Chg %
20
21
FIR
ST H
ALF
R
ESU
LTS

30
• Turkey (*)
− Grey cement volumes increased by around 29%, with domestic sales volumes up 40% driven by strong demand in the Marmara, Anatolian and Aegean regions
− Exports declined 8% with a more favorable sales mix
− Avg cement prices in local currency up with different local trends
− RMC volumes increased by 80% YoY, thanks to start of new infrastructure projects and opening of new plants
− 33% TRY devaluation vs. Euro
− Positive EBITDA and strong YoY improvement, also in RMC and waste businesses. 2020 EBITDA included 3.1 M€ one-off costs
Turkey
11%
(*) Includes the waste management business both in Turkey and the UK
6%
Share of Group Revenue
H1 2021
Share of Group Ebitda
H1 2021
Revenue 82,551 57,174 44.4%
EBITDA 7,361 (8,837) 183.3%
EBITDA Margin % 8.9% -15.5%
H1 2021 Chg %H1 2020EUR '000
20
21
FIR
ST H
ALF
R
ESU
LTS

31
• Egypt
− White cement domestic volumes increased by 30%
− White export volumes increased by 20% after the removal of pandemic restrictions
− EBITDA increased by 41.7% due to higher volumes and export prices and lower fuel purchasing costs, despite increased transport and raw materials costs
− EGP devalued by 8.5% vs. Euro
Egypt
3% 4%
Share of Group Revenue
H1 2021
Share of Group Ebitda
H1 2021
Revenue 23,560 19,798 19.0%
EBITDA 5,324 3,756 41.7%
EBITDA Margin % 22.6% 19.0%
EUR '000 H1 2021 H1 2020 Chg %
20
21
FIR
ST H
ALF
R
ESU
LTS

32
Raised 2021 Full Year Guidance
• Revenues ~ 1.35 BN€ (from 1.3 BN)
• EBITDA ~ 295-305 M€ (from 285-295 M€)
• Net debt ~ 30 M€ (unchanged)
• Capex ~ 95 M€
This forward-looking indication does not include new outbreaks of the Covid-19 pandemic in the coming months.The foregoing exclusively reflects the point of view of the company's management, and does not represent a guarantee, a promise, an operational suggestion or even just an investment advice.
20
21
FIR
ST H
ALF
R
ESU
LTS

33
Consolidated Income Statement - H1 2021
REVENUE FROM SALES AND SERVICES 664.5 570.4 16.5%
Change in inventories (2.7) (5.3) 48.5%
Increase for internal work and other income 8.3 7.4 13.2%
TOTAL OPERATING REVENUE 670.2 572.5 17.1%
Raw materials costs (267.4) (217.5) 22.9%
Personnel costs (95.0) (95.2) (0.2%)
Other operating costs (174.3) (162.0) 7.6%
TOTAL OPERATING COSTS (536.7) (474.7) 13.1%
EBITDA 133.5 97.8 36.6%
EBITDA Margin % 20.1% 17.1%
Amortisation, depreciation, impairment losses and provisions (54.5) (54.6) (0.2%)
EBIT 79.0 43.2 83.0%
EBIT Margin % 11.9% 7.6%
NET FINANCIAL INCOME (EXPENSE) (9.7) (11.2) (12.9%)
PROFIT BEFORE TAXES 69.3 32.0 116.6%
Income taxes (16.9) (10.1) 67.4%
PROFIT FROM CONTINUING OPERATIONS 52.4 21.9 139.3%
PROFIT FOR THE YEAR 52.4 21.9 139.3%
Non controlling interests 4.5 1.9 136.1%
GROUP NET PROFIT 47.9 20.0 139.6%
Chg %(EUR million) H1 2021 H1 2020
20
21
FIR
ST H
ALF
R
ESU
LTS

34
Appendix
Aalborg plant, Denmark
AP
PEN
DIX

35
Switch to natural gas Wind turbines
Capex: main initiatives for CO2 emissions reduction
• Agreement with the Danish gas distribution company Evida to connect our Aalborg factory to the grid from 1 April 2022
• Gas network connection is the first step towards the green transformation and will provide a flexible fuel strategy with increased use of more green fuels
• Estimated 20% CO₂ emission reduction
• Wind turbines with 8.4 Mwh of green electricity capacity will cover ~8% of the plant’s electrical energy consumption in Denmark
• Expected output of 26,000 Mwh/year which will reduce scope 2 CO₂ emission by 25,000 tons/year
Kiln upgrade - Belgium
• Kiln upgrade in Gaurain (Belgium) to increase alternative fuels use from 40% to 80%
• Main objectives: thermal efficiency, improvement, reduced maintenance costs, minimizing kiln stoppages
• Estimated CO₂ emission reduction of 88,000 tons annually
AP
PEN
DIX
36
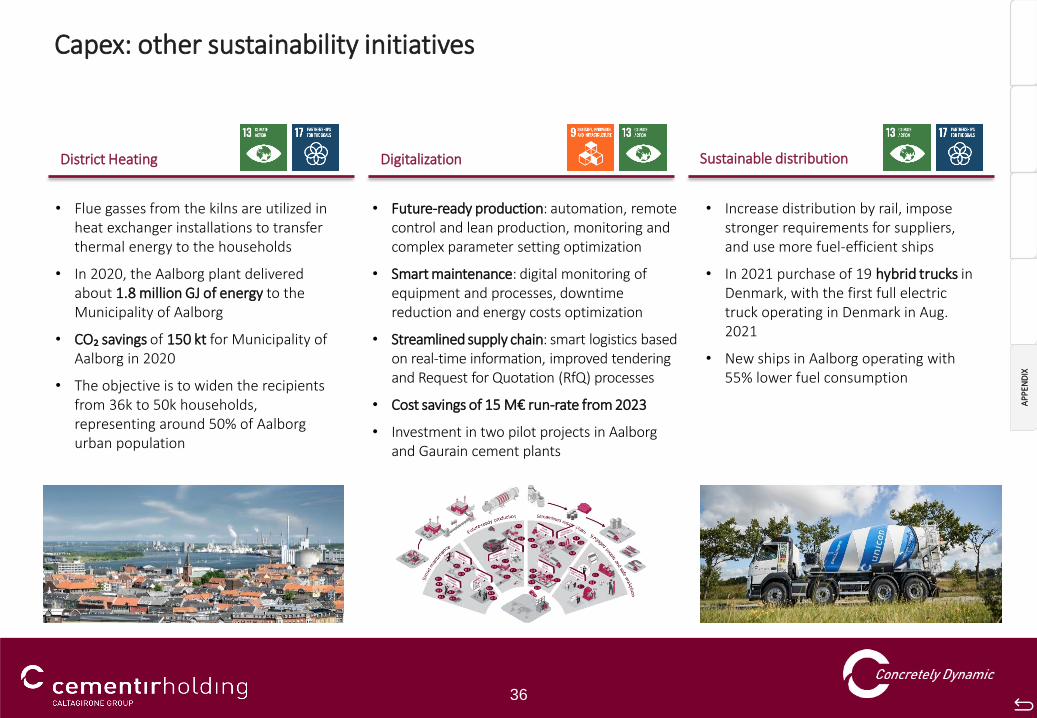
Digitalization Sustainable distribution
Capex: other sustainability initiatives
• Future-ready production: automation, remote control and lean production, monitoring and complex parameter setting optimization
• Smart maintenance: digital monitoring of equipment and processes, downtime reduction and energy costs optimization
• Streamlined supply chain: smart logistics based on real-time information, improved tendering and Request for Quotation (RfQ) processes
• Cost savings of 15 M€ run-rate from 2023
• Investment in two pilot projects in Aalborg and Gaurain cement plants
• Increase distribution by rail, impose stronger requirements for suppliers, and use more fuel-efficient ships
• In 2021 purchase of 19 hybrid trucks in Denmark, with the first full electric truck operating in Denmark in Aug. 2021
• New ships in Aalborg operating with 55% lower fuel consumption
District Heating
• Flue gasses from the kilns are utilized in heat exchanger installations to transfer thermal energy to the households
• In 2020, the Aalborg plant delivered about 1.8 million GJ of energy to the Municipality of Aalborg
• CO₂ savings of 150 kt for Municipality of Aalborg in 2020
• The objective is to widen the recipients from 36k to 50k households, representing around 50% of Aalborg urban population
AP
PEN
DIX

37
Differences between white and grey cement
White Cement Grey Cement
Market Size✓ ~ 20 million tons per year ✓ > 4 billion tons per year
✓ Niche product: high value, small volumes ✓ Commodity: basic value, large volumes
Industry Features✓ Raw materials scarcity, fewer producers, growth end-
markets, high switching costs, export-driven✓ Raw materials widespread presence, many producers,
cyclical end-markets, local demand (only 5% exported)
Growth drivers✓ Consumption driven by home renovation, restructuring
and technology. High tech product✓ Higher market growth rates in developed countries
✓ Consumption driven by infrastructure & residential-commercial. Low tech product.
✓ Demand growth in line with GDP in developed countries
End markets✓ Main clients are large dry mix players (Saint Gobain-
Weber, Mapei, etc) and pre-cast producers✓ Main clients are ready-mix companies, construction
companies and pre-cast producers
Product Features✓ High workability, high electrical conductivity, aesthetics.
Increasingly used for landmark buildings, urban fittings, eco-friendly construction projects
✓ The most widespread construction material, used mostlyfor new build and infrastructure
AP
PEN
DIX

38
White cement plant (#1)Grey cement plants (#4)
RMC plants
Waste
Turkey Egypt
Turkey and Egypt historical figures
Turkey – EBITDA evolution €M (**)Egypt – EBITDA evolution €M
Turkey - Cement capacity and consumption (Mt) (*)
(*) Source: Turkish Cement Manufacturers Association (TÇMB).(**) EBITDA excludes non-recurring income due to land revaluation.
PEAKPEAK
KARS
ELAZIG
IZMIR
EDIRNEEL ARISH
2009-2018 Avg: 34.9 €M
AP
PEN
DIX

39
M&A track record
Since 2001 over EUR 1.7 billion invested with no recourse to shareholder equity
(M€)
2001 - Cimentas AS and Cimbeton ASEntered the Turkish cement market with 2 plants
2004 - Aalborg Portland A/S and Unicon A/STransforming deal:- Product diversification (new products: white cement and
aggregates and strong position in ready-mix)- Geographical presence (new countries: Denmark, Norway, Sweden,
Egypt, Malaysia, China, US)
2005Edirne plant in TurkeyVianini Pipe Inc. in US (Concrete products)2006Elazig plant in Turkey
From being 100% domestic Cementir is today an international player operating in 18 countries
Jul. 2016 - Sacci Cement and ready-mix in Italy
Oct 2016 - Compagnie des Ciments Belges- Cement, aggregates and ready-mix in Belgium- Ready-mix in France
Jan. 2018 – Sale of all assets and activities in ItalyDisposal of cement and RMC businessesCash in of 315 M€ in January 2018
Mar. 2018 – Acquisition of 38.75% stake in Lehigh White Cement CompanyMajority stake of 63.25%. Largest player in the U.S. white cement market
254
600
152 112 125312
-31587
2001 2004 2005 2006 Jul-16 Oct-16 Jan-18 Mar-18
AP
PEN
DIX

40
•This presentation has been prepared by and is the sole responsibility of Cementir Holding N.V. (the“Company”) for the sole purpose described herein. In no case may it or any other statement (oral orotherwise) made at any time in connection herewith be interpreted as an offer or invitation to sell orpurchase any security issued by the Company or its subsidiaries, nor shall it or any part of it nor the fact ofits distribution form the basis of, or be relied on in connection with, any contract or investment decision inrelation thereto. This presentation is not for distribution in, nor does it constitute an offer of securities forsale in Canada, Australia, Japan or in any jurisdiction where such distribution or offer is unlawful. Neitherthe presentation nor any copy of it may be taken or transmitted into the United States of America, itsterritories or possessions, or distributed, directly or indirectly, in the United States of America, its territoriesor possessions or to any U.S. person as defined in Regulation S under the US Securities Act 1933 asamended.
•The content of this document has a merely informative and provisional nature and is not to be construedas providing investment advice. The statements contained herein have not been independently verified. Norepresentation or warranty, either express or implied, is made as to, and no reliance should be placed on,the fairness, accuracy, completeness, correctness or reliability of the information contained herein. Neitherthe Company nor any of its representatives shall accept any liability whatsoever (whether in negligence orotherwise) arising in any way in relation to such information or in relation to any loss arising from its use orotherwise arising in connection with this presentation. The Company is under no obligation to update orkeep current the information contained in this presentation and any opinions expressed herein are subjectto change without notice. This document is strictly confidential to the recipient and may not be reproducedor redistributed, in whole or in part, or otherwise disseminated, directly or indirectly, to any other person.
•The information contained herein and other material discussed at the presentation may include forward-looking statements that are not historical facts, including statements about the Company’s beliefs andcurrent expectations. These statements are based on current plans, estimates and projections, and projectsthat the Company currently believes are reasonable but could prove to be wrong. However, forward-looking statements involve inherent risks and uncertainties. We caution you that a number of factors couldcause the Company’s actual results to differ materially from those contained or implied in any forward-looking statement. Such factors include but are not limited to: trends in company’s business, its ability toimplement cost-cutting plans, changes in the regulatory environment, its ability to successfully diversify andthe expected level of future capital expenditures. Therefore, you should not place undue reliance on suchforward-looking statements. Past performance of the Company cannot be relied on as a guide to futureperformance. No representation is made that any of the statements or forecasts will come to pass or thatany forecast results will be achieved.
•By attending this presentation or otherwise accessing these materials, you agree to be bound by theforegoing limitations.
Investor Relations:
Phone +39 06 32493305
Email [email protected]
Web Address:
www.cementirholding.com
2021 Financial Calendar:
9 March Full year 2020 Results
21 April AGM
13 May First Quarter Results
28 July First Half Results
11 November Nine Months Results
Disclaimer and Other information
Stock listing information:
Milan Stock Exchange
Ticker: CEMI.IM (Reuters)
Ticker: CEM.IM (Bloomberg)
Registered Office:
Zuidplein 361077 XV – Amsterdam, The Netherlands