visayan sea 01...visayan sea (from different studies of the commercial fisheries sector in the area)...
TRANSCRIPT

ASSESSMENT OF THE COMMERCIAL FISHERIES OF
WESTERN AND CENTRAL VISAYAN SEA
MAY R. GUANCO SHERYLL V. MESA
National Stock Assessment Project Bureau of Fisheries and Aquatic Resources
Regional Field Office 6 Iloilo City
PRUDENCIO B. BELGA DINO RAPHAEL M. NUÑAL
National Stock Assessment Project Bureau of Fisheries and Aquatic Resources
Regional Field Office 7 Cebu City

Assessment of the Commercial Fisheries of Western and Central Visayan Sea
1
ASSESSMENT OF THE COMMERCIAL FISHERIES OF
WESTERN AND CENTRAL VISAYAN SEA
MAY R. GUANCO SHERYLL V. MESA
National Stock Assessment Project Bureau of Fisheries and Aquatic Resources
Regional Field Office 6 Iloilo City
PRUDENCIO B. BELGA DINO RAPHAEL M. NUÑAL
National Stock Assessment Project Bureau of Fisheries and Aquatic Resources
Regional Field Office 7 Cebu City

Assessment of the Commercial Fisheries of Western and Central Visayan Sea
2
CONTENTS List of Tables 3 List of Figures 4 List of Abbreviations, Acronyms and Symbols 6 ACKNOWLEDGMENTS 8 ABSTRACT 9 INTRODUCTION 9 The Study Site 11 Review of Literature 11 Objectives 11 Limitations of the Study 12 MATERIALS AND METHODS 11 Landing Centers/Sampling Sites 11 Data Collection 13 Data Processing and Analysis 13 Fishing Boat Inventory 13 Production Estimates 13 Catch Per Unit Effort 14 Dominant Species 15 Relative Abundance/Seasonality of Selected Major Fish Species 15 Length Frequency 15 RESULTS AND DISCUSSION 19 Fishing Boat Inventory 19 Production Estimates and Catch Per Unit Effort 19 Dominant Species 24 Seasonality and Relative Abundance 28 Biological Parameter Estimates 31 Growth 31 Mortality 36 Recruitment Pattern 37 Probability of Capture 38 Virtual Population Analysis 38 Relative Yield and Biomass Per Recruit 39 SUMMARY 40 RECOMMENDATIONS 41 REFERENCES 42

Assessment of the Commercial Fisheries of Western and Central Visayan Sea
3
TABLES
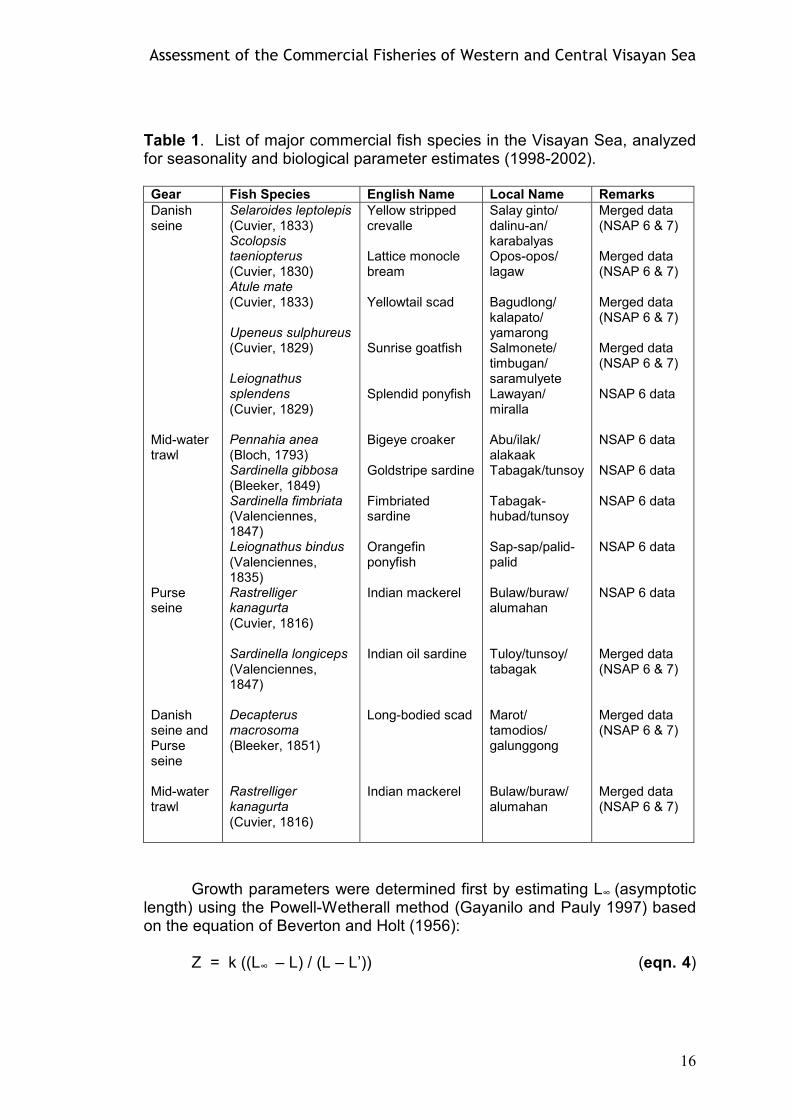
Table 1 List of major commercial fish species in the Visayan Sea, analyzed for seasonality and biological parameter estimates (1998-2002) 16
Table 2 Comparative values of mean catch rates (kg/hr) of trawl in the
Visayan Sea (from different studies of the commercial fisheries sector in the area) 24
Table 3 Fifteen dominant fish species by gear: (a) Danish seine, (b)
purse seine (c) otter trawl, (d) mid-water trawl, and (e) ring net, identified for the commercial fisheries of Visayan Sea (1998-2002) 27
Table 4 Growth parameter estimates for the carangid fish group in the
Visayan Sea (1998-2002) 32 Table 5 Growth parameter estimates for the sardine fish group in the
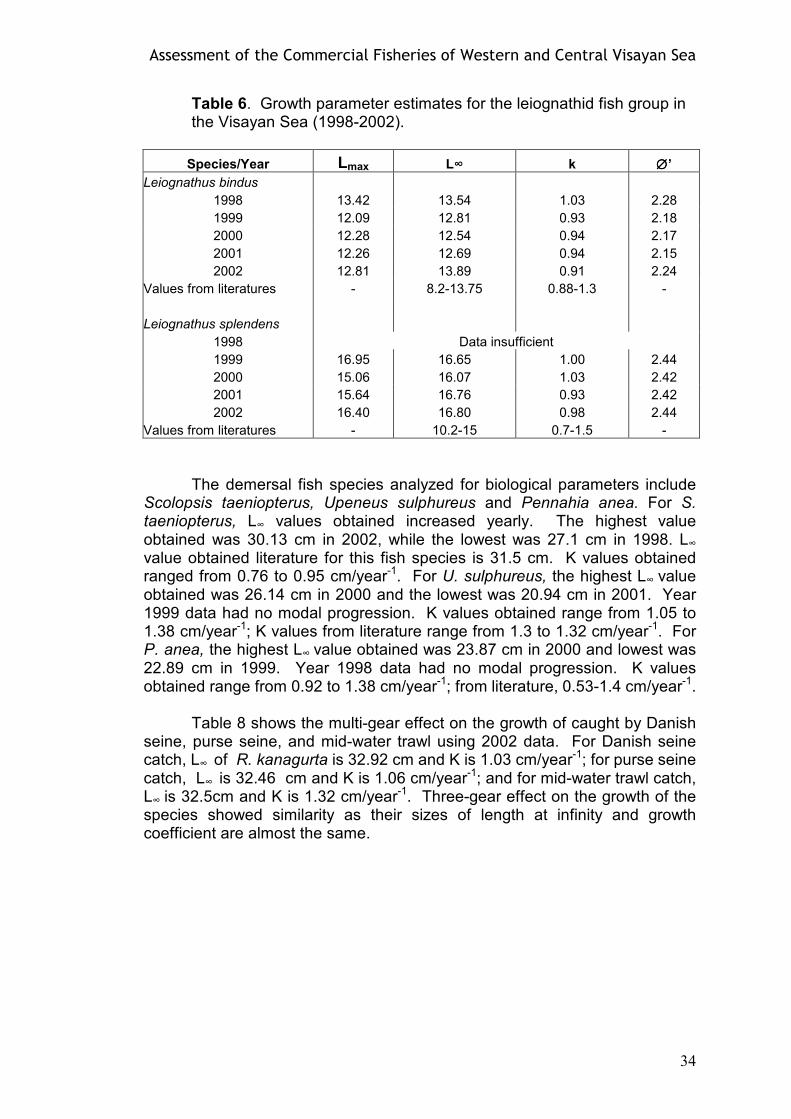
Visayan Sea (1998-2002) 33 Table 6 Growth parameter estimates for the leiognathid fish group in the
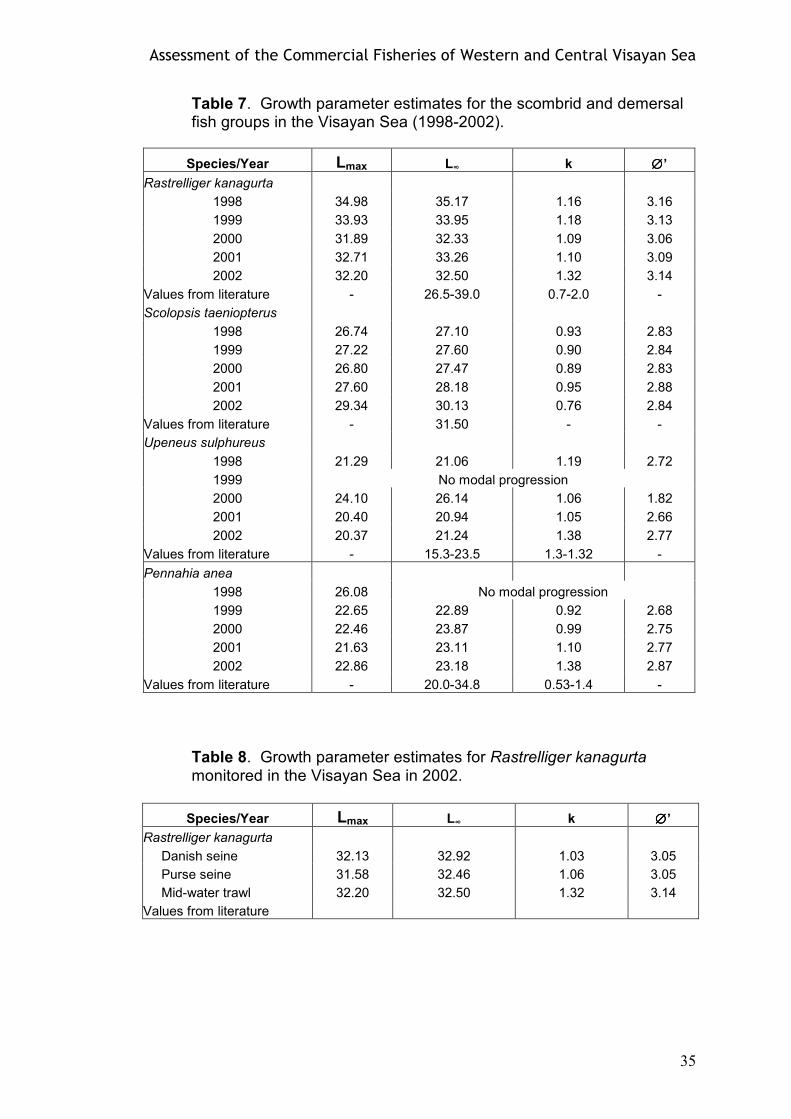
Visayan Sea (1998-2002) 34 Table 7 Growth parameter estimates for the scombrid and demersal fish
groups in the Visayan Sea (1998-2002) 35 Table 8 Growth parameter estimates for Rastrelliger kanagurta
monitored in the Visayan Sea in 2002 35 Table 9 Annual recruitment pulses of major commercial fish species in
the Visayan Sea (1998-2002) 37 Table 10 Comparative values of length at first maturity (L50) and length at
first captivity (L25) of major commercial fish species in the Visayan Sea (1998-2002) 38
Table 11 Length at full recruitment and respective fishing mortality (F)
values of major commercial fish species in the VisayanSea (1998- 2002) 39
Table 12 Exploitation rate for relative yield per recruit and biomass per
recruit of major fish species in the Visayan Sea (1998-2002) 40

Assessment of the Commercial Fisheries of Western and Central Visayan Sea
4
FIGURES
Figure 1 Visayan Sea map showing the fish landing areas
monitored by the National Stock Assessment Project implemented in Regions 6 and 7 12
Figure 2 Extent of fishing operation of commercial fishing gear in the Visayan Sea, 1998-2002 (based on the monitoring data of the National Stock Assessment Project) 14
Figure 3 Annual trend in the number of commercial fishing boats per fishing gear operating in the Visayan Sea (1998-2002) 19
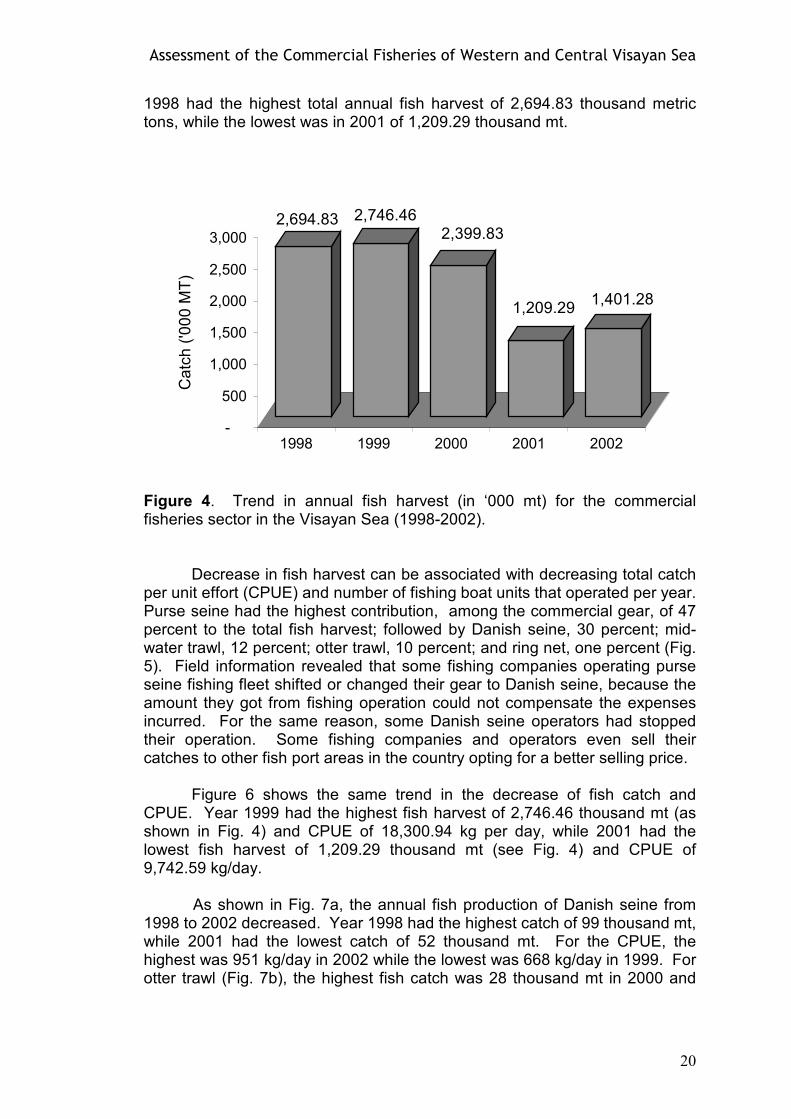
Figure 4 Trend in annual fish harvest (in ‘000 mt) for the commercial
fisheries sector in the Visayan Sea (1998-2002) 20 Figure 5 Percentage contribution of the major commercial fishing
gear operating in the Visayan Sea (1998-2002) 21
Figure 6 Annual fish harvest and CPUE trend of the commercial fisheries sector of Visayan Sea (1998-2002) 21
Figure 7 Annual fish catch and CPUE (kg/day) of (a) Danish seine and (b) otter trawl operating in the Visayan Sea (1998-2002) 22
Figure 8 Annual fish catch and CPUE (kg/day) of (a) mid-water
trawl, (b) ring net and (c) purse seine operating in the Visayan Sea (1998-2002) 22
Figure 9 Schematic diagram on the number of fish families, genera and
species identified from five commercialfishing gear operating in the Visayan Sea (1998-2002) 25
Figure 10 Ranking of the 15 dominant fish species identified for the
commercial fisheries of Visayan Sea (1998-2002) 26 Figure 11 Trend of seasonality of major commercial fish species:
Selaroides leptolepis, (b) Atule mate, (c) Decapterus macrosoma, (d) Scolopsis taeniopterus, (e) Upeneus sulphureus, (f) Pennahia anea, (g) Sardinella gibbosa and (h) S. fimbriata, in the Visayan Sea (based on monthly catch from 1998 to 2002) 29
Figure 12 Trend of seasonality of major commercial fish species: (a)
Sardinella longiceps, (b) Leiognathus bindus, (c) L. splendens and (d) Rastrelliger kanagurta, in the Visayan Sea (based on monthly catch from 1998 to 2002) 30

Assessment of the Commercial Fisheries of Western and Central Visayan Sea
5
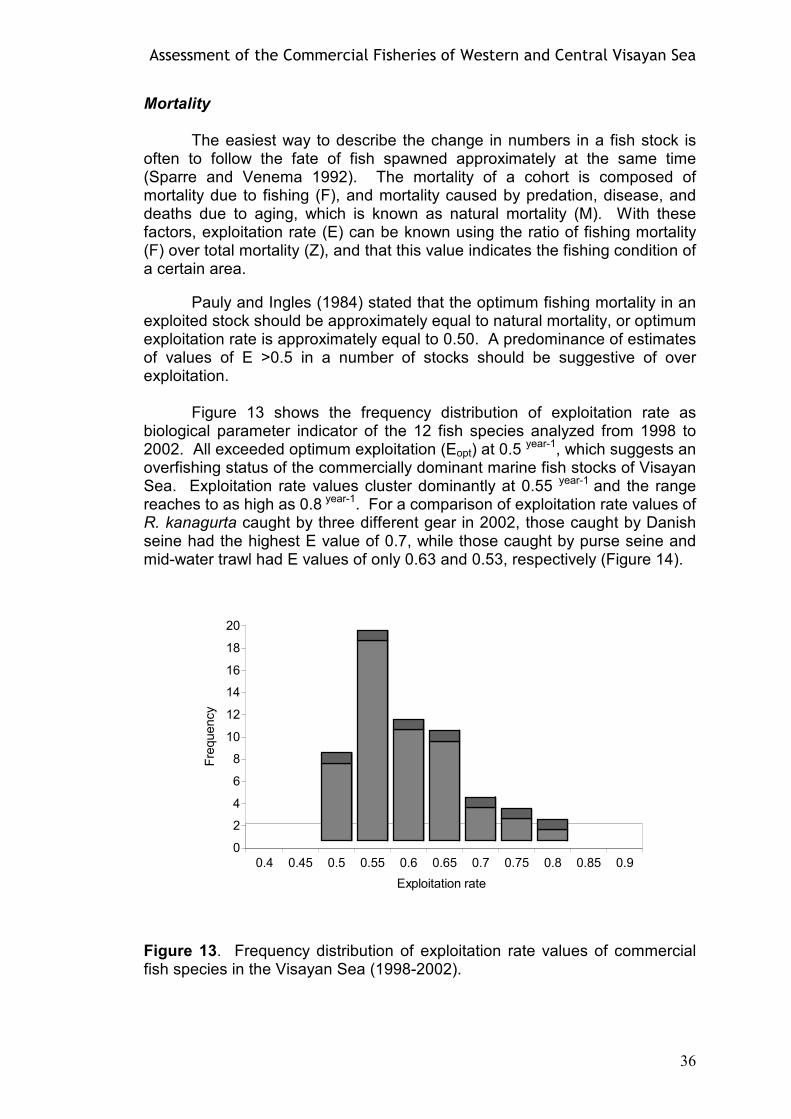
Figure 13 Frequency distribution of exploitation rate values of commercial
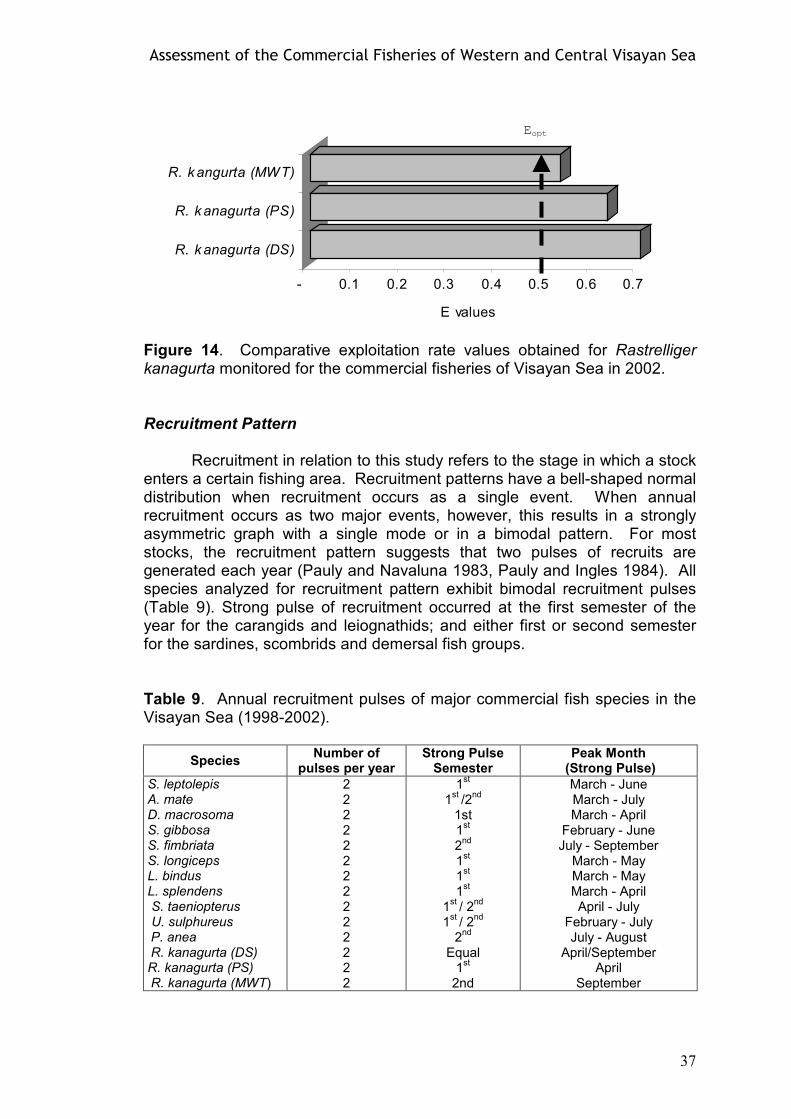
fish species in the Visayan Sea (1998-2002) 36 Figure 14 Comparative exploitation rate values obtained for Rastrelliger
kanagurta monitored for the commercial fisheries of Visayan Sea in 2002 37

Assessment of the Commercial Fisheries of Western and Central Visayan Sea
6
ABBREVIATIONS, ACRONYMS AND SYMBOLS
ABEE - a software program AFRD - Aquatic and Fisheries Resource Database BFAR - Bureau of Fisheries and Aquatic Resources B/R - biomass per recruit Ci - 4catch from a population during a unit time period (i) cm - centimeter CPUE - cath per unit effort CRMP - Coastal Resource Management Project CY - current year DA - Department of Agriculture Dept. - department DS - Danish seine e - Naperian logarithm E - exploitation rate/east eds. - editors ELEFAN - Electronic Length Frequency Analysis Eopt - optimum exploitation
eqn - equation e Zi – 1 - fraction of total deaths F - fishing mortality, instantaneous fishing mortality FAO - Food and Agriculture Organization of the United Nations Fig. - figure FISAT - FAO-ICLARM Stock Assessment Tools Fish. - fisheries Fi/Zi - fraction of death caused by fishing GIS - Geographic Information System Gov’t. - government GTZ - German Technical Corporation hr - hour ICLARM - International Center for Living Aquatic Resources
Management Invest. - investment J. - journal k - growth coefficient , growth rate kg - kilogram km2 - square kilometer L - mean length
lb - pound LGU - local government unit Lmax - maximum length Log - logarithm Lt - length of fish at age t L’ - initial length of sample L∞ - asymptotic length, length infinity L25 - length at first captivity

Assessment of the Commercial Fisheries of Western and Central Visayan Sea
7
L50 - length at 50 percent probability of capture, length at first maturity
m - meter M - natural mortality, instantaneous natural mortality MSY - maximum sustainable yield mt - metric ton MWT - mid-water trawl N - north Nai - numbers of available catch Ni - numbers of observed catch, population size at the
beginning of the time period NSAP - National Stock Assessment Program p - page/s Philipp. - Philippines Pi - points for probabilities of capture PS - purse seine RA - Republic Act Res. - research Rf - raising factor Ser. - series T - annual mean habitat temperature Tc - age at first catch Tech. - technical to - hypothetical age the fish would attain at length zero Tr - age at first recruit U.S. - United States VBGF - von Bertalanffy growth function VisSea - Visayan Sea Coastal Resources and Fisheries
Management Project VPA - virtual population analysis W∞ - weight at infinity yr - year Y’/R - relative yield per recruit Z - total mortality, instantaneous total mortality
∆t - change of time o - degree oC - degree Celsius Ø’ - growth performance index % - percent > - greater than
Assessment of the Commercial Fisheries of Western and Central Visayan Sea
8
ACKNOWLEDGMENTS
The authors would like to express their profound gratitude to the
following: The personnel and staff of the Bureau of Fisheries and Aquatic
Resources (BFAR), Central Office, especially the Bureau Director, Atty. Malcolm I. Sarmiento; National Fisheries Research Development Institute, Central Office, Program Director, Mr. Noel Barut; BFAR Regional Field Unit (RFU) 6 Director Drusila Esther E. Bayate, and Assistant Regional Director Juliet B. Demo-os; and BFAR RFU 7 Director Andres Bojos, for the administrative and financial support;
Dr. Rudolf Hermes of the German Technical Cooperation (GTZ);
Professor Nygiel B. Armada and Mr. Geronimo Silvestre of the FISH Project, for editing the results of this study;
The late Homerto Riomalos, co-project leader of NSAP 6; Ms. Grace
Lopez, co-project leader of NSAP 7; all project data encoders; field enumerators; and all fishermen, fishing boat crew and captains of the various landing centers monitored by the project, for their support and continuous cooperation in this endeavor.
Assessment of the Commercial Fisheries of Western and Central Visayan Sea
9
ABSTRACT
The Visayan Sea commercial fisheries for the years 1998 to 2002 showed an annual decrease of 24 percent for fish harvest and 11 percent for catch per unit effort (CPUE). In 1998, the total catch was 2,694.83 thousand metric tons and the CPUE was 17,014.11 kg/day. Compared to year 2002, the fish catch was only 1,401.28 thousand mt, while the CPUE was 12,842.54 kg/day. Squid, as an indicator of overfishing, ranked fifth among the species caught by otter trawl, and 15th by Danish seine. Out of the 282 identified fish species, 15 dominant species comprised 67 percent of the total fish harvest.
Growth overfishing and recruitment overfishing were observed on the major fish species analyzed. Biological parameter estimates showed that terminal exploitation exceeded Eopt of 0.5 for mortalities and E.1 for the relative yield per recruit. Length at first captivity was smaller than length at first maturity.
INTRODUCTION
In the Philippines, as well as globally, the fisheries system is facing collapses. Among 54 top fish-producing countries, the Philippines ranked 12th in 1998 with fish production of more than 200 thousand metric tons. This contributed to 1.8 million mt of fish or 2.1 percent to the total world catch of 86.3 million mt (FAO 1998). Total marine landings showed accelerated growth during the periods 1962-1975 and 1985-1991, but leveled off to around 1.65 million mt in the early 1990s. This was brought about by the decline in municipal fisheries landings being compensated by the commercial fisheries sector, which may be indicative of increasing resource depletion and competition in nearshore fishing grounds (Barut et al. 2004). Visayan Sea is one of the country’s major fishing grounds with abundance of pelagic and demersal fisheries resources. It contributes a significant volume of fish catch, generating income and employment to a considerable number of fisherfolk whose main source of livelihood is fishing. In 1995, Visayan Sea ranked third in the commercial fisheries sector with 13.46 percent contribution (equivalent to 120 thousand mt) to the country’s total fish harvest, and first in the municipal sector with a share of 11.28 percent (89 thousand mt) (BFAR 2000).
Reports in 1998 indicating widespread coastal degradation and intense
conflict over the resources of Visayan Sea were confirmed by results of stock assessment studies of Armada in 1999 on small pelagic fish species. Although local initiatives had been implemented, still the problems on resource depletion were not addressed. Solutions to the issues can be
Assessment of the Commercial Fisheries of Western and Central Visayan Sea
10
reached thru collaborative efforts among the government units concerned (Hermes et al. 2004). Republic Act 8550 (the Philippine Fisheries Code of 1998) and RA 7160 (the Local Government Code of 1997) entrust the jurisdiction of municipal waters to the local government units (LGUs). The Study Site
Visayan Sea, a vast fishing resource, is surrounded by three regions (Regions 5, 6 and 7) covering four provinces (Cebu, Iloilo, Masbate and Negros Occidental) and is shared by 22 municipalities. Geographically located at latitudes 11o to 12oN and longitudes 123o to 124oE, it covers an approximate area of 10,000 km2. It is bounded by Masbate Island on the north, Cebu Island on the southeast, Negros Island on the south and Panay Island on the west. The southwest sector has a depth range of 20-40 m, while the northeast sector is relatively deeper with a range of 41-180 m.
The bottom topography of Visayan Sea is generally level, with gently rolling seabed with minimum ascents and descents. Certain areas are studded with coral reefs and rocky shoals which are most dense at 0.5 m and 6 m depths (Aprieto 1976). Coral reef shoals and other obstructions are concentrated west of Bantayan Island and proliferate toward the northern tip of Negros Island into the entrance of Guimaras Strait. Numerous islets are also found on the northeastern coast of Panay Island. Review of Literature
A lot of studies – from major trawl explorations to species-specific
studies, and to resource assessment studies – have been published. These have laid down results and importance that have been used as basis of recent studies being conducted in the Visayan Sea. Exploratory studies include those conducted by Warfel and Manacop (1950) on otter trawl explorations in the Philippine waters; Rasalan (1957) on marine fisheries of Central Visayas; Aprieto and Villoso (1979) on catch composition and relative abundance of trawl-caught fishes in the Visayan Sea; and the Visayan Sea cruise in 2003 (unpublished) on plankton research and trawl survey conducted by the University of the Philippines in the Visayas- Miagao Campus, and sponsored by the Visayan Sea Coastal Resources and Fisheries Management Project (VisSea) of the Bureau of Fisheries and Aquatic Resources Regional Field Office VI (BFAR 6) and the German Technical Corporation (GTZ). Species- specific studies include those conducted by Arce (1986) on the distribution and relative abundance of nemipterids and carangids caught by trawl in the Visayan Sea; and Ordonez (1985) on the study of the trash fish caught by otter trawl in Visayan Sea. Resource management studies include the study of Hermes et al. (2004) on overexploitation in the Visayan Sea: designing a project solution.
Objectives This study is part of the Regional Stock Assessment Project which aims to generate reliable data vital in the formulation of policies for the proper
Assessment of the Commercial Fisheries of Western and Central Visayan Sea
11
management and conservation of the region’s coastal resources for the sustainable development of its marine fisheries.
This study specifically aims to generate the following information as basis in assessing the status of the commercial fisheries of Visayan Sea:
• types of fishing gear operating in the area;
• annual fish catch estimates;
• catch per unit of effort;
• relative abundance and species composition of the major gear;
• relative abundance and seasonality of selected major fish species; and
• population parameters such as growth, mortality, recruitment pattern, probabilities of capture, virtual population analysis, and yield and biomass per recruit of selected major fish species in the Visayan Sea.
Limitations of the Study The results presented in this study were mainly from the commercial fisheries data collected from Western Visayas (Region 6) and Central Visayas (Region 7) with established monitoring sites. Identified commercial fish ports in the areas were also used as monitoring stations. Data from the Masbate area (Region 5) were projected from the estimated total annual fish harvest using the number of commercial fishing boats operating in the area, since no monitoring site was established. Projection of the specific commercial fishing gear type count for Region 5 in 2002, as reference year for the total fishing boats inventory, was not specified because gear specific was unaccounted. Instead, fishing boat count in the area was added directly to the total fishing boat count (N) regardless of gear type to give representation.
Results presented in this study focused on the commercial fisheries sector, as the municipal fisheries data collected by the project were very minimal that they could not represent the total municipal fisheries of Visayan Sea. The data for the total fishing boats inventory for the municipal fisheries sector were partial.
Exact geographical locations of fishing areas under this study were not included since fishing boats personnel were reluctant to reveal their fishing areas. Thus, the study used the nearest surrounding island/islets as reference points to identify fishing operation areas.
MATERIALS AND METHODS Landing Centers/Sampling Sites
Figure 1 shows the major commercial fish landing sites/ports
established by the National Stock Assessment Project in Regions 6 and 7.

Assessment of the Commercial Fisheries of Western and Central Visayan Sea
12
The monitoring areas in Region 6 include the Iloilo Fishing Port Complex (Iloilo City), San Salvador Fish Landing Site (Banate), Concepcion Municipal Fishing Port (Concepcion) and Estancia Fishing Port Complex (Estancia) – all in the Province of Iloilo; Roxas City Fishing Port, Roxas City, Capiz; and Poblacion Fish Landing Site, Cadiz City, Negros Occidental.
Figure 1. Visayan Sea map showing the fish landing areas monitored by the National Stock Assessment Project implemented in Regions 6 and 7.
In Region 7, the monitoring areas include Barangay Maya Poblacion (Daanbantayan), Mahawak (Medellin), Hagnaya (San Remigio) and Tulay/Opao (Mandaue) – all in the Province of Cebu. The commercial fishing gear operating in these areas were Danish seine, otter trawl, mid-water trawl, ring net, and purse seine. Figure 2 shows the extent of fishing operation of the various commercial fishing gear in Visayan Sea.
AKLAN
NEGROS
ORRIENTAL
NEGROS
OCCIDENTAL
ILOILO
CAPIZ
ANTIQUE
Iloilo City
Banate
Concepcion
Estancia
Roxas City
Cadiz City
Daanbantayan
Medellin
San Remigio
Mandaue City
C
E
B
U
C
E
B
U

Assessment of the Commercial Fisheries of Western and Central Visayan Sea
13
Data Collection Two field enumerators collected data from each sampling site every other two days. The information gathered include total number of fishing boats that landed per sampling day, type of gear and specification, number of hauls per fishing operation, number of fishing days, total catch per fishing operation, species composition, and data on size (length) of selected major fish species. All information were recorded on the prepared data forms; these were submitted monthly for collation and processing.
Data Processing and Analysis Fishing Boat Inventory The total number of commercial fishing boats per fishing gear was taken from the CY 2002 data. The enumeration was based on the monitored boats in the sampling area, as well as fishing vessel and gear registry of the Leasing and Licensing Division of BFAR 6 and the Monitoring, Control and Surveillance Division of BFAR 7. Data on fishing boat units operating in Region 5 were based on the Aquatic and Fisheries Resource Database (AFRD) of the Visayan Sea Project of BFAR 6. For the annual inventory of fishing boats, back calculation process was done using the ratio of the CY 2002 total fishing boats count to sample count of fishing boats from 1998 to 2001, thus: __. Rf = X (N CY2002/Ni (CY 1998 to 2001) ) x Annual specific gear count (eqn. 1). Production Estimates Projection of the total fish harvest was based on the fish landed at the various commercial fish ports and fish landing sites in Regions 6 and 7. Extrapolation of the estimated total fish harvest for the entire commercial sector of Visayan Sea was considered in the annual gear count, rather than raising it to the number of commercial monitoring sites. This was done considering that all the commercial fish landing sites of Visayan Sea had been monitored by the project. Production estimates used standardized values by direct relationship between catch per unit effort (CPUE), actual fishing days, and boat units, thus: Production Estimate = Annual CPUE x Actual fishing days x Number of fishing boat units (eqn. 2).

Assessment of the Commercial Fisheries of Western and Central Visayan Sea
14
Legend:
____ Mid-water trawl ____ Purse seine ____ Danish seine _____ Otter trawl ____ Ring
net
Figure 2. Extent of fishing operation of commercial fishing gear in the Visayan Sea, 1998-2002 (based on the monitoring data of the National Stock Assessment Project). Catch Per Unit Effort
Monthly catch per unit effort (CPUE) per gear was computed and
standardized as kilograms per day (kg/day). The annual mean CPUE was obtained by the summation of the monthly fish harvest versus the summation of the number of fishing days per month and per year. The total number of
Assessment of the Commercial Fisheries of Western and Central Visayan Sea
15
fishing days was obtained by averaging the number of fishing days operation per year, taking into account the days without any fishing activity (e.g., days with weather disturbances, number of fishing rest days, and special holidays). Dominant Species Fish species of each major commercial gear were ranked from highest to lowest, based on their contribution to total gear fish harvest, that is, summing up the total catch of each fish species by gear from 1998 to 2002. Ranking the percentage contribution of each fish species to total gear catch was done to determine the 15 major fish species. Ranking was also done, using combined gear types and years, to determine the 15 major commercial fish species; the results were compared with those in the literature. Relative Abundance/Seasonality of Selected Major Fish Species The factor used in the determination of seasonality distribution is the monthly catch (in mt) of the major fish species. Table 1 shows the list of fish species analyzed for seasonality distribution using the 2002 monthly catch data. Length Frequency Data processed for biological parameters were taken from the same major species used in determining seasonality changes. Thirteen sets of length-frequency data on the species listed in Table 1 were processed. Five-year length frequency data sets were processed yearly from 1998 to 2002, except for Rastrelliger kanagurta with 2002 data sets that were used to compare results from catches of three gear types. Data presented were averaged to come up with a one-year data set. Actual length-frequency data were raised in each sampling day using the equation:
Rf = Total weight of species measured (eqn. 3). Total weight landed (of sampled species)
The resulting Rf values were then multiplied with the actual length
frequency in each class mid-length per sampling day and accumulated monthly to get the resulting raised frequency. The same data were then entered and processed utilizing the FAO-ICLARM Stock Assessment Tools (FISAT) to determine growth, mortality, exploitation rate, recruitment pattern, probabilities of capture, virtual population analysis, relative yield per and biomass per recruit of each species analyzed. The same sets of data were converted to percent frequency, and were used as data entry for the ABEE software program. This software program allows us to determine the intercept (a) and slope (b) values used as factors for the virtual population analysis.
Assessment of the Commercial Fisheries of Western and Central Visayan Sea
16
Table 1. List of major commercial fish species in the Visayan Sea, analyzed for seasonality and biological parameter estimates (1998-2002). Gear Fish Species English Name Local Name Remarks Danish seine Mid-water trawl Purse seine Danish seine and Purse seine Mid-water trawl
Selaroides leptolepis (Cuvier, 1833) Scolopsis taeniopterus (Cuvier, 1830) Atule mate (Cuvier, 1833) Upeneus sulphureus (Cuvier, 1829) Leiognathus splendens (Cuvier, 1829) Pennahia anea (Bloch, 1793) Sardinella gibbosa (Bleeker, 1849) Sardinella fimbriata (Valenciennes, 1847) Leiognathus bindus (Valenciennes, 1835) Rastrelliger kanagurta (Cuvier, 1816) Sardinella longiceps (Valenciennes, 1847) Decapterus macrosoma (Bleeker, 1851) Rastrelliger kanagurta (Cuvier, 1816)
Yellow stripped crevalle Lattice monocle bream Yellowtail scad Sunrise goatfish Splendid ponyfish Bigeye croaker Goldstripe sardine Fimbriated sardine Orangefin ponyfish Indian mackerel Indian oil sardine Long-bodied scad Indian mackerel
Salay ginto/ dalinu-an/ karabalyas Opos-opos/ lagaw Bagudlong/ kalapato/ yamarong Salmonete/ timbugan/ saramulyete Lawayan/ miralla Abu/ilak/ alakaak Tabagak/tunsoy Tabagak-hubad/tunsoy Sap-sap/palid-palid Bulaw/buraw/ alumahan Tuloy/tunsoy/ tabagak Marot/ tamodios/ galunggong Bulaw/buraw/ alumahan
Merged data (NSAP 6 & 7) Merged data (NSAP 6 & 7) Merged data (NSAP 6 & 7) Merged data (NSAP 6 & 7) NSAP 6 data NSAP 6 data NSAP 6 data NSAP 6 data NSAP 6 data NSAP 6 data Merged data (NSAP 6 & 7) Merged data (NSAP 6 & 7) Merged data (NSAP 6 & 7)
Growth parameters were determined first by estimating L∞ (asymptotic length) using the Powell-Wetherall method (Gayanilo and Pauly 1997) based on the equation of Beverton and Holt (1956):
Z = k ((L∞ – L) / (L – L’)) (eqn. 4)
Assessment of the Commercial Fisheries of Western and Central Visayan Sea
17
where Z is the total instantaneous mortality, k is the growth coefficient, L is the mean length, L∞ is the asymptotic length, and L’ is the initial length of sample. The estimated values of L∞ were further processed in ELEFAN I (ELectronic LEngth Frequency ANalysis) for the verification of the value for Loo and k. Analysis in the estimation of growth parameters and mortality uses the von Bertalanffy (1934) growth equation:
Lt = L∞ (1 – e –k(t-to)) (eqn. 5) where Lt is the length of fish at age t, e is the Naperian logarithm, to is the hypothetical age the fish would attain at length zero. Mortalities and exploitation rate were then calculated using the equation:
Z = M + F (eqn. 6) where Z is the instantaneous total mortality, M is the instantaneous natural mortality due to predation, aging and other environmental causes, and F is the instantaneous fishing mortality caused by fishing.
Furthermore M was estimated using the empirical formula of Pauly (1984):
Log M = 0.654 Log k – 0.28 Log L∞ + 0.463 LogT (eqn. 7) where L∞ and k are the VBGF growth parameters and T is the annual mean habitat temperature (oC) of the water in which the stock in question lives. Expanding the equation for mortality would lead to the computation of exploitation rate using:
E = F/Z (eqn. 8) where E is the exploitation rate. With the equations from growth parameters and mortalities, prediction of recruitment patterns and virtual population analysis could be estimated using the routines found in FISAT programs. Recruitment patterns were obtained by backward projection onto the length axis of a set of length-frequency data. The steps involved were: a. projection onto the time axis of the frequencies after they have been
divided by ∆t, the time needed to grow through the length class, which leads to recruitment patterns with peaks much narrower than when untransformed length-frequency data were used,
b. summation for each month (irrespective of year) of the adjusted
frequencies projected onto each month,

Assessment of the Commercial Fisheries of Western and Central Visayan Sea
18
c. subtraction (from each monthly sum) of the lowest monthly sum to obtain zero value where apparent recruitment is lowest, and
d. output of monthly relative recruitment (in percent of annual recruitment).
Estimation of the probabilities of capture involves the method of extrapolating the right descending left side of a catch curve such that fish that “ought” to have been caught were added to the curve with the ratio of those “expected” numbers to those that were actually caught. This can be computed as the ratio of the numbers observed over the numbers available (Ni), using the equation:
Pi = ln (Ni/∆t)/ ln(Nai/∆t) (eqn. 9) where Pi refers to the points for probabilities of capture, Ni is the numbers of observed catch or the population size, and Nai is the numbers of available
catch, and ∆t is the change of time. Virtual Population Analysis (VPA) was used to estimate the catch, to
draw inference or a quantity that cannot be readily estimated: the population that produced the catches, which follows the equation:
Ci/Ni+1 = (Fi/Zi) x (e Zi-1) (eqn. 10) where Ci is the catch from a population during a unit time period (i), Ni is the population size at the beginning of the time period, Fi/Zi is the fraction of death caused by fishing, and e Zi – 1 is the fraction of total deaths.
The relative yield per recruit and biomass per recruit models of Beverton and Holt (1957) were used in the prediction of yield and standing biomass. Relative yield per recruit model is suitable for assessing the effect of mesh size regulations and it belongs to a length-based model as parameter. Biomass per recruit, on the other hand, expresses the annual average biomass of survivors as a function of fishing mortality, and that average biomass is related to the catch per unit of effort. These prediction models use the equations:
(Y/R)’ = E*U M/k
(1-3U/1+m + 3U2/1+2m - U
3/1+3m) (eqn. 11)
_
(B/R) = exp (-M*(Tc-Tr))
*W∞ * (1/Z – 3S/Z+k + 3S2/Z+2k – S
3/Z+3k) (eqn. 12)
where E = F/Z, U = 1- Lc/L∞, m = 1-E = k/Z, Tc is age at first catch, Tr is age

Assessment of the Commercial Fisheries of Western and Central Visayan Sea
19
M/k at first recruit, and W∞ is theweight at infinity.
RESULTS AND DISCUSSION
Fishing Boat Inventory Figure 3 shows the annual trend in the number of commercial fishing
gear (considered active gear) that were monitored operating in the Visayan Sea. Among the five commercial fishing gear, Danish seine had the most number of fishing boat units that operated, with 543 units in 1999 but with only 242 units in 2002. For mid-water trawl, 139 fishing boat units operated in 2001, while only 82 units operated in 1998. For otter trawl, 274 units operated in year 2000 and 112 units in 2002. For purse seine, 88 units operated in year 2002 and only 62 units in 2001. The ring net had the least number of fishing boat units that operated – 28 units in 2002 and only 21 units in 1999. For the entire five-year study period, year 1999 had the most number of fishing boat units that operated, with a total of 889, mostly associated with the increase in the number of Danish seine operating in Visayan Sea.
490
543
373
285
242
82 8594
139122 121
157
274
172
11284 8267
6288
272122 2428
0
100
200
300
400
500
600
# o
f F
ish
ing B
oats
Danish Seine Mid-w ater Traw l Otter Traw l Purse Seine Ring Net
1998 1999 2000 2001 2002
Figure 3. Annual trend in the number of commercial fishing boats per fishing gear operating in the Visayan Sea (1998-2002). Production Estimates and Catch Per Unit Effort
The total annual fish harvest estimates, as shown in Figure 4, indicate a decreasing trend from 1998 to 2001, followed by an increase in 2002. Year
Assessment of the Commercial Fisheries of Western and Central Visayan Sea
20
1998 had the highest total annual fish harvest of 2,694.83 thousand metric tons, while the lowest was in 2001 of 1,209.29 thousand mt.
2,694.83 2,746.462,399.83
1,209.291,401.28
-
500
1,000
1,500
2,000
2,500
3,000
Ca
tch
('0
00
MT
)
1998 1999 2000 2001 2002
Figure 4. Trend in annual fish harvest (in ‘000 mt) for the commercial fisheries sector in the Visayan Sea (1998-2002).
Decrease in fish harvest can be associated with decreasing total catch per unit effort (CPUE) and number of fishing boat units that operated per year. Purse seine had the highest contribution, among the commercial gear, of 47 percent to the total fish harvest; followed by Danish seine, 30 percent; mid-water trawl, 12 percent; otter trawl, 10 percent; and ring net, one percent (Fig. 5). Field information revealed that some fishing companies operating purse seine fishing fleet shifted or changed their gear to Danish seine, because the amount they got from fishing operation could not compensate the expenses incurred. For the same reason, some Danish seine operators had stopped their operation. Some fishing companies and operators even sell their catches to other fish port areas in the country opting for a better selling price.
Figure 6 shows the same trend in the decrease of fish catch and
CPUE. Year 1999 had the highest fish harvest of 2,746.46 thousand mt (as shown in Fig. 4) and CPUE of 18,300.94 kg per day, while 2001 had the lowest fish harvest of 1,209.29 thousand mt (see Fig. 4) and CPUE of 9,742.59 kg/day.
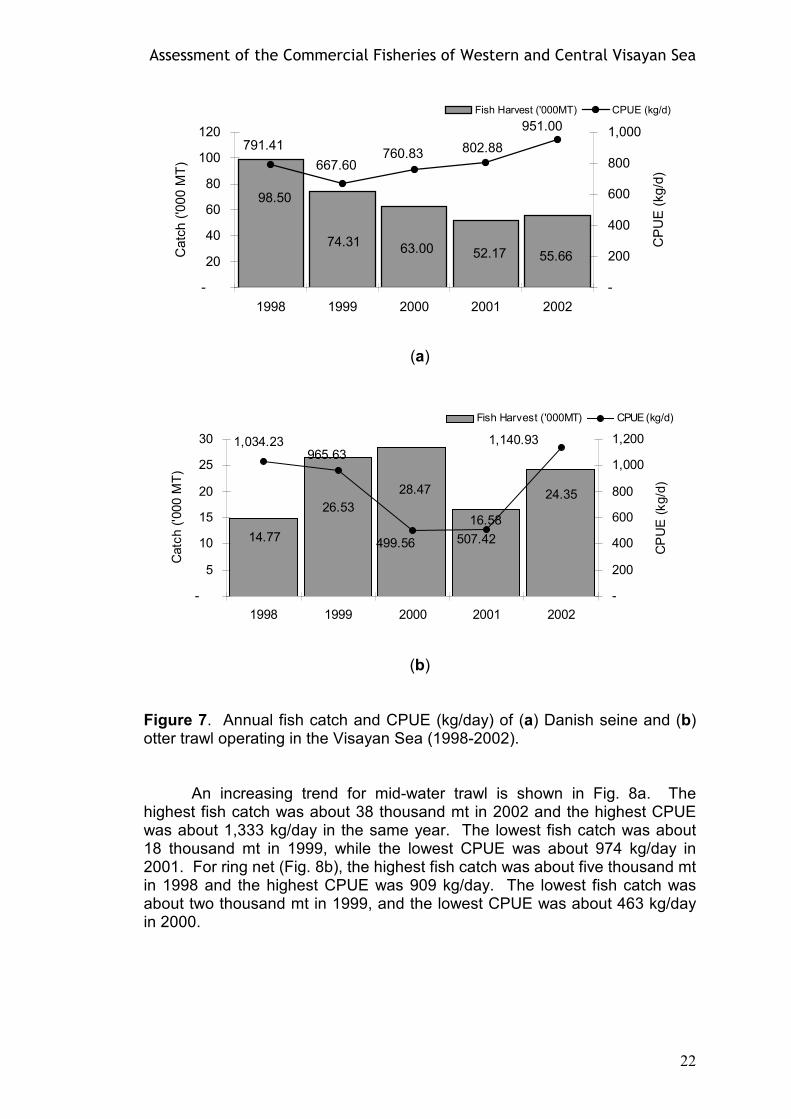
As shown in Fig. 7a, the annual fish production of Danish seine from 1998 to 2002 decreased. Year 1998 had the highest catch of 99 thousand mt, while 2001 had the lowest catch of 52 thousand mt. For the CPUE, the highest was 951 kg/day in 2002 while the lowest was 668 kg/day in 1999. For otter trawl (Fig. 7b), the highest fish catch was 28 thousand mt in 2000 and

Assessment of the Commercial Fisheries of Western and Central Visayan Sea
21
the highest CPUE was 1,141 kg/day in 2002. The lowest fish catch was 15 thousand mt in 1998 and the lowest CPUE was 500 kg/day in 2000.
Purse seine
47.29%
Mid-Water trawl
11.84%Otter trawl
9.69%
Danish seine
30.09%
Ring net
1.09%
Figure 5. Percentage contribution of the major commercial fishing gear operating in the Visayan Sea (1998-2002).
2,746.46
2,694.83
2,399.83
1,401.28
1,209.29
12,842.5415,379.60
17,014.11 18,300.94
9,742.59
-
500
1,000
1,500
2,000
2,500
3,000
1998 1999 2000 2001 2002
Ca
tch
('0
00
MT
)
-
2,000
4,000
6,000
8,000
10,000
12,000
14,000
16,000
18,000
20,000
CP
UE
(kg
/d)
Fish Harvest ('000MT) CPUE (kg/d)
Figure 6. Annual fish harvest and CPUE trend of the commercial fisheries sector of Visayan Sea (1998-2002).
Assessment of the Commercial Fisheries of Western and Central Visayan Sea
22
52.17 55.6663.00
98.50
74.31
802.88
667.60
791.41760.83
951.00
-
20
40
60
80
100
120
1998 1999 2000 2001 2002
Catc
h (
'000 M
T)
-
200
400
600
800
1,000
CP
UE
(kg/d
)
Fish Harvest ('000MT) CPUE (kg/d)
(a)
26.53
14.77
28.47 24.35
16.58
1,140.93
499.56
1,034.23965.63
507.42
-
5
10
15
20
25
30
1998 1999 2000 2001 2002
Catc
h (
'000 M
T)
-
200
400
600
800
1,000
1,200
CP
UE
(kg/d
)
Fish Harvest ('000MT) CPUE (kg/d)
(b) Figure 7. Annual fish catch and CPUE (kg/day) of (a) Danish seine and (b) otter trawl operating in the Visayan Sea (1998-2002).
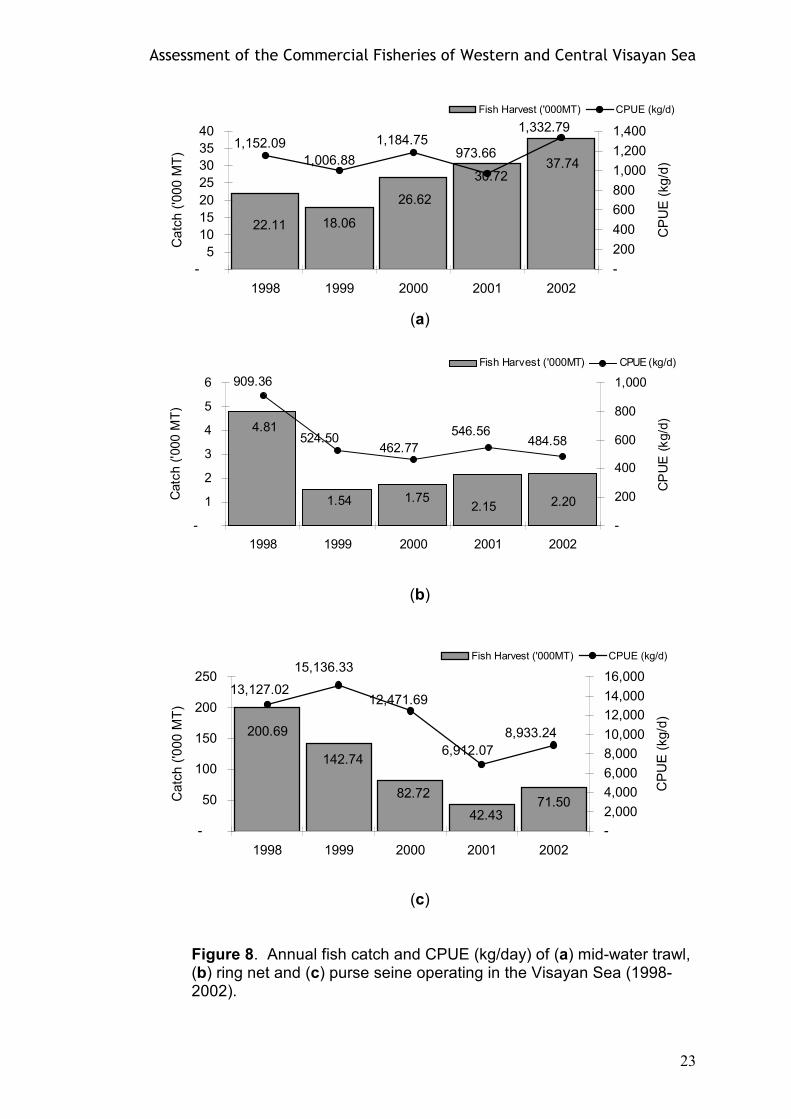
An increasing trend for mid-water trawl is shown in Fig. 8a. The
highest fish catch was about 38 thousand mt in 2002 and the highest CPUE was about 1,333 kg/day in the same year. The lowest fish catch was about 18 thousand mt in 1999, while the lowest CPUE was about 974 kg/day in 2001. For ring net (Fig. 8b), the highest fish catch was about five thousand mt in 1998 and the highest CPUE was 909 kg/day. The lowest fish catch was about two thousand mt in 1999, and the lowest CPUE was about 463 kg/day in 2000.
Assessment of the Commercial Fisheries of Western and Central Visayan Sea
23
30.7237.74
26.62
22.11 18.06
973.661,006.88
1,152.09 1,184.751,332.79
-
5
10
15
20
25
30
35
40
1998 1999 2000 2001 2002
Catc
h (
'000 M
T)
-
200
400
600
800
1,000
1,200
1,400
CP
UE
(kg/d
)
Fish Harvest ('000MT) CPUE (kg/d)
(a)
1.54
4.81
1.75 2.202.15
484.58462.77
909.36
524.50546.56
-
1
2
3
4
5
6
1998 1999 2000 2001 2002
Catc
h (
'000 M
T)
-
200
400
600
800
1,000
CP
UE
(kg/d
)
Fish Harvest ('000MT) CPUE (kg/d)
(b)
142.74
200.69
82.7271.50
42.43
8,933.24
12,471.6913,127.02
15,136.33
6,912.07
-
50
100
150
200
250
1998 1999 2000 2001 2002
Catc
h (
'000 M
T)
-
2,000
4,000
6,000
8,000
10,000
12,000
14,000
16,000
CP
UE
(kg/d
)Fish Harvest ('000MT) CPUE (kg/d)
(c)
Figure 8. Annual fish catch and CPUE (kg/day) of (a) mid-water trawl, (b) ring net and (c) purse seine operating in the Visayan Sea (1998-2002).
Assessment of the Commercial Fisheries of Western and Central Visayan Sea
24
Purse seine, on the other hand, had the highest percentage contribution to total fish harvest in comparison to other commercial gear (as shown in Fig. 5). The highest fish catch was about 201 thousand mt in 1998 while the highest CPUE was more than 15,000 kg/day in 1999 (Fig. 8c). The lowest fish catch was more than 42 thousand mt in 2001, while the lowest CPUE was about 7,000 kg/day.
Table 2 shows the different catch rates obtained from different studies conducted in Visayan Sea. The trawl survey conducted by Warfel and Manacop (1950) showed that computed catch rate was 615 lb/hr or 279.21 kg/hr. After 29 years, based on the trawl study conducted by Aprieto and Villoso (1979), the catch rate was only 59.7 kg/hr, a decrease of 79 percent from the 1950 trawl survey. In this present study, the otter trawl data from 1998 to 2001 showed a decreasing trend in the CPUE with the lowest value of 36.24 kg/hr in 2001. It, however, increased to 81.5 kg/hr in 2002. Average CPUE values for otter trawl showed a catch rate of 59.13 kg/hr that is almost the same with the CPUE obtained in 1979. Mid-water trawl, a modified gear of trawl, showed a much higher average CPUE of 150.7 kg/hr. This can be associated with a different mode of operation of the mid-water trawl compared to the otter trawl; both types of gear even have different catch composition. Table 2. Comparative values of mean catch rates (kg/hr) of trawl in the Visayan Sea (from different studies of the commercial fisheries sector in the area).
CPUE (kg/hr) Gear/Author
1998 1999 2000 2001 2002 Otter trawl (this study) Mid-water trawl (this study)
73.87 153.61
68.33 134.25
35.68 157.97
36.24 129.82
81.50 177.7
1
Trawl survey – Warfel and Manacop (1950) Trawl survey – Aprieto and Villoso 1979) Otter trawl data – This study (1998-2002) Mid-water trawl data – This study (1998-2002)
279.21 kg/hr 59.70 kg/hr 59.13 kg/hr
150.67 kg/hr
Dominant Species Visayan Sea is considered as a multispecies fishing area. Marine
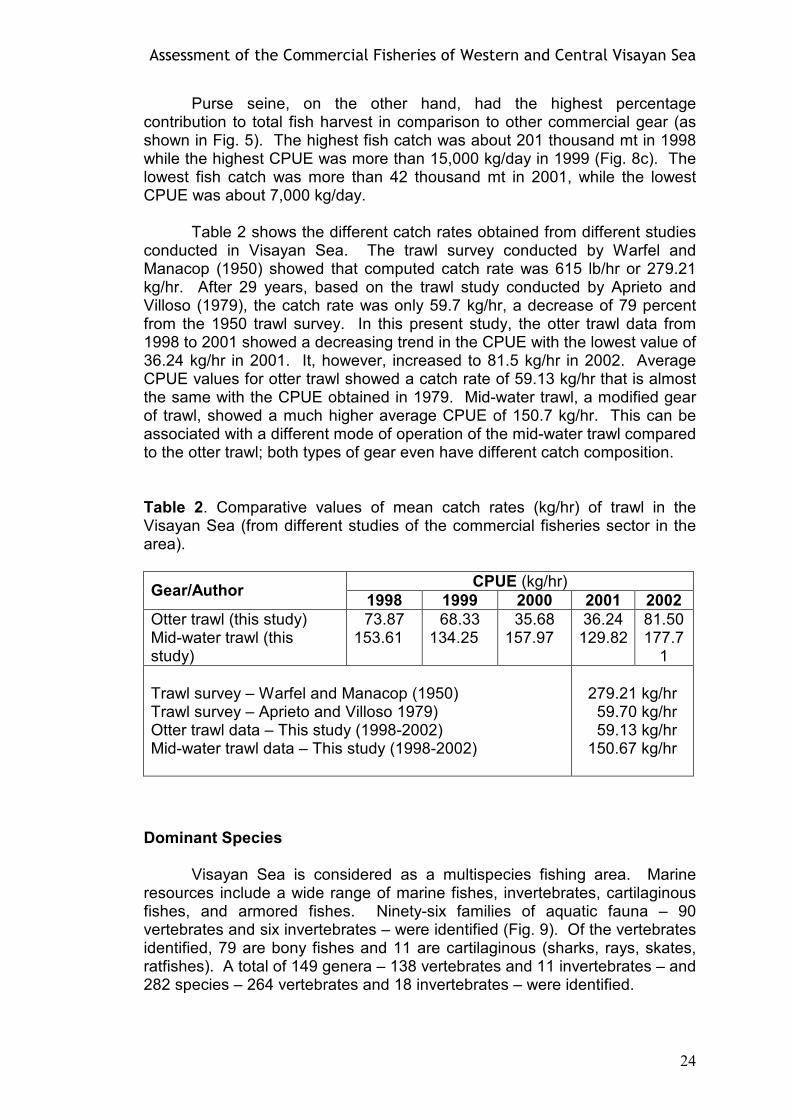
resources include a wide range of marine fishes, invertebrates, cartilaginous fishes, and armored fishes. Ninety-six families of aquatic fauna – 90 vertebrates and six invertebrates – were identified (Fig. 9). Of the vertebrates identified, 79 are bony fishes and 11 are cartilaginous (sharks, rays, skates, ratfishes). A total of 149 genera – 138 vertebrates and 11 invertebrates – and 282 species – 264 vertebrates and 18 invertebrates – were identified.
Assessment of the Commercial Fisheries of Western and Central Visayan Sea
25
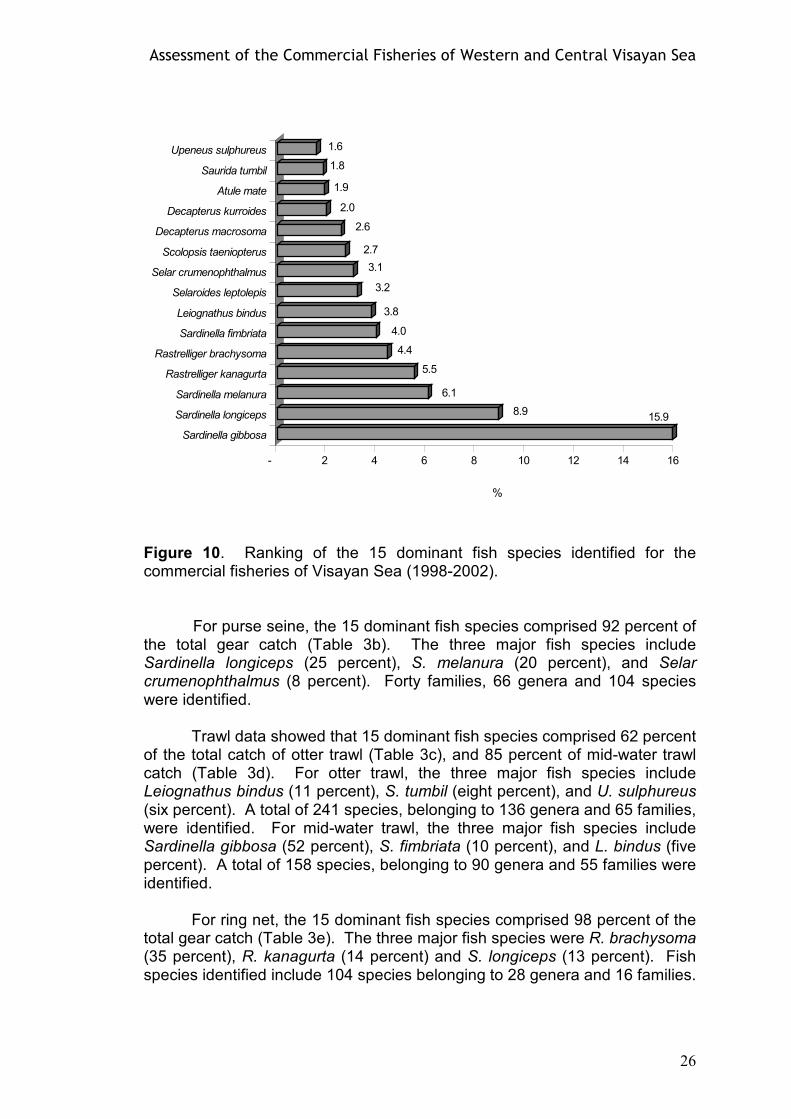
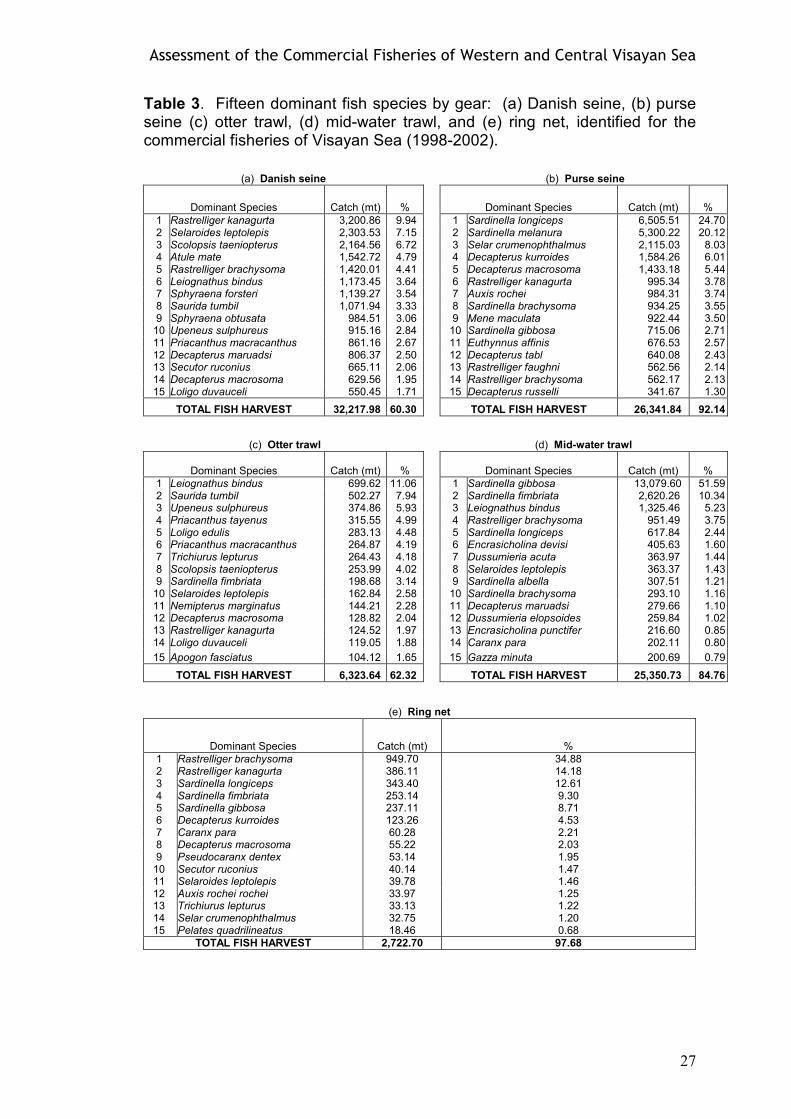
Figure 9. Schematic diagram on the number of fish families, genera and species identified from five commercial fishing gear operating in the Visayan Sea (1998-2002). Figure 10 shows the ranking of the 15 dominant commercial fish species of Visayan Sea, based on the 1998-2002 data. These fish species constitute 67 percent of the total computed catch. Small pelagic fish species dominated the catch, with the sardine species Sardinella gibbosa, S. longiceps and S. melanura occupying the first three ranks. Together with S. fimbriata, the sardine species comprised 35 percent of the total catch. Other dominant species include Rastrelliger kanagurta and R. brachysoma of the family Scombridae which comprised 10 percent; Selaroides leptolepis, Selar crumenophthalmus, Decapterus macrosoma, D. kurroides and Atule mate of the family Carangidae, 13 percent; Scolopsis taeniopterus of the family Nemipteridae, three percent; Saurida tumbil of the family Synodontidae, two percent; and Upeneus sulphureus of the family Mullidae, 1.5 percent contribution to the total catch. The remaining 267 fish species identified comprised 33 percent of the total fish harvest. Table 3 shows the 15 dominant fish species by gear identified for the commercial fisheries of Visayan Sea from 1998 to 2002. For Danish seine, the 15 dominant fish species comprised 60 percent of the total gear catch with the top three species R. kanagurta, S. leptolepis and S. taeniopterus contributing 10 percent, 7.2 percent and 6.7 percent, respectively (Table 3a). There were 71 families, 136 genera and 264 species identified from catches of this gear.
Genus 149
Invertebrates (11) Vertebrates (138)
Families 96
Invertebrates (6)
Cartilaginous (11) Vertebrates (90)
Bony fishes (79)
Squids (3), shrimps (2), crab (1)
Species 282
Invertebrates (18) Vertebrates (264)
Assessment of the Commercial Fisheries of Western and Central Visayan Sea
26
15.98.9
6.1
5.5
4.4
4.0
3.8
3.2
3.1
2.7
2.6
2.0
1.9
1.8
1.6
- 2 4 6 8 10 12 14 16
%
Sardinella gibbosa
Sardinella longiceps
Sardinella melanura
Rastrelliger kanagurta
Rastrelliger brachysoma
Sardinella fimbriata
Leiognathus bindus
Selaroides leptolepis
Selar crumenophthalmus
Scolopsis taeniopterus
Decapterus macrosoma
Decapterus kurroides
Atule mate
Saurida tumbil
Upeneus sulphureus
Figure 10. Ranking of the 15 dominant fish species identified for the commercial fisheries of Visayan Sea (1998-2002). For purse seine, the 15 dominant fish species comprised 92 percent of the total gear catch (Table 3b). The three major fish species include Sardinella longiceps (25 percent), S. melanura (20 percent), and Selar crumenophthalmus (8 percent). Forty families, 66 genera and 104 species were identified. Trawl data showed that 15 dominant fish species comprised 62 percent of the total catch of otter trawl (Table 3c), and 85 percent of mid-water trawl catch (Table 3d). For otter trawl, the three major fish species include Leiognathus bindus (11 percent), S. tumbil (eight percent), and U. sulphureus (six percent). A total of 241 species, belonging to 136 genera and 65 families, were identified. For mid-water trawl, the three major fish species include Sardinella gibbosa (52 percent), S. fimbriata (10 percent), and L. bindus (five percent). A total of 158 species, belonging to 90 genera and 55 families were identified. For ring net, the 15 dominant fish species comprised 98 percent of the total gear catch (Table 3e). The three major fish species were R. brachysoma (35 percent), R. kanagurta (14 percent) and S. longiceps (13 percent). Fish species identified include 104 species belonging to 28 genera and 16 families.
Assessment of the Commercial Fisheries of Western and Central Visayan Sea
27
Table 3. Fifteen dominant fish species by gear: (a) Danish seine, (b) purse seine (c) otter trawl, (d) mid-water trawl, and (e) ring net, identified for the commercial fisheries of Visayan Sea (1998-2002).
(a) Danish seine (b) Purse seine
Dominant Species Catch (mt) % Dominant Species Catch (mt) %
1 Rastrelliger kanagurta 3,200.86 9.94 1 Sardinella longiceps 6,505.51 24.70 2 Selaroides leptolepis 2,303.53 7.15 2 Sardinella melanura 5,300.22 20.12 3 Scolopsis taeniopterus 2,164.56 6.72 3 Selar crumenophthalmus 2,115.03 8.03 4 Atule mate 1,542.72 4.79 4 Decapterus kurroides 1,584.26 6.01 5 Rastrelliger brachysoma 1,420.01 4.41 5 Decapterus macrosoma 1,433.18 5.44 6 Leiognathus bindus 1,173.45 3.64 6 Rastrelliger kanagurta 995.34 3.78 7 Sphyraena forsteri 1,139.27 3.54 7 Auxis rochei 984.31 3.74 8 Saurida tumbil 1,071.94 3.33 8 Sardinella brachysoma 934.25 3.55 9 Sphyraena obtusata 984.51 3.06 9 Mene maculata 922.44 3.50 10 Upeneus sulphureus 915.16 2.84 10 Sardinella gibbosa 715.06 2.71 11 Priacanthus macracanthus 861.16 2.67 11 Euthynnus affinis 676.53 2.57 12 Decapterus maruadsi 806.37 2.50 12 Decapterus tabl 640.08 2.43 13 Secutor ruconius 665.11 2.06 13 Rastrelliger faughni 562.56 2.14 14 Decapterus macrosoma 629.56 1.95 14 Rastrelliger brachysoma 562.17 2.13 15 Loligo duvauceli 550.45 1.71 15 Decapterus russelli 341.67 1.30
TOTAL FISH HARVEST 32,217.98 60.30 TOTAL FISH HARVEST 26,341.84 92.14
(c) Otter trawl (d) Mid-water trawl
Dominant Species Catch (mt) % Dominant Species Catch (mt) %
1 Leiognathus bindus 699.62 11.06 1 Sardinella gibbosa 13,079.60 51.59 2 Saurida tumbil 502.27 7.94 2 Sardinella fimbriata 2,620.26 10.34 3 Upeneus sulphureus 374.86 5.93 3 Leiognathus bindus 1,325.46 5.23 4 Priacanthus tayenus 315.55 4.99 4 Rastrelliger brachysoma 951.49 3.75 5 Loligo edulis 283.13 4.48 5 Sardinella longiceps 617.84 2.44 6 Priacanthus macracanthus 264.87 4.19 6 Encrasicholina devisi 405.63 1.60 7 Trichiurus lepturus 264.43 4.18 7 Dussumieria acuta 363.97 1.44 8 Scolopsis taeniopterus 253.99 4.02 8 Selaroides leptolepis 363.37 1.43 9 Sardinella fimbriata 198.68 3.14 9 Sardinella albella 307.51 1.21 10 Selaroides leptolepis 162.84 2.58 10 Sardinella brachysoma 293.10 1.16 11 Nemipterus marginatus 144.21 2.28 11 Decapterus maruadsi 279.66 1.10 12 Decapterus macrosoma 128.82 2.04 12 Dussumieria elopsoides 259.84 1.02 13 Rastrelliger kanagurta 124.52 1.97 13 Encrasicholina punctifer 216.60 0.85 14 Loligo duvauceli 119.05 1.88 14 Caranx para 202.11 0.80
15 Apogon fasciatus 104.12 1.65 15 Gazza minuta 200.69 0.79
TOTAL FISH HARVEST 6,323.64 62.32 TOTAL FISH HARVEST 25,350.73 84.76
(e) Ring net
Dominant Species Catch (mt) %
1 Rastrelliger brachysoma 949.70 34.88 2 Rastrelliger kanagurta 386.11 14.18 3 Sardinella longiceps 343.40 12.61 4 Sardinella fimbriata 253.14 9.30 5 Sardinella gibbosa 237.11 8.71 6 Decapterus kurroides 123.26 4.53 7 Caranx para 60.28 2.21 8 Decapterus macrosoma 55.22 2.03 9 Pseudocaranx dentex 53.14 1.95 10 Secutor ruconius 40.14 1.47 11 Selaroides leptolepis 39.78 1.46 12 Auxis rochei rochei 33.97 1.25 13 Trichiurus lepturus 33.13 1.22 14 Selar crumenophthalmus 32.75 1.20 15 Pelates quadrilineatus 18.46 0.68
TOTAL FISH HARVEST 2,722.70 97.68

Assessment of the Commercial Fisheries of Western and Central Visayan Sea
28
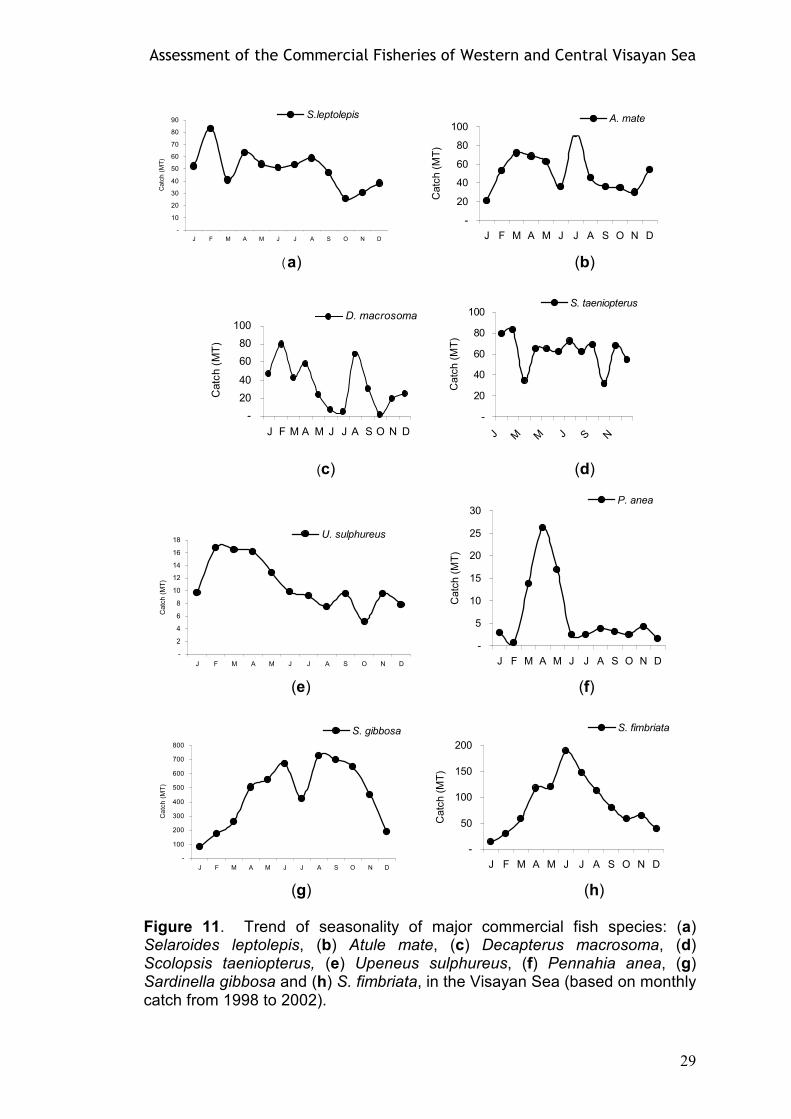
Based on the study of Warfel and Manacop (1950), the major fish composition of Visayan Sea trawl catch includes pomadasids or sweetlips (Pomadasidae), slipmouths (Leiognathidae), breams (Nemipteridae), goatfishes (Mullidae) and croakers (Scianidae). On the other hand, the study of Aprieto and Villoso (1979) revealed the following major fish species: lizardfishes (Synodontidae), slipmouths (Leiognathidae), breams (Nemipteridae), big eyes (Priacanthidae) and goatfishes (Mullidae). Trash fish accounted to 14 percent of the total fish harvest. Furthermore, the study concluded that the Visayan Sea trawl fishery is typical multi-species fisheries of over 170 species which are mainly of poor quality with relatively low market value. Quality fishes, which are vulnerable to other gear, occur as incidental catches. In this study, Danish seine and otter trawl catches are comprised mostly of carangids, ponyfishes, breams, squids, lizardfish and goatfishes. Mid-water trawl, purse seine, and ring net catches are composed mostly of sardines, mackerels, ponyfishes, herrings, and anchovies. These major fish species are considered as small pelagic resource of the country (Dalzell and Ganaden 1987). The bulk of catch of bottom dragging gear is comprised of squids. Danish seine catch (Table 3a) showed that squids ranked 15th among the dominant species and contributed to 1.7 percent (550.45 mt) of the gear catch. On the other hand, squids ranked fifth in the catch of otter trawl, sharing about 4.5 percent (283.13 mt) to the total gear catch. Abundance of shrimps and squids in relation to fish biomass indicates decline of catch as this group replaces finfish stratum in the food web (Armada 2004). Seasonality and Relative Abundance A total of 16 fish species, belonging to seven families, were analyzed for seasonality and biological parameters. Figure 11 shows the seasonal distribution and relative abundance of the major fish species monitored in the Visayan Sea in 2002. Production peak of S. leptolepis is in February and the lean month is in October (Fig. 11a); A. mate, peak month in July and lean month in January (Fig. 11b); D. macrosoma, peak month in February and lean month in October (Fig. 11c); S. taeniopterus, production peak in February and two lean months in March and October (Fig. d). Figure 10e shows the seasonality of U. sulphureus, with production peak in February and lean month in October. Production peak of Pennahia anea, on the other hand, is in April and the lean month is in February (Fig. 11f). These fish species are all caught by Danish seine. For the sardine species (family Clupeidae) which are caught by mid-water trawl, S. gibbosa has its production peak in August and lean month in January (Fig. 11g), and S. fimbriata has its production peak in June and lean month in January (Fig. 11h).
Figure 12 also shows the seasonal distribution and relative abundance of the other major species monitored in the Visayan Sea in 2002. Sardinella longiceps, caught by purse seine, has its production peak in September and lean month in February (Fig. 12a).
Assessment of the Commercial Fisheries of Western and Central Visayan Sea
29
-
10
20
30
40
50
60
70
80
90
J F M A M J J A S O N D
Catc
h (
MT
)
S.leptolepis
-
20
40
60
80
100
J F M A M J J A S O N D
Catc
h (
MT
)
A. mate
(a) (b)
-
20
40
60
80
100
J F M A M J J A S O N D
Catc
h (
MT
)
D. macrosoma
-
20
40
60
80
100
J M M J S N
Catc
h (
MT
)
S. taeniopterus
(c) (d)
-
2
4
6
8
10
12
14
16
18
J F M A M J J A S O N D
Catc
h (
MT
)
U. sulphureus
-
5
10
15
20
25
30
J F M A M J J A S O N D
Catc
h (
MT
)
P. anea
(e) (f)
-
100
200
300
400
500
600
700
800
J F M A M J J A S O N D
Ca
tch
(M
T)
S. gibbosa
-
50
100
150
200
J F M A M J J A S O N D
Catc
h (
MT
)
S. fimbriata
(g) (h) Figure 11. Trend of seasonality of major commercial fish species: (a) Selaroides leptolepis, (b) Atule mate, (c) Decapterus macrosoma, (d) Scolopsis taeniopterus, (e) Upeneus sulphureus, (f) Pennahia anea, (g) Sardinella gibbosa and (h) S. fimbriata, in the Visayan Sea (based on monthly catch from 1998 to 2002).

Assessment of the Commercial Fisheries of Western and Central Visayan Sea
30
-
20
40
60
80
100
120
J F M A M J J A S O N D
Catc
h (
MT
)
S. longiceps
(a)
-
20
40
60
80
100
120
J F M A M J J A S O N D
Catc
h (
MT
)
L. bindus
(b)
-
2
4
6
8
J F M A M J J A S O N D
Catc
h (
MT
)
L. splendens
(c)
-
50
100
150
200
J F M A M J J A S O N D
Catc
h (
MT
)
R. k(MWT)R. k(PS)R. k(DS)
(d) Figure 12. Trend of seasonality of major commercial fish species: (a) Sardinella longiceps, (b) Leiognathus bindus, (c) L. splendens and (d) Rastrelliger kanagurta, in the Visayan Sea (based on monthly catch from 1998 to 2002).

Assessment of the Commercial Fisheries of Western and Central Visayan Sea
31
For the slipmouths (Leiognathidae), the production peak of L. bindus is in July and the lean month is in October (Fig. 12b), while L. splendens has its peak in September and lean month in March (Fig. 12c). For Rastrelliger kanagurta, January is the peak month for mid-water trawl and purse seine catches; and February, for the catch of Danish seine. The lean month of production for mid-water trawl and purse seine is September, while that for Danish seine is October. Rasalan (1957) reported that the peak season of mackerels is January to May; herrings and sardines, January to March; and juvenile sardines, December to May. As observed, catches during the production peak within the northeast monsoon season include the carangid and scombrid groups, and S. taeniopterus. The peak season of sardines and leiognathids falls during the southwest monsoon. Intermoonsoon seasonal catch has been observed in P. anea and U. sulphureus.
Biological Parameter Estimates Growth
Growth parameter values obtained using FISAT and those from literature are shown in Tables 4 to 8. Groupings of fish species by family include Carangidae, Clupeidae, Leiognathidae, Scombridae and demersal fish group. Literature values used for comparison were obtained from foreign results as no data from local literature are available.
For the carangid fish group, L∞ and Lmax values of S. leptolepis increased annually except in 1998 and 2001 when the data had no clear modal progression (Table 4). The highest L∞ value obtained was 23.99 cm in 2002, while the lowest was 20.27 cm in 1999. L∞ of this species, from literature, ranges from 19.2 cm to 29 cm. Growth coefficient (K) values obtained range from 1.08 to 1.19 cm/year-1; from literature, 0.8 to 1.22 cm/yr-1.
For A. mate, L∞ and Lmax values also increased, from 28.35 cm in 1998 to 35.37 cm in 2002, except in 1999 when the data had no clear modal progression. The highest L∞ value was 35.75 cm in 2000; from literature, L∞
values range from 24.5 cm to 30.5 cm. K values obtained range from 0.78 to 0.98 cm/year-1, while K values from literature range from 0.76 to 1.0 cm/year-1.
For D. macrosoma, and Lmax values increased from 2000 to 2002 while the 1998 data had no modal progression. The highest L∞ value was 25.89 cm in 2002, while Lmax was 25.59 cm in 2001. L∞ values from literature range from 23 cm to 31.7 cm. K values obtained for the species range from 1.07 to 1.28 cm/year-1; from the literature, K values range from 1.25 to 2.3 cm/year-1.

Assessment of the Commercial Fisheries of Western and Central Visayan Sea
32
Table 4. Growth parameter estimates for the carangid fish group in the Visayan Sea (1998-2002).
Species/Year Lmax L∞ k ∅∅∅∅’
Selaroides leptolepis
1998 No modal progression
1999 19.74 20.27 1.19 2.69
2000 20.57 21.58 1.08 1.91
2001 No modal progression
2002 21.01 23.99 1.11 2.81
Values from literature - 19.2-29.0 0.8-1.32 -
Atule mate
1998 28.10 28.35 0.78 2.80
1999 Data insufficient
2000 35.42 35.75 0.91 3.06
2001 33.64 33.90 0.94 3.03
2002 35.46 35.37 0.98 3.09
Values from literature - 24.5-30.5 0.76-1.0 -
Decapterus macrosoma
1998 25.19 No modal progression
1999 24.85 25.41 1.28 2.92
2000 23.76 25.01 1.13 2.85
2001 25.59 25.36 1.12 2.86
2002 25.56 25.89 1.07 2.86
Values from literature - 23.0-31.7 1.25-2.3 -
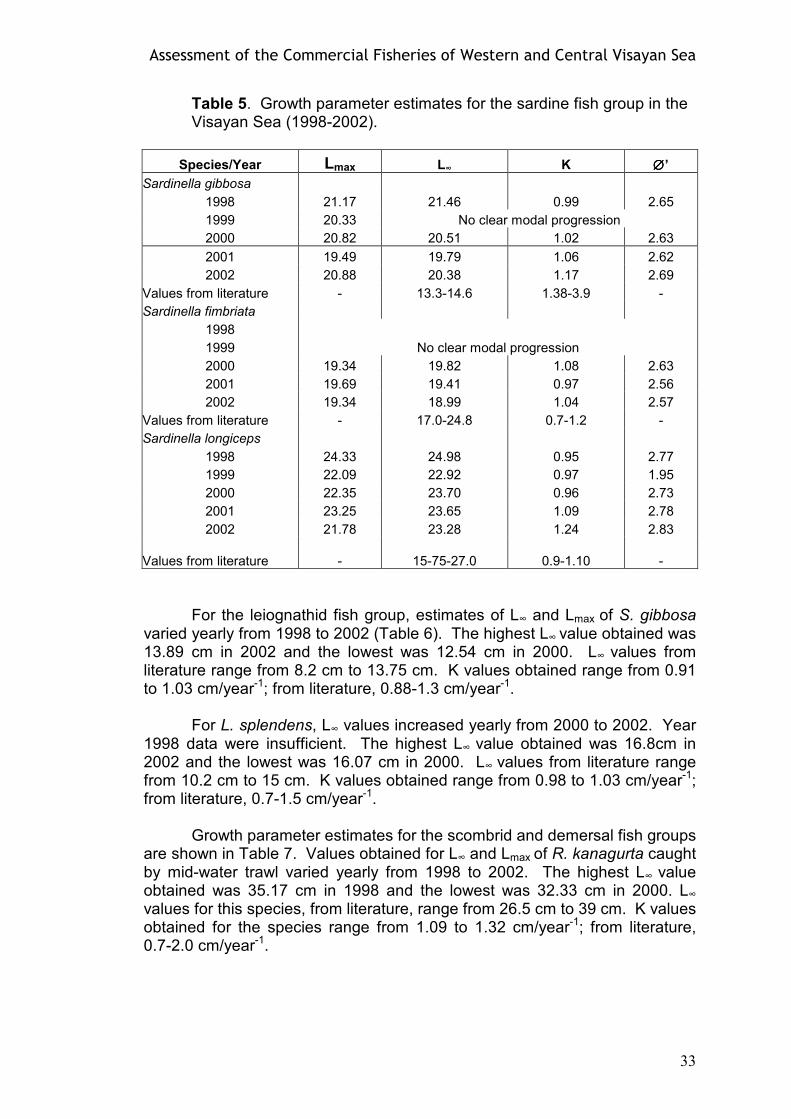
For the sardine fish group, values obtained for L∞ and Lmax of S. gibbosa decreased annually from 1998 to 2000, and slightly increased in 2002 (Table 5). Year 1999 data had no modal progression. The highest L∞ value obtained was 21.46 cm in 1998 and the lowest was 19.79 cm in 2001. L∞ values for this species, from literature, range from 13.3 cm to 14.6 cm. K values obtained range from 0.99 to 1.17 cm/year-1; from literature, 1.38-3.9 cm/year-1.
For S. fimbriata, L∞ and Lmax values decreased from 19.82 cm in 2000 to 18.99 cm in 2002. Year 1998-1999 data had no clear modal progression. L∞ values from literature range from 17.0 cm to 24.8 cm. K values obtained range from 0.97 to 1.08 cm/year-1; from literature, 0.7-1.2 cm/year-1.
For S. longiceps, and Lmax values varied from 1998 to 2002. The
highest L∞ value obtained was 24.98 cm in 1998; the highest value of Lmax was 24.33 cm in the same year. L∞ values from literature range from 15.75 cm to 27.0 cm. K values obtained for the species range from 0.95 to 1.24 cm/year-1; from literature, 0.9-1.1 cm/year-1.
Assessment of the Commercial Fisheries of Western and Central Visayan Sea
33
Table 5. Growth parameter estimates for the sardine fish group in the Visayan Sea (1998-2002).
Species/Year Lmax L∞ K ∅∅∅∅’
Sardinella gibbosa
1998 21.17 21.46 0.99 2.65
1999 20.33 No clear modal progression
2000 20.82 20.51 1.02 2.63
2001 19.49 19.79 1.06 2.62
2002 20.88 20.38 1.17 2.69
Values from literature - 13.3-14.6 1.38-3.9 -
Sardinella fimbriata
1998
1999 No clear modal progression
2000 19.34 19.82 1.08 2.63
2001 19.69 19.41 0.97 2.56
2002 19.34 18.99 1.04 2.57
Values from literature - 17.0-24.8 0.7-1.2 -
Sardinella longiceps
1998 24.33 24.98 0.95 2.77
1999 22.09 22.92 0.97 1.95
2000 22.35 23.70 0.96 2.73
2001 23.25 23.65 1.09 2.78
2002 21.78 23.28 1.24 2.83
Values from literature - 15-75-27.0 0.9-1.10 -
For the leiognathid fish group, estimates of L∞ and Lmax of S. gibbosa
varied yearly from 1998 to 2002 (Table 6). The highest L∞ value obtained was 13.89 cm in 2002 and the lowest was 12.54 cm in 2000. L∞ values from literature range from 8.2 cm to 13.75 cm. K values obtained range from 0.91 to 1.03 cm/year-1; from literature, 0.88-1.3 cm/year-1.
For L. splendens, L∞ values increased yearly from 2000 to 2002. Year
1998 data were insufficient. The highest L∞ value obtained was 16.8cm in 2002 and the lowest was 16.07 cm in 2000. L∞ values from literature range from 10.2 cm to 15 cm. K values obtained range from 0.98 to 1.03 cm/year-1; from literature, 0.7-1.5 cm/year-1.
Growth parameter estimates for the scombrid and demersal fish groups
are shown in Table 7. Values obtained for L∞ and Lmax of R. kanagurta caught by mid-water trawl varied yearly from 1998 to 2002. The highest L∞ value obtained was 35.17 cm in 1998 and the lowest was 32.33 cm in 2000. L∞
values for this species, from literature, range from 26.5 cm to 39 cm. K values obtained for the species range from 1.09 to 1.32 cm/year-1; from literature, 0.7-2.0 cm/year-1.
Assessment of the Commercial Fisheries of Western and Central Visayan Sea
34
Table 6. Growth parameter estimates for the leiognathid fish group in the Visayan Sea (1998-2002).
Species/Year Lmax L∞ k ∅∅∅∅’
Leiognathus bindus
1998 13.42 13.54 1.03 2.28
1999 12.09 12.81 0.93 2.18
2000 12.28 12.54 0.94 2.17
2001 12.26 12.69 0.94 2.15
2002 12.81 13.89 0.91 2.24
Values from literatures - 8.2-13.75 0.88-1.3 -
Leiognathus splendens
1998 Data insufficient
1999 16.95 16.65 1.00 2.44
2000 15.06 16.07 1.03 2.42
2001 15.64 16.76 0.93 2.42
2002 16.40 16.80 0.98 2.44
Values from literatures - 10.2-15 0.7-1.5 -
The demersal fish species analyzed for biological parameters include Scolopsis taeniopterus, Upeneus sulphureus and Pennahia anea. For S. taeniopterus, L∞ values obtained increased yearly. The highest value obtained was 30.13 cm in 2002, while the lowest was 27.1 cm in 1998. L∞ value obtained literature for this fish species is 31.5 cm. K values obtained ranged from 0.76 to 0.95 cm/year-1. For U. sulphureus, the highest L∞ value obtained was 26.14 cm in 2000 and the lowest was 20.94 cm in 2001. Year 1999 data had no modal progression. K values obtained range from 1.05 to 1.38 cm/year-1; K values from literature range from 1.3 to 1.32 cm/year-1. For P. anea, the highest L∞ value obtained was 23.87 cm in 2000 and lowest was 22.89 cm in 1999. Year 1998 data had no modal progression. K values obtained range from 0.92 to 1.38 cm/year-1; from literature, 0.53-1.4 cm/year-1.
Table 8 shows the multi-gear effect on the growth of caught by Danish
seine, purse seine, and mid-water trawl using 2002 data. For Danish seine catch, L∞ of R. kanagurta is 32.92 cm and K is 1.03 cm/year-1; for purse seine catch, L∞ is 32.46 cm and K is 1.06 cm/year-1; and for mid-water trawl catch, L∞ is 32.5cm and K is 1.32 cm/year-1. Three-gear effect on the growth of the species showed similarity as their sizes of length at infinity and growth coefficient are almost the same.
Assessment of the Commercial Fisheries of Western and Central Visayan Sea
35
Table 7. Growth parameter estimates for the scombrid and demersal fish groups in the Visayan Sea (1998-2002).
Table 8. Growth parameter estimates for Rastrelliger kanagurta monitored in the Visayan Sea in 2002.
Species/Year Lmax L∞ k ∅∅∅∅’
Rastrelliger kanagurta
Danish seine 32.13 32.92 1.03 3.05
Purse seine 31.58 32.46 1.06 3.05
Mid-water trawl 32.20 32.50 1.32 3.14
Values from literature
Species/Year Lmax L∞ k ∅∅∅∅’
Rastrelliger kanagurta
1998 34.98 35.17 1.16 3.16
1999 33.93 33.95 1.18 3.13
2000 31.89 32.33 1.09 3.06
2001 32.71 33.26 1.10 3.09
2002 32.20 32.50 1.32 3.14
Values from literature - 26.5-39.0 0.7-2.0 -
Scolopsis taeniopterus
1998 26.74 27.10 0.93 2.83
1999 27.22 27.60 0.90 2.84
2000 26.80 27.47 0.89 2.83
2001 27.60 28.18 0.95 2.88
2002 29.34 30.13 0.76 2.84
Values from literature - 31.50 - -
Upeneus sulphureus
1998 21.29 21.06 1.19 2.72
1999 No modal progression
2000 24.10 26.14 1.06 1.82
2001 20.40 20.94 1.05 2.66
2002 20.37 21.24 1.38 2.77
Values from literature - 15.3-23.5 1.3-1.32 -
Pennahia anea
1998 26.08 No modal progression
1999 22.65 22.89 0.92 2.68
2000 22.46 23.87 0.99 2.75
2001 21.63 23.11 1.10 2.77
2002 22.86 23.18 1.38 2.87
Values from literature - 20.0-34.8 0.53-1.4 -
Assessment of the Commercial Fisheries of Western and Central Visayan Sea
36
Mortality
The easiest way to describe the change in numbers in a fish stock is often to follow the fate of fish spawned approximately at the same time (Sparre and Venema 1992). The mortality of a cohort is composed of mortality due to fishing (F), and mortality caused by predation, disease, and deaths due to aging, which is known as natural mortality (M). With these factors, exploitation rate (E) can be known using the ratio of fishing mortality (F) over total mortality (Z), and that this value indicates the fishing condition of a certain area.
Pauly and Ingles (1984) stated that the optimum fishing mortality in an exploited stock should be approximately equal to natural mortality, or optimum exploitation rate is approximately equal to 0.50. A predominance of estimates of values of E >0.5 in a number of stocks should be suggestive of over exploitation.
Figure 13 shows the frequency distribution of exploitation rate as
biological parameter indicator of the 12 fish species analyzed from 1998 to 2002. All exceeded optimum exploitation (Eopt) at 0.5 year-1, which suggests an overfishing status of the commercially dominant marine fish stocks of Visayan Sea. Exploitation rate values cluster dominantly at 0.55 year-1 and the range reaches to as high as 0.8 year-1. For a comparison of exploitation rate values of R. kanagurta caught by three different gear in 2002, those caught by Danish seine had the highest E value of 0.7, while those caught by purse seine and mid-water trawl had E values of only 0.63 and 0.53, respectively (Figure 14).
0
2
4
6
8
10
12
14
16
18
20
Fre
quency
0.4 0.45 0.5 0.55 0.6 0.65 0.7 0.75 0.8 0.85 0.9
Exploitation rate
Figure 13. Frequency distribution of exploitation rate values of commercial fish species in the Visayan Sea (1998-2002).
Assessment of the Commercial Fisheries of Western and Central Visayan Sea
37
Figure 14. Comparative exploitation rate values obtained for Rastrelliger kanagurta monitored for the commercial fisheries of Visayan Sea in 2002. Recruitment Pattern
Recruitment in relation to this study refers to the stage in which a stock
enters a certain fishing area. Recruitment patterns have a bell-shaped normal distribution when recruitment occurs as a single event. When annual recruitment occurs as two major events, however, this results in a strongly asymmetric graph with a single mode or in a bimodal pattern. For most stocks, the recruitment pattern suggests that two pulses of recruits are generated each year (Pauly and Navaluna 1983, Pauly and Ingles 1984). All species analyzed for recruitment pattern exhibit bimodal recruitment pulses (Table 9). Strong pulse of recruitment occurred at the first semester of the year for the carangids and leiognathids; and either first or second semester for the sardines, scombrids and demersal fish groups. Table 9. Annual recruitment pulses of major commercial fish species in the Visayan Sea (1998-2002).
Species Number of
pulses per year Strong Pulse
Semester Peak Month
(Strong Pulse) S. leptolepis A. mate D. macrosoma S. gibbosa S. fimbriata S. longiceps L. bindus L. splendens S. taeniopterus U. sulphureus P. anea R. kanagurta (DS) R. kanagurta (PS) R. kanagurta (MWT)
2 2 2 2 2 2 2 2 2 2 2 2 2 2
1st
1st
/2nd
1st 1
st
2nd
1
st
1st
1st
1st
/ 2nd
1
st / 2
nd
2nd
Equal
1st
2nd
March - June March - July March - April
February - June July - September
March - May March - May March - April April - July
February - July July - August
April/September April
September
- 0.1 0.2 0.3 0.4 0.5 0.6 0.7
E values
R. k anagurta (DS)
R. k anagurta (PS)
R. k angurta (MWT)
Eopt

Assessment of the Commercial Fisheries of Western and Central Visayan Sea
38
Probability of Capture Probability of capture of fish by length class, as estimated from ELEFAN program, used data from mortalities to which Lc or length at first capture are being determined. Table 10 shows the probability of capture of major fish species monitored in the Visayan Sea from 1998 to 2002, particularly data on length at first maturity (L50) and length at first captivity (L25). As indicated in the table, from year 2000 to 2002 almost all species were captured even at a size when they are still immature. For R. kanagurta, those caught by purse seine were smaller in size and immature ones than those caught by Danish seine and mid-water trawl. This point can be critical since major fish species are caught at an immature stage and stocks could not be replenished, and such condition may result in recruitment overfishing.
Table 10. Comparative values of length at first maturity (L50) and length at first captivity (L25) of major commercial fish species in the Visayan Sea (1998-2002).
Length at first captivity (L25)
Species 1998
1999
2000
2001
2002
Length at first
maturity (L50)*
S. leptolepis A. mate D. macrosoma S. gibbosa S. fimbriata S. longiceps L. bindus L. splendens S. taeniopterus U. sulphureus P. anea R. kanagurta
- 16.29
- 12.90
- 15.96 8.58
- 14.52 8.82
- 20.69
12.08 -
20.03 - -
17.15 8.04 9.44
14.87 -
15.43 23.77
12.38 17.89 16.78 11.93 11.75 16.34 8.08 9.39 16.33 8.98 11.33 14.23
- 19.08 19.29 12.49 11.36 13.95 6.93 9.05 17.79 12.51 12.50 12.47
13.92 22.62 14.52 10.17 10.24 13.38 7.89 9.01 19.77 12.65 11.72 19.03
13.20 19.50 19.30 14.50 13.00 16.10 10.00 10.70 18.50 12.70 14.20 15.30
R. kanagurta (DS) R. kanagurta (PS) R. kanagurta (MWT)
26.01 14.59 19.03
15.30
* Source: Froese and Pauly (2000).
Virtual Population Analysis The method of virtual population analysis (VPA) used in this study is length base-structured that requires the necessary assumption of a stable age distribution which is not required in an age-structured VPA. A stable age distribution can be simulated in the case of length-structured VPA or length cohort analysis by averaging catch data for a length of time during which recruitment and fishing mortality can be assumed to have been constant (Pauly et al. 1987). Table 11 shows the values to which terminal mortality refers to the total fishing mortality of the fish population, mean F refers to the average fishing mortality per length group that is observed to be fully recruited.
Assessment of the Commercial Fisheries of Western and Central Visayan Sea
39
Table 11. Length at full recruitment and respective fishing mortality (F) values of major commercial fish species in the Visayan Sea (1998- 2002).
Species
Length at full recruitment (in cm)
F value at full recruitment
S. leptolepis A. mate D. macrosoma S. gibbosa S. fimbriata S. longiceps L. splendens L. bindus S. taeniopterus U. sulphureus P. anea R. kanagurta
15.63 – 16.50 28.25 – 29.30 21.68 – 22.48 16.88 – 17.80 15.83 – 16.67 19.70 – 21.18 11.40 – 11.90 13.38 – 14.00 23.94 – 25.00 17.25 – 18.25 19.43 – 20.23 28.34 – 29.44
6.77 5.07 9.77 3.96 4.17 6.87 5.02 4.88 2.53 3.75 5.28 5.80
R. kanagurta (DS) R. kanagurta (PS) R. kanagurta (MWT)
28.49 – 29.24 18.00 – 19.50 28.50 – 30.00
4.98 3.88 6.41
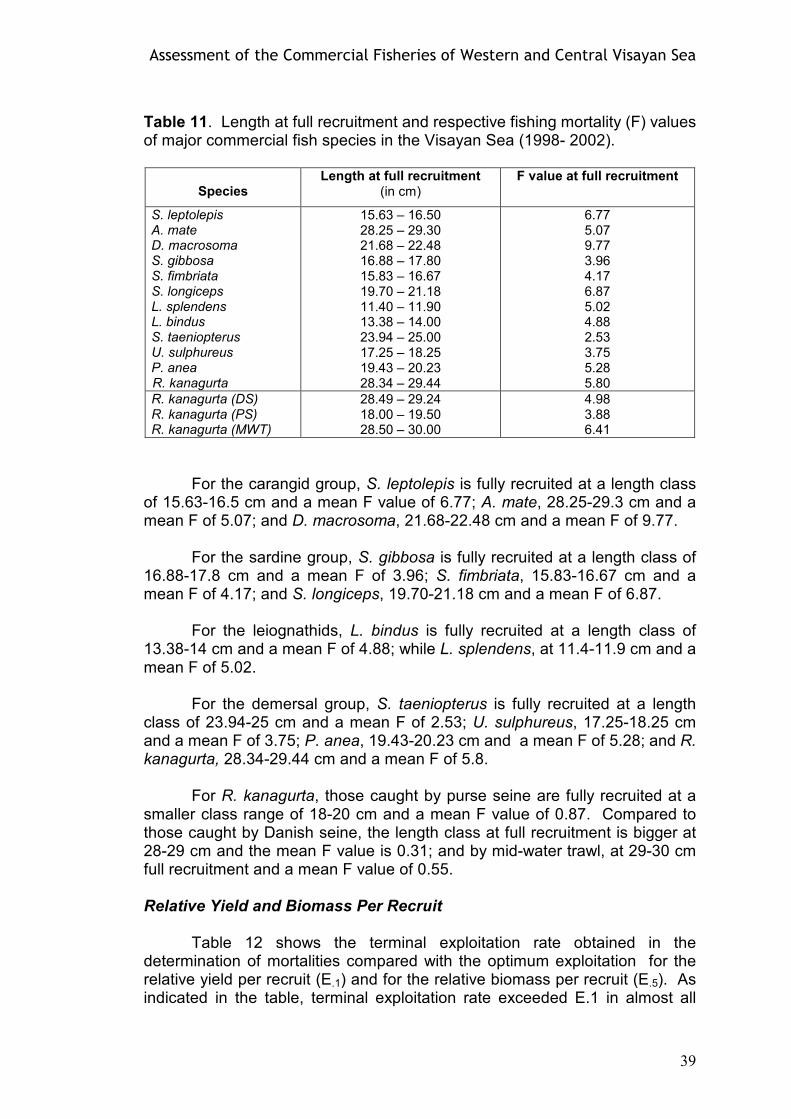
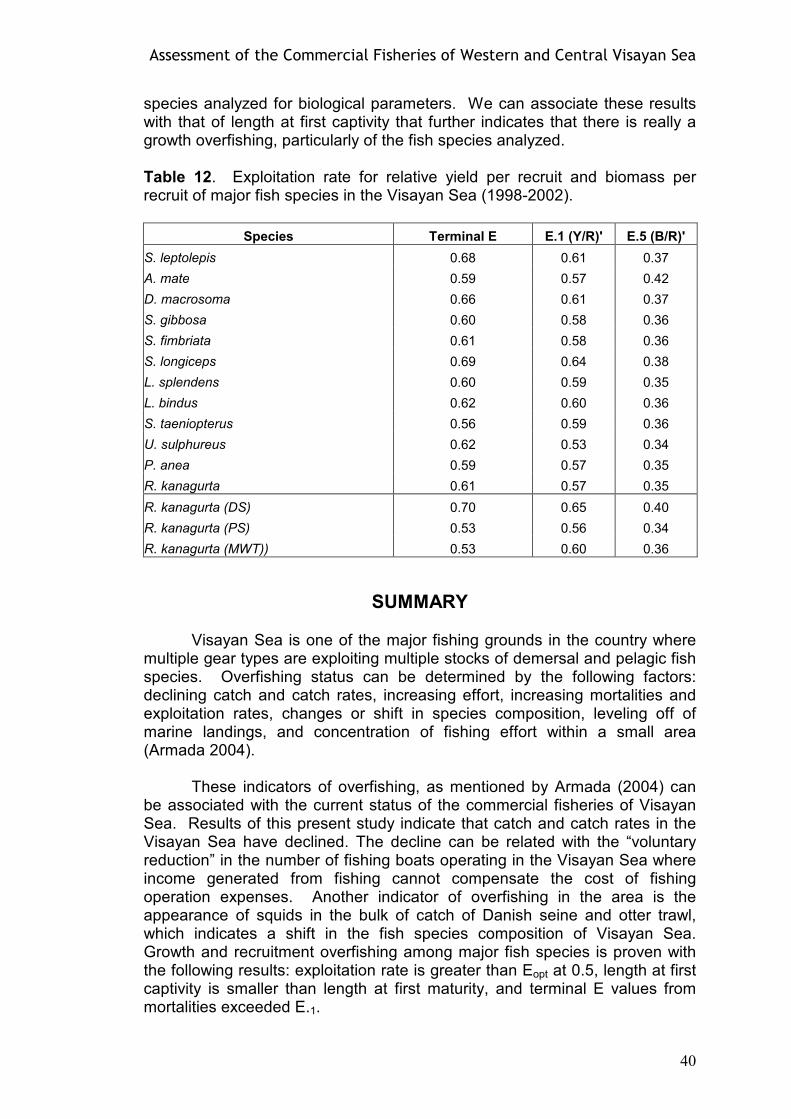
For the carangid group, S. leptolepis is fully recruited at a length class of 15.63-16.5 cm and a mean F value of 6.77; A. mate, 28.25-29.3 cm and a mean F of 5.07; and D. macrosoma, 21.68-22.48 cm and a mean F of 9.77. For the sardine group, S. gibbosa is fully recruited at a length class of 16.88-17.8 cm and a mean F of 3.96; S. fimbriata, 15.83-16.67 cm and a mean F of 4.17; and S. longiceps, 19.70-21.18 cm and a mean F of 6.87. For the leiognathids, L. bindus is fully recruited at a length class of 13.38-14 cm and a mean F of 4.88; while L. splendens, at 11.4-11.9 cm and a mean F of 5.02. For the demersal group, S. taeniopterus is fully recruited at a length class of 23.94-25 cm and a mean F of 2.53; U. sulphureus, 17.25-18.25 cm and a mean F of 3.75; P. anea, 19.43-20.23 cm and a mean F of 5.28; and R. kanagurta, 28.34-29.44 cm and a mean F of 5.8. For R. kanagurta, those caught by purse seine are fully recruited at a smaller class range of 18-20 cm and a mean F value of 0.87. Compared to those caught by Danish seine, the length class at full recruitment is bigger at 28-29 cm and the mean F value is 0.31; and by mid-water trawl, at 29-30 cm full recruitment and a mean F value of 0.55. Relative Yield and Biomass Per Recruit Table 12 shows the terminal exploitation rate obtained in the determination of mortalities compared with the optimum exploitation for the relative yield per recruit (E.1) and for the relative biomass per recruit (E.5). As indicated in the table, terminal exploitation rate exceeded E.1 in almost all
Assessment of the Commercial Fisheries of Western and Central Visayan Sea
40
species analyzed for biological parameters. We can associate these results with that of length at first captivity that further indicates that there is really a growth overfishing, particularly of the fish species analyzed. Table 12. Exploitation rate for relative yield per recruit and biomass per recruit of major fish species in the Visayan Sea (1998-2002).
Species Terminal E E.1 (Y/R)' E.5 (B/R)'
S. leptolepis 0.68 0.61 0.37
A. mate 0.59 0.57 0.42
D. macrosoma 0.66 0.61 0.37
S. gibbosa 0.60 0.58 0.36
S. fimbriata 0.61 0.58 0.36
S. longiceps 0.69 0.64 0.38
L. splendens 0.60 0.59 0.35
L. bindus 0.62 0.60 0.36
S. taeniopterus 0.56 0.59 0.36
U. sulphureus 0.62 0.53 0.34
P. anea 0.59 0.57 0.35
R. kanagurta 0.61 0.57 0.35
R. kanagurta (DS) 0.70 0.65 0.40
R. kanagurta (PS) 0.53 0.56 0.34
R. kanagurta (MWT)) 0.53 0.60 0.36
SUMMARY
Visayan Sea is one of the major fishing grounds in the country where multiple gear types are exploiting multiple stocks of demersal and pelagic fish species. Overfishing status can be determined by the following factors: declining catch and catch rates, increasing effort, increasing mortalities and exploitation rates, changes or shift in species composition, leveling off of marine landings, and concentration of fishing effort within a small area (Armada 2004). These indicators of overfishing, as mentioned by Armada (2004) can be associated with the current status of the commercial fisheries of Visayan Sea. Results of this present study indicate that catch and catch rates in the Visayan Sea have declined. The decline can be related with the “voluntary reduction” in the number of fishing boats operating in the Visayan Sea where income generated from fishing cannot compensate the cost of fishing operation expenses. Another indicator of overfishing in the area is the appearance of squids in the bulk of catch of Danish seine and otter trawl, which indicates a shift in the fish species composition of Visayan Sea. Growth and recruitment overfishing among major fish species is proven with the following results: exploitation rate is greater than Eopt at 0.5, length at first captivity is smaller than length at first maturity, and terminal E values from mortalities exceeded E.1.
Assessment of the Commercial Fisheries of Western and Central Visayan Sea
41
RECOMMENDATIONS
Based on the results of this study, the following points are considered to address the current fisheries status of Visayan Sea: 1) There is a need to conduct a data system profiling such as the Geographic Information System (GIS), and assessment of the municipal fisheries of Visayan Sea for Regions 5, 6 and 7, including the conduct of a total inventory of fishing boats and gear in all coastal areas. These data will be incorporated with the commercial fishery assessment studies to draw a more general picture of the fisheries status of Visayan Sea.
2) Species-specific results, such as biological parameter estimates, showed the exploited status of small pelagic resources of Visayan Sea. The multispecies nature of the fishing ground poses difficulties related to resource management measures. Mesh size selectivity studies are necessary in the formulation of more appropriate control measures to safeguard the stability of a certain fishery. Another point to consider is the reduction of fishing effort in terms of the number of fishing boats operating in the Visayan Sea. Since the maximum sustainable yield (MSY) is not yet established, reduction of effort could be done thru controlling the number of fishing boat license for new and renewal licensees. Operation of a certain fishing vessel in terms of number of fishing days is another point to consider. This could be addressed thru the implementation of a coding system. 3) To address the fishery resource depletion of Visayan Sea, there should be a collaborative effort among local government units (LGUs) and other concerned agencies to come up with an inter-regional approach and policies for the proper management and conservation of the Visayan Sea fisheries resources.

Assessment of the Commercial Fisheries of Western and Central Visayan Sea
42
REFERENCES
Allen, G. R. and R. Swainston. 1998. The Marine Fishes of the
Northwestern Australia. A Field Guide for Anglers and Divers. Western Australian Museum, Perth, Western Australia. 201 p.
Aprieto 1976 Aprieto, V., J. Saeger and D. Pauly (eds.). 1986. Selected papers on
Philippine marine fisheries resources (1947-1986). Technical Reports of the Department of Marine Fisheries No. 9. College of Fisheries, University of the Philippines in the Visayas. p. 3-60, 125-136.
Aprieto, V. L. and E. Villoso. 1979. Catch composition and relative
abundance of trawl-caught fishes in the Visayan Sea. Fish. Res. J. Philipp. 4(1): 9-18.
Arce, F. M. 1986. Distribution and relative abundance of nemipterids and
carangids (Pisces: Nemipteridae and Carangidae) caught by trawl in the Visayan Sea with notes on the biology of Nemipetrus oveni and Selaroides leptolepis. Philipp. J. Fish. 19(1-2): 24-75.
Armada, N. B. 2004. State of demersal fisheries. In: Department of
Agriculture-Bureau of Fisheries and Aquatic Resources (DA-BFAR), In Turbulent Seas: The Status of Philippine Marine Fisheries, p. 42-46. Coastal Resource Management Project (CRMP), Cebu City, Philippines. 378 p.
Barut, N. C., M. D. Santos and L. R. Garces. 2004. Overview of the
Philippine marine fisheries. In: DA-BFAR, In Turbulent Seas: The Status of Philippine Marine Fisheries, p. 22-31. CRMP, Cebu City, Philippines. 378 p.
Beverton, R. J. H. and S. J. Holt. 1956. A review of methods for estimating
mortality rates in exploited fish populations with special reference to sources of bias in catch sampling. Rapp. P.v. Reun. CIEM 140: 67-83.
____. 1957. On the dynamics of exploited fish populations. Fish. Invest. Ser.
II 19: 533 p. BFAR (Bureau of Fisheries and Aquatic Resources). 2000. Philippine
fisheries profile for year 2000. BFAR, Quezon City. BFAR Regional Office 6. 2001. National Stock Assessment Project (NSAP)
files, 1998-2001. BFAR Regional Field Office 6, Iloilo City. Dalzell, P. and R. Ganaden. 1987. A review of the fisheries for small pelagic
fishes in the Philippine waters. BFAR Tech. Paper Ser. 10(1): 54 p.

Assessment of the Commercial Fisheries of Western and Central Visayan Sea
43
FAO (Food and Agriculture Organization of the United Nations). 1998. Yearbook of Fisheries Statistics. FAO, Rome, Italy.
Froese, R. and D. Pauly (eds.). 2000. Fish Base 2000: concept, design, and
data sources. ICLARM, Los Baños, Laguna, Philippines. 344 p. Gayanilo, F. C. Jr. and D. Pauly. 1997. FAO-ICLARM Stock Assessment
Tools, Reference Manual. FAO and International Center for Living Aquatic Resources Management (ICLARM), Rome. 219 p.
Gayanilo, F. C. Jr., P. Sparre and D. Pauly. 1996. FAO-ICLARM Stock
Assessment Tools (FISAT): User’s Manual. FAO Computerized Information Series (Fisheries) No. 8. Rome, FAO. 126 p.
Gonzales, C. L., J. C. Muñoz, A. R. Tañedo and F. N. Lavapie. 1981. Report
on the first fishery survey of the Visayan Sea. Guanco, M. R. 1991. Growth and mortality of Indian mackerel, Rastrelliger
kanagurta (Scombridae) in the Visayas Sea, Central Philippines. Fishbyte (Newsletter of the Network of Tropical Fisheries Scientists) 9(2): 13-15.
Hermes, R., N. B. Armada, R. A. Aparri, E. C. Zaragoza and U. Lohmeyer.
2004. Overexploitation in the Visayan Sea: designing a project solution. In: DA-BFAR, In Turbulent Seas: The Status of Philippine Marine Fisheries, p. 312-317. CRMP, Cebu City, Philippines. 378 p.
Lavapie-Gonzales, F., S. R. Ganaden and F. C. Gayanilo, Jr. 1997. Some
Population Parameters of Commercially Important Fishes in the Philippines. Bureau of Fisheries and Aquatic Resources, Philippines, 114 p.
Mansor Mat Isa. 1998. Field Guide to Important Commercial Marine Fishes
of the South China Sea. Marine Fishery Resources Development and Management Department. South-East Asian Fishery Development Center, Chendering, 21080 Kuala Terengganu, Malaysia. 285 p.
Ordoñez, J. A. 1985. A study of the trash fish caught by otter trawl in the
Visayan Sea. Philipp. J. Fish. 18(1-2): 1-76. Pauly, D. 1984. Length converted catch curves: a powerful tool for fisheries
research in the tropics (part II). ICLARM Contribution No. 173. ICLARM, Metro Manila, Philippines, p. 74-76.
Pauly, D. and J. Ingles. 1984. Atlas of the Growth, Mortality and Recruitment
of the Philippine Fishes. Institute of Fisheries Development and Research, College of Fisheries, University of the Philippines, Diliman, Quezon City, and ICLARM, Metro Manila, Philippines.
Assessment of the Commercial Fisheries of Western and Central Visayan Sea
44
Pauly, D. and N. A. Navaluna. 1983. Moonsoon-induced sseasonality in the recruitment of Philippine fishes. FAO Fish. Rep. 291(10): 823-833.
Pauly, D., M. L. Palomares and F. C. Gayanilo. 1987. VPA estimates of the
monthly population length composition, recruitment mortality, biomass and related statistics of Peruvian anchoveta, 1951-1981. In: D. Pauly and I. Tsukayama (eds.), ICLARM Studies and Reviews 15: 142-166.
Rasalan. S. B. 1957. Marine fisheries of Central Visayas. Philipp. J. Fish.
5(1): 53-89. Sparre, P. and C. Venema. 1992. Introduction to tropical fish assessment.
Part I - Manual. FAO Fish. Tech. Paper No. 306.1, Rev.1, FAO.1992. 376 p.
Tandog-Edralin, D., S. R. Ganaden and P. Fox. 1988. A comparative study of fish mortality rates in moderately and heavily fished areas of the Philippines. In: Contributions to Tropical Fisheries Biology: Papers by the Participants of FAO/DANIDA Follow-up Training Courses, edited by S. Venema, J. Moller-Christensen and D. Pauly. FAO Fisheries Report (389): 468-481.
von Bertalanffy, L. 1934. Untersuchungen über die Gesetzlichkeiten des
Wachstums 1. Allgemeine Grundlagen derTheorie. Roux’ Arch. Entwicklungsmech. Org. 131: 613-653.
Warfel, H. E. and P. R. Manacop. 1950. Otter trawl explorations in Philippine
waters. Research Report 25, Fish and Wildlife Service, U.S. Dept. of the Interior. Wash. D. C.: U.S. Gov’t. Printing Office. 49 p.