visclim - visualisation of climatological data · chapter 1 introduction the application called...
TRANSCRIPT
VisClim - Visualisation ofClimatological Data
Student Project
Markus Kobel
January 2004
Supervised by:
Dr. Michele LanzaProf. Dr. Oscar Nierstrasz
Institute of Computer Science and Applied MathematicsUniversity of Berne, Switzerland

The address of the customer:
Climatology/Meteorology Research GroupUniversity of BernInstitute of GeographyHallerstrasse 12CH-3012 Bern
The address of the author:
Markus KobelHindelbankstrasse 21CH-3325 Hettiswil
or
Software Composition GroupUniversity of BernInstitute of Computer Science and Applied MathematicsNeubr̈uckstrasse 10CH-3012 [email protected]://www.iam.unibe.ch/˜kobel/

Abstract
In this project, we developed a tool for generating videosequences from geographicaldata (temperature, sea level pressure, 500hPa geopot., ...). The customer for this ap-plication (called VisClim) is the Climatology/Meteorology Research Group (Climet)from the Institute of Geography of the University of Berne. They maintain a databasewhich contains earth science data for the time span from 1500 until today. VisClim isable to load netCDF files and generate videosequences from the data in these files.
1

Contents
1 Introduction 5
2 Description 6
2.1 Customer - Motivation for this Project. . . . . . . . . . . . . . . . . 6
2.2 Used Components. . . . . . . . . . . . . . . . . . . . . . . . . . . . 6
2.2.1 GrADS . . . . . . . . . . . . . . . . . . . . . . . . . . . . . 6
2.2.2 JMF - Java Media Framework. . . . . . . . . . . . . . . . . 7
2.2.3 NetCDF Data Format. . . . . . . . . . . . . . . . . . . . . . 7
2.2.4 NetCDF Java Library. . . . . . . . . . . . . . . . . . . . . . 8
2.3 VisClim - Visualisation of Climatological Data. . . . . . . . . . . . 8
2.4 Technical Program Run. . . . . . . . . . . . . . . . . . . . . . . . . 8
2.5 System Overview. . . . . . . . . . . . . . . . . . . . . . . . . . . . 9
2.6 Possible Extensions. . . . . . . . . . . . . . . . . . . . . . . . . . . 10
3 User Documentation 11
3.1 Main View. . . . . . . . . . . . . . . . . . . . . . . . . . . . . . . . 11
3.2 Preferences. . . . . . . . . . . . . . . . . . . . . . . . . . . . . . . 13
3.3 Loading Files . . . . . . . . . . . . . . . . . . . . . . . . . . . . . . 15
3.3.1 NetCDF. . . . . . . . . . . . . . . . . . . . . . . . . . . . . 15
3.3.2 Video . . . . . . . . . . . . . . . . . . . . . . . . . . . . . . 15
3.3.3 Picture . . . . . . . . . . . . . . . . . . . . . . . . . . . . . 15
3.4 Storing Files. . . . . . . . . . . . . . . . . . . . . . . . . . . . . . . 15
3.4.1 NetCDF. . . . . . . . . . . . . . . . . . . . . . . . . . . . . 15
3.4.2 Video . . . . . . . . . . . . . . . . . . . . . . . . . . . . . . 16
3.4.3 Picture . . . . . . . . . . . . . . . . . . . . . . . . . . . . . 16
3.5 Generating Pictures. . . . . . . . . . . . . . . . . . . . . . . . . . . 16
3.6 Generating Videos. . . . . . . . . . . . . . . . . . . . . . . . . . . 16
3.7 Example of a Program Run. . . . . . . . . . . . . . . . . . . . . . . 17
2

4 Conclusions 18
4.1 Development Process. . . . . . . . . . . . . . . . . . . . . . . . . . 18
4.2 Personal Impressions. . . . . . . . . . . . . . . . . . . . . . . . . . 18
3

List of Figures
2.1 Overview of used Components.. . . . . . . . . . . . . . . . . . . . . 7
3.1 MainView of VisClim after launching.. . . . . . . . . . . . . . . . . 11
3.2 MainView of VisClim while generating a video file.. . . . . . . . . . 12
3.3 Preferences - General Settings.. . . . . . . . . . . . . . . . . . . . . 13
3.4 Preferences - GrADS Settings.. . . . . . . . . . . . . . . . . . . . . 14
3.5 Preferences - Picture Settings.. . . . . . . . . . . . . . . . . . . . . 14
3.6 Generate Video Dialog.. . . . . . . . . . . . . . . . . . . . . . . . . 16
4
Chapter 1
Introduction
The application called VisClim (Visualisation of Climatological data) along with thisdocument is the result of a project work of the Software Composition Group in conjunc-tion with the Climatology/Meteorology Research Group of the University of Berne.
The purpose of this document is it to give the reader a short and simple overview of thetechnical aspects of the application and also to provide a user manual for VisClim.In Chapter2, the customer will be introduced and the purpose of VisClim and the usedtechnologies will be illustrated. There are also some technical explanations about theused components and their role in VisClim. One can find a documentation for the userof VisClim in Chapter3. All functions and preferences of VisClim are described there.It illustrates how to load files, generate pictures and videos, and how to handle all otherfeatures of this application. Finally, there are some conclusions of the developmentprocess and some personal impressions in Chapter4.
5
Chapter 2
Description
2.1 Customer - Motivation for this Project
The Climatology/Meteorology Research Group (Climet) collected and restored a lotof geographical data for the time span from 1500 until today. All this data is storedin a database. People from the Climet group work with this informations and makecalculations based on this data. They were not able to visualise these information in asimple and useful way. Until now, they just made some pictures of interesting points intime. The idea of this project is to visualise the information using pictures and movies.
2.2 Used Components
In this application there are three main components that work together: the Grid Analy-sis and Display System (GrADS), the Java Media Framework (JMF) andVisClimitself.Figure2.1shows how these components are connected. As input, VisClim can handledifferent kind of earth science data (in form of netCDF files). Then it generates othernetCDF files out of the original ones and creates also script files which can be processedby GrADS. GrADS builds up the requested pictures according to the script files. Afterthat, VisClim takes these pictures and generatesQuickTime moviesout of them usingthe JMF.In the following sections, all of these components are described in more detail.
2.2.1 GrADS
We needed a tool for generating pictures from the geographical data. We have chosenthe freely availableGrid Analysis and Display System (GrADS)1 because that applica-tion is well known by the people of the Climet group and they have been using it for along time.GrADS is an application which can visualise earth science data. It can handle differentkinds of data, such as the netCDF format. GrADS may be run in batch mode (with-out graphics output window) and then process script files. So, we just generate the
1http://grads.iges.org/grads/
6

Figure 2.1: Overview of used Components.
needed script file with VisClim and then run GrADS in batch mode in the background.Unfortunately, GrADS is quite an old application without the possibility to access itsfunctions through an API.
2.2.2 JMF - Java Media Framework
We also needed something that is able to generate video files. We have chosen theJavaMedia Framework API (JMF)2 which is freely available.The JMF is a package which can handle time-based media like video and audio. Itprovides various functionality to capture, playback, stream, and transcode multiplemedia formats. For this project we only used the possibility to generate a video file outof a bunch of picture files. [SUN 99]
2.2.3 NetCDF Data Format
We had to decide which data format we want to support primarily. We picked out thenetCDF data format because in the future, this will be the most used format for earthscience data as the people of the Climet group said. There is also aNetCDF JavaLibrary3 freely available which we used in VisClim as well.
NetCDF is intended for ”self-documenting data”. There are different ways to struc-ture the data in a netCDF file. A netCDF file is a collection of dimensions, attributes,and variables:
• Dimension: A dimension is a named array index which consists of a name and alength. The length may be ’unlimited’ - if this is the case, the length can increase,
2http://java.sun.com/products/java-media/jmf/3http://www.unidata.ucar.edu/packages/netcdf-java/
7

otherwise it is immutable. There may also be a ’coordinate variable’ associatedwith a dimension - this is a variable with the same name as the dimension, whosesingle dimension is that dimension (for example: float lat(lat)).
• Attribute: An attribute is a (key, value) pair where the key is a String and thevalue is a String, Number or Number[] (in this context valid subclasses of Num-ber are Byte, Double, Float, Integer or Short).
• Variable: A variable is a multidimensional array, which has a name and a col-lection of dimensions and attributes. Variables are the place where the data isstored. The data will only be read out of the file, when you request it (not al-ready when you load the file). This circumstance makes it possible to read thedata out of the file through a simple stream, for example through a http-streamfrom a remote server.
2.2.4 NetCDF Java Library
Through the Java API it is possible to read out all the needed data from a netCDF fileand to write new files. The restriction is that once the structure of a file is written itis not possible to alter it. That means, after defining variables and its dimensions, itis only possible to fill up this structure with data, but it is for example not possible todefine another dimension for a variable anymore. [CARO 03]
2.3 VisClim - Visualisation of Climatological Data
VisClim is supposed to become a helper application for the people of the Climet group.The goal is to generate pictures and movies from their earth science data. The graphicaluser interface of VisClim should be simple and the whole application should offer highusability.VisClim may then reduce the time that is needed between getting earth science dataand gaining an overview of the meaning of that data.VisClim uses, executes, and sometimes depends on all of the components mentionedbefore. It would be possible to use VisClim without the JMF to generate pictures (butnot videos). If GrADS is not available, VisClim can only be used to truncate netCDFfiles (without the possibility of visualising any data).VisClim can be seen as the glue between the individual components. The user uses asimple interface to generate the pictures and videos without the need of writing scriptfiles or using some painful command line interfaces.
2.4 Technical Program Run
The purpose of this section is it to describe in a short way, how VisClim works and inwhich order the different components are used when we want to generate a video file.
1. When we load a netCDF file into VisClim, there will be instantiated aNetCDF-Wrapperwhich is realized as a singleton in this application, because there wasno need to load more than one file at the same time.
8

2. After specifying the data to visualise and starting the video generation, VisClimreads the selected intervals of time, latitude and longitude and gives them to anew instance of aNetCDFWriterand aScriptWriter.
3. These writers create a new netCDF file and a script file for GrADS. This newnetCDF file only contains the data of the selected sections.
4. As soon as these files are available, GrADS will be executed in batch mode(no graphics output window is opened) with the generated files as input. WhenGrADS processes the script file, it generates the needed pictures.
5. VisClim waits until all the needed files are generated. Then, a list of these pic-tures is given to an instance of aVideoWriter, which will concatenate these pic-tures to a movie using the JMF. This video writer is executed in a new thread inorder not to block the user interface of VisClim.
6. When the movie is finished, the writer notifies VisClim of this fact. Depend-ing on the options that we have chosen in the generate video dialog (see alsoSection3.6), VisClim will either open the movie in a new frame with its inter-nal player or execute the preferred player with the movie file as an argument orVisClim will do nothing at all.
2.5 System Overview
We used theJava 2 Software Development Kit (J2SDK), Standard Edition, Version1.4.2X4 in order to develop VisClim.The whole system consists of 6280 lines of code. That code is divided into severalpackages. The most important ones (without test- and exception-packages) are shownin Table2.1.
Package TotalClasses
AbstractClasses
ConcreteClasses
AfferentCouplings
EfferentCouplings
visclim 1 0 1 0 5visclim.controller 8 1 7 1 10visclim.io 7 0 7 3 22visclim.util 1 0 1 4 4visclim.view 27 0 27 3 18visclim.view.util 4 0 4 1 3
Table 2.1: Overview of the most important packages of VisClim.
Efferent Couplings: The number of other packages that the classes in the packagedepend upon is an indicator of the package’s independence.Afferent Couplings: The number of other packages that depend upon classes withinthe package is an indicator of the package’s responsibility.
4http://java.sun.com/j2se/1.4.2/
9
2.6 Possible Extensions
There are many things that could be done in order to extend the usefulness of VisClim.Here are some ideas:
• Importer for different formats (gdx, lola, ...).
• Support for netCDF files which contain variables with more than three dimen-sions.
• Support for different video output formats (avi, mpeg, ...).
• Use of other visualisation tools than GrADS (FERRET, ...).
• Optimisation of the video generation (needed space, needed time).
10

Chapter 3
User Documentation
3.1 Main View
When VisClim has been started, theMainView(as shown in Figure3.1) is displayed onthe screen.
Figure 3.1: MainView of VisClim after launching.
11

Figure3.2shows that the MainView is separated into different parts:
1 The menu bar of this application.
2 The toolbar with some icons on it for fast access to the most used functions (loada netCDF file, save a netCDF file, open preferences window, exit VisClim). Thetoolbar may be dragged to another place if needed.
3 The path of the file which is actually loaded is displayed here.
4 This combo box is only used, when the loaded netCDF file contains more thanone variable that can be used for visualisations. If there is only one such variable,this combo box will be disabled by VisClim.
5 There are three similar parts: combo boxes for choosing the start and end valueof Time, LatitudeandLongitude. With them, we can choose the time intervalto use for generating a video file and we have control over the region on earthwhich will be visulised.
6 The two buttons which are used for generatingpicturesandvideos.
7 The progress bar shows the state while generating video files.
8 The status bar shows some information about the state of VisClim or about theactions that are performed.
Figure 3.2: MainView of VisClim while generating a video file.
12
3.2 Preferences
The Preferences of VisClim are partitioned into three sections: general settings, GrADSsettings and picture settings.
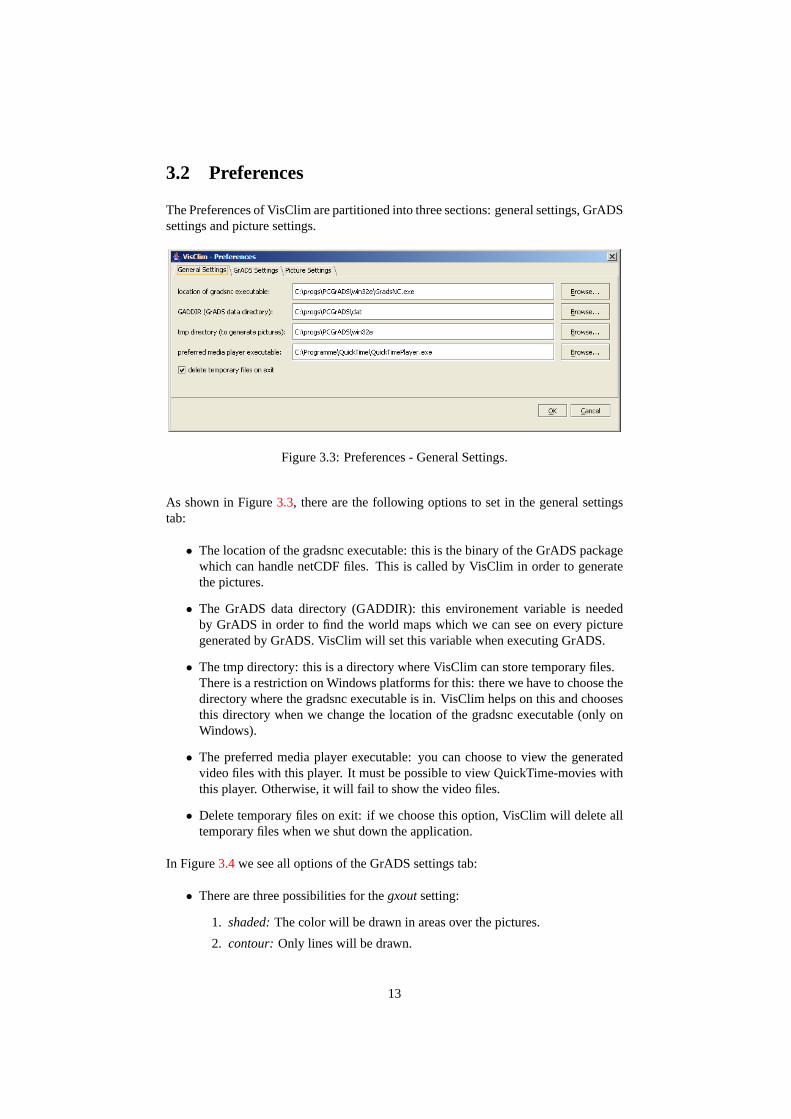
Figure 3.3: Preferences - General Settings.
As shown in Figure3.3, there are the following options to set in the general settingstab:
• The location of the gradsnc executable: this is the binary of the GrADS packagewhich can handle netCDF files. This is called by VisClim in order to generatethe pictures.
• The GrADS data directory (GADDIR): this environement variable is neededby GrADS in order to find the world maps which we can see on every picturegenerated by GrADS. VisClim will set this variable when executing GrADS.
• The tmp directory: this is a directory where VisClim can store temporary files.There is a restriction on Windows platforms for this: there we have to choose thedirectory where the gradsnc executable is in. VisClim helps on this and choosesthis directory when we change the location of the gradsnc executable (only onWindows).
• The preferred media player executable: you can choose to view the generatedvideo files with this player. It must be possible to view QuickTime-movies withthis player. Otherwise, it will fail to show the video files.
• Delete temporary files on exit: if we choose this option, VisClim will delete alltemporary files when we shut down the application.
In Figure3.4we see all options of the GrADS settings tab:
• There are three possibilities for thegxoutsetting:
1. shaded:The color will be drawn in areas over the pictures.
2. contour: Only lines will be drawn.
13

Figure 3.4: Preferences - GrADS Settings.
3. grid: There will be drawn squares with the values inside.
• Thegrid can be turned on or off.
• Gradscan be turned on or off. If this is on, then GrADS will print its name andthe date and time of the picture generation on every image.
• If run cbarnis set to yes, there will be a color bar printed on every image. Thiswill only work when the gxout setting is set to shaded.
Figure 3.5: Preferences - Picture Settings.
There are also some picture specific options to set, as shown in Figure3.5:
• As title for the pictures we can choose any value plus some special variables.The variables will be replaced by VisClim. The following variables are possible:
– $VAR NAME will be replaced by the name of the actual variable.
– $FRAME NR will be replaced by the number of the frame in the video (ifwe just produce pictures, this will be 1 for every picture).
14

– $DATE will be replaced by the right date/time value. The values will bethe same as the ones we see in the MainView on the time axis.
• The resolution in pixelof the pictures. There are some standard resolutions tochoose (320x240, 640x480, 800x600, 1024x768, 1280x1024). They may bechanged to any value by the way.
• Thebackgroundcolor of the pictures can be set to white or black.
• The optionuse extended longitudeis used for duplicating the longitude values.With this it is possible to get pictures which show the whole world twice. Therestriction here is, that the loaded file must contain longitude values which gofrom 0 to 360 degrees.
3.3 Loading Files
3.3.1 NetCDF
In order to load a netCDF file into VisClim, we can chooseLoad NetCDF File...fromtheFile menu or click on the appropriate icon on the toolbar. The file we want to loadhas to be a netCDF file. If it is not such a file, VisClim won’t open it.We may load almost every netCDF file into VisClim, but we can’t generate visualisa-tions from all of them. If we want some visualisations, the file has to contain at leastone variable with exactly three dimensions namedtime, lat, andlon.
3.3.2 Video
We can open some video files in VisClim itself and look at them with the internal playerof this application. The internal player is very simple. In order to open a video file, wejust chooseOpen Video...from theFile menu. The video file will be opened in a newframe.
3.3.3 Picture
We may display all generated images in VisClim. If we chooseOpen Picture...fromthe File menu a filechooser will appear. The file we choose will be opened in a newframe.
3.4 Storing Files
3.4.1 NetCDF
Storing netCDF files is used for truncating large files. If we load a file into VisClim andchooseSave NetCDF File...from theFile menu (or click on the appropriate icon onthe toolbar), VisClim will store just the selected sections (time, latitude, and longitude)of the selected variable into the new file.
15

3.4.2 Video
VisClim uses a standard path for storing its generated video files (they will be storedin the tmp directory). However, this path may be changed, before a video will begenerated. Please refer to the Section3.6.
3.4.3 Picture
Generated Pictures may be stored as png files. In order to do that, we just chooseSaveas...from theFile menu of the frame which contains the image we want to store. Thismakes it possible to generate some pictures and then (probably after comparing them)only store some of them.
3.5 Generating Pictures
For generating a picture, we only have to click on theGenerate Picturebutton in theMainView (see also Figure3.1) after loading a netCDF file into VisClim. VisClimwill always take theStart Timevalue for knowing which time to use for the generatedpicture. It also takes into account the values ofLatitudeandLongitude.
3.6 Generating Videos
Figure 3.6: Generate Video Dialog.
When we click on theGenerate Videobutton, VisClim takes the given time intervalfor generating a video file. Before the generation starts, a dialog will open up whichis shown in Figure3.6. Here we may choose another path for storing the file thanthe standard path. Also, we may choose to look at the video immediately after itsgeneration. To do so, we just have to select a player for viewing the file. We havethe choice between theInternal Playerof VisClim and thePreferred Playerwhich wecan set in the preferences (see also Figure3.3). If there is no preferred player set, thisoption won’t be available.
16

3.7 Example of a Program Run
The purpose of this section is it to describe, what we have to do when we want to gen-erate a video file.
1. We click theLoad a NetCDF Fileicon and choose the file which contains thedata we want to visualise.
2. We specify the time interval and the region (latitude and longitude) and clickthen theGenerate Videobutton.
3. The dialog shown in Figure3.6 is opened and we specify another location forthe video file and choose to look at movie after its generation with our preferredplayer.
4. When the video file is finished, our preferred player opens up and shows thegenerated movie.
17

Chapter 4
Conclusions
4.1 Development Process
The development of VisClim started in the beginning of July 2003 and ended in Jan-uary 2004. We used theConcurrent Versions System (CVS)1 as our code repository.For building the system, we first usedAnt2 and as the application evolved we switchedto Maven3. It was pleasant to work on the project with the knowledge that we can goback to any prior version if needed. With the help of Maven, we were also regularlyinformed about the actual state of the project, recent changes, compile problems, andmany more (for more informations, we refer to the Maven homepage, where all pluginsare described).When the project started, we wanted to have a running prototype as soon as possible inorder to see that all the components we had chosen (see also Chapter2) work together.In order to reach that goal, we first created animated gifs from the generated pictures.But with this approach, it would not be possible to run VisClim on a normal worksta-tion without a very fast processor and without a lot of memory. That was the reasonthat we brought the JMF (Java Media Framework) into the project. The next milestonewas to generate QuckTime movies with the aid of the JMF. We reached that goal at thebeginning of August 2003.An important part of the whole process were the regular demo sessions with the cus-tomer. We met all two to three weeks for showing the new functionalities and for get-ting feedback. These short iterations were helpful for us, because we almost instantlyknew if we fulfil the expectations of the customer.
4.2 Personal Impressions
It was a new experience for us to work with so many external resources. We had to readand learn a lot about some foreign frameworks and applications. In a social way, wehad to communicate with an external customer who not always thought the same wayas we did. We were able to handle these differences because of our frequent meetings.
1http://www.cvshome.org/2http://ant.apache.org/3http://maven.apache.org/
18

In general, we are quite satisfied with the development process and the result. Wewould not change many things in a next project. Maybe we would extend the time forevaluating the possible technology at the beginning of the project. But according toTom DeMarco and Timothy Lister, that doesn’t matter that much:The major problemsof our work are not so much technological as sociological in nature. [DEMA 99]
At the moment, we do not really know, what will happen with this application. Thepeople of the Climet group use VisClim right now in order to visualise the data theycollected and restored. They also plan to extend VisClim in the future. But there is noone that is officially resposible for the maintenance of that project. If we know moreabout the future of VisClim, we will publish that on our actualproject homepage4.There are also links to our CVS repository and to some geographical resources.
4http://www.iam.unibe.ch/˜kobel/project.html
19
Bibliography
[CARO 03] J. Caron.NetCDF Java (version 2.1) User’s Manual, 2003. (p 8)
[DEMA 99] T. DeMarco and T. Lister. Peopleware, Productive Projects and Teams.Dorset House, 2nd edition, 1999.(p 19)
[SUN 99] Sun Microsystems, Inc.Java Media Framework API Guide, November1999. (p 7)
20