vision 2020: sustainability of india's material resources€¦ · vision 2020: sustainability...
TRANSCRIPT
Vision 2020: Sustainability of India's
Material Resources
by
R K Pachauri and Pooja Mehrotra
TERI, New Delhi
1
Introduction Economic growth the world over has been driven by energy, whether in the form of
primary sources (such as finite resources—for example, coal and oil and gas, or
renewables, wood, hydro) or its converted form, electricity. The pattern of their utilization
of inputs for driving various industries has impacted our natural resources—the air,
water, land, forests, and biodiversity. Signs of this impact, in case of India, as also in
other countries, have led to substantial efforts in rethinking our development path. For
future growth to be sustainable, it needs to be resource-efficient and environmentally
accountable, requiring a long-term vision while planning for the immediate and long-
term future. This has been the drive for rethinking India’s future. Vision 2020 exercise
undertaken by the Planning Commission, Government of India, is a right step in that
direction.
It is well known that various sectors in the economy such as the agricultural,
domestic and commercial sectors, municipal services, transport services, the mining
industry, manufacturing industries, and the power industry are most heavily dependent
on finite resources. They have the maximum impact on the environment. Apart from
dependence on finite resources, most of these sectors are dependent on energy. In this
paper we would restrict our detailed discussion to the power sector, coal, oil and gas,
and renewable energy; and discuss the impact of their development on air, water, land,
forest, and biodiversity. The strategy to achieve an alternative sustainable scenario with
respect to the sectors are not discussed in detail but are included in Annex 1.
Power industry In India, like in any other country, power consumption is expected to rise with economic
growth and social development. At the same time, high environmental costs in the form
of water and air pollution, soil erosion, deforestation, loss of biological diversity, etc.
associated with increased resource extraction and power generation, pose a threat to
ecological security and human health. This section will investigate ways to achieve
sustainable growth in the power industry by 2020.

2
The power industry in India has registered significant progress since the inception of
the economic planning process in 1951. Installed capacity grew from about 1360 MW in
1947 to about 101 630 MW by 31 March 2001. (Figure 1 shows the growth in installed
capacity and the change in fuel mix from 1970/71 to 1998/99.) Development of
infrastructure in rural areas has also received due emphasis: about 85% of the villages
have access to grid electricity, though fraught with problems of erratic supply and low
voltage. Despite the significant progress, this sector is associated with poor performance,
and serious social and environmental issues. Figure 1 Total installed capacity and fuel mix
Source TEDDY, various years
Performance issues
Several reasons are often cited for the poor performance of power sector, some of which
are outlined in the following.
� Poor financial condition of the SEBs (state electricity boards) are due to a)
unremunerative tariff structure—subsidized domestic and agricultural consumption
(which accounts for almost 50% of the total), b) poor billing and collections, c)
growing preference of the industrial sector (major contributor to the revenues of
SEBs) for captive generation because of high cost and poor power quality, and d) high
T&D (transmission and distribution) losses—due to pilferage and theft of electricity,
weak and inadequate sub-transmission and distribution systems, large-scale rural
electrification programme involving long low-tension lines, and inadequate
investment in upgrading and maintenance.
� Financial constraints leading to poor plant maintenance, adversely affecting plant
availability and system efficiency.
� Insufficient generation of resources on an installed capacity basis and lack of the
right kind of capacity to meet demand. Declining share of hydro has adversely
affected the performance of thermal plants in some regions.
� Inadequate transmission capacity to link different regions.
Environmental and social issues
10 0
80
60
40
20
0
In stalled capacity (% )100
90
80
70
60
50
40
30
20
10
0
To tal installed capa city Ca pacity (G W )Nuclear
G as-based th erm al
Hydro
Coal-ba sed th erm al
O il-b ased therm al
197 0/71
197 5/76
1980/81
198 5/86
1990/91
1995/96
1998/99
Year

3
In addition to the above performance issues, there are serious environmental and social
issues with power sector development. Coal-based thermal power constitutes 62% of
total power generation, accounting for almost 75% of the total coal used. High ash
content of Indian coal results not only in poor performance of thermal power stations
and their high O&M (operation and maintenance) costs, but also production of 7–8 times
more ash than in European countries. In addition, there is pollution from suspended
solids and oil including grease present in the effluent and the discharge of water at high
temperature from thermal power plants. Solid waste in the form of fly ash, the land
required for its disposal, percolation of hazardous elements to groundwater through ash
ponds, and greater incidence of pulmonary diseases in the vicinity of the dumps due to
air-borne ash, are some of the major problems in this regard.
In contrast, large-scale dislocation of people, submergence of valuable resources
including forests, loss of estuaries and endangered species, adverse impacts on
downstream hydrology, and siltation rendering dams ineffective in a short period are
problems associated with hydropower. On the positive side, multipurpose hydro projects
facilitate better management of water resources by storing water in times of surplus and
dispensing with it in times of scarcity. Dams prevent or control devastating floods and
catastrophic droughts as seen in river valley projects.
Nuclear power is associated with fears of radioactive leakage/accidents, disposal of
radioactive waste, and decommissioning of power plants. However, in the wake of rising
concerns about global warming, it is perhaps a greener option—the Uranium Information
Centre claims that in 1997, 349 350 MWe of nuclear energy generated worldwide
prevented 2270 million tonnes of CO2 emissions. Interestingly, India’s reserves of
nuclear fuels are sufficient to generate more than 300 000 MWe (CEA 1997), and it has
achieved expertise and maturity in nuclear technology.
Business-as-usual scenario
Based on the assumptions (see Annex 3), the aggregate future demand and fuel mix
(assuming different load factors) for power sector have been calculated and are indicated
in Table 1 and 2, while the demand for coal, oil, and gas are shown in Table 3. Table 1 Projected power demand (TWh) of various sectors in the BAU scenario Year Industry Transport Agriculture Commercial Residential Total 1997 137 7 89 47 48 329 2020 570 22 202 262 165 1221
Note Future demand from the agriculture, industry, transport (railways), and commercial sectors is estimated on the basis of past trends in electricity intensities and their relationship with sectoral GDP. For the residential sector, demand projection is based on an assessment of the changing fuel mix on account of the upward movement along the energy ladder and improvements in rural electrification. Projections are based on restricted consumption data: the inherent unmet demand has not been taken into account.
Table 2 Fuel mix: installed capacity and generation in the BAU scenario Fuel mix (%)

4
Year Thermal Hydro NuclearRenewables Hydro (imports) Installed capacity (GW) 1997 90 71.3 24.4 2.5 1.3 0.4 2020 292 70.1 13.8 4.5 6.4 5.3 Generation (TWh) 1997 426 79.0 17.5 2.4 0.8 0.3 2020 1550 81.2 7.7 4.5 3.2 3.5
Table 3 Demand for fossil fuels for power generation in the BAU scenario Coal (million tonnes) Oil Gas Year Domestic Imported (million tonnes) (billion cubic metres) 1997 230 0 3 8 2020 375 147 15 27
There are several concerns if we consider the BAU (business-as-usual) scenario. These
are:
� High level of electricity intensity is unsustainable as countries with per capita income
comparable to that projected for India have achieved lower electricity intensity levels.
� T&D losses, assumed to decrease, are still high in comparison with those in the
developed countries. These losses, both commercial and technical, result in poor cost
recovery and unproductive energy generation.
� Poor financial performance hinders the sector’s ability to import such cleaner
alternatives as hydro and natural gas, which could be used for power generation.
Despite its abundant potential in the region, imported hydropower meets a small
fraction of the total demand while dependence on imported coal rises, which in turn
results in further deterioration of environmental quality due to SPM (suspended
particulate matter) and fly ash.
� Increase in the share of thermal and a drop in the share of hydropower will adversely
affect the availability of peak power, leading to grid imbalance, which will be more
acute in the eastern and western regions where the share of hydropower is limited.
� Despite their abundance, renewable energy sources account for only 3% of the
generation requirement.
These concerns in the BAU scenario obviously call for a look at new directions,
innovations, and strategies that might lead to a sustainable alternative. These are
discussed as follows (see Annex 4 for various assumptions).
Directions, innovations, and strategies Short-term strategies
Renovation and modernization (R&M) of power plants
R&M can, in certain cases, effectively increase a power plant’s capacity at one-fourth the
cost of new generation. This, in turn, reduces the emissions of pollutants and GHGs
(greenhouse gases) apart from increasing capacity and reducing fuel consumption. While

5
promotion schemes may be needed today, these could be phased out once competition in
generation is introduced.
T&D improvement
The present T&D losses need to be reduced to about 8%. There is a need to establish
norms and use performance-based regulation to induce T&D companies to make the
required investments.
National grid
A national grid system will reduce the current imbalance in power generation and
consumption between regions and promote optimal use of power resources by facilitating
inter-regional exchange of surplus energy, both seasonal and off-peak. The Centre’s plan
of developing a national grid system should be expedited using the regulatory bodies to
evolve suitable incentives.
Cleaner and more efficient generation technologies
Technological change will be driven by environmental factors, which, in turn, would
reduce capital and operating costs and resource intensities. In the long run, competition
driving the development and use of a more diverse set of energy resources and supply
chains, with competitive pressure on prices, will usher in state-of-the-art technologies.
In the short run, research priorities should focus on the commercialization of clean-coal
technologies, coal being the major energy resource in India with the potential of
providing long-term security of supply.
Medium-term strategies
Renewable energy
Renewable sources of energy have immense potential, particularly as decentralized
energy sources in remote rural or hilly areas, where extension of the grid may not be
economically viable. Market reforms will enable renewables to compete with conventional
energy. Economic pricing that reflects the true opportunity costs of resources will correct
the bias towards conventional sources. In the short term, it will be necessary to provide
financial incentives such as subsidies/cross-subsidies. Subsidies should be determined
by market-based competitive bidding, which will provide an in-built mechanism for
restricting subsidies and offer incentives to producers to continually improve generation
efficiency. Strategies will include incentives for RD&D (research, development and
demonstration) of RETs (renewable energy technologies), market development, and
mandatory procurement of a prescribed minimum of renewable energy in each state
determined by the regulators.
Cogeneration
Cogeneration, with 70%–90% efficiency of energy utilization (as opposed to 35% in a
conventional power generating system), saves fuel and reduces flue gas emissions in

6
India. Cogeneration potential in India exceeding 20 000 MW could be significant in
bridging the supply–demand gap. It would also be economically competitive. Bagasse-
based cogeneration of electricity is already competitive. Appropriate institutional
arrangements for purchasing such electricity are required, besides increasing awareness
amongst other industries of the potential of cogeneration.
Hydropower
The public sector would play a dominant role in hydropower development in the
foreseeable future. Capacity building in the public sector along with expediting the
implementation of the National Hydro Policy, 1998 (which includes such incentives as
time-of-the-day pricing) is, therefore, urgent. Pumped storage potential can also be used
where found economical. Issues related to land acquisition, resettlement, and
rehabilitation of people should receive high priority and compensation packages should
be designed in consultation with affected people at the project investigation stage. This
would help in speedier completion of such projects and also promote equity.
Public sector management
Organization and management of the public sector need to be improved in keeping with
its significant role in hydro and nuclear power as well as in transmission in the future.
Long-term strategies
Structure of the industry
� Opening the power sector will improve its viability, arrest the inefficient generation
and use of power, and encourage the use of non-conventional energy by correcting
the underpricing of conventional sources.
� Efficiency gains need to be achieved by creating conditions for markets to function
efficiently.
� Competition will have to be introduced in phases since immediate opening up of
retail markets to competition will not be possible given the short supply of power and
weak social security systems.
Imports
� The hydro potential of Bhutan and Nepal needs to be developed further to enhance
import of hydropower.
� Imports of cleaner fuels need to be promoted. Import of coal, especially for blending
with domestic coal, will reduce the ash content of coal used in power generation.
Import of natural gas should be considered on environmental grounds and also
because gas-based generation is competitive with other fuels, especially at sites far
from coal-bearing areas. (Iran and Central Asian countries to the west and
Bangladesh and Myanmar to the east of India are rich in gas resources).

7
� Diversifying the import-mix will spread the risk of price increase in imported fuels.
Thus, a greater emphasis on regional economic cooperation is called for. India also needs
to participate actively in the development of the SAARC grid. This requires restoration of
financial viability of the power sector in India and in some other countries of the region.
Measures to control pollution
� Given the share of coal-based power, it is necessary to encourage and ensure
reduction of emissions through superior technology at the process (FBC [fluidized bed
combustion], IGCC [integrated gasification combined cycle], and CFBC [circulating
fluidized bed combustion]) and end-of-the-pipe level (high-efficiency ESPs
[electrostatic precipitators], flue gas desulphurization systems, DeNOx systems, and
effluent treatment plants).
� Enforcement mechanisms need to be strengthened and such economic instruments
as pollution charges employed to ensure compliance.
� Fly ash management requires fiscal, regulatory, and institutional measures for
improving mining techniques, discouraging dumping, and encouraging its dry
collection and utilization in cement, bricks, mine fills, etc. State governments in some
cases have announced sales tax concessions on fly ash products (bricks and cement
[Bhanumathidas and Kalidas 1998]). Orissa government has banned clay for brick
manufacturing within 70 km of thermal power stations.
� Bioremediation for fly ash management needs to be promoted.
Emerging sustainable alternative scenario The following are the demand and impact states under a sustainable alternative
scenario.
Demand
Efficiency improvements in various sectors through strategies outlined in Annex 1 could
reduce power demand by over 7% (Table 4). This, coupled with lower T&D losses, will
reduce the generation requirement. Demand is met through the same set of fuels as in
the BAU scenario but the relative shares of the fuels are different as necessitated by the
unsustainable BAU scenario. The share of total thermal (oil, gas, and coal) in generation
would decrease from 81.2% to 66.8% with the share of gas increasing slightly, and that
of coal and oil decreasing. The share of domestic coal would increase and that of
imported coal significantly decrease (from 25.1% to 5.7%). The declining share of total
thermal is compensated by increase in the share of hydro (from 7.7% to 13.3%), nuclear
(from 4.5% to 9.3%), renewables (from 3.2% to 5%), and hydro imports (from 3.5% to
5.6%) (Table 5). In case of generation from renewables, the share of small hydro projects
would increase and the share of biomass significantly decrease (Table 6). Table 4 Sectoral power demand (TWh) projections: the BAU versus alternative scenario (2020)
8
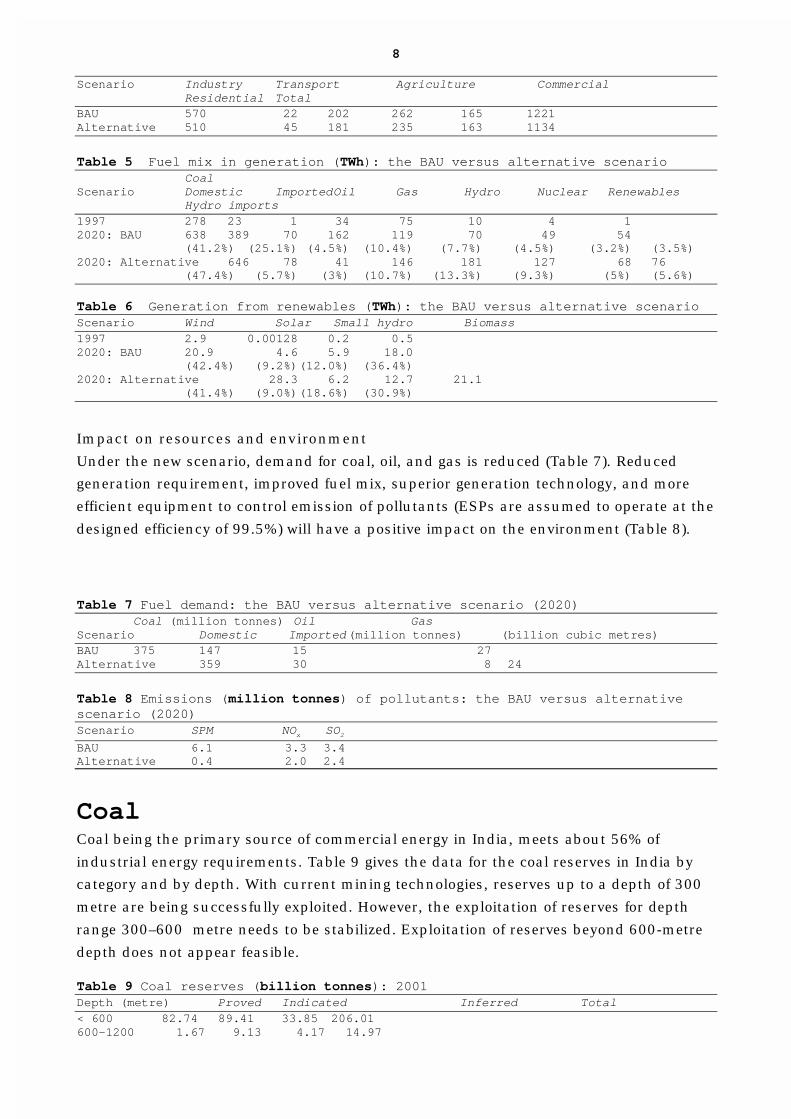
Scenario Industry Transport Agriculture Commercial Residential Total BAU 570 22 202 262 165 1221 Alternative 510 45 181 235 163 1134
Table 5 Fuel mix in generation (TWh): the BAU versus alternative scenario Coal Scenario Domestic Imported Oil Gas Hydro Nuclear Renewables Hydro imports 1997 278 23 1 34 75 10 4 1 2020: BAU 638 389 70 162 119 70 49 54 (41.2%) (25.1%) (4.5%) (10.4%) (7.7%) (4.5%) (3.2%) (3.5%) 2020: Alternative 646 78 41 146 181 127 68 76 (47.4%) (5.7%) (3%) (10.7%) (13.3%) (9.3%) (5%) (5.6%)
Table 6 Generation from renewables (TWh): the BAU versus alternative scenario Scenario Wind Solar Small hydro Biomass 1997 2.9 0.00128 0.2 0.5 2020: BAU 20.9 4.6 5.9 18.0 (42.4%) (9.2%) (12.0%) (36.4%) 2020: Alternative 28.3 6.2 12.7 21.1 (41.4%) (9.0%) (18.6%) (30.9%)
Impact on resources and environment
Under the new scenario, demand for coal, oil, and gas is reduced (Table 7). Reduced
generation requirement, improved fuel mix, superior generation technology, and more
efficient equipment to control emission of pollutants (ESPs are assumed to operate at the
designed efficiency of 99.5%) will have a positive impact on the environment (Table 8). Table 7 Fuel demand: the BAU versus alternative scenario (2020) Coal (million tonnes) Oil Gas Scenario Domestic Imported (million tonnes) (billion cubic metres) BAU 375 147 15 27 Alternative 359 30 8 24
Table 8 Emissions (million tonnes) of pollutants: the BAU versus alternative scenario (2020) Scenario SPM NOx SO2
BAU 6.1 3.3 3.4 Alternative 0.4 2.0 2.4
Coal Coal being the primary source of commercial energy in India, meets about 56% of
industrial energy requirements. Table 9 gives the data for the coal reserves in India by
category and by depth. With current mining technologies, reserves up to a depth of 300
metre are being successfully exploited. However, the exploitation of reserves for depth
range 300–600 metre needs to be stabilized. Exploitation of reserves beyond 600-metre
depth does not appear feasible. Table 9 Coal reserves (billion tonnes): 2001 Depth (metre) Proved Indicated Inferred Total < 600 82.74 89.41 33.85 206.01 600–1200 1.67 9.13 4.17 14.97

9
Grand total 84.41 98.54 38.02 220.98 Coking 16.39 12.90 1.25 30.54 Non–coking 67.61 85.57 36.37 189.55 Tertiary 0.41 0.08 0.40 0.89 Total 84.41 98.55 38.02 220.98 Note Net proved and recoverable reserves (billion tonne) up to a depth of 600 metre was estimated by Committee on Integrated Coal Policy 1996, at total reserves of 200 billion tonne in 1995 (latest study)
Proved reserves Net proved reservesa Net recoverable
reservesb
Coking 14.0 12.1 4.4 Non–coking 53.0 41.7 27.9 Total 67.0 55.8 26.3 a Net proved reserves are estimated after accounting for depleted reserves b Net recoverable reserves are estimated based on depth, technology, surface features, etc.
Coal production increased from about 35 million tonnes in 1951 to 310 million tonnes in
2000/
2001: an annual average growth rate of 4.46%. After nationalization of coal mines,
enhanced investment, increased share from opencast mining, increased emoluments and
welfare amenities for coal workers, etc. resulted in large increases in production. The
share of inferior-grade non-coking coal in the production mix has increased significantly,
whereas that of superior grade non-coking coal, which was 80% in 1980, declined to
40% by 1997/98.
The power sector is the largest consumer, followed by the industrial sector—the major
consumers being steel, cement, and brick-manufacturing units. Due to the limited
availability of indigenous coking coal and its deteriorating quality, low-ash coking coal is
imported for blending with indigenous coal and used in integrated steel plants. Imports
of coking coal have been rising continuously over the last 15 years, and stood at more
than 10 million tonnes in 1999/2000. The imports of non-coking coal have been
marginal but, due to poor quality of indigenous coal supplies and with lowering of import
duty, cement manufacturers, some other industries, and power plants along the
southern and western coasts, now import about 15 million tonnes of coal annually. The concerns in the coal sector are as follows.
� Requirement of adequate funds to develop the production capacity to meet future
requirements. This would require private sector participation.
� Need to step up exploration investments.
� Inefficiency and the absence of a competitive market due to the present pricing
regime and existing structure of the coal industry.
� High production costs due to low levels of technology in underground mines, surplus
staff, and low productivity. Opencast operations have not kept pace with modern
technologies except in a few mines. In some cases, opencast operations extend
beyond an economical depth, increasing production cost.
� Increase in price of coal due to increase in royalty and other charges at pithead and
rail freight resulting in domestic coal facing stiff competition from imported coal and
other fuels, which are relatively more environment-friendly.
10
� Coal quality has resulted in the steel and cement sectors increasing the share of
imported coal and other industries, e.g. glass, ceramics, and refractories, shifting to
other fuels. The power sector plans to increase imports especially in areas far from
the coalfields.
� Rehabilitation of land degraded due to subsidence, excavated pits, overburdens, and
spoil dumps or fire has not been satisfactory in almost all the coal mining areas.
� Land acquisition is a major issue in new projects.
� Impacts on land, water, air, and forest resources—a few coal mining areas have
already been identified as critically polluted.
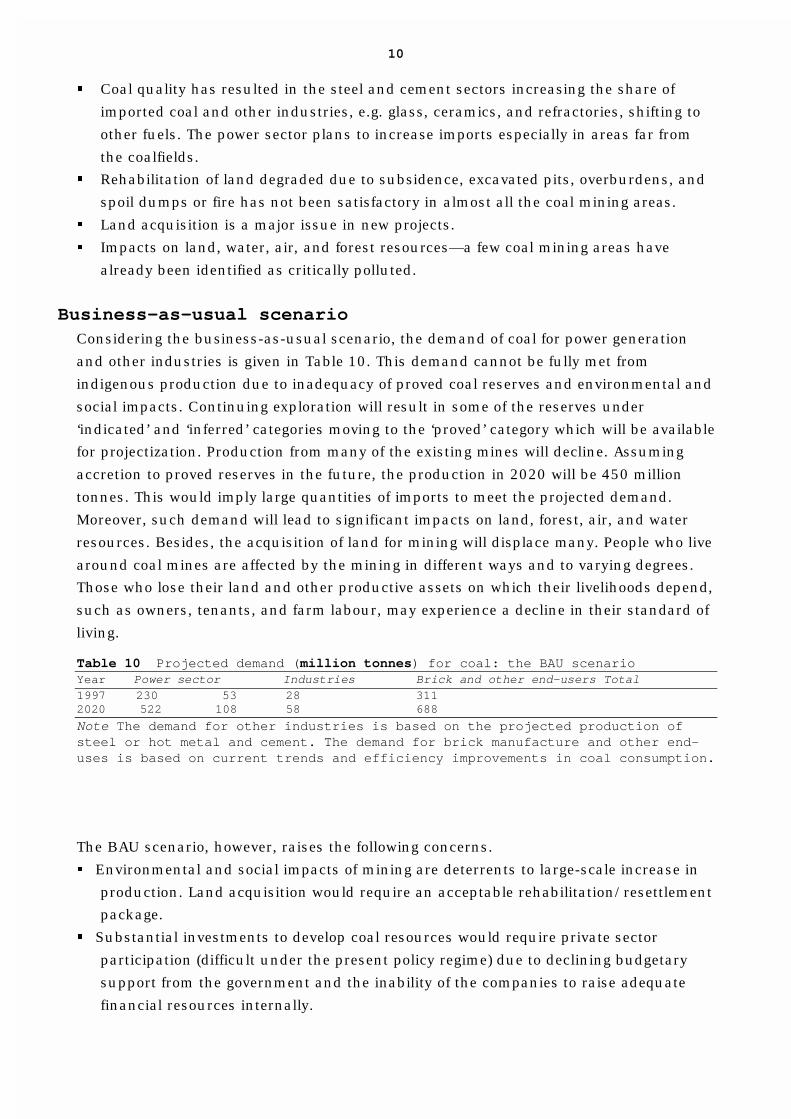
Business-as-usual scenario Considering the business-as-usual scenario, the demand of coal for power generation
and other industries is given in Table 10. This demand cannot be fully met from
indigenous production due to inadequacy of proved coal reserves and environmental and
social impacts. Continuing exploration will result in some of the reserves under
‘indicated’ and ‘inferred’ categories moving to the ‘proved’ category which will be available
for projectization. Production from many of the existing mines will decline. Assuming
accretion to proved reserves in the future, the production in 2020 will be 450 million
tonnes. This would imply large quantities of imports to meet the projected demand.
Moreover, such demand will lead to significant impacts on land, forest, air, and water
resources. Besides, the acquisition of land for mining will displace many. People who live
around coal mines are affected by the mining in different ways and to varying degrees.
Those who lose their land and other productive assets on which their livelihoods depend,
such as owners, tenants, and farm labour, may experience a decline in their standard of
living. Table 10 Projected demand (million tonnes) for coal: the BAU scenario Year Power sector Industries Brick and other end-users Total 1997 230 53 28 311 2020 522 108 58 688
Note The demand for other industries is based on the projected production of steel or hot metal and cement. The demand for brick manufacture and other end-uses is based on current trends and efficiency improvements in coal consumption.
The BAU scenario, however, raises the following concerns.
� Environmental and social impacts of mining are deterrents to large-scale increase in
production. Land acquisition would require an acceptable rehabilitation/resettlement
package.
� Substantial investments to develop coal resources would require private sector
participation (difficult under the present policy regime) due to declining budgetary
support from the government and the inability of the companies to raise adequate
financial resources internally.
11
� Movement of such large quantities of coal is not feasible with the already saturated
rail network (both passenger and freight traffic) experiencing low levels of investments
in capacity addition.
Directions, innovations, and strategies
In order to address the above concerns, the coal industry must commit to the following
while meeting the future demand.
� Enhanced exploration
� Adoption of best practices to improve coal quality, productivity, and safety and to
protect the environment
� Adoption of environment-friendly technologies including coal gasification,
beneficiation, and liquefaction for value addition to domestic coal
� More efficient use of energy
� Environmental protection including rehabilitation of affected land and preservation of
biological diversity
� An acceptable rehabilitation and resettlement policy for displaced people.
These can be achieved through suitable legislation and policy, technology, and fiscal
measures, as indicated below.
Short-term strategies
Legislative and policy measures The following initiatives should be adopted.
� Promoting private sector investment for growth of the industry.
� Opening up exploration to the private sector as being practised for other minerals.
� Retention of Coal India’s current structure and ownership is incompatible with
complete liberalization of the sector.
� Greater autonomy to subsidiary coal companies, options being (a) privatization of
individual subsidiary companies or parts of their operation (loss-making companies
need a different approach) and (b) partial divestments to create public–private sector
partnerships.
� Closing down of uneconomic mines and reduction in surplus manpower.
� Ban on mining in ecologically fragile or sensitive areas rich in biodiversity.
Technology
The following initiatives should be undertaken:
12
� Adoption of modern technologies in mining operations for increased safety,
production, and productivity—in-pit crushers, surface miners for opencast mines,
and continuous miners for underground mines and coal-handling plants.
� Beneficiation of coal produced from opencast to improve and maintain consistent
quality.
Fiscal measures
Application of market-based instruments and other fiscal measures to promote eco-
friendly technologies in mining operations, utilization of washery rejects for power
generation at the pithead, efficient use of mine water by recycling, i.e. after treatment,
and complete rehabilitation of affected land areas for economic benefits to the local
community, are urgently called for.
Medium-term strategies
Legislative and policy measures
The following measures should be initiated:
� Improving rail and port infrastructure to augment the offtake from Korba, Ib Valley,
Talcher, and North Karanpura coalfields.
� Planning the use of wasteland generated by mining. Some form of a reclamation trust
fund or a performance guarantee bond should be established and this should be a
prerequisite to the grant of a mining lease.
� Government owning the responsibility of rehabilitation of old abandoned mine sites.
This could be financed by levying cess on coal production.
� Formulating mine closure policies. The government should publish detailed
guidelines on decommissioning of mine sites and a programme to monitor
compliance with those guidelines.
� Amendments in various labour laws including contract labour laws.
Long-term strategies
Legislative and policy measures
� Formulation of a comprehensive rehabilitation and resettlement policy.
Technology
� Promotion of coal gasification and liquefaction technologies in anticipation of rising
prices of oil in the international market. This will add value to domestic coal and is
important from the viewpoint of energy security. A research programme could be
initiated to establish the feasibility and techno-economic viability of gasification of
large reserves of superior grade non-coking coal in Raniganj coalfield.
� Exploitation of coal-bed methane reserves. A programme has been taken up to
establish the potential and also the technical feasibility in Jharia and Raniganj
coalfields.

13
Emerging sustainable alternative scenario The demand for coal (Table 11) under the alternative scenario could be reduced because
of the following measures (see Annex 1 and ‘Power industry’ section).
� Substitution of coal by natural gas or LNG (liquefied natural gas) for electricity
generation.
� Adoption of cleaner and more efficient technologies in electricity generation—coal-
based integrated gasification combined cycle, and super critical technology.
� Substitution of domestic coal (which is both more expensive and of poor quality) in
the steel and cement industries by imported coal to the extent of 50%. Table 11 Projected demand (million tonnes) for coal: the BAU and alternative scenario (2020) Power sector Industries/steel/cement Brick-making and Domestic Imported other end-uses Scenario coal coal Total Domestic coal Grand total BAU 375 147 522 108 58 688 Alternative 359 30 389 97 52 538
Oil and gas India has a prognosticated hydrocarbon resource base of 21 billion tonnes with an
additional 9 billion tonnes from deep-water areas. However, only 6.8 billion tonnes of
geological reserves have been established through exploration, leaving two-thirds of the
area unexplored. The balance recoverable reserves, as on 1 April 2000, stood at 658
million tonnes of oil and 628 BCM (billion cubic metres) of gas (MoPNG 2000).
Crude
Domestic availability of crude has not kept pace with demand (Figure 2). Imports of
crude have resulted in a substantial drain on our reserves of foreign exchange
necessitating increased domestic exploration. To boost domestic oil and gas production,
the government announced the NELP (New Exploration and Licensing Policy) in 1997,
offering blocks on attractive terms to operators. Two biding rounds have been conducted
under the NELP framework, with 25 blocks being awarded under the first round and 23
under the second round. Altogether, the second round would witness investments to the
tune of 780 million dollars in three phases, with the first phase investments at 290 million
dollars. The government plans to offer the third round of NELP by the end of the current
D om esticp rod uction
Im p orts
199 0/ 91
1 99 1/92
1 99 2/93
1 99 3/ 94
1 99 4/95
1 99 5/96
1 99 6/97
1 99 7/98
199 8/99
1 0 0
9 0
8 0
7 0
6 0
5 0
4 0
3 0
2 0
1 0
0
Re fin ery throughp uts (m illion tonn es)

14
fiscal year. Figure 2 Availability (million tonnes) of crude Source Ministry of Petroleum and Natural Gas (MoPNG) web site <http://petroleum.nic.in>
Petroleum products
The total consumption of petroleum products in 1999/2000 stood at 96.29 million
tonnes. Sales by national oil companies accounted for 94% of the total sales, the rest
being accounted for by private parties. High-speed diesel sales accounted for about 42%
of the volume, followed by fuel oil (12%), SKO (11%), naphtha (8%), LPG and motor spirit
(6% each), and aviation turbine fuel (2%).
The 6% growth rate in demand for petroleum products over the last decade was
arrested in 2000/2001. Aggregate PSU (public sector unit) sales for 2000/2001 at 90.2
million tonnes were marginally lower by 0.5% than those in the preceding year. In the
retail trade category, only motor spirit witnessed a growth with demand increasing by
12% over the preceding year, while SKO consumption came down by 0.4% and high-
speed diesel by 2.7%. The slowdown in demand is attributed to factors ranging from a
fall in agricultural demand to a continuing economic slowdown.
Natural gas
Gas production was 28.4 BCM in 1999/2000. The three main producing basins—the
Western offshore region, the Cambay basin in Gujarat, and Upper Assam region—are in
the mature phase of exploration. As per the projections of the Sub-Group on Utilisation
of Natural Gas constituted under the Hydrocarbon Vision 2025, domestic gas availability
is expected to decline to about 16 BCM by 2011/2012.
On the other hand, the demand for natural gas has been growing rapidly with gas
sales increasing at 7.2% annually over the last decade. The demand for gas accrues
from preference of gas in power generation and fertilizer production. Gas sales1 in
1999/2000 aggregated 23.8 BCM. Non-energy sector accounted for 45% of off-take of
natural gas, power 38%, industry 11%, captive use/LPG shrinkage 4%, and agriculture
and domestic sectors 1% each (MoPNG 2000). With domestic gas production expected to
decline, rising gas demand would have to be met largely from imported gas.
Oil: Business-as-usual scenario Demand
Despite the current slowdown in consumption of petroleum products, long-term
forecasts retain a 5% growth rate. The demand for oil (Table 12), which extrapolates
present trends and practices, reveals that the transport sector continues to drive the
demand. Oil demand for non-energy uses, e.g. feedstock, industrial consumables
(greases, waxes, lubricants, etc.), and bituminous carpeting, and by industries is also
high.
Table 12 Projected oil demand (million tonnes) by sector: the BAU scenario
1 Production net of flaring and offtakes by ONGC

15
Year Industries Non-energy Transport Agriculture Commercial Domestic Power Total 1997 12 13 39 1 2 14 3 83 2020 42 40 105 2 15 26 15 245
Supply
Domestic crude production is expected to fall short of the target as revealed by the mid-
term review of the Ninth Five-Year Plan. Increase in domestic refining capacity has
resulted in increased crude imports: 80 million tonnes are expected in 2001/2002. The
Group on India Hydrocarbon Vision 2025 has developed a long-term strategy for the
development of the hydrocarbons sector. Its recommendations for enhancing domestic
output include (1) 100% exploration coverage of Indian sedimentary basins by 2025, (2)
extensive exploration in frontier and deep-water areas, (3) offering attractive fiscal terms,
and (4) acquisition of acreages abroad for exploration and production. The subgroup on
long-term external policy for the hydrocarbons sector including oil security estimated
that domestic crude production could rise to 50 million tonnes by 2010 and to 80 million
tonnes by 2020, implying that the bulk of incremental demand would need to be met
through imports (Table 13).
Table 13 Projected demand and supply (million tonnes) of crude oil: the BAU scenario Year Demand Refinery throughput Domestic production Imports 1997 83 69 34 35 2020 245 258 80 178
Note Assumption: refinery fuel and loss at 5% and no product imports
Concern: Oil security
Oil security is an important issue. Since the bulk of India’s oil imports are from the
Middle East and are likely to remain so, India will be vulnerable to any supply
disruptions arising from political instability in the region.
Natural gas: Business-as-usual scenario Demand
Power generation and fertilizer production account for the bulk of gas demand. In
addition, industrial gas use, excluding gas used as feedstock for fertilizers, has been
increasing rapidly over the last decade, registering an annual growth rate of over 20%.
Even after moderating estimates of industrial gas requirements for the forecast period,
gas use by industries would account for a significant portion of the total gas demand.
Table 14 gives sectoral gas demand projections. Table 14 Projected demand of gas (billion cubic metres) by sector: the BAU scenario Year Industries Non-energy Transport Domestic Power Total 1997 3.7 9.4 0.1 0.2 8.1 21.5 2020 20.8 21.8 0.5 0.6 27.1 70.8

16
Supply
Gas availability has to be analysed in the context of both domestic gas production and
gas imports through pipelines or LNG terminals.
Domestic sources
Natural gas
Production of domestic gas, based on the estimates of the subgroup on the development
and utilization of natural gas under the Hydrocarbon Vision 2025 group, is estimated at
14 BCM by 2020. These are conservative estimates based on the rate at which existing
fields are being depleted and assume that no new discoveries are made. The projected
import requirements will, however, change, depending on the discovery and
exploitation of new gas fields.
Coal-bed methane
Considerable headway has been made with regards to exploitation of CBM (coal-bed
methane) resources. A conservative estimate places reserves at about 850 BCM, with the
Gondwana basin accounting for 837 BCM and the tertiary basins, 13 BCM. Seven CBM
blocks were put on offer in April 2001—two in Jharkhand (Bokaro and North
Karanpura), three in Madhya Pradesh (East and West Sohagpur and Satpura), and one
each in Rajasthan (Barmer) and West Bengal (Raniganj). Exploitation of these would be
structured on a revised model contract, which is a modified version of the NELP. Unlike
the traditional profit-sharing contract, these blocks are being offered under a
production-linked programme. Estimated ‘in place’ reserves of these blocks are about
478 BCM.
The exploration programme, as charted by the Directorate General of Hydrocarbons,
envisages a minimum of 8 years for exploration, pilot assessment, and market
confirmation (DGH 1999), followed by a development phase of 5 years. Preliminary
estimates indicate a production potential of 17 BCM from the blocks on offer. Even if a
fourth of this potential is realized by 2020, domestic CBM production could be expected
to be about 4.4 BCM.
Gas hydrates
Production of gas from hydrate-sealed traps is somewhat sustainable as the reduction of
pressure caused by production can initiate a breakdown of hydrates and a recharging of
the trap with gas. However, unlike CBM, gas production from hydrates is not a
commercially proven technology as yet and, given the very preliminary stage of efforts,
gas production from hydrates has been excluded from possible supply sources in this
analysis.
Gas imports
Pipelines
17
Imports are likely to fructify from (1) an eastern route from Bangladesh and (2) a western
route from Iran. Unocal is keen on exporting gas from the Bibiyana gas field (estimated
reserves of 170 BCM) in Bangladesh to India. The company plans to develop a 0.5-
billion-cubic-feet-per-day (5-BCM-a-year) pipeline from Bangladesh, traversing West
Bengal, Bihar, and Uttar Pradesh, to link up with the existing HBJ trunk pipeline
system.
On the west coast, gas imports are being envisaged from the South Pars field in Iran,
via Pakistan. The Indian government has held several rounds of negotiations with the
National Iranian Oil Company. Both offshore and onshore routes are under
consideration, though Iran and Pakistan are both in favour of the latter, as the offshore
option could turn out to be considerably more expensive than the 2 billion-cubic-feet-
per-day (20 BCM-a-year), 4.5 billion dollars onshore route. The Indian government had
reservations about the onland route based on perceptions of problems with security of
supplies. However, the Indian stand appears to be more open now. Accordingly, feasibility
studies have been initiated for both the onshore and offshore routes. NIOC (National
Iranian Oil Company) has engaged Australia’s BHP to conduct a feasibility study for the
onshore route, while the feasibility of the offshore route is to be analysed by Snamprogetti
of Italy.
Although there are uncertainties regarding these projects at present, it is expected
that these pipelines would be operational by 2020.
Terminals for LNG
While a number of LNG terminals have been proposed along India’s coastline, only a
couple of them are at relatively advanced stages of development. Promoters are currently
facing problems on account of the long-term take-or-pay agreements required for LNG
supply. SEBs, the likely anchor load customers, are in poor financial health. Many
states have initiated reforms in the power sector and it is expected that by 2020 current
problems would be overcome. However, actual materialization of capacity will be
demand-driven.
Concerns
Table 15 summarizes the demand and supply for gas. Against a potential LNG import
capacity of 62 BCM (43 million tonnes a year) by 2020, imports of only 25 BCM (20
million tonnes a year) are required. However, if the pipelines from Iran and Bangladesh
do not materialize, LNG import requirement will rise to 52 BCM (38 million tonnes a
year) by 2020. Table 15 Demand and supply for gas (billion cubic metres): the BAU scenario Supply Domestic sources Imports Year Demand Natural gas CBM Total Required By pipelines As LNG 1997 21.5 21.5 21.5 — — — 2020 70.8 14.1 4.4 18.5 52.3 25.3 27.0 (19.8 million tonnes)
Directions and strategies
18
Oil security is likely to be a major issue given that India’s reliance on the Gulf for
imports is expected to increase. The increasing traffic through the straits of Hormuz also
makes the supplies vulnerable to any disruption due to political instability of the region.
While oil imports are likely to be concentrated from the Middle East, gas can be sourced
from many countries across the world, e.g. Australia, Indonesia, Malaysia, and
Bangladesh.
In the long term, therefore, the fuel mix of the country should be restructured to
reflect a larger share of gas and other alternative energy sources vis-à-vis oil, while, at
the same time, increasing domestic production of oil and gas and facilitating demand
management through appropriate policies. The following are the suggested strategies.
Short-term strategies
� Establish a regulatory framework to enthuse investors.
� Ensure commitment to ongoing reforms.
� Invite exploration bids on more attractive fiscal terms.
� Correct demand imbalances through rational product prices.
� Search for equity oil abroad/gas imports.
Medium-term strategies
� Sustain production levels through enhanced oil recovery schemes.
� Launch a focused foreign policy and diplomatic initiatives to build equity oil base.
Long-term strategies
� Complete basin analysis for sedimentary basins (which could be funded by the Oil
Industry Development Board).
� Encourage indigenous R&D in the exploration of CBM and gas hydrates.
Emerging sustainable alternative scenario
Demand
Based on the assumptions (see Annex 5), the demand for oil and gas under the
alternative scenario is presented in Table 16. Table 16 Projected demand for oil (million tonnes) and gas (billion cubic metres) by sector in the base case and the alternative case Indus- Non- Agricul- Commer- Year Scenario tries Energy Transport ture cial Domestic Power Total Oil 1997 BAU 12 13 39 1 2 14 3 83 2020 BAU 42 40 105 2 15 26 15 245 Alternative 38 36 72 2 13 25 8 195 Gas 1997 BAU 3.7 9.4 0.1 — — 0.2 8.1 21.5 2020 BAU 20.8 21.8 0.5 — — 0.6 27 70.8 Alternative 18.6 20.4 0.9 — — 0.5 24.3 64.7
Environmental impact

19
The alternative scenario is environmentally more benign. The reduction in oil demand for
transport together with a higher penetration of cleaner technologies, e.g. ULSD (ultra-
low-sulphur diesel) or CNG (compressed natural gas), battery-operated vehicles, and
four-stroke engines, and a shift from road to rail transport will reduce the emissions of
SPM from the transport sector. Such reductions will improve the air quality in cities that
have witnessed rapidly rising numbers of motorized vehicles.
Renewable energy Development and implementation of ecologically safe, risk-free, and renewable sources of
energy would help reshape the energy industry and infrastructure. Greater reliance on
renewable energy sources has enormous economic, social, and environmental benefits
for India. India became the fifth country in wind power utilization in the last decade,
with more than 95% investment by the private sector. Other renewable energy
technologies, e.g. solar photovoltaic, solar thermal, and small hydro, also picked up
pace. Though government policies have established an investment framework for the
propagation of renewable energy, it still faces many barriers—technology availability and
performance, consumer decision-making, market organization, financing, taxes, energy
policy, and regulatory issues. Some of these will shrink as technologies gain acceptance
and market share and others are likely to persist unless they are lowered through
further policy interventions.
Business-as-usual and alternative scenarios
Renewable energy sources have large-scale potential applications in the domestic sector
and the power industry. Projections of the extent of spread of these technologies are
provided in Table 17. Table 17 The spread of renewable energy: the BAU and alternative scenarios Solar Domestic sector Power industry (TWh) photovoltaic Solar water Biogas (solar home heating system plants system + lantern) Collector area* Small Year Scenario (million) (million)* (million square metres) Wind Solar hydro Biomass 1997 BAU 2.5 0.2 0.123 2.9 0.00128 0.2 0.5 2020 BAU 3.9 2.01 1.101 20.9 4.6 5.9 18.0 Alternative 5.7 3.60 3.062 28.3 6.2 12.7 21.1
* BAU scenario assumption: increase of 80 000 systems per year; Alternate scenario assumption: enhancement in the increase by 5%. This cannot be altered much, as the current market for solar home systems is estimated to a maximum of 4.5 million units (18 000 villages and 100 household per village, and one to two systems per household); although the resource changes by changing the 18 000 villages and household number estimation.
20
The projections are achievable from the resource point of view, but would require a
proper institutional and policy framework aided by adequate infrastructure, namely
power evacuation and manufacturing capability.
Directions, innovations, and strategies The following are the policy interventions required in this regard.
� Policies should be integrated into market transformation strategies, addressing the
needs for both ‘technology push’ and ‘demand pull’. Moreover, policies should evolve
over time as some barriers are overcome and others become more prominent.
� Successful market transformation requires national policies and programmes which
in turn depend on the participation of state and local authorities, and action at the
regional and local levels.
� International agencies such as the Global Environment Facility and other multilateral
agencies can play a key role in financing national efforts as well as in supporting
capacity- and institution-building. International cooperation should be expanded
where appropriate.
� The private sector should be involved in policy development since it plays a key role in
its implementation. Policy-makers can work with companies that are actively
developing, producing, or investing in high-efficiency renewable source of energy to
develop and implement progressive policies and programmes that will lead to a more
sustainable energy future.

21
A summary of the proposed interventions is given in Table 18. Table 18 Directions, innovations, and strategies for renewable energy Directions Innovations and strategies Action by Time frame Grid-connected renewable energy technologies Increase the share of Minimum procurement legislation (certain Central and state governments Short term renewable energy sources minimum quantity of electricity to be procured through renewables) Improve performance Introduction of performance-linked incentives Central and state governments Short term Frameworks for large-sized projects Central and state electricity regulators State-of-the-art power evacuation network Private sector Reduce capital cost Propagation of indigenous R&D Central and state governments Short to Private sector medium term Promote new technologies, Policy framework Central and state governments Short term e.g. solar thermal Demonstration projects Research, development, and demonstration of selected technologies Off-grid and decentralized renewable energy technologies Increase the share of solar Building by-laws Central and state governments Short term water-heating systems Ensure availability of credit Energy services companies Central, state, and local governments Short term Micro-credit facilities NGOs, private sector Develop maintenance Entrepreneurship development Central, state, and local governments Short term infrastructure NGOs, private sector Reduce capital cost Indigenization of R&D and product Central and state governments Short term development Promote new technologies, Policy framework Central and state governments Short term e.g. solar pond Demonstration projects Research, development, and demonstration of selected technologies
Air The major sources of air pollution are motor vehicles, industries, thermal power plants,
and domestic fuels. It would be useful to study the impact of the sectors on the air
quality and then consider strategies that would lead to an alternative scenario with
better air quality.
Business-as-usual scenario Domestic and commercial sectors
Fuel combustion from domestic sources is a major source of indoor air pollution with
about three-quarters of all Indian households using unprocessed biomass as the
primary fuel, mostly for cooking (Census of India 1991). Emissions from traditional fuels
in the residential sector are estimated under the BAU scenario (Table 19). Urbanization
and economic development will result in a shift towards cleaner gaseous fuel, and

22
emissions from the residential sector will decrease. However, due to their significant
health impacts, adequate measures need to be taken to reduce indoor air pollution.
Transport sector
Transport is the major source of air pollution in many cities with road transport being
the predominant source. The critical issues of this sector include increasing number of
vehicles (annual growth of 10% or more), outdated engine technology and old vehicles,
fuel quality, and inadequate traffic planning. Emissions of major pollutants are
estimated for urban areas under the BAU scenario (Table 19) based on the projections of
the number of vehicles, which considered the population growth and economic
development.
Manufacturing industry
Air pollution in terms of SPM loads has been analysed for some of the resource-intensive
and highly polluting industries: copper, aluminium, steel, cement, fertilizers, textiles,
and PVC (poly vinyl chloride) (Table 19). Emission loads have been worked out on the
basis of emission load per unit of output from these industries (WHO 1993). The extent
of installed pollution control systems in these industries has been estimated by the
CPCB on the basis of regular surveys (CPCB 1996). In the BAU scenario, it is assumed
that due to strict environmental regulations, all industrial units would have installed
adequate pollution control devices. The critical issues of this industry include low
efficiency of resource use, fuel quality, and lacunae in environmental governance (which
is overly dependent on command-and-control type of environmental management).
Power industry
Thermal generation contributes substantially to the total emission load and since bulk of
the thermal power generation is coal- and gas-based, projections are based on these two
categories (Table 19). The critical issues in this sector include process technology, fuel
quality (with coal-based power generation having severe adverse impacts due to 30%–
45% ash content and nuclear power generation associated with issues of radiation and
disposal of radioactive wastes), and pollution control measures (with some of the older
thermal power plants using such low-efficiency control devices as mechanical dust
collectors and those with electrostatic precipitators having operational problems leading
to overall reduction in efficiency).
Table 19 Estimated emissions (million tonnes) from various sectors
Suspended Carbon Hydro- Oxides of particulate Sulphur Year Sector monoxide carbons nitrogen matter dioxide
1997 Domestic and 7.08 1.00 2020 commercial 5.19 0.7
1997 Transport 4.25 0.02 0.18 0.03 0.04 2020 17.13 0.07 0.57 0.09 0.13
1997 Manufacturing 0.98 2020 1.93

23
1997 Power 1.73 11.92 1.34 2020 3.27 6.1 3.44
Note For the power industry, BAU scenario: all coal-based power plants would have installed ESPs (electrostatic precipitators) to limit SPM emissions; Emissions from the transport sector include urban passenger transport only; Emissions from the manufacturing industries sector comprise suspended particulate matter from seven industrial sectors.
Directions and strategies by sector
Domestic and commercial sectors
Short- and medium-term strategies
Improved ventilation of kitchens
Although new rural housing units can be designed to ensure better ventilation, this may
not be feasible in small and crowded areas, especially in urban slums where it becomes
important to promote awareness of the dangers related to indoor air pollution so that
people may try to adopt ways of minimizing exposure through better kitchen
management and infant protection.
Improved stoves
Improved stoves reduce indoor air pollution by burning less fuel and providing better
ventilation due to the chimneys in the improved design. The stoves are also inexpensive.
User participation and improved design for higher efficiency and longer life will make
them more popular.
Long-term strategy
Cleaner fuels: moving up the energy ladder
Use of cleaner fuels, e.g. liquid or gaseous petroleum products (e.g. kerosene and LPG)
and processed biomass fuels (e.g. biogas and producer gas), comprise effective long-term
interventions. A faster transition from solid fuels to cleaner liquid or gaseous fuels
requires appropriate policy interventions. A reliable, affordable, and secure supply of
liquid and gaseous petroleum products is necessary to meet the cooking energy
demands. Subsidies on kerosene are often misdirected and fail to reach the poor.
Despite a preference for commercial fuels amongst households that can afford these,
supply constraints often restrict their actual availability and use. Steps should,
therefore, be taken to increase the availability of LPG and kerosene to meet the demand
for cooking.

24
Transport sector
Short-term strategies
Controlling the emissions from each vehicle
� Strict emission norms for new vehicles.
� Well-enforced I/M (inspection and maintenance) programme and phasing out or
replacing old vehicles. This can be achieved through fiscal incentives or disincentives
and government’s dictates. Also, the new emission norms should be progressively
tightened and their strict enforcement ensured.
� Improved fuel quality. The specifications for gasoline and diesel will have to be
revised and perhaps brought in line with the European specifications. Studies carried
out in the United States by the auto and oil industries indicate that low-sulphur fuel
can reduce SO2 and particle emissions (WHO 1993).
� Better infrastructure for the sale of such alternative fuels as CNG should be provided.
Fiscal strategy
� Rationalization of fuel prices and removal of subsidies in kerosene
Short- and medium-term strategies
Controlling the number of vehicles on the road
There is a need to curb the rate at which new vehicles are added to the fleet and to
promote a shift towards the use of public transport. This may be achieved through
adopting the following measures.
� Increased use of mass transit by making public transport better—extending its
coverage, reducing waiting time and travel time, making the service more reliable,
coordinating transfers, and making available park-and-ride facilities (short-term). The
capacity of public transport can be augmented by leveraging private investment
(medium-term).
� Disincentives for the use of private automobiles—increased parking charges, parking
restrictions and area licensing, a surcharge on motor vehicles and fuels, and fuel
rationing (medium- and long-term).
� Incentives for carpooling, commuter bus services (short-term).
Other transport management measures
� Management measures—bans and restrictions, high-occupancy-vehicle lanes,
clearing encroachments on roads, etc.
� Engineering measures—provision of cycle tracks, pedestrian walkways, proper
maintenance of roads, etc.
� Control measures—traffic signal synchronization, appropriate signage, etc.

25
Manufacturing industry
Short-term strategies
� Mandatory efficiency standards for upcoming process industries will force new plants
to adopt the latest technologies.
� Appropriate sites for industries—issues of suitable sites for industries need to be
addressed, industries relocated, if necessary, from non-conforming areas to
conforming areas (short-term), and integrated regional environmental quality
management plans that take into account the carrying capacity of the ecosystem
developed and implemented (medium-term).
� Voluntary agreements on energy efficiency by industry associations on behalf of their
members will also reduce consumption.
Short- and medium-term strategies
� Recycling and re-use of secondary materials.
� Mandatory energy labelling of equipment for promoting energy efficiency.
� Promotion of clean technology and waste minimization measures.
� Development and installation of appropriate pollution control devices for small-scale
industries. Provision of fiscal incentives for pollution control measures.
� Strict enforcement of pollution control measures and effective implementation of
environmental law—transparency in environmental management system and
capacity-building in pollution control boards.
� Promotion of cogeneration.
Power industry The following strategies are suggested.
Short-term strategies
� Adoption and proper functioning of end-of-the-pipe control options—high-efficiency
ESPs and low NOx burners.
� Adoption of load-based standards for SO2 and NOx.
� Strict enforcement of existing regulations.
� Supply of beneficiated coal to thermal power plants located beyond 1000 km from a
pit-head as well as those located in urban, sensitive, or critically polluted areas.
Short- and medium-term strategy
� Promotion of renewable forms of energy including hydro.
Short- to long-term strategies
� Adoption of clean technology options at the process stage—clean-coal technologies.
� Shift to cleaner fuels such as natural gas.
� Provision of economic incentives—electricity pricing encourages such demand-side
management options as using more efficient energy appliances. In the case of wind
26
energy, the current investment-oriented incentives should gradually make way for
generation-oriented incentives. Incentives should be provided for the management of
fly ash. The success of market-based incentives as effective options in controlling
emissions has been demonstrated in other countries, e.g. pollution charges for NOx
emissions in Sweden and allowance trading for SO2 emissions in USA.
Emerging sustainable alternative scenario
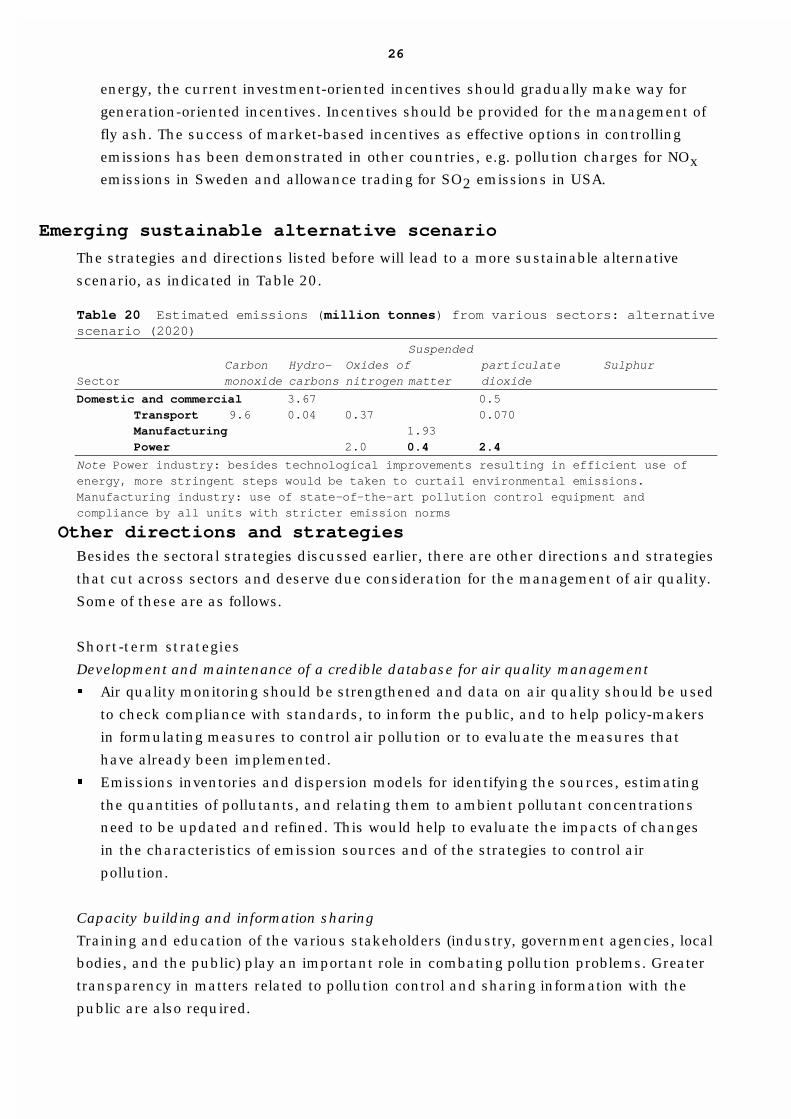
The strategies and directions listed before will lead to a more sustainable alternative
scenario, as indicated in Table 20. Table 20 Estimated emissions (million tonnes) from various sectors: alternative scenario (2020)
Suspended Carbon Hydro- Oxides of particulate Sulphur Sector monoxide carbons nitrogen matter dioxide
Domestic and commercial 3.67 0.5 Transport 9.6 0.04 0.37 0.070
Manufacturing 1.93 Power 2.0 0.4 2.4
Note Power industry: besides technological improvements resulting in efficient use of energy, more stringent steps would be taken to curtail environmental emissions. Manufacturing industry: use of state-of-the-art pollution control equipment and compliance by all units with stricter emission norms
Other directions and strategies Besides the sectoral strategies discussed earlier, there are other directions and strategies
that cut across sectors and deserve due consideration for the management of air quality.
Some of these are as follows.
Short-term strategies
Development and maintenance of a credible database for air quality management
� Air quality monitoring should be strengthened and data on air quality should be used
to check compliance with standards, to inform the public, and to help policy-makers
in formulating measures to control air pollution or to evaluate the measures that
have already been implemented.
� Emissions inventories and dispersion models for identifying the sources, estimating
the quantities of pollutants, and relating them to ambient pollutant concentrations
need to be updated and refined. This would help to evaluate the impacts of changes
in the characteristics of emission sources and of the strategies to control air
pollution.
Capacity building and information sharing
Training and education of the various stakeholders (industry, government agencies, local
bodies, and the public) play an important role in combating pollution problems. Greater
transparency in matters related to pollution control and sharing information with the
public are also required.
27
Enforcement
There should be strict enforcement of legislation both in letter and spirit. Also,
appropriate fiscal punitive measures should be imposed on defaulters.
Short- and medium-term strategies
Urban planning with focus on the environment
Accelerated development of priority towns around big cities should be ensured for the
dispersal of economic activities, industries, and immigrants. Regional development plans
need to be developed and implemented that incorporate policies relating to population
distribution, transport and communications, tax structure, physical and social
infrastructure, regional land use, the environment, and eco-development. Integrated
regional management plans for environmental quality that take into account the carrying
capacity of the ecosystem are required.
Institutions and regulations
The roles and responsibilities of each relevant institution should be clearly defined,
loopholes covered, and strong institutional links established through effective
communication.
Internalizing the cost of environmental degradation
Internalizing the cost of environmental degradation in the production and service sectors
will indicate to society the real cost of a product. By making it mandatory, the
government would in effect send a signal that it does not promote development that
adversely effects the environment. The environmental costs included in the price of a
product could then be used in improving not only air quality but also the overall quality
of life.
Long-term strategy
Development and maintenance of a credible database for air quality management
An integrated study of air quality monitoring, exposure assessments, and
epidemiological studies should be conducted to set more reliable air quality standards
and suitable emission norms.
Water
Sectoral pressures Agriculture
The agricultural sector accounts for over 95% of the total water consumption.
Subsidized/free supply of power and water has resulted in overexploitation and
inefficient use. Inefficient use of canal water and groundwater accompanied by neglect of
drainage has resulted in waterlogging and salinity. Other environmental problems of

28
intensive agriculture that have emerged include degradation of soils and water from
unbalanced and excessive use of chemical fertilizers and pesticides. Leaching of
chemicals (particularly nitrates) from fertilizers affects the quality of public water supply
and eutrophication causes excessive algal growth, which kills fish.
Domestic
The domestic sector accounts for about 4.2% of the total consumption. However, in some
36% of Indian cities, the daily per capita supply even now is less than 100 litres and in
another 46% that gets the basic supply of 135 litres, it is erratic or with inadequate
pressure. The quality of water too has been deteriorating. Only 70% of the population in
Class 1 cities (those with a population of 100 000 or more) has access to basic sanitation
services. Wastewater treatment efficiency, even in Class 1 cities, is only 30% (CPCB
2000a). The remaining untreated sewage from the urban areas finds its way into water
bodies, making the water unfit for drinking or even to use for bathing and, at the same
time, affecting ecological health.
Manufacturing
The manufacturing sector accounts for 0.3% of the total water demand but has
generated significant and increasing quantity of wastewater—about 70 million litres a
day in 1947 to 3000 million litres a day in 1997. About 45% of the total pollutant load in
the industry is derived from the processing of industrial chemicals. In 1997, there were
851 defaulting GPIs (grossly polluting industries) with pollutant discharge more than
100 kg of BOD (biological oxygen demand) a day along the rivers and lakes—228 have
been closed and there are now 34 defaulters (CPCB 2000b).
Power
Water in the power sector is required for steam generation and disposal of fly ash. Due
to the high ash content of Indian coal, along with the system of wet collection of fly ash,
almost 45% of the sector’s water requirement is accounted for by slurry preparation. Wet
collection also causes percolation of hazardous elements to groundwater from ash
ponds.
Critical issues Availability versus use
Large variations in the availability of water result in some regions facing shortages. In
1991, per capita availability in the 20 basins was more than 1700 cubic metres in four,
1000–1700 in nine, 500–1000 in five, and less than 500 in two (Chitale 1992). Only 35%
of the total available run-off of 1952 BCM (billion cubic metres) is used (CWC 1993,
CGWB 1995) due to lack of proper storage facilities and increasing public opposition to
hydro projects. Transfer of water from across basins has not been adequately explored
leading to poor utilization of available resources.

29
Furthermore, in the case of large- and medium-sized irrigation projects, the entire
potential was used up to the mid-1950s; the figure dropped to 90% in 1993/94 (CWC
1996). Moreover, government investments concentrate only on initiation of new projects
and ensuring efficient exploitation of completed projects is accorded low priority.
Micro-level storage structures, e.g. on-farm storage through water harvesting, have
not been developed fully. The share of tank irrigation in the net irrigated area, for
instance, declined steadily from 20% in 1958/59 to about 5% in 1997.
Availability versus demand
A demand of 555 BCM against the availability of 1086 BCM indicates a state of surplus
but uneven spatial as well as temporal distribution result in many regions facing water
scarcity—for example the Western plains, the Kachchh region, and some pockets in the
Northern Plains.
Overexploitation of groundwater
The share of groundwater in urban and agricultural consumption has increased
substantially (Saleth 1996). Severe shortage of water supplied for domestic purposes in
urban areas has resulted in groundwater being drawn from boreholes. The share of
groundwater in the net irrigated area has increased from a third in 1965/66 to over half
at present to either supplement surface deliveries of water or to provide irrigation water
when limited or no surface supplies are available. Groundwater overdraft beyond certain
recharge capacities poses serious threats—a long-term decline in water levels, with
associated adverse consequences such as land subsidence, deterioration of water quality
in aquifers, and ingress of saline water in coastal aquifers.
Resource degradation
Water quality of Indian rivers has degraded considerably due to inadequate collection
and inefficient treatment of domestic wastewater in Class 1 cities and discharge of highly
complex waste from industries. Groundwater sources too are undergoing severe
degradation due to chemical contamination, mainly from fertilizers, industrial wastes,
and municipal solid wastes as well as biological contamination, particularly in the form
of human waste in dug wells.
Poor conservation of resource
Government policy has provided little incentive to encourage efficient use.
Evapotranspiration losses are 42%, and distribution losses of treated water 25%–40%.
Wastage in irrigation occurs to the extent of 45% by seepage through unlined channels
and about 15% due to excess application. Losses in storage are estimated at 15% (MoWR
1999). Industrial output per unit of water withdrawal is only $5 per cubic metre as
compared to $20, $25, and $32 for Argentina, Japan, and Sweden, respectively (Chopra
and Sen 1992). Even in the domestic sector, areas with high per capita water availability

30
are known for poor water utilization. Poor water tariff structure also provides little
incentives for conservation.
Water pricing
The price for water use in different sectors is fixed by the state governments and varies
from state to state. For agriculture and domestic consumption alike, recovery through
water rates does not cover even the working expenses of providing the services. The
subsidy regime has led to inadequate financial allocations to the sector (even for O&M).
Inefficient service institutions, in turn, have led to poor and unreliable service, making
the users dissatisfied and unwilling to pay. Large-scale and poorly targeted subsidies
and incentives send wrong signals to the market, causing wasteful use of resources and
suboptimal choices by consumers. Further, in the case of agriculture, water rates are
not based on the quantities used, which offers little incentive for efficient use, apart from
leading to inappropriate cropping pattern in some regions. High resource cost for
industries, on the other hand, cross-subsidizes the water consumed in the domestic
sector.
Inefficiency at the supply end is also a related issue. The cost of supply—capital and
recurring—often reflects inefficiencies in generation and supply in the form of
technology used, project design, over-capitalization, overstaffing, high administrative
costs, and time and cost overruns. These translate into poor quality of service and,
therefore, unwillingness to pay.
Institutional set-up
Separate planning and implementation of surface water and groundwater development
programmes, and for the various sectors using water, discourage unitary analysis of
water and its use as a single resource, and results in duplication and ambiguity of
functions. Thus, while the CPCB (Central Pollution Control Board) and the state
pollution control boards focus on pollution from industrial and domestic sources,
agricultural pollution tends to be overlooked. Central and state groundwater boards have
their own separate observation wells for monitoring water tables but do not share the
data among themselves, and doubt each others’ databases.
Water being a state subject, the states are empowered to enact laws or frame policies,
but only few have set up organizations for planning/allocating water for various
purposes. The National Water Policy (1987/2002) had recommended the creation of
multidisciplinary units in different states for water management and proposed
participation of beneficiaries in water management and water price rationalization
among others. The states are required to move in this direction.
Weaknesses in current legal framework

31
Absence of appropriate laws, inadequate provisions in the existing legislative framework,
and weaknesses in implementation of environmental laws, result in unsustainable use.
Surface water is treated as state property leading to conflicts and litigation with
individuals asserting that they lose their rights to the state when irrigation projects are
developed. The legal framework on groundwater promotes neither equity nor
sustainability by allowing landowners to withdraw water beneath their lands.
Groundwater authorities attempt to regulate groundwater withdrawals through licensing
but do not define any limits for withdrawals. Inadequacy of resources with the
monitoring agencies leads to weak enforcement, especially in the small-scale sector.
Business-as-usual scenario
The cumulative water requirement from different sectors in the BAU scenario is shown in
Table 21 and water pollution in Table 22.
Table 21 Projected total water demand (billion cubic metres): the BAU scenario Domestic Year Irrigation Urban Rural Total Manufacturing Power Total 1997 528.85 13.62 9.89 23.52 1.60 1.39 555.36 2020 734.98 24.75 11.4 36.2 3.94 3.14 778.26
Note Assumptions for estimating the demand Agricultural sector: Cropping intensity increase up to 144% and with 48% of the gross cropped area under irrigation. Irrigation will continue to be the predominant end-use: its share will reduce marginally from 95.2% in 1997 to 94.5% in 2019. Domestic sector: A per capita daily supply of 135 and 40 litres in the urban and rural areas, respectively. Manufacturing sector: A rise in the sector’s share in total consumption from the present 0.29% to 0.67% by 2047. Power sector: Based on water requirements per unit of electricity generated and the sector’s share of water requirements is projected to increase from 0.25% to 0.75%. The water requirements for steam generation and fly ash disposal are projected to grow at 4.73% and –0.51%, respectively, from a current annual level of 0.742 BCM and 0.645 BCM, the slower growth in the case of ash collection representing a shift towards dry collection.
Table 22 Projected pollution levels (million tonnes of BOD): the BAU scenario Domestic BOD Year Urban Rural Industrial BOD 1997 3.75 3.70 0.4 2020 5.95 4.29 0.014
Note The projected BOD load from the urban domestic sector assumes an overall wastewater collection efficiency of 70% in 2019 from the present level of 60%. Wastewater treatment facilities in urban areas are projected to be augmented by 40% by 2019. Projections for water pollution for the industrial sector assume that all production units have facilities to control pollution in accordance with the CPCB’s year-wise analysis of the polluting units and strict compliance due to stringent environmental regulations.
Directions and strategies: sectoral level Agriculture
The following strategies are suggested:
Short-term strategy
� Policy-level reforms in the structure of subsidy and pricing in the water, power, and
fertilizers sectors.

32
� Economic use of irrigation water and increasing water application efficiency by
encouraging sprinkler and drip-irrigation systems.
Short- and medium-term strategy
Improvement in fertilizer application efficiency, integrated with the use of biofertilizers,
to check the degradation of existing resources due to contamination with nitrates.
Medium-term strategies
� Institutional changes in terms of operational autonomy in the irrigation sector.
� Promotion of traditional modes of irrigation and adoption of the watershed approach.
� Conjunctive use of surface water and groundwater (this will also help by ensuring
better drainage in canal command area, thereby checking waterlogging and salinity).
� Utilization of treated wastewater from domestic and industrial sources for irrigation.
Domestic
Critical areas in domestic sectors include an increase in the coverage and quality of
water supply and basic sanitation services. Inefficiencies in the distribution and
treatment of water supplies and lacunae in the existing policy structure, need to be
tackled by administrative and functional decentralization of service providers and
upgrading infrastructure facilities. These will be facilitated through various strategies as
discussed below:
Short-term strategy
Water pricing mechanisms that ensure economic viability of operations and encourage
resource conservation practices.
Short- and medium-term strategies
� Participation of the private sector in one or more stages of the water supply process.
� Upgrading operational and financial infrastructure for an improved service quality
and increased system efficiency.
� Propagation and encouragement of practices to minimize, recycle, and reuse treated
wastewater.
Wastewater treatment capacity needs to be enhanced by introduction of such low-cost
and effective waste treatment facilities as UASBR (upflow anaerobic sludge blanket
reactor), duckweed ponds, and horizontal filters. These technologies offer numerous
advantages—negligible energy consumption, useful by-products (manure and biogas),
and lower O&M costs.
Manufacturing
Short-term strategies
33
� Instituting a system of policies and practices that encourage water conservation at all
levels. Legislation needs to be strengthened and backed by economic incentives and
subsidies that encourage water-saving technologies and installation of devices to
control water pollution.
� Adopting cleaner and less water-intensive technologies for efficient use.
Short- and medium-term strategies
� Plugging the shortcomings in the existing command-and-control regime to ensure
thorough compliance in terms of quantity and quality of wastewater discharged.
� Putting in place a mandatory system for monitoring and recording the quantity of
water consumed and the quality of effluent discharged. Such environmental
management tools as performance benchmarking, ISO 14 000 standards, and
environmental rating serve to improve not only environmental performance but also
international image and competitiveness of the Indian industry.
Medium- and long-term strategy
� Encouraging R&D efforts in using and conserving water, especially in accordance
with local capabilities and requirements.
Power
Short- and medium-term strategies
� Encouraging technological options that conserve water by minimizing its use in
steam generation, cooling towers, and ash disposal.
� Other prominent measures that reduce the quantity of ash and thus that of water in
handling and disposing ash include better quality of coal, dry ash collection, and
alternative cleaner fuels and clean technologies for power generation.
Directions and strategies: national level Integrated river basin approach
A basin-based approach to water management will ensure that different aspects—water
allocation, pollution control, protection of water resources, and mobilization of financial
resources—are not dealt with in an isolated manner, thereby providing requisite
directions for the overall development process and land-use planning. Appropriate
legislation will be required to set up planning units such as river basin authorities,
which will act as autonomous institutions with policy formulation, planning, financial,
and regulatory powers. The administrative mechanisms of these authorities need to be
defined and operationalized in coordination with relevant state government departments,
the central government, and representatives from the community, ensuring that the
delegation of authority from the existing departments is consistent and avoids

34
overlapping. The basin authorities must be empowered adequately with a view to achieve
financial self-sufficiency in the long run.
Community management
Community participation in the development and management of water resources will
facilitate effective redressal of problems of the affected people within their own social and
regional domains. NGOs can provide an important link between the community and
government institutions and can offer services in capacity building of the relevant
stakeholders, R&D for low-cost and effective water supply and sanitation facilities, and
timely enforcement of policies.
Market-based instruments
Market-based instruments including appropriate water-pricing policies will encourage
resource conservation and provide additional financial support for the fund-starved
municipal service providers. These could include water charges levied on both extraction
of water and its pollution by public and private entities, unit costs increasing in tandem
with consumption, water subsidies/rebates for those public and private bodies that
attempt to treat it well before discharging it. Attempts at rationalizing water tariffs in any
sector must go hand in hand with improvements in the efficiency of supply and the
quality of service. Contamination of the existing water resources should be checked by
the use of economic instruments such as charges on pollution beyond the permissible
limits.
A balanced approach to water management
The approach to water management at the project, sector, or national level needs to
focus on all the related issues of importance in a balanced way. In the agricultural
sector, for instance, it is essential that pricing of all inputs—power, fertilizers, and
water—takes into account the likely implications on cropping patterns and the use of
those inputs. Project planning and operation of systems need to be based on water
allocation criteria, which should broadly follow the order: drinking water, irrigation,
hydropower, navigation, and industrial and other uses. At the national level, such policy
decisions as those related to resource pricing need to integrate the issues relating to
sectoral shares of water demand and efficiency of use.
Increasing resource availability
With utilizable surface water about 35% of the total available run-off, augmenting the
available resources becomes necessary. The need is to develop surface irrigation sources,
harvest rainwater, and prevent run-off by building appropriate water-harvesting
structures in the lower reaches especially during June–November when the rivers
generally carry water in excess of 90%. The concept of watershed development has to be
adopted more rigorously, which effectively contributes to the revival of local traditional
water control works.

35
Inter-basin transfer proposals need to be explored for making more water available in
water-stressed basins. The National Water Development Agency envisages the utilization
of 200–250 BCM of water by such transfers. Preliminary studies also highlight the
possibility of using about 160 BCM through artificial recharge (MoWR 1999). Detailed
feasibility studies need to be carried out to study the potential for increasing utilizable
water resources.
Emerging sustainable alternative scenario Sectoral interventions along with reforms in pricing, regulatory, and other policies at the
national level will significantly improve the efficiency of resource-use and lead to the
more sustainable alternative scenario (Tables 23 and 24). Institutional reforms at the
national level can be expected to further improve the scenario.
Table 23. Projected total water demand (billion cubic metres): the BAU and alternative scenario (2020) Scenario Irrigation Domestic Manufacturing Power Total BAU 734.98 36.2 3.94 3.14 778.26 Alternative 620.14 34.32 3.53 1.88 659.8
Table 24. Projected BOD load (million tonnes) from urban areas and industries : the BAU and alternative scenario (2020) BOD from urban areas BOD from manufacturing sector Scenario (million tonnes) (million tonnes) BAU 5.95 0.014 Alternative 4.92 0.011
Note By expanding the existing sewerage network to increase the collection efficiency, upgrading treatment capacities, and using other efficient and low-cost technologies, the urban BOD load reduces. More efficient technologies for treating wastewater and stringent legislation results in reduction in BOD load from the manufacturing sector.
Land, forests, and biodiversity Competing uses of land for forestry, agriculture, pastures, human settlements, and
industries exert pressure on the finite land resource influencing land-use patterns and
sometimes causing degradation. Changes in land use and land cover, and land
degradation, have adverse impacts on forest resources and biodiversity. Given that they
are intertwined in various ways, there is a need for treatment of land, forests, pastures,
and biodiversity as an integrated resource.
Land degradation Status
India supports approximately 16% of the world’s population and 20% of its livestock on
2.5% of its geographical area. This pressure on land has led to its deterioration—soil
erosion, waterlogging, salinization, nutrient depletion, lowering of groundwater tables,
and soil pollution—largely caused by human interventions. Water erosion accounts for
45.3% of the total land area, chemical deterioration 4.2%, wind erosion 4.1%, physical

36
deterioration 3.5%, and 5.5% is not fit for agriculture and this is likely to continue—land
under soil erosion rising from 166.0 million hectares (MHa) in 1997 to 189.0 MHa in
2019; water-logging, 12.7 to 22.3 MHa; and salinity, 11.0 to 15.1 MHa (Narayan and
Ram Babu 1983).
According to the data provided by the National Remote Sensing Agency and Forest
Survey of India based on satellite imagery, 80 MHa of 142 MHa under cultivation is
substantially degraded and about 40 MHa of 75 MHa under the forest department has a
canopy density cover less than 40% (Gadgil 1993). Nearly 11 MHa of pasturelands is
substantially degraded, thus a total of 131 MHa representing about 40% of the country’s
landmass, has a productivity below its potential. However, according to the Wastelands
Atlas of India 2000 (1:50 000 scale map), the total wastelands area covered in 584
districts is 63.85 million which accounts for 20.17% of the total geographical area. It is
this figure of about 64 MHa that has been used in the projections.
Concerns
� Soil erosion has led to loss of topsoil and terrain deformation. Siltation, an off-site
effect of erosion, is reducing the reservoir storage capacity by 1%–2% annually.
� Human-induced waterlogging is resulting in a rise in the water table.
� Salinization is likely to render more land unfit for biomass production, especially in
the irrigated areas in Uttar Pradesh, Haryana, Punjab, Rajasthan, and Karnataka.
� Most regions have a net negative balance of nutrients and suffer from a gradual
depletion in the level of organic matter, a trend that is likely to continue. Maintaining
the nutrient balance and preventing nutrient deficiencies is a major concern given
that the required demand for food production will have to be met through increased
intensity of cropping (Sehgal and Abrol 1994).
� Over-extraction far exceeding recharge in areas where groundwater is mostly used for
industrial and agricultural purposes, has led to progressive lowering of water table
affecting the economy of water in use and the environment.
� Improper and indiscriminate use of agrochemicals and untreated sewage sludge and
municipal wastes have led to the pollution of soil and water with toxic substances
and heavy metals.
Directions, innovations, and strategies to combat land degradation
The following strategies are suggested:
Short-term strategies
� Assessment of land degradation: Assessment of the nature and extent of degradation
using scientifically sound criteria, indicators, and techniques will help plan
appropriate reclamation measures. The SOTER (Soil and Terrain) database and
GLASOD (Global Assessment of Human-induced Soil Degradation) can be helpful

37
along with rapid inventorying using remote-sensing techniques and GIS (geographical
information system).
� Improvement of degraded land: There is a need for adopting location-specific soil and
water conservation measures to arrest further deterioration and for following practices
that suit local conditions to restore the productivity of degraded lands. A multi-level
stakeholder approach for the planning process is essential to obtain socially balanced
results in which both the economic and ecological objectives are given due weightage.
This requires data about the properties of the land, different types of land-use options
and their effect on the resilience of ecosystems, and technology transfer and training
of farmers, especially small and marginal farmers.
Short- and medium-term strategies
� Revamping agricultural extension: ‘Lab[oratory]-to-land’ concept should be put into
practice by providing land-users multidisciplinary technical information and viable
land-use options and alternatives identified for various agro-ecological and socio-
economic units. Crop combinations/rotations suitable for different agro-ecological
regions (as suggested by the Indian Council of Agricultural Research) need to be
advocated for better land management.
� Waste management: Domestic and municipal wastes, sludge, pesticides, industrial
wastes, etc. need to be used with caution to avoid polluting the soil with heavy metals
and other toxic substances.
Medium-term strategies
� Nutrient deficiency monitoring: Projected increase in cropping intensity and
consequent nutrient depletion make it necessary to develop a system of monitoring
mechanism for soil nutrients. Fertilizer use will need to be optimized (Annexe 1, see
section on agriculture).
� Land and water management: Effective management and rational utilization of land
and water resources for optimum production with minimum hazard to resources is
possible treating natural watershed as a unit. In rainfed areas, in situ soil and
moisture conservation on mini-watershed basis, irrespective of the ownership of land,
should be a major thrust area for increasing productivity.
� Discouraging shifting cultivation with short fallow periods: Shifting cultivation, a
traditional practice responsible for large-scale land degradation due to shortened
fallow cycle, should be discouraged and alternatives provided.
Land use Business-as-usual scenario
The current and projected land-use pattern is presented in Table 25. Table 25 Land use (million hectares) in India: the BAU scenario

38
Forest and Human settlements, Scrub, wasteland, fallow, and Year Agriculture tree cover Pastures industries, etc. remote land
1997 142 71 11 21 64 2020 142 74.1 11 26.2 56.7
Note The totals will not add up to the reporting area of 305 million hectares because forest and tree cover includes forest cover and miscellaneous tree crops and groves as well as agro-forestry (plantation on land included under agriculture) and strip plantations on land included under human settlements, industries, etc. Assumptions: Net sown area will remain unchanged as required increase in agricultural production can be met through increase in cropping intensity. Given the absence of initiatives to enhance pastures and grazing land, this area will remain unchanged. The area under human settlements and industries etc. will increase to accommodate the growing population and to keep pace with industrialization.
Pressure on forests and grazing lands will continue to increase, given that the increase
in human and livestock population will pace the growth in forests and pasture land. This
calls for a review of land-use patterns.
Directions, innovations, and strategies for sustainable land use
The following strategies are suggested:
Short-term strategies
Integrate policies for land use, grazing and fodder, and fuelwood to ensure consistency in
the management of land and forest resources. An efficient and effective administrative
structure for prescribing and regulating land use would be essential.
Medium- and long-term strategies
� Create a national land use commission under the stewardship of the Planning
Commission. This land use commission could enforce the policy set out in National
Land Use Policy: outlines and action points and associated legislation published in
1988 by the National Land Use and Conservation Board, Department of Agriculture
and Co-operation, Ministry of Agriculture. This commission could also address most
of the land-related issues with support from the AIS&LUS (All-India Soil and Land Use
Survey), the NBSS&LUS (National Bureau of Soil Survey and Land Use Planning), and
the FSI (Forest Survey of India).
� Adopt a holistic approach to land management: Land management should combine
technologies and policies to integrate ecological, socio-economic, and political
principles taking into account intra- as well as inter-generational equity.
� Adopt a multi-level stakeholder approach: All communities and land users should be
involved in technology development for leveraging local experience and knowledge and
ensuring maximum involvement and hence success of any intervention. Negotiated
participatory approach should be adopted.

39
� Develop and utilise a land-use capability classification: Land capability classification
developed by the US Department of Agriculture, modified to suit Indian conditions,
should be adopted to ensure efficient resource allocation. This would require
completion of land and soil surveys underway and the development of an inventory of
land resources on the basis of land-use classification. This, along with scientifically
sound practices, will address land degradation problems and maintain land quality for
sustainable use.
� Revisit the issue of land tenure and land titles: Property rights of land is an important
issue with ‘ownership vs. user rights’ and ‘private vs. communal ownership’ being
main concerns. Issues of land reforms and conferring ownership rights to small and
marginal farmers, women, and tenants need to be addressed. Land titling policy is a
user-enabling incentive at the national level. Clear property rights or security of
tenure, developed in participation with local land users, will be an important incentive
for long-term investments in the technologies and systems necessary for sustainable
land use. Land tenure regime should be clear, flexible, and secure. Checking the
fragmentation of land holdings by providing security of land rights and land tenure is
a major challenge in the agricultural sector.
Long-term strategies
Focus on education, training, research, and technology development: There is a need to
focus on evolving resource conservation technologies and practices and on analysing the
conditions and principles of sustainable land use. Efficient use of marginal lands needs
to be encouraged and areas of untapped potential developed to ensure optimal
utilization.
Alternative scenario
In the alternative scenario, if one were to adopt the prescription in the National Forest
Policy (1988) of bringing 30% of the country’s reporting area under tree cover by 2047
(see section on Forests), this will lead to an increase in the area under ‘forests and tree
cover’ from 74 MHa in the BAU scenario to about 83.4 MHa. There is also a decrease in
the area under ‘scrub, wasteland, fallow, remote land’ from 56.7 MHa in 2020 under the
BAU scenario to 50.6 MHa under the alternative scenario. The area under other sections
remains constant.
Forests
Business-as-usual scenario
Area under forest and tree cover
Table 26 gives the estimates of area under forest and tree cover in the current and BAU
scenario. The projections assume a marginal increase in forest cover due to improvement
in some of the forest area currently under scrub. Also, the composition of forests will
change in favour of dense forests, primarily because of improvement in crown density of
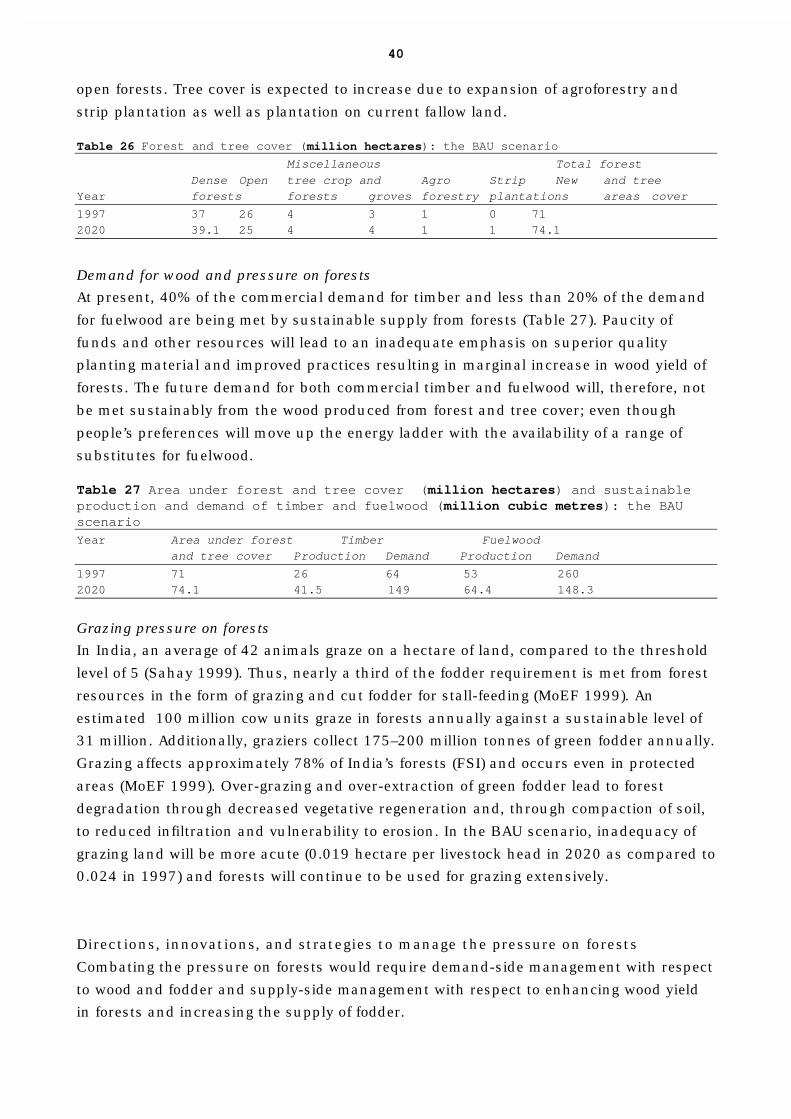
40
open forests. Tree cover is expected to increase due to expansion of agroforestry and
strip plantation as well as plantation on current fallow land. Table 26 Forest and tree cover (million hectares): the BAU scenario
Miscellaneous Total forest Dense Open tree crop and Agro Strip New and tree Year forests forests groves forestry plantations areas cover
1997 37 26 4 3 1 0 71 2020 39.1 25 4 4 1 1 74.1
Demand for wood and pressure on forests
At present, 40% of the commercial demand for timber and less than 20% of the demand
for fuelwood are being met by sustainable supply from forests (Table 27). Paucity of
funds and other resources will lead to an inadequate emphasis on superior quality
planting material and improved practices resulting in marginal increase in wood yield of
forests. The future demand for both commercial timber and fuelwood will, therefore, not
be met sustainably from the wood produced from forest and tree cover; even though
people’s preferences will move up the energy ladder with the availability of a range of
substitutes for fuelwood. Table 27 Area under forest and tree cover (million hectares) and sustainable production and demand of timber and fuelwood (million cubic metres): the BAU scenario
Year Area under forest Timber Fuelwood and tree cover Production Demand Production Demand
1997 71 26 64 53 260 2020 74.1 41.5 149 64.4 148.3
Grazing pressure on forests
In India, an average of 42 animals graze on a hectare of land, compared to the threshold
level of 5 (Sahay 1999). Thus, nearly a third of the fodder requirement is met from forest
resources in the form of grazing and cut fodder for stall-feeding (MoEF 1999). An
estimated 100 million cow units graze in forests annually against a sustainable level of
31 million. Additionally, graziers collect 175–200 million tonnes of green fodder annually.
Grazing affects approximately 78% of India’s forests (FSI) and occurs even in protected
areas (MoEF 1999). Over-grazing and over-extraction of green fodder lead to forest
degradation through decreased vegetative regeneration and, through compaction of soil,
to reduced infiltration and vulnerability to erosion. In the BAU scenario, inadequacy of
grazing land will be more acute (0.019 hectare per livestock head in 2020 as compared to
0.024 in 1997) and forests will continue to be used for grazing extensively.
Directions, innovations, and strategies to manage the pressure on forests
Combating the pressure on forests would require demand-side management with respect
to wood and fodder and supply-side management with respect to enhancing wood yield
in forests and increasing the supply of fodder.

41
Short-term strategies
Management of open forests through plantation forestry and joint forest management
‘Open forests’ representing 26 MHa are degraded (FSI 1998). The following may be noted
in this regard:
� 15 MHa of this can be managed under the joint forest management (JFM) programme
and the remaining used for commercial timber production. Nearly 10 MHa is already
under the JFM leaving 5 MHa to be covered.
• 4.2 MHa of scrub (less than 10% cover) can be brought under plantations and 4 MHa
currently under culturable waste and permanent fallow could be used for raising
trees. This would imply an increase to about 83.4 MHa under tree cover by 2020.
• Plantation forestry requires the participation of communities, NGOs, and the private
and corporate sectors.
Information management
Information availability and transparency are important in developing any forestry
policy. State forest departments and the Ministry of Environment and Forests should
collect, analyse, and communicate forestry information on a regular basis.
Short- and medium-term strategies
Management of dense forests through the PA (protected area) network and through
conservation forestry
Of the 37 MHa of dense forests in 1997
• We may develop 18.7 MHa as PAs that may be kept aside for conservation. The
current area under PAs being 15.6 MHa, it must be increased by 3.1 MHa by 2020.
• And we may manage the remaining dense forest area sustainably for meeting local
requirements and for conservation forestry.
Expansion of agroforestry and strip plantations
There is a need to increase the area under agroforestry and farm forestry on agricultural
lands by planting trees along farm boundaries and in homesteads in a manner that does
not affect crop production adversely. Bring an estimated 4 MHa net sown area for
growing tree crops. Strategies for promoting agroforestry should focus on
• removing legal barriers, bringing about market reforms, fostering farmer–industry
linkages, and enhancing the overall profitability of farm forestry. Legal restrictions on
land-ownership and on the harvesting and transport of timber products need to be
rationalized. Proposed provisions for the revision of norms for timber extraction and
transport are inadequate.
• timber pricing by forest corporations should reflect the scarcity value of timber.
• farmer–industry linkages need to be strengthened by a free flow of information
between the producers and consumers on demand, supply, and pricing of timber
products. Further, farmers should receive support from research and extension.

42
Also, we need to bring about 1 MHa along roadsides, canals banks, etc. under strip
plantations and enrich about 4 MHa currently under miscellaneous trees through
plantations.
Demand-side management: wood resources
� Improved efficiency in use: R&D and import of technology, with the government
playing the role of a facilitator, could address the urgent need to improve the
technology used by the forest-based industries, particularly paper. Financial
assistance, say soft loans to the industries, would promote efficient technologies.
� Development of alternatives and substitutes: Only 14% of the paper consumed is
recovered due to paucity of funds with the government and municipal bodies, lack of
policies on the collection and utilization of waste paper and incentives for the
informal network, diversion of recovered paper, and ignorance of its potential. This
has resulted in import of waste paper but supply through imports is likely to dry up
(Chemprojects 1999). The strategy should aim at improving the recovery of waste
paper to over 33% through measures such as segregation of waste paper at source
(household level), strengthening the informal network of waste paper collection
through price incentives, preventing diversion of waste paper, etc. (Sharma,
Beukering, and Ramaswamy 1999). Similarly, developing alternatives to fuelwood can
produce desirable outcomes and, hence, the strategy should focus on an integrated
energy programme augmenting such alternative fuel systems as LPG (liquefied
petroleum gas) and kerosene.
� Management of pasture and fodder: Limiting livestock population through selective
breeding and pasture and fodder management could mitigate the pressure on land
and forests.
Medium-term strategies
Livestock management
• Double work output of 80% of the work animal force (nondescript animals) by
breeding them with selected Indian draught breeds so as to halve their requirement.
Proper breeding of indigenous cattle with improved breeds for increasing both milk
yield and draught power is required.
• Earmark funding for specific livestock breeding programmes, in which the Indian
Veterinary Research Institute, Bareilly, and the National Dairy Research Institute,
Karnal, will have the key role.
Short- and medium-term strategies
• Formulate and implement a national policy on livestock population and the creation
of forage resources.
• Carry out a detailed assessment of fodder requirement, at the national and regional
levels, on the basis of which regional allocation for production of fodder can be
43
undertaken with proper financial and technical support from the appropriate
ministries is required. The Indian Grassland and Fodder Research Institute, Jhansi,
has a distinct role to play in this regard.
• Encourage stall-feeding to control grazing, incentives to farmers to include green
fodder in crop rotation, and use of crop residue as fodder. Fodder could also be grown
on land under agroforestry and JFM.
Medium- and long-term strategies
Technological advancements for increased forest productivity
Superior genetic stock is a prerequisite for correcting the poor annual productivity of
Indian forests (1.36 cubic metres/hectare compared to the world average of 2.1). Annual
productivity of clonally propagated eucalyptus plantation could be 20–40 cubic
metres/hectare compared to 4–5 in traditionally raised plantations. Improvement in
growth and productivity through superior quality planting stock, especially in industrial
plantations and agroforestry, will enhance the sustainable supply of wood.
Emerging sustainable alternative scenario
Forest management strategies as already described, could lead to an increase in total
forest and tree cover (83.4 MHa) and increased sustainable supply of timber (123.2
million cubic metres) and fuelwood (about 91.8 million cubic metres). Due to the
difficulty in quantifying the impact of substitution on demand, the demand for timber is
at the same level both in the BAU and alternative scenario at 149 million cubic metres.
The unsatisfied demand for timber could be met through imports and the use of
substitutes. In the case of fuelwood, despite increased supplies, the demand of fuelwood
will decline and stabilize at about 76 million cubic metres with the provision of more
efficient substitutes, e.g. LPG.
Strategies towards increasing the supply of fodder from agricultural and forest lands
and limiting livestock population growth through selective breeding will result in a
livestock population pegged at 585 million in 2019. It is envisaged, however, that
livestock populations will stabilize at these levels. While it may not be possible to
increase area under pastures, fodder supply could be enhanced from farm lands, farm
forests, and JFM areas. Stall-feeding could be encouraged along with controlling grazing
in forests. Reduced demands on forests for grazing in the long term coupled with wood
demand optimization and strategic forest management will mitigate the pressure on
forest resources. This, in turn, will have a positive impact on the country’s biodiversity.
Biodiversity India’s biodiversity is being gradually decimated. Maintaining viable populations of
species, whether plant or animal is crucial in biodiversity conservation requiring the
conservation of important ecosystems, habitats and the ecological processes of which
they are part. According to IUCN, the World Conservation Union, 5% of a country’s area
should comprise PAs. India has almost achieved this target and given the intense

44
pressures on land and forests, there is only a limited scope to increase the area under
parks and sanctuaries. Currently, the PA network, does not adequately cover some
important biomes and species of conservation significance. It is, therefore, recommended
that the area under parks and sanctuaries be increased to 160 national parks and 698
sanctuaries accounting for 18.7 MHa as suggested by Rodgers, Panwar, and Mathur
(2000). This coverage will provide a ‘better distribution of protected areas with less gaps
in the protection of biogeographic zones, biomes and species and fewer spatial or
geographic gaps in the pattern of PA coverage’ (Rodgers, Panwar, and Mathur 2000).
Since the number of protected areas cannot be increased substantially, the next
question is of size of the reserves. Ideally, an effective conservation area should be large
enough to ensure that all target species have genetically viable population sizes and that
ecological processes are maintained. In general, therefore, the thumb rule is to have
areas as large as possible to maintain viable population sizes and if not, make do with
what one has and manage the area intensively. This can be done, for example, by
ensuring genetic viability by the creation of corridors, translocation and restocking,
ensuring effective conservation of the surrounding reserve and protected forests
including buffers. Further, the portions of dense forests other than PAs, are also
important for maintaining the extant biodiversity, a significant proportion of which lies
outside the PA network.
Directions, innovations, and strategies
Short-term strategies
Controlling wildlife trade
The following steps will help tighten the enforcement of the existing wildlife law (MoEF
1994)
� setting up a central task force to be designated as the Directorate of Prevention of
Crime against wildlife, comprising an intelligence unit, a legal cell, an investigation
wing, and an operations cell to carry out undercover operations; creating special
courts in each state for wildlife crimes;
� creating a central wildlife crime databank to collect and analyse data on wildlife
trade;
� activating state forest vigilance cells and creating legal cells within each state forest
department; and
� forming an enforcement cell by the state chief wildlife wardens.
Enhancing enforcement
Project authorities fund the environmental impact assessments of their projects, some of
which have potentially adverse effects (e.g. mining and power plants). This undermines
the objectivity of impact assessment thereby clearing many projects that despoil forest
tracts. Further, clearance to projects that may damage the environment is sometimes
obtained in contravention of the Forest and Wildlife (Protection) Act. This calls for setting

45
up an independent panel of experts to review all the EIAs so as to provide objectivity to
the process.
Creation of new conservation reserves
New types of legally recognized reserves should be created, where sustainable utilization
and community involvement is the norm. Community reserves will protect landscapes,
ecosystems, and species traditionally or culturally conserved by local communities
(Kothari and Bhatt 1998). Conservation reserves can either be additional to the current
PA network or may act as a buffer around the existing ones and are to be created on
government land alone. Local communities could help in managing such areas to meet
their bona fide livelihood needs, perhaps through ecotourism. The inclusion of these
categories within the Wildlife (Protection) Act, currently on the anvil, must be expedited.
Conservation forestry
Divisional working plans need to be more sensitive to issues of biodiversity conservation.
A new working plan code being drafted to guide the development of working plans should
incorporate the following concerns.
� Biannual census of large mammals using scientific census techniques and of water
birds for important wetlands.
� Updated information on vegetation communities and floral inventories with
cooperation of the Botanical Survey of India, Zoological Survey of India, and
universities.
� Identification of important habitats (e.g. caves, dens, sandbanks, salt licks, areas of
unique plant species assemblages, and wetlands) and their management.
� Compartment histories inclusive of all wildlife data.
� Simple regular monitoring and maintaining records of sightings and observation of
flora and fauna by forest guards and foresters.
It is also suggested that each state must identify forests, grasslands, wetlands, and other
areas of importance for biodiversity and include those on forest lands within protection
working circles (where silviculture is not allowed). These can also be designated as
wildlife ranges where wildlife range officers report to the territorial divisional forest
officers. This will ensure that biodiversity conservation is not merely restricted to the
wildlife wing of the forest departments but becomes a regular feature of forest
management.
Integration of rural development with biodiversity concerns
Creation of a forest area development agency to operate along the lines of the District
Rural Development Agency, headed by the forest department, is a progressive step. The
chief development officers in forest areas should be from the forest department as in
Andhra Pradesh.

46
Short- and medium-term strategies
Biodiversity policy and legislation
� A national biodiversity strategy and action plan is being prepared. Once finalized, it
needs to be implemented within a fixed time frame with the setting up of institutions
to oversee its implementation. The Indian Biodiversity (Conservation and Regulation)
Bill needs to be considerably amended before its passage by Parliament given its
many lacunae.
� Current policy environment suffers from lack of coordination and communication
between different departments and agencies, the activities of which impinge on
natural resources. There is a need to incorporate biodiversity, forestry, and land-use
considerations in development planning itself. At the district level, a coordination
committee headed by the district collector and involving the forest department and
other relevant agencies including the District Rural Development Agency needs to be
created to oversee the impact of different projects on natural resources.
� To ensure that all development activities and actions relating to the utilization,
production, or management of natural resources are evaluated before
implementation, it is necessary to create an environmental cell in all the departments
connected with the management of air, water, land, and biodiversity.
Mapping of forest types, protected areas, natural forests, etc.
This will provide a way for determining possible corridors, habitat contiguity, and buffer
zones and facilitate biodiversity conservation. Further, vegetation mapping according to
forest types needs to be done. The FSI data need to show the disaggregated changes in
area according to forest types and natural forest areas.
Preservation plots
Uttar Pradesh and Uttaranchal have forest preservation plots for assessing chan
conserving and protecting vegetation as well as for assessing ecological changes over a
period of time. These plots need to be demarcated and actively maintained.
Landscape-level planning
For large ecosystems of value, landscape-level plans are needed as in Uttar Pradesh and
Uttaranchal where the forest departments have already prepared three landscape-level
plans, one each for Corbett, Dudhwa, and the Nanda Devi national parks.
Involving the private sector
The private sector needs to be involved much more in such biodiversity projects as the
development of forest areas for tourism or in the setting up of nature parks and
interpretation centres or in bioprospecting agreements. There must be, however, priority
to local communities.
Involving the local community

47
� Community biodiversity registers must be developed before issues of ownership of
resources and equitable sharing of benefits are sorted. The government needs to issue
clear guidelines for managing bioprospecting agreements.
� In PAs, there can be several ways of involving local communities or at least mitigating
some of their hardships (MoEF 1994)
− reserving up to 50% of available posts (e.g. wildlife guards and forest watchers)
− employing them in collecting snake venom, building anti-poaching awareness
groups, and other local activities
− capturing and training elephants who devastate standing crops to reduce conflicts
− initiating timely schemes of compensation for those who lose their cattle to wildlife.
Short- to long-term strategies
Population surveys and assessments and creating databases
The Ministry of Environment and Forests through the Botanical Survey of India and the
Zoological Survey of India, could play a guiding role by preparing a list of priority issues
and areas for circulation to relevant institutions, based on a countrywide consultation of
experts. Funding for these prioritized projects could be stepped up to ensure that
research focuses on these issues. The Ministry of Environment and Forests must set up
a database perhaps by making use of the Global Biodiversity Information Facility.
In situ conservation
Good management of the extant populations in the wild is essential for their survival;
these mahy include facilitating gene flow through corridors, introduction of new genetic
stock, and translocation. Large-scale manipulations of the extant populations—
translocations etc.—could be popularized.
Captive breeding and species reintroduction
Captive breeding and species reintroduction will maintain viable and healthy genetic
captive stocks in conservation facilities and can provide animals for possible
reintroduction to the wild at a later stage or for supplementing current populations with
new stock. In situ measures are, however, preferred, since in most cases it is cheaper to
protect populations in their natural habitat than to reintroduce captive-bred ones.
Limitations of space, finances, and facilities for captive breeding make species
prioritization a primary concern. Zoos may need to restrict their efforts to a few species
that can benefit from captive breeding initiatives, such as small-bodied species of
Chiroptera, Rodentia, and Insectivora. Mini zoos and deer parks can act as a sink for the
surplus, hybrid, aged, and infirm animals.
Ex situ techniques for plants
48
Gene banks—seeds, pollen, embryo, tissue, cells, and DNA—are alternatives to
conservation of complete organisms requiring minimal space. Seed storage under
controlled conditions can be used for short-/medium-/long-term storage. Tissue culture
offers advantages over traditional methods in conserving vegetatively propagated plants,
species with seeds that do not germinate readily, species with long vegetative period
prior to seed set, and sterile individuals with useful traits. Cryopreservation is useful for
long-term germplasm storage.
Medium-term strategy
There is a need to involve the local community: eco-tourism and recreation forestry are
being tried as income-earning options for local communities. These need to be formalized
and included in the relevant policies, to be preceded by in-depth studies to determine
the feasibility and the costs and benefits of such projects to all stakeholders.
Conclusion The short term, medium term, and long term strategies are required to be followed for
promoting sustainability of India's material resources. This would require policy
changes, involve larger issues of implementation, and call for a change in governance.

49
Annex 1 Strategy to achieve an alternative sustainable scenario for agriculture, domestic and commercial sectors, municipal services, transport services, mining industry, and manufacturing industries
Agriculture Directions Innovations and strategies Action by Time frame Irrigation Canal water pricing Water price to reflect the scarcity and value of water State governments Medium to � Increase the price of canal water in a phased manner long term from 25% of O&M to full recovery of O&M costs � Increase capital costs gradually Long term Rationalizing power tariffs and � Increase power tariff at least to equal the average State governments Short term related issues price charged by private power suppliers in the agricultural sector � Promote metered supply � Ensure reliable and steady supply: privatize state electricity boards Decentralized management of Promote decentralized management State governments in Short to canal irrigation � Implement the Irrigation Act in all states collaboration with NGOs long term � Promote water users associations through fiscal and non-fiscal incentives � Provide a grant to cover the setting up costs � Give a formal legal status to water users associations � Define property rights Define the organizational structure of the water users associations Promotion of conjunctive irrigation Integrate tube well schemes with canal irrigation by State governments Medium term digging tube wells along the drainage lines Sprinkler and drip irrigation � Extend the existing scheme of providing financial State governments and Short to incentives for installation charges to all states agriculture extension medium term � Promote awareness and provide technical knowledge services, corporate sector, Medium to to farmers through agriculture extension services research institutes long term � Improve the technology (R&D) Waste water utilization Initiate R&D on the utilization of waste water Ministry of Water Resources, Medium to Ministry of Science & long term Technology, Ministry of Agriculture, municipal corporations Fertilizer Fertilizer pricing � Remove price distortions between the three major Ministry of Chemicals Short to nutrients, namely nitrogen, phosphorous, and and Fertilizers medium term potassium � Decontrol prices of urea in phases; bring it on par with the import price: increase the price initially
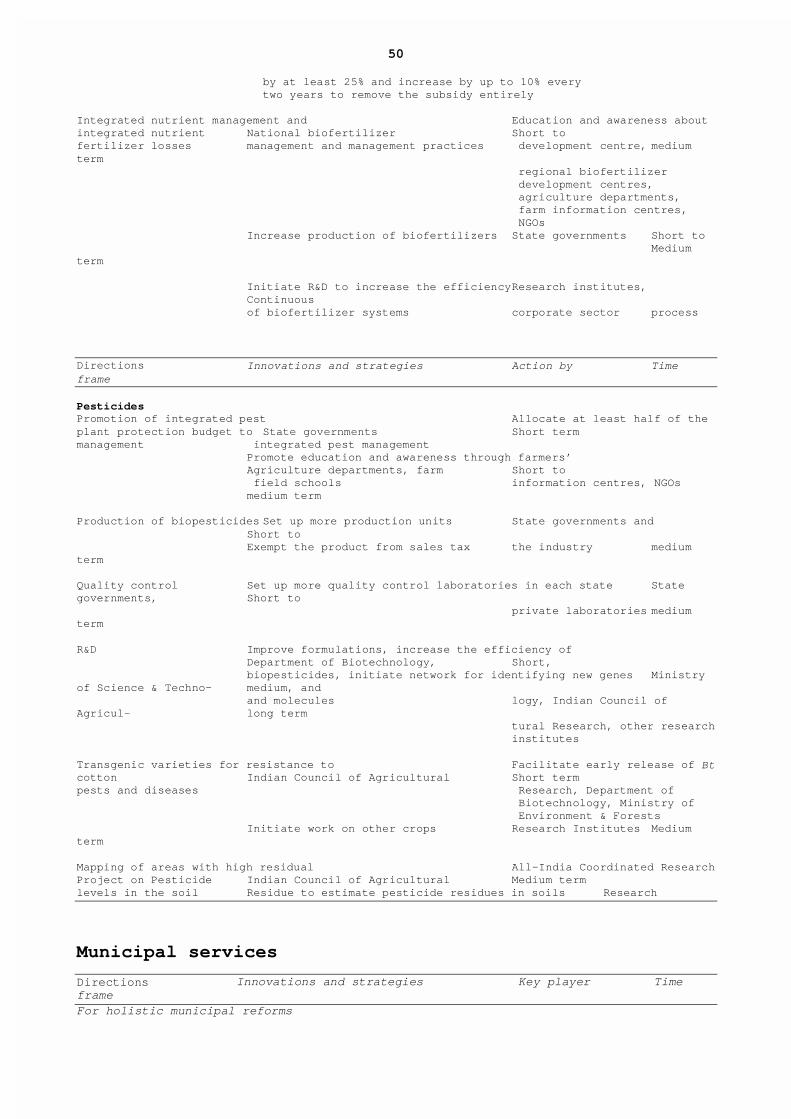
50
by at least 25% and increase by up to 10% every two years to remove the subsidy entirely Integrated nutrient management and Education and awareness about integrated nutrient National biofertilizer Short to fertilizer losses management and management practices development centre, medium term regional biofertilizer development centres, agriculture departments, farm information centres, NGOs Increase production of biofertilizers State governments Short to Medium term Initiate R&D to increase the efficiency Research institutes, Continuous of biofertilizer systems corporate sector process Directions Innovations and strategies Action by Time frame Pesticides Promotion of integrated pest Allocate at least half of the plant protection budget to State governments Short term management integrated pest management Promote education and awareness through farmers’ Agriculture departments, farm Short to field schools information centres, NGOs medium term Production of biopesticides Set up more production units State governments and Short to Exempt the product from sales tax the industry medium term Quality control Set up more quality control laboratories in each state State governments, Short to private laboratories medium term R&D Improve formulations, increase the efficiency of Department of Biotechnology, Short, biopesticides, initiate network for identifying new genes Ministry of Science & Techno- medium, and and molecules logy, Indian Council of Agricul- long term tural Research, other research institutes Transgenic varieties for resistance to Facilitate early release of Bt cotton Indian Council of Agricultural Short term pests and diseases Research, Department of Biotechnology, Ministry of Environment & Forests Initiate work on other crops Research Institutes Medium term Mapping of areas with high residual All-India Coordinated Research Project on Pesticide Indian Council of Agricultural Medium term levels in the soil Residue to estimate pesticide residues in soils Research
Municipal services
Directions Innovations and strategies Key player Time frame For holistic municipal reforms

51
Financial reforms � Designing fiscal instruments to broaden the financial State governments, Medium term resource base for infrastructure municipal corporations � Reforms in the intergovernmental transfers of funds to State governments Short term municipalities Institutional restructuring �
Functional decentralization of municipalities to facilitate Municipal corporations Medium term increased approachability and transparency vis-à-vis communities. � Increasing community participation in local governance Municipal corporations Long term and residents welfare associations, community- based organizations Capacity-building in Developing inherent capabilities of municipal officials to Research institutes, NGOs Medium term municipalities manage and monitor services Targeting performance � Developing framework for performance measurement Research institutes Short term improvement and benchmarking of municipal services � Linking budgetary allocations with continual perform- State governments, Medium term ance improvements municipal corporations For water supply Improving functional and � Private sector participation in different stages of water State governments, Medium term operational efficiencies supply system municipal corporations � Private sector participation in distribution to be identi- Short term fied as a priority area Upgrading the existing � Equipping the urban water utilities with state-of-the-art State governments, Medium term infrastructure operation and performance monitoring systems research institutes � Financial resource mobilization Short term � Technical collaboration with international consultants State governments, Medium term � Improved management by minimizing losses using such donor agencies tools as water audits and resource conservation methods Research institutes, Short term NGOs, and municipal corporations
Directions Innovations and strategies Action by Time frame
Increase economic viability Design of appropriate water pricing mechanism Municipal corporations Short term of operations justifying the costs of treatment and supply For municipal solid waste management Minimizing waste generation Changes in lifestyle habits by awareness generation NGOs and funding Long term at source activities, targeting higher- and middle-income groups organizations Scientific management of waste �
Segregation at source and door-to-door collection system RWAsa, NGOs, CBOsb, and Short term

52
� Composting at neighbourhood level in a decentralized way municipal corporations � Harnessing the potential value of recyclables by formali- zing the network of ragpickers Enhancing the technical and �
Involving the private sector at both micro and macro levels Municipal corporations, Medium term managerial capabilities for �
Providing fiscal incentives to attract private sector state governments Short term efficient waste management participation Improved technology for � Designing waste collection systems to avoid multiple Research institutes Medium term collection and treatment handling � Enhancing use of such efficient technologies as aerobic NGOs and municipal Short term composting, anaerobic digestion, and sanitary landfill corporations for decentralized waste treatment Institutional and regulatory �
Introducing structural changes within the municipal Municipal corporations, Medium term reforms corporation for improvements in performance state governments � Involving greater community participation in local NGOs, CBOs Short term governance � Effective implementation of Municipal Solid Waste CPCBc/SPCBsd Short term (Management and Handling) Rules, 1999
� Use of market forces, mandatory standards, and volun- State governments, MoEFe, Medium/ tary initiatives for effective waste management private sector long term For waste water management Minimizing pollution loads from � Expanded sewerage network to increase waste water Municipal corporations Medium/ waste water discharge collection efficiency and funding organizations long term � Augmentation of waste water treatment capacities Community, NGOs Medium term � Reduction in water consumption, recycling, and reuse of the treated waste water Reinforcing the institutional �
Integration of policy interventions with other municipal Municipal corporations, Long term mechanisms sectors, particularly solid waste management state governments � Training and capacity-building of municipal officials in Research institutes Short term the use of improved technology � Formulation of appropriate taxing/fee mechanisms for Municipal corporations, Short term waste water collection and treatment state governments a Resident welfare associations a Community-based organizations cCentral Pollution Control Board dState Pollution Control Boards eMinistry of Environment and Forests
Transport services Directions Innovations and strategies Action by Time frame Check the decline in the share of Increase productivity by improving technology Indian Railways Long term the railways Increase capacity on high-density corridors Indian Railways and Union Short term
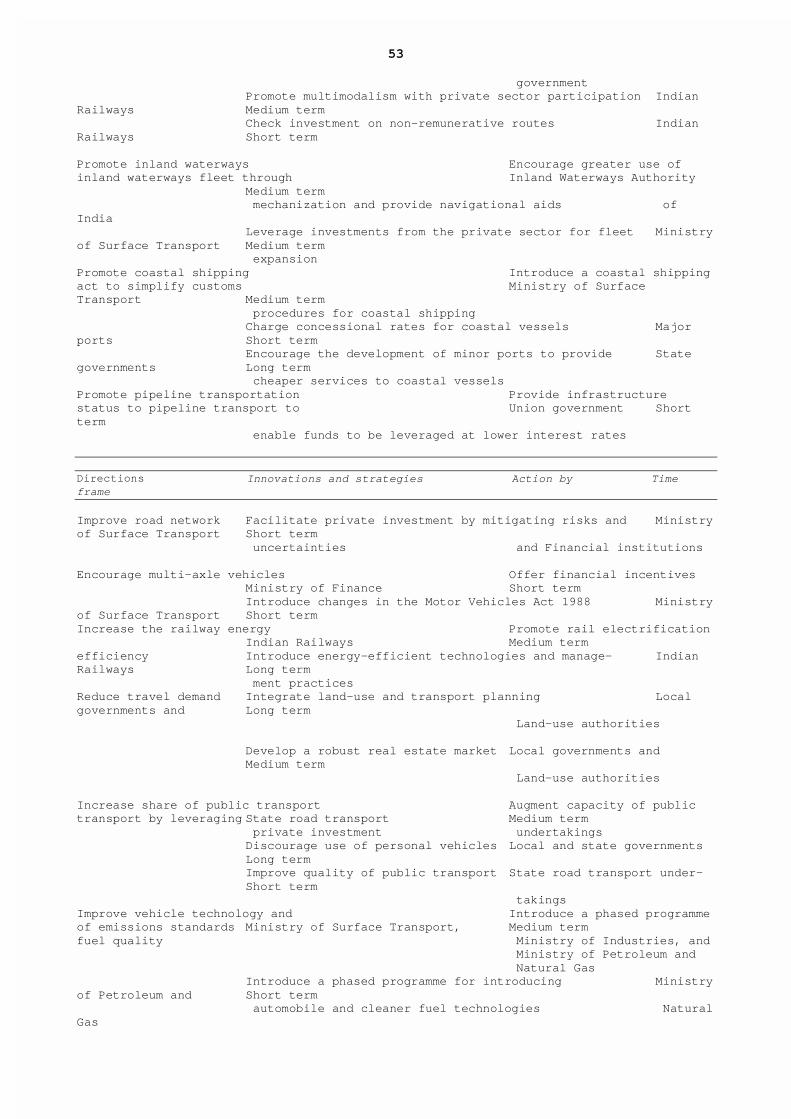
53
government Promote multimodalism with private sector participation Indian Railways Medium term Check investment on non-remunerative routes Indian Railways Short term Promote inland waterways Encourage greater use of inland waterways fleet through Inland Waterways Authority Medium term mechanization and provide navigational aids of India Leverage investments from the private sector for fleet Ministry of Surface Transport Medium term expansion Promote coastal shipping Introduce a coastal shipping act to simplify customs Ministry of Surface Transport Medium term procedures for coastal shipping Charge concessional rates for coastal vessels Major ports Short term Encourage the development of minor ports to provide State governments Long term cheaper services to coastal vessels Promote pipeline transportation Provide infrastructure status to pipeline transport to Union government Short term enable funds to be leveraged at lower interest rates
Directions Innovations and strategies Action by Time frame
Improve road network Facilitate private investment by mitigating risks and Ministry of Surface Transport Short term uncertainties and Financial institutions Encourage multi-axle vehicles Offer financial incentives Ministry of Finance Short term Introduce changes in the Motor Vehicles Act 1988 Ministry of Surface Transport Short term Increase the railway energy Promote rail electrification Indian Railways Medium term efficiency Introduce energy-efficient technologies and manage- Indian Railways Long term ment practices Reduce travel demand Integrate land-use and transport planning Local governments and Long term Land-use authorities Develop a robust real estate market Local governments and Medium term Land-use authorities Increase share of public transport Augment capacity of public transport by leveraging State road transport Medium term private investment undertakings Discourage use of personal vehicles Local and state governments Long term Improve quality of public transport State road transport under- Short term takings Improve vehicle technology and Introduce a phased programme of emissions standards Ministry of Surface Transport, Medium term fuel quality Ministry of Industries, and Ministry of Petroleum and Natural Gas Introduce a phased programme for introducing Ministry of Petroleum and Short term automobile and cleaner fuel technologies Natural Gas

54
Introduce inspection and maintenance programme Ministry of Surface Transport Short term for in-use vehicles
Mining industry Direction Innovation and strategies Action by Time frame Ban on mining in ecologically fragile or Prepare a schedule of lands where Central and state governments Short term sensitive and biologically rich areas mining will not be permitted Rehabilitation of old abandoned Levy a cess on mineral production to Central and state governments Medium term mine sites finance the work Formulation of mine closure policy Prepare detailed guidelines on mine Central and state governments Short term closure Rehabilitation of degraded land in Make it mandatory for mine operators Central and state governments, Medium term ongoing and planned mines to furnish performance guarantee mine operators bonds before mining lease is granted or renewed Environmental protection in areas � Prepare a policy document �
Central and state governments Short term where small- and medium-scale � Follow the ‘polluter pays’ principle � Central Pollution Control Board mining operations are carried out and state pollution control boards, mine operators Promotion of waste utilization Prepare an action plan on technology Central and state governments, Short term options and fiscal measures needed industry, industry associations, to promote waste utilization Central Pollution Control Board, and state pollution control boards Environmental protection of � Develop environmental indicators for � Central and state governments, Short term mining areas different activities industry � Encourage companies to obtain �
Central Pollution Control Board environmental certification and state pollution control boards Ocean mining Develop a policy paper on ocean Central government Short term mining for implementation
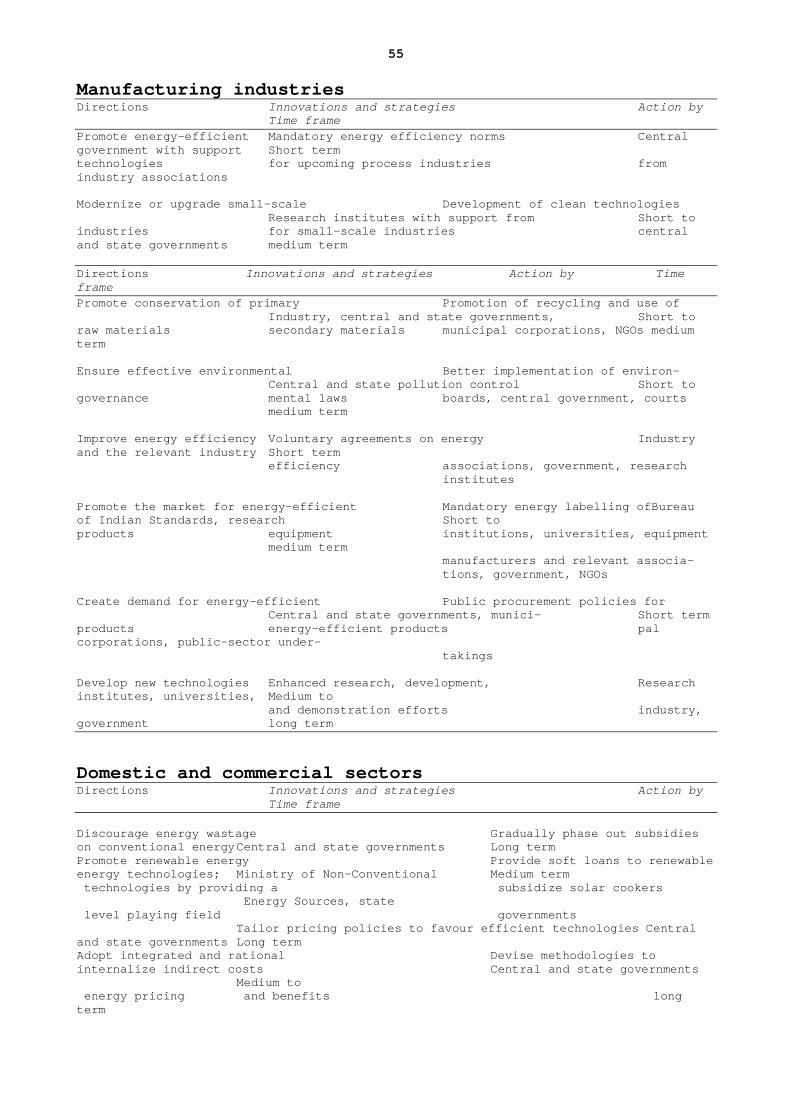
55
Manufacturing industries Directions Innovations and strategies Action by Time frame Promote energy-efficient Mandatory energy efficiency norms Central government with support Short term technologies for upcoming process industries from industry associations Modernize or upgrade small-scale Development of clean technologies Research institutes with support from Short to industries for small-scale industries central and state governments medium term Directions Innovations and strategies Action by Time frame Promote conservation of primary Promotion of recycling and use of Industry, central and state governments, Short to raw materials secondary materials municipal corporations, NGOs medium term Ensure effective environmental Better implementation of environ- Central and state pollution control Short to governance mental laws boards, central government, courts medium term Improve energy efficiency Voluntary agreements on energy Industry and the relevant industry Short term efficiency associations, government, research institutes Promote the market for energy-efficient Mandatory energy labelling of Bureau of Indian Standards, research Short to products equipment institutions, universities, equipment medium term manufacturers and relevant associa- tions, government, NGOs Create demand for energy-efficient Public procurement policies for Central and state governments, munici- Short term products energy-efficient products pal corporations, public-sector under- takings Develop new technologies Enhanced research, development, Research institutes, universities, Medium to and demonstration efforts industry, government long term
Domestic and commercial sectors Directions Innovations and strategies Action by Time frame Discourage energy wastage Gradually phase out subsidies on conventional energy Central and state governments Long term Promote renewable energy Provide soft loans to renewable energy technologies; Ministry of Non-Conventional Medium term technologies by providing a subsidize solar cookers Energy Sources, state level playing field governments Tailor pricing policies to favour efficient technologies Central and state governments Long term Adopt integrated and rational Devise methodologies to internalize indirect costs Central and state governments Medium to energy pricing and benefits long term

56
Improve the efficiency of use Enforce stringent efficiency standards Energy Conservation Bill Short to Make energy labelling mandatory medium term Increase the budget for R&D Central government Short to medium term Enhance the adoption of Identify appropriate target groups Ministry of Non-Conventional Short term improved cook-stoves Invest in R&D of cook-stove design Energy Sources, NGOs Medium term Formulate and implement action-bound programmes Short to for dissemination and adoption of cook-stoves medium term Ensure a reliable and long-term Adopt holistic planning to encompass fuels and Planning Commission, supply of conventional fuels all sectors Ministry of Coal, and Ministry of Petroleum and Natural Gas Use alternative technologies Initiate R&D for processed biomass fuels Ministry of Non-Conventional Long term Energy Sources Enhance marketing efforts and community sharing NGOs Medium to for adoption of bio-gasifiers long term Create awareness of the benefits of biogas plants NGOs Short to medium term
57
Annex 2 References
Bhanumathidas N and Kalidas N. 1998
Programmes and policies of fly ash utilisation in India, p. 32 [Proceedings of the International Conference on Fly Ash Disposal and Utilisation, New Delhi, 20–22 January 1998, organized by the Central Board of Irrigation and Power and Fly Ash Mission, TIFAC] Census of India. 1991
Housing and amenities New Delhi: Registrar General and Census Commissioner, Ministry of Home Affairs. 371 pp. CEA. 1997 Fourth National Power Plan 1997–2012, p. 42 New Delhi: Central Electricity Authority. 346 pp. CGWB. 1995
Groundwater resources of India New Delhi: Central Groundwater Board Chemprojects. 1999
Study on forest industry Chemprojects Design and Engineering Pvt. Ltd Report submitted to Ministry of Environment and Forests, Government of India, New Delhi Chitale M A. 1992
Population and water resources of India In The Inevitable Billion Plus: science, population and development, pp. 111–127, edited by V Gowarikar Pune: Unmesh Communications. 452 pp. Chopra R and Sen D. 1992
Natural bounty and artificial scarcity: water resources In The Inevitable Billion Plus: science, population and development, edited by V Gowarikar Pune: Unmesh Communications. 452 pp. CPCB. 1996
Annual Report 1995 / 96 New Delhi: Central Pollution Control Board. 165 pp. CPCB. 2000a
Status of water supply and waste water generation collection, treatment and disposal in Class 1 cities Delhi: Central Pollution Control Board. 51 pp. CPCB. 2000b Parivesh [newsletter] Delhi: Central Pollution Control Board. 26 pp. CWC. 1993
Reassessment of water resources potential of India New Delhi: Central Water Commission CWC. 1996
Water and related statistics information system directorate: performance overview and management improvement organization New Delhi: Ministry of Water Resources. 314 pp. DGH. 1999
Petroleum exploration and production activities in India, 1998/99 New Delhi: Ministry of Petroleum and Natural Gas, Directorate General of Hydrocarbons. 70 pp.

58
FSI. 1998
The State of Forests Report 1997 Dehra Dun: Forest Survey of India. 72 pp. Gadgil M. 1993
Biodiversity and India's degraded lands Ambio 22: 167–172 Kothari A and Bhatt S. 1998
Protected areas in India: proposal for an expanded system of categories Pune: Kalpavriksh. 23 pp. MoEF. 1994
Report of the committee on prevention of illegal trade in wildlife and wildlife products New Delhi: Ministry of Environment and Forests. 68 pp. MoEF. 1999 National Forestry Action Programme, vol. 1 New Delhi: Ministry of Environment and Forests. 179 pp. MoPNG. 2000
Basic statistics on Indian petroleum and natural gas 1999/2000 New Delhi: Ministry of Petroleum and Natural Gas MoWR. 1999
Water resources development plan of India: policy and issues New Delhi: Ministry of Water Resources. 26 pp. Narayan V V D and Ram Babu. 1983
Estimation of soil erosion in India Journal of Irrigation and Drainage Engineering 109: 419–434 Rodgers W A, Panwar H S, and Mathur V B. 2000
Wildlife Protected Area Network in India: a Review (Executive Summary) Dehra Dun: Wildlife Institute of India. 44 pp. Sahay K B. 1999
Problem of livestock population New Delhi: Indian Institute of Technology Saleth R M. 1996
Water Institutions in India: economics, law and policy New Delhi: Commonwealth Publishers. 299 pp. Sehgal J and Abrol I. 1994
Soil degradation in India: status and impact New Delhi: National Bureau of Soil Survey and Land Use Planning. 80 pp. Sharma V K, Beukering P, and Ramaswamy K V. 1999
International trade and recycling in developing countries: the case of waste paper trade in India London: Executive Summary of the Final Report, IIED WHO. 1993
Assessment of sources of air, water and land pollution: a guide to rapid source inventory techniques and their use in formulating environmental control strategies Geneva: World Health Organization. 208 pp.

59
Annex 3 Assumptions for 2019 used in developing the BAU scenario for power sector Parameter BAU scenario Demand* Aggregation of projected sectoral electricity consumption T&D losses (%) 20 Fuel mix Hydro Based on annual accretion between the period beginning the 8th Plan and ending the 9th Plan Nuclear Official targets for plants cleared by CEA; those sanctioned and ongoing and new plants for the11th Plan deferred until 2019 Nuclear plant load factor (%) 60 Renewables Official targets for plants cleared by CEA; those sanctioned and ongoing and new plants for the11th Plan deferred until 2019 Renewables plant load factor (%) Wind: 25, Solar: 25, SHP (small hydro projects): 20, Biomass: 60 Imports of hydro- Half the potential of projects in the pipeline (constituting 15% of hydro potential in both Nepal and Bhutan) available. power Domestic electricity demand (1997–2019) growing annually at 8% in Nepal and 10% in Bhutan Thermal Residual Thermal plant load factor (%) 68.5 Oil-based thermal Official targets for plants cleared by CEA; those sanctioned and ongoing and new plants for the 11th Plan deferred until 2019 Domestic coal -based Constrained by domestic availability of 368 million tonnes (after catering to the need of other industries) Imported coal-based Residual Gas-based thermal Official targets for plants cleared by CEA, those sanctioned and ongoing and new plants for the11th Plan deferred until 2019 Thermal efficiency (%) 36 Pollution control ESP installation: 100%, ESP efficiency: 95%, FGD installation: 0% mechanisms Low NOx combustion: capacity addition beyond 1997, NOx emission reduction factor: 30% Ash content (%) in coal used for power generation: 37 Sulphur content in coal (%): Domestic = 0.35, Imported = 0.5 Fly ash management Dry collection of ash (%) 70
Utilization of ash Cement: share of pozzolana cement in total cement: 40% Fly ash content in pozzolana cement: 20% Bricks: share of bricks using fly ash in total bricks: 20% Fly ash in bricks: 25%
*Electricity demand in the BAU scenario (2019): Agriculture = 195 TWh; Commercial
sector: 243 TWh; Residential sector: 156.3 TWh; and Manufacturing sector: 535 TWh
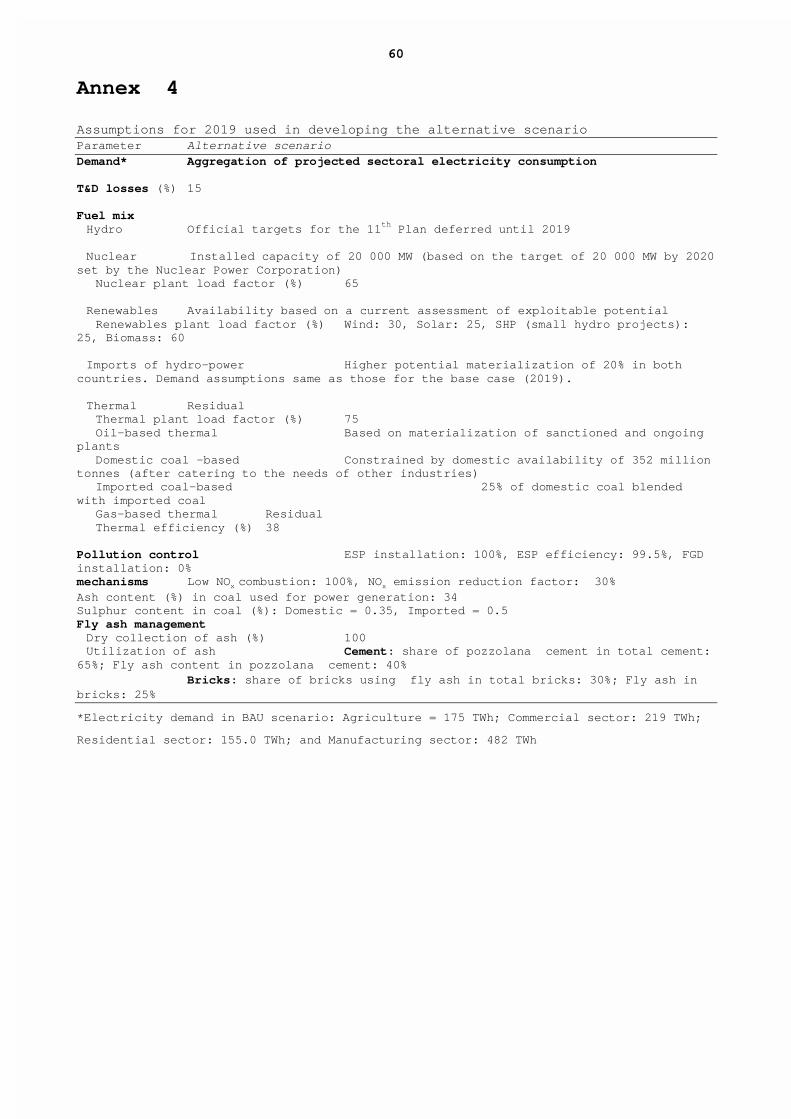
60
Annex 4
Assumptions for 2019 used in developing the alternative scenario Parameter Alternative scenario Demand* Aggregation of projected sectoral electricity consumption T&D losses (%) 15 Fuel mix Hydro Official targets for the 11th Plan deferred until 2019 Nuclear Installed capacity of 20 000 MW (based on the target of 20 000 MW by 2020 set by the Nuclear Power Corporation) Nuclear plant load factor (%) 65 Renewables Availability based on a current assessment of exploitable potential Renewables plant load factor (%) Wind: 30, Solar: 25, SHP (small hydro projects): 25, Biomass: 60 Imports of hydro-power Higher potential materialization of 20% in both countries. Demand assumptions same as those for the base case (2019). Thermal Residual Thermal plant load factor (%) 75 Oil-based thermal Based on materialization of sanctioned and ongoing plants Domestic coal -based Constrained by domestic availability of 352 million tonnes (after catering to the needs of other industries) Imported coal-based 25% of domestic coal blended with imported coal Gas-based thermal Residual Thermal efficiency (%) 38 Pollution control ESP installation: 100%, ESP efficiency: 99.5%, FGD installation: 0% mechanisms Low NOx combustion: 100%, NOx emission reduction factor: 30% Ash content (%) in coal used for power generation: 34 Sulphur content in coal (%): Domestic = 0.35, Imported = 0.5 Fly ash management Dry collection of ash (%) 100
Utilization of ash Cement: share of pozzolana cement in total cement: 65%; Fly ash content in pozzolana cement: 40% Bricks: share of bricks using fly ash in total bricks: 30%; Fly ash in bricks: 25%
*Electricity demand in BAU scenario: Agriculture = 175 TWh; Commercial sector: 219 TWh;
Residential sector: 155.0 TWh; and Manufacturing sector: 482 TWh

61
Annex 5
Assumptions
The alternative scenario envisages reduced resource requirements through a
combination of interventions, e.g. technological developments, governance measures,
and market-based instruments (Annex 1).
In addition, it prescribes the use of fossil fuels in accordance with their availability.
Though gas is preferred on environmental considerations, its domestic resources are
limited. In addition, prices of imported gas are subject to fluctuations as they are linked
to international oil prices. Domestic coal production, on the other hand, is expected to be
constrained, necessitating coal imports as well.
Given a choice of importing gas versus coal, gas imports are preferable given that gas
is a relatively ‘green’ fuel. A shift from coal to gas will also help diversify the fuel mix.
Accordingly, the balance energy requirements under the alternative scenario are met
through gas imports. However, some quantities of coal would continue to be imported for
use in steel and cement industries (coking coal) and for blending in power generation.
Assumptions for the transport sector
The transport sector accounts for the bulk of reductions in oil demand that accrue from
reversing the current preference for road to rail for freight movement, according priority
to inland waterways and coastal shipping, improvements in energy efficiency, higher
penetration of mass transport systems and use of cleaner fuels—ULSD (ultra low
sulphur diesel) or CNG (compressed natural gas) in urban transport, etc. (Annex 1).
Assumptions for the power sector
Demand for oil and gas in the BAU scenario is estimated on the basis of proposed
additions in capacity as considered by the Central Electricity Authority in its long-term
planning exercise. While all categories of projects are considered for gas-based power
generation, oil-based thermal capacity is restricted to the existing capacity plus
sanctioned and ongoing projects. The pessimistic outlook on oil-based generation draws
support from the volatility in oil prices.
Under the alternative scenario, detailed assessments have been undertaken for non-
fossil fuel based generation—hydro, nuclear, and hydro imports. For thermal sources,
oil-based capacity remains capped at current plus the sanctioned and ongoing projects.
Given the constraints in coal production, coal availability for power generation is
restricted. Coal imports are considered as well, however, these are primarily for blending
and in coastal locations far away from coal bearing areas. Gas-based capacity accounts
for the rest of the thermal capacity.
Assumptions for other sectors
Demand for oil and gas in other sectors has been based on an international cross-
sectional analysis. Oil intensity plotted against per capita income levels in different

62
countries indicated that the intensity was lower in the developed economies (higher per
capita income levels) than that in the developing economies. The analysis, based on the
expected increase in per capita income levels in India, indicated that it would be possible
to reduce oil intensity by 18% in 2020. However, more conservative estimate of a 10%
reduction by 2020 has been employed for this analysis. Similar reduction levels were
also assumed for the intensity of gas use.