vision beyond “routine”- diabetic retinal...
TRANSCRIPT

Vision beyond “routine”- Diabetic Retinal ExamWe are excited to launch the first in a series of whitepapers that explores the intersection of medical care and eye care. We plan to share key data related to a broad range of topics from chronic medical conditions that impact the eye to chronic eye conditions that negatively impact one’s way of life, ability to manage other conditions and independence.
In our first edition we explore the Diabetic Retinal Exam (“DRE”) measure and our expectation for future changes in this critical metric.
SynopsisQuality measures play an important role in managed care and we expect even greater emphasis in the future as the environment continues to evolve.
Changes in the Medicare Advantage DRE measure “cut points” have driven health plans to improve the overall management of vision care for diabetics.
Our analysis suggests the market will likely experience future increases in DRE “cut points” given historical, and current, market performance.

Medicare Advantage Population When Medicare was created in 1965, its purpose was to provide health insurance to people ages 65 and over, regardless of their income, medical history or health status. The Medicare population lives with a variety of health issues including chronic disease states (e.g., diabetes); vision related conditions (e.g., cataracts) and challenges (e.g., corrective vision); and cognitive impairments (e.g., dementia). Taken together these factors can have a significant impact on their physical and mental well-being.
According to a 2010 study by the Centers for Medicare and Medicaid Services (CMS) of Medicare Fee-for-Service (FFS) beneficiaries, among the 15 chronic conditions examined, the prevalence of multiple chronic conditions was high, with over two-thirds of the population having two or more chronic conditions.
Number of Chronic Conditions
0–1
2–3
4–5
6+
32%
32%
23%
14%
1An Overview of Medicare, Kaiser Family Foundation. Retrieved from https://www.kff.org/medicare/issue-brief/an-overview-of-medicare/ 2Eye Conditions, EyeMed. Retrieved from http://www.eyesiteonwellness.com/category/healthy-vision/eye-conditions/ ³Chronic Conditions Among Medicare Beneficiaries, CMS. Retrieved from https://www.cms.gov/research-statistics-data-and-systems/statis-tics-trends-and-reports/chronic-conditions/downloads/2012chartbook.pdf
Today, Medicare serves over 59 million older people and younger people with disabilities. In 2016, Medicare spending accounted for 15 percent of total Federal spending. 1
Vision disorders are the second most prevalent health condition in the country 2
The top five chronic conditions, in terms of percentage of Medicare FFS beneficiaries affected: 3 • High blood pressure • High cholesterol • Heart disease • Arthritis • Diabetes

4What is Diabetic Retinopathy? American Academy of Ophthalmology. Retrieved from https://www.aao.org/eye-health/diseases/what-is- diabetic-retinopathy. 5What is Diabetic Retinopathy? American Academy of Ophthalmology. Retrieved from https://www.aao.org/eye-health/diseases/what-is-diabetic-retinopathy.
DIABETIC RETINOPATHY
People suffering with diabetes are at risk for diabetic retinopathy, which occurs when high blood sugar levels cause damage to the blood vessels in the retina. 4 Diabetic retinopathy, a serious complication of both Type 1 and Type 2 diabetes, is a leading cause of vision impairment and blindness. The earliest indications of diabetic retinopathy can be identified in the phase known as background retinopathy, where eye doctors are able to see physical signs of the condition in the patient's eye. Diabetic retinopathy may progress through four stages: three are non-proliferative which are mild, moderate and severe, with
the last being proliferative diabetic retinopathy (PDR). Through early detection and careful management of blood sugar, there is potential for a patient to reverse the progression of diabetic retinopathy.
Three stages of non-proliferative diabetic retinopathy (NPDR): In the mild non-proliferative retinopathy stage, small areas of balloon-like swelling in the retina’s tiny blood vessels, called microaneurysms, occur. These microaneurysms may leak fluid into the retina.
Prevalence of Diabetic Retinopathy (affected population)
40–49
50–64
65–74
75+
1,000,000
~3,200,000
~1,900,000
~1,500,000
CHRONIC EYE CONDITIONS
Throughout this series, we will view chronic eye conditions in two specific cohorts; the first cohort is those eye conditions that are related to, or are a result of, a medical chronic condition, such as diabetes. The second cohort is chronic eye conditions that are not associated with any specific medical condition, such as cataracts, glaucoma and age-related macular degeneration (AMD), but that are highly prevalent within the Medicare population.
This paper will focus on diabetic retinopathy and how plans are performing from a STAR ratings perspective. The prevalence of diabetic retinopathy is significant in the senior market and expected to increase as the diabetes epidemic continues.
Above: an example of non-proliferative diabetic retinopathy

Proliferative diabetic retinopathy (PDR) is the more advanced stage of diabetic retinopathy and occurs when the retina grows new blood vessels. These new vessels often bleed into the vitreous, the jelly-like substance that fills the middle of the eye, and may cause scar tissue to form. Scar tissue may cause problems with the macula - the center of the retina, which is responsible for the ability to see details of objects - or even lead to a detached retina. Leakage from blood vessels may
also cause the retina to swell. When the macula swells, this is called Diabetic Macular Edema (DME), which is the most common reason for why those with diabetes lose their vision.5 This is yet another reason early detection and appropriate management of diabetic retinopathy is so important.
The early stages of diabetic retinopathy usually have little to no symptoms and may progress unnoticed until it affects vision. Diabetic retinopathy may be detected by a comprehensive eye exam that includes a dilated fundus exam and, if needed, a diagnostic test to determine Diabetic Macular Edema (DME), an ocular coherence tomography (OCT). A comprehensive eye exam will check the retina for changes to the blood vessels, leaking blood vessels, swelling of the macula, changes in the lens or damage to the nerve tissue.
While vision loss due to diabetic retinopathy is irreversible, early detection and treatment can reduce the risk of blindness by 95 percent. Individuals with all types of diabetes, whether type 1, 2 or gestational, may be at increased risk for diabetic retinopathy. This statistic further emphasizes the importance of an annual comprehensive eye exam for seniors diagnosed with diabetes, who also likely have other co-morbidities.
Between 40 and 45 percent of Americans diagnosed with diabetes are in one of the four stages of diabetic retinopathy, although only half may be aware of it. 7
6What is Diabetic Retinopathy? American Academy of Ophthalmology. Retrieved from https://www.aao.org/eye-health/diseases/what-is- diabetic-retinopathy 7Facts about Diabetic Eye Disease, National Eye Institute (NEI). Retrieved from https://nei.nih.gov/health/diabetic/retinopathy
Above: an example of proliferative diabetic retinopathy
In the moderate non-proliferative retinopathy stage, blood vessels that nourish the retina may swell and distort. They may also lose their ability to transport blood. Both conditions cause characteristic changes to the appearance of the retina and may contribute to Diabetic Macular Edema (DME).
In the severe non-proliferative retinopathy stage, many more blood vessels are blocked, depriving blood supply to areas of the retina. These areas secrete growth factors that signal the retina to grow new blood vessels.

HEDIS Quality Measures
CMS STAR RATING SYSTEM
The Healthcare Effectiveness Data and Information Set (HEDIS) is a tool used by more than 90 percent of American health plans to measure performance on 81 measures across five domains of care. 8 As Medicare Advantage (“MA”) and Part D drug plans vary in terms of coverage, costs and network, the Centers for Medicare and Medicaid Services (CMS) created a Five-Star Rating System to measure how well the plans perform. MA health plans are scored on five different categories: staying healthy; managing chronic conditions; plan responsiveness and care for member complaints; problems getting services and choosing to leave the plan and health plan customer service. 9 Plans receive separate star ratings on each individual category, which have different weights, and are aggregated to a single STAR rating to summarize its overall performance.
Medicare reviews performance on an annual basis, with new STAR ratings released each fall. These ratings are used as a decision making tool by consumers who are selecting a plan for the first time or considering switching to another plan and to illustrate how various plans perform in key quality areas. A high STAR rating will allow a health plan to advertise its scores to potential new and existing members to increase member retention and encourage growth for its MA products.
CMS rewards MA plans that earn four or more stars with performance bonuses, which may bring in an extra five percent a year per member. 10 These rewards are significant incentives to improve or maintain plan performance and significantly contribute to contract profitability.
Health Plans STAR/Quality teams play a critical role in ensuring individual HEDIS measures are met through close coordination with their medical network and partners. These teams are focused on a
Based on the number of contracts that have received four and five-star ratings, it is clear that MA plans are investing significantly in quality and disease management programs to improve or maintain their STAR ratings.
8HEDIS & Performance Measurement, NCQA. Retrieved from http://www.ncqa.org/hedis-quality-measurement 9The Five-Star Rating System and Medicare Plan Enrollment, Medicare Interactive. Retrieved from https://www.medicareinteractive.org/get-answers/overview-of- medicare-health-coverage-options/changing-medicare-health-coverage/the-five-star-rating-system-and-medicare-plan-enrollment 10How Are You Preparing for the 2018 Star Rating Changes? CareNet Healthcare Services. Retrieved from https://carenethealthcare.com/2017/09/20/how-are-you-preparing-for-the-2018-star-rating-changes/.

broad array of analytics, programs and cross-functional strategic planning to maximize scores and overall member health and wellness. The “Comprehensive Diabetes Care” subset of measures requires health plans to gather data related to the management of members with diabetes to ensure they are receiving recommended screenings and exams. The Diabetic Retinal Exam (“DRE”) measure can be maximized through close coordination and targeted programs between the health plan, managed vision care partner, primary care physicians, optometrists and ophthalmologists. Per HEDIS instructions, providers may submit codes to substantiate the retinal exam measure being met. For example, eye codes (920xx) or evaluation and management codes (992xx) paired with a diabetes ICD-10 code and CPT Category II codes (2022F, 2024F, 2026F and 3072F) are sufficient to support this measure being satisfied 12
EVOLUTION OF DRE CUT POINTS
As one of CMS’ strategic goals is to improve the quality of care and general health status of Medicare
40%
5 Stars
4 Stars
3 Stars
2 Stars
1 Star
2014 2015 2016 2017 2018
CMS Diabetic Eye Exam Cut Points
60%
80%
100%
beneficiaries, it is constantly enhancing measures and methodology in order to accurately gauge the performance of plans and contracts.
As demonstrated in the graph below 13, we can see that the four and five-star thresholds increased beginning in the 2016 benefit year, meaning that there was a higher standard for plans to meet to receive that coveted four or five-star rating. As we will see in this section, the effects of that cut point change on the market and overall plan performance has been significant.
11HEDIS 2018 Measures, NCQA. Retrieved from http://www.ncqa.org/Portals/0/HEDISQM/HEDIS2018/HEDIS%202018%20Measures.pdf?ver=2017-06-28-134644-370 12Understanding HEDIS for Ophthalmology, Review of Ophthalmology. Retrieved from https://www.reviewofophthalmology.com/article/understanding-hedis-for-ophthalmology. 13Trends in Part C & D Star Rating Measure Cut Points (2017), CMS. Retrieved from https://www.cms.gov/Medicare/Prescription-Drug-Coverage/PrescriptionDrugCovGenIn/Downloads/2018-Cut-Point-Trend-2017_12_14.pdf

50
2014 2015 2016 2017 2018
DRE Stratification by Performance Level (absolute value of contracts)
250
450
28
121
118
169
58
43
193
91
15
48
88
137
94
2451
171
98
64
6
82
125
345
150
20%
2014 2015 2016 2017 2018
DRE Stratification by Performance Level (percentage of contracts)
40%
80%
100%
60%
6%
28%
27%
39%
15%
11%
48%
23%
4%
24%
35%
23%
12%
6%13%
44%
25%
16%
9%
38%
32%
21%
5 Stars
4 Stars
3 Stars
2 Stars
1 Star
5 Stars
4 Stars
3 Stars
2 Stars
1 Star
When analyzing the DRE STAR ratings from the 2014 through 2018 benefit years, the distribution of contracts by STAR cohorts did not follow a bell curve distribution. The 2014 and 2015 benefit years saw a majority of four and five-STAR ratings. Then CMS “raised the bar” for benefit year 2016 on four and five STAR metrics which resulted in a significant decrease in the percentage of contracts at this high performance level. From a Health Plan perspective, the DRE performance could have remained constant but the STAR rating decreased as a result of the increased “cut point”. In addition those health plans with lower year-over-year performance may have experienced a decrease in two STARs ratings — impacted both by their own performance and the impact of “raising the bar”.
The DRE contract measure performance supports the perspective that changes to the cut points impact future year plan behavior and tactics. For example, when the cut points changed in the 2016 benefit year, a significant downward shift occurred from the number of four and five star ratings received, with a corresponding sizeable increase in the number of two and three-star ratings. But since the 2016 benefit year, the cut points have stabilized and health plans have reacted to the cut point changes and improved underlying metrics. We highlight that four and five-star ratings begin to increase to the levels seen prior to the 2016 contraction.

5-STAR 2014 2015 2016 2017 2018
% of contracts 39% 23% 12% 16% 21%
% of members 46% 32% 22% 21% 33%
A disproportionate number of members are in higher performing DRE contracts
Five-STAR DRE Performance
5M
2014 2015 2016 2017 2018
DRE Stratification by Performance Level—Membership Weighted (absolute value, in millions)
15M
25M
0.8M
3.6M
3.9M
6.9M
2.3M0.9M
7.6M
5.3M3.8M
4.6M
5.8M
3M0.7M
7.3M
6.7M
4M 6.6M
7.2M
6M
0.4M
5 Stars
4 Stars
3 Stars
2 Stars
1 Star
20%
DRE Stratification by Performance Level—Membership Weighted (percent of members)
40%
80%
100%
60%
5%
24%
26%
46%
14%
5%
47%
32%
18%
33%
26%
22%
4%
39%
36%
21%
2%
29%
36%
33%
2014 2015 2016 2017 2018
5 Stars
4 Stars
3 Stars
2 Stars
1 Star
Do these trends and takeaways change when we account for membership? To find out, we layered in membership associated with each contract and found that overall the number of members within a STAR cohort exhibited a similar, but more pronounced, trend. The analysis demonstrates that a disproportionate number of members are in higher performing DRE contracts–for example–the five STAR cohorts had a greater share of members relative to the contract mix:
FIVE-STAR RATED CONTRACTS AND SUSTAINABILITY
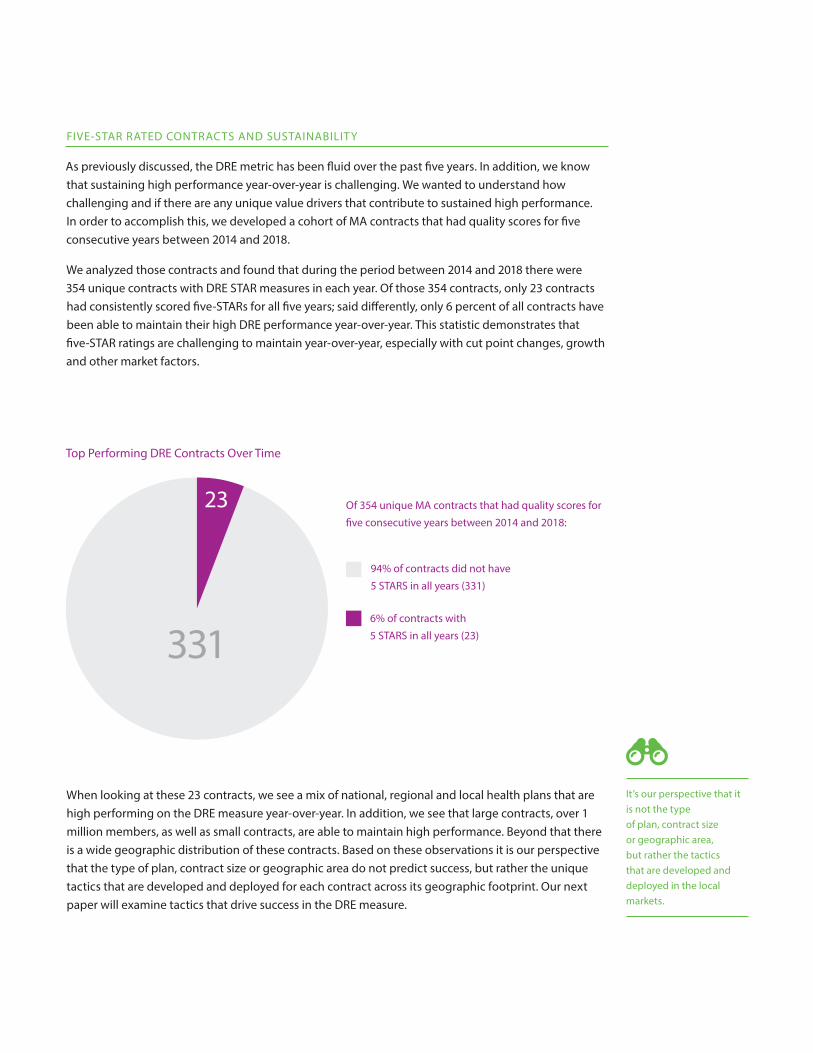
As previously discussed, the DRE metric has been fluid over the past five years. In addition, we know that sustaining high performance year-over-year is challenging. We wanted to understand how challenging and if there are any unique value drivers that contribute to sustained high performance. In order to accomplish this, we developed a cohort of MA contracts that had quality scores for five consecutive years between 2014 and 2018.
We analyzed those contracts and found that during the period between 2014 and 2018 there were 354 unique contracts with DRE STAR measures in each year. Of those 354 contracts, only 23 contracts had consistently scored five-STARs for all five years; said differently, only 6 percent of all contracts have been able to maintain their high DRE performance year-over-year. This statistic demonstrates that five-STAR ratings are challenging to maintain year-over-year, especially with cut point changes, growth and other market factors.
It’s our perspective that it is not the type of plan, contract size or geographic area, but rather the tactics that are developed and deployed in the local markets.
94% of contracts did not have
5 STARS in all years (331)
6% of contracts with
5 STARS in all years (23)
Top Performing DRE Contracts Over Time
331
23
When looking at these 23 contracts, we see a mix of national, regional and local health plans that are high performing on the DRE measure year-over-year. In addition, we see that large contracts, over 1 million members, as well as small contracts, are able to maintain high performance. Beyond that there is a wide geographic distribution of these contracts. Based on these observations it is our perspective that the type of plan, contract size or geographic area do not predict success, but rather the unique tactics that are developed and deployed for each contract across its geographic footprint. Our next paper will examine tactics that drive success in the DRE measure.
Of 354 unique MA contracts that had quality scores for
five consecutive years between 2014 and 2018:

MA PLAN AND DIABETIC EYE EXAM MEASURE
ConclusionThe MA population suffers from many chronic conditions, some of which affect vision, such as diabetic retinopathy. CMS’ continued focus on driving high performance for the MA member population has led to changes in measures and related cut points. When looking specifically at the DRE measure, we have seen plans perform well historically, but as CMS changed the cut points, there was a significant impact on plan performance and STAR rating distribution. We are seeing a rebound in four and five-STAR ratings, making it likely that another cut point change may be coming to further drive increased performance. As the cut points evolve, health plans should be ready to adjust their tactics to ensure an increasing number of diabetics are screened for retinopathy. We look forward to diving deep into the tactical perspective in our next whitepaper.
Ready to experience the benefits of a Powered by EyeMed partnership? Contact Brian Goetsch at [email protected] or visit poweredby.eyemed.com to learn more.