vision in high light scattering conditions
TRANSCRIPT

UNIVERSITY OF LATVIA
FACULTY OF PHYSICS AND MATHEMATICS
Gatis Ikaunieks
Summary of the Doctoral Thesis
VISION IN HIGH LIGHT SCATTERING
CONDITIONS
Promotion to the Degree of Doctor of Physics
Subbranch: Medical Physics
Riga, 2010

2
The dissertation work was carried out from 2004 to 2010 in Department
of Optometry and Vision science, Faculty of Physics and Mathematics,
University of Latvia.
Scientific supervisor: Dr. habil. phys., prof. Māris OzoliĦš
Dissertation reviewers:
Dr. habil. phys., prof. Jānis Spīgulis, LU Institute of Atomic Physics
and Spectroscopy
Dr. biol. Uldis Teibe, Rīga StradiĦš University
Prof. Dr. Aleksandr Bulatov, Kaunas University of Medicine
Chairperson of dissertation commission: Dr. habil. phys. Ivars Tāle
The dissertation defended on June 21, 2010, at 11:00 in the conference
hall of the Institute of Solid State Physics, Ėengaraga Street 8.
The dissertation is available at the University of Latvia Library
(Kalpaka Blvd. 4), the Latvian Academic Library (Rūpniecības Street
10) and in the Faculty of Physics and Mathematics, Room F210,
University of Latvia.
This work was supported by the European Social Fund.
© University of Latvia, 2010
© Gatis Ikaunieks, 2010
ISBN 978-9984-45-204-3

3
Annotation
Assessment of visual quality of drivers arouses many discussions
among visual care specialists. Some of the most significant parameters
for assessment of vision for drivers are visual acuity and visual field.
Now Also usefulness of contrast sensitivity tests is discussed. In this
work we investigate another important visual parameter – light
scattering in the eye (straylight).
First aim of the study was to evaluate impact of retinal straylight,
created by entoptic and ectoptic factors on perception of colored (red,
green and blue) visual stimuli. Second aim was to assess possibility to
simulate high level light scattering conditions (fog, cataract) using light
scattering filter – polymer-dispersed liquid crystal plate PDLC. We also
wanted to check out is it improvement of vision, when yellow filter is
used, related with optical factors (absorbing of short wavelengths light
and decrease of light scattering) or neural ones (changes in perceived
brightness of stimuli). The last, we estimated how small aperture in
front of the eye changes retinal stray light.
During researches three methods were used – visual acuity
measurements in normal conditions and in high light scattering
conditions; an electrophysiological method visual evoked potentials
(VEP) and a direct compensation method (van den Berg, 1986).
Visual acuity and VEP measurements showed the worst results for blue
color stimuli in normal and high light scattering conditions. Results
showed that in high light scattering conditions perception of colored
stimuli is mostly influenced by neural factors not optical.
Using PDLC plate it is possible to get the same light scattering level
as created by dense fog or cataract. There is no spectral dependence for
scattered light in dense fog or in case of cataract. PDLC plate showed
spectral dependence for scattered light. Such spectral dependence means
that PDLC plates can adequately simulate the scattering produced by
cataract or fog when achromatic stimuli are used.
Psychophysical retinal straylight measurement showed that yellow filter
doesn’t decrease amount of straylight in the eye. Improvement of
contrast sensitivity in low light condition with yellow filters found by
other authors is more related to neural mechanisms than to optical ones.
Results with aperture showed that it is possible to use a small
aperture for evaluation of amount of the light which penetrates through
the sclera and the iris.

4
Contents
Aims ...................................................................................................... 4 1 Introduction ........................................................................................ 6
1.1 Retinal straylight and disability glare....................................... 7 1.2 Methods for assessment of retinal straylight ............................ 9
1.2.1 Disability glare measurements using contrast
sensitivity and visual acuity tests .............................. 10 1.2.2 Direct compensation method..................................... 10
1.3 Spectral dependence of intraocular straylight ........................ 12 2 Methods and stimuli ......................................................................... 13
2.1 Methods for retinal straylight assessment .............................. 13 2.1.1 Method for assessment of visual acuity in normal
conditions and in high light scattering conditions ..... 13 2.1.2 Electrophysiological method “Visual evoked
potentials” (VEP) ...................................................... 14 2.1.3 Stimulus in the direct compensation method............. 15
2.2 High light scattering conditions used in measurements ......... 17 2.3 Retinal straylight measurements using a yellow filter
or an occluder with small aperture ......................................... 20 3 Results and discussion...................................................................... 22
3.1 Visual acuity measurements in the fog................................... 22 3.2 Visual acuity measurements with the PDLC occluder ........... 23 3.3 Results of the VEP measurements.......................................... 25 3.4 Spectral dependence of retinal straylight measured with
direct compensation method................................................... 27 3.5 Spectral dependence of retinal straylight in the fog ............... 28 3.6 Use of PDLC cell for simulating of high level light
scattering conditions............................................................... 30 3.7 Changes in retinal straylight looking through yellow filters .. 34 3.8 Evaluation of amount of light which penetrates through
sclera and iris using occluder with small aperture.................. 36 4 Conclusions ...................................................................................... 37 5 Publications ...................................................................................... 38 Thesis in international conferences ..................................................... 39 References ........................................................................................... 41 Acknowledgments................................................................................45

5
Aims
Aims of the study:
To assess visual threshold changes for chromatic stimuli depending on
light scattering level created by physiological factors of the eye or
environmental factors (fog). To simulate similar conditions using light
scattering filters. To find possibilities to decrease the amount of retinal
straylight.
Tasks
1. To make equipment and develop methods for assessment of
disability glare.
2. To evaluate spectral dependence of the retinal straylight in
different light scattering conditions (in normal laboratory
conditions, in an artificial fog and with light scattering filters).
3. To measure impact of the polymer dispersed liquid crystal
PDLC filter on the vision
4. To assess possibility to simulate fog or cataract conditions with
PDLC plate.
5. To evaluate how yellow filters or a small aperture in front of the
eye change retinal straylight.

6
1 Introduction
Full assessment of visual quality of drivers, patients after laser
refractive surgery and low vision patients is an important question for
visual care specialists. Vision can be characterized by many parameters.
Some of the most significant parameters are:
• visual acuity;
• visual field;
• contrast sensitivity.
Visual acuity is the primary measure of visual function in clinical
settings (Williams et al., 2008). However, this visual parameter not
always is the most important in the performance of everyday tasks. For
example, orientation-mobility skills of a patient are more correlated with
the extent of visual field remaining and contrast sensitivity function than
with visual acuity (Marron et al., 1982).
Measurements of the visual field are usually done only for elderly
patients. An increased risk to get an eye disease called glaucoma is
related to the ageing process. Untreated glaucoma leads to a permanent
damage of the optic nerve and results in visual field loss, which can
progress to blindness. Visual acuity and visual field were two major
parameters on which the previous European Commission standards on
vision for driving were focused. (Council Directive 91/439/EEC
(1991)). Other visual functions, such as contrast sensitivity, are
mentioned in the new standards as an important parameters for drivers’
vision assessment as well. (Rijn, 2005).
The contrast sensitivity CS is the reciprocal of the threshold contrast
of the stimulus. If a subject is able to perceive the stimulus with a lower
contrast than the other subject, his CS is better (Kaufman et al., 2003).
Patients with an early cataract have significant correlation between
impaired CS and complaints related to vision. In this case it is difficult
to detect low contrast stimuli and therefore there appears problems to
perform some everyday tasks successfully. For these patients visual
acuity and visual field usually are not significantly changed. (Elliott et
al., 1996).
The contrast perception is an important visual function; however,
testing of contrast sensitivity cannot be regarded as a routine test in the
visual care. Some reasons of this situation are the variety of available

7
tests with different standards and the fact that not always it is useful to
test CS in standard photopic conditions. CS could be more affected
when there is a light source somewhere in the patient’s visual field. The
impairment of CS in the presence of a light source at some distance
from the fixation point is related to light scattering in the eye
(straylight). A typical relevant situation is night driving when there are
oncoming car headlamps somewhere in the driver’s visual field. This
causes intraocular light scattering which is important factor that can
affect road safety. There are discussions about the importance of
straylight measurements in clinical practice and in assessment of
drivers’ visual functions (Rijn, 2005; Aslam et al., 2007).
1.1 Retinal straylight and disability glare
In an optically perfect eye, light comes into the eye trough the pupil
and is focused on the retina. In the real eye, part of the light reaching the
retina does not participate in the formation of a normal image. This part
of the light decreases image contrast and thus impairs the perception of
the image. Sometimes this disturbing light is called scattered light, but
not only light scattering creates light which is not focused on the retina.
There are many factors which creates disturbing light in the eye-light
scattering in the eye, light reflectance from optical parts of the eye and
light which penetrates trough the sclera and the iris (Stiles, 1929). The
most common terms which are used in literature to describe this
disturbing light are:
• retinal straylight;
• disability glare.
Disability glare is the loss of retinal image contrast as a result of
intraocular light scatter, or straylight (Aslam et al., 2007; Fransen et al.,
2007). Besides the disability glare there is discomfort glare, too.
Discomfort glare does not affect visual functions (Vos, 2003). This type
of glare has not been evaluated in this research.
Retinal straylight can be created by entoptic and ectoptic factors.
The most important entoptic factors are:
• The light scattering and reflectance from the cornea, lens and
retina (Vos, 2003). All these 3 factors give the same amount of
straylight in young subjects. With age, straylight produced by

8
lens increases (development of early cataract) (Aslam et al.,
2007).
• The light which penetrates trough the sclera and iris. This factor
is stronger for blue eyes (with small amount of pigmentation)
(van den Berg et al., 1991).
Ectoptic straylight sources could be a dirty windscreen of a car, fog,
spectacles etc. (Vos, 2003; de Wit et al., 2003).
Typical situation in which straylight affects perception of an object
is shown in Fig. 1.1. In the picture on the left, the formation of fixation
object (Landolt optotype “C”) and peripheral light source images are
shown in an optically perfect eye (without light scattering). In the
picture on the right, the same situation is in the presence of intraocular
light scatter. In this case a part of the light from peripheral glare source
reaches the central part of the retina, thus reducing contrast of Landolt
“C” retinal image.
Figure 1.1. Formation of retinal images in an optically perfect eye (left) and in
the eye with intraocular light scattering. In the image on the right, the light
from a peripheral object reduces the contrast of fixation object image.
It is possible to show reduction of central image contrast in the
presence of the peripheral glare source using contrast equations. One of
the formulas which can be used for image contrast C calculation is
Weber formula:
bL
)bLo(LC
−= (1.1.),
Lo – luminance of the object; Lb – luminance of the background.

9
The straylight from peripheral glare source reaches the central part
of the retina, thus making brighter the image of the perceived object and
background. The same amount of light must be added to image
luminance Lo and background luminance Lb to calculate the image
contrast in this situation:
)sLb(L
)bLo(L
)sLb(L
)sLb(L)sLo(LC'
+
−=
+
+−+= (1.2.),
where C’ – the contrast of the image in the presence of straylight, Ls –
the increase of luminance created by straylight (Narisada et al., 2004).
Equations (1.1) and (1.2) show that in the presence of straylight image
contrast is always lower than without straylight.
1.2 Methods for assessment of retinal straylight
Over the years, many glare testers have been developed. There are
two main principles which are used in the glare testers:
• Either the visual acuity or the contrast sensitivity is measured in
the presence of a glare source in many testers.
• Direct measuring of the intraocular straylight in the central part
of the retina.
There are some other methods for measuring glare effects; however they
are not often used in clinics. We have tested the possibility to use VEP
method for assessment of disability glare in this research. This method
is described in the practical part of this research.

10
1.2.1 Disability glare measurements using contrast
sensitivity and visual acuity tests
Disability glare testers which are based on the first principle were
used in clinics earlier than the second method. Visual acuity and
contrast sensitivity tests with peripheral glare sources are used in these
methods (Beckman et al., 1992; Rijn et al., 2005). If visual acuity or
contrast sensitivity is tested with glare sources and without them, then
difference between these both measurements shows the effect of
disability glare on the vision. The main disadvantage of these testers is
fact that not only optical factors but also neural factors affect results.
Optical effects and glare sources produces disability glare, therefore
theoretically should always impair visual functions. However some
other researchers have shown that sometimes peripheral glare sources
can improve test results (Waard et al., 1992).
In this research we used direct compensation method based on the
second principle. This method is described in the next chapter.
1.2.2 Direct compensation method
First scientist publications about disability glare appeared long time
ago (Holladay, 1926; Stiles, 1929). However a test which provides a
direct measure of intraocular straylight was developed not so long time
ago (Berg, 1986; Franssen et al., 2006). One method for measuring
retinal straylight is direct compensation method (Berg, 1986). In this
method flickering (~8 Hz) stimulus is showed. The stimulus consists of
a concentric annulus and of a test field in the middle of the ring
(Fig. 1.2).

11
Figure 1.2. Stimulus in direct compensation method. Stimulus consists of
flickering annulus. In the left on-phase is showed – annulus is white; in the
right off-phase is showed. Test field is located in the middle of the ring.
During measurement subject must fixate on the test field. Due to the
light scattering in the eye, the subject perceives flicker in the middle of
the annulus, too. If a test field at the centre of the annulus is illuminated
with light which is flickering at the same frequency as the annulus but in
counter-phase, it is possible by adjusting the luminance of the test field
to compensate the flicker of the straylight coming from annulus. The
flickering in the centre then disappears. The subject’s task during
measurement is to fixate on the test stimulus and to find the level of test
field luminance which compensates flickering in the centre of the
annulus. In the direct method, the retinal straylight is measured
according to the Commission International d’Eclairage (CIE) standards
(Vos, 1984). From this concept the retinal straylight can be calculated
from the formula:
E
Ls
2θ= (1.3),
where L is the luminance of the test stimulus; E is the illuminance at the
pupil plane caused by a straylight source; θ is the angular distance
(degrees) of the glare source from the fixation point.
There is another method – compensation comparison method – for
measuring retinal straylight. In this method similar principle is used as
in direct compensation method. The main difference is that new method
is suitable for random subjects and for routine clinical use. In our
researches we used direct compensation method which is simpler as
second method.

12
1.3 Spectral dependence of intraocular straylight
A spectral dependence of the straylight was the problem which has
been studied for a long time. Many clinical studies have shown that
straylight in the eye predominantly has Mie form, which is not strongly
wavelength dependent (Wooten et al., 1987; Whitaker et al., 1993). A
newer research has shown that in the young and well pigmented eye
light scattering is strongly wavelength dependent and is close to the
Rayleigh scattering (∝λ–4). Straylight is greater than in the Rayleigh
model only for light with long wavelengths (red light) (Fig. 1.3). A red
light enters the eye not only trough the pupil, but penetrates also through
the ocular wall. This effect is greater for the less pigmented eyes.
Results also showed that straylight dependence of the wavelength
decreases with age (Coppens et al., 2006).
Figure. 1.3. Spectral dependence of straylight parameter s. Data are grouped by
subjects’ age and color of eyes (bl – blue; gr – grey; br – brown, pbr – dark–
brown). (Coppens et al., 2006).
Previously mentioned researches are related to the entoptic light
scattering. One of our interests was to evaluate spectral dependence of
the retinal straylight in a dense fog. In the case of light scattering in a
fog, negligible spectral dependence would be expected. Rayleigh
scattering dominates only if the size of the scattering particles is smaller
or similar to the wavelength of the light. A fog consists of water droplets
which mean size form is usually quite large and theoretically there
should be the same scattering level for all wavelengths of the light
(Friedlander, 2000; Mainster et al., 2003).

13
Vos (2003) argues that the straylight veil produced by the ectoptic
scatter (fog) adds to the entoptic veiling light. Therefore, if retinal
straylight measurements are done in a fog, results are affected not only
by optical properties of the fog, but also by light scattering in the eye. If
the entoptic retinal straylight shows spectral dependence, we could
expect some spectral dependence also for measurements done in a fog.
2 Methods and stimuli
2.1 Methods for retinal straylight assessment
We used 3 methods for assessment of the disability glare and the retinal
straylight:
• visual acuity measurements in normal conditions and in high
light scattering conditions;
• using an electrophysiological method Visual evoked potentials
(VEP).
• using a direct compensation method (van den Berg, 1986).
2.1.1 Method for assessment of visual acuity in normal
conditions and in high light scattering conditions
In the beginning of our researches for assessment of disability glare
we used psychophysical visual acuity method. Measurements were done
in normal light scattering conditions and in high level scattering
conditions. There are two reasons why we chose such method for the
assessment of intraocular light scattering. Firstly, such principle for
measurements of disability glare is used in clinic (Rijn et al., 2006) and
the same method was used in previous researches done in our
department (Ozolinsh et al., 2004).
The “Freiburg Visual Acuity Test” (Bach, 2007) program was used for
measurements of visual acuity. Stimulus was black Landolt C optotypes
and they were shown using an adaptive staircase procedure.
For measurements of spectral dependence of the intraocular light
scattering we used also colored stimuli. In one of the researches

14
(Ozolinsh et al., 2006) we used red, green, blue and yellow Landolt
optotypes (Weber contrast was 0.84; 0.30; 0.89 and 0.14 respectively).
Distance from a monitor was 6m. Measurements were done in different
visibility levels of an artificial fog.
In another measurements (Ikaunieks et al., 2008 (2)) black Landolt
C optotypes on colored background (red, green and blue) were used as
stimuli. Weber contrast for all stimuli was 0.85. Distance from a
monitor was 4m. Measurements were done with and without the PDLC
plate in front of the eye.
2.1.2 Electrophysiological method “Visual evoked
potentials” (VEP)
Visual evoked potentials (VEP) is one of the electrophysiological
methods which has been used in clinic and researches for evaluation of
visual system. Special electrodes are attached to the patient’s head and
biosignals from the visual system can be recorded. Periodically
changing stimulus which is used in this measurement is showed
(Fig. 2.1). It is possible to assess visual system by analysis of recorded
biosignal response to the stimuli (Fig. 2.1). There are two main
parameters which are analyzed in the recorded curve – latency and
amplitude. Latency is time (measured in ms) between appearance of the
stimulus and the response. In the recording curve amplitude is measured
from one peak minimum to the next peak maximum. Usually latency
and amplitude of the first positive peak (P100) is analyzed. Latency
become longer and amplitude smaller if there are some pathological
changes or there are problems with detection of the stimulus.
1Hz
20ms
2 Vµ
P100
Figure 2.1. In the picture on the left is shown stimulus which is usually used in
the VEP method. The stimulus is changing in time. In this research black and
red, black and green, black and blue checkerboards were used. In the picture on
the right response to checkerboard stimulus is shown. Horizontal line shows
latency and vertical line shows amplitude of the peak P100.

15
Some authors used The VEP method to evaluate the effect of
straylight on visual functions (Tetsuka et al., 1992, Hidajat et al., 2000).
Electrophysical methods have some advantages in the comparison with
psychophysical methods. Electrophysical methods are objective and
conclusions about visual quality can be made by analysis of two
parameters of the recorded curve: latency and amplitude. Each of these
parameters is sensitive to the different aspects of the stimuli.
Also in this research the VEP method was used for assessment of
the intraocular straylight and its spectral dependence. Ag/AgCl
electrodes were used in the VEP method. The active electrode was
placed on the scalp over the visual cortex at Oz, the reference electrode
was placed at the Cz and the ground electrode at the earlobe, according
to the “10–20” international system. Impedance was less than 10 kΩ for
all recordings. The visual stimuli were pattern-reversal checkerboards
(red-black, green-black and blue-black) consisting of 1 degree checks
and reversing at 1Hz. Luminance of red, green and blue colors was 22
cd/m2. The overall size of stimulus field was 20 degrees. The P100 (first
positive wave) latency and amplitude were established for each VEP
curve.
2.1.3 Stimulus in the direct compensation method
The direct compensation method was the main test for assessment
of retinal straylight in our researches. Principle of this method is
described in chapter “Direct compensation method”
Two different stimuli were used:
• stimulus which was showed on CRT screen;
• stimulus made from light-emitting diodes (LED).
There was specially made program used to show stimulus on CRT
screen. Color of the annulus was red, green or blue. The CIE xy
coordinates for colors used in all experiments were 0.59, 0.36 for red,
0.30, 0.59 for green and 0.16, 0.12 for blue (Minolta CS-100). Dominant
wavelengths for colors were 471 nm, 546 nm and 604 nm, respectively.
The same colors were used in VEP measurements. Stimuli were shown
on the CTX PR960F 19" monitor. Distance from monitor was 0.6m.

16
Subjects chose compensation luminance of the test stimulus using a
keyboard.
There are some disadvantages for the stimuli shown on computer
screen. The CRT screen gives broadband red, green and blue stimuli.
For straylight spectral dependence measurements monochromatic or
narrow band stimuli are better than broadband stimuli. The second
disadvantage is low luminance of blue color. Due to the low illuminance
at the pupil plane caused by a blue annulus it is hard to find
compensation luminance L for the test field. Another stimulus made
from red, green and blue narrow band LED lamps were used (Fig. 2.2.)
Figure 2.2. Spectral characteristics of the LEDs (to the left) and of the color
channels of CRT monitor (to the right).
During the research process two LEDs stimuli were used – one for
near distance (~0.6 m) and another for far distance (~5 m)
measurements. The same principle was used in both stimuli. Difference
was only in physical size of the stimuli (angular size were the same).
The stimulus consisted of light-emitting red, green and blue diode
lamps, attached to a cork board (Fig. 2.3.) The lamps were arranged
around the perimeter of a circle of a radius subtending five degrees at
the subject eye. In the middle of this ring of LEDs, a circular plexiglass
plate of thickness 14 mm was attached to the board. The disc was used
as test stimuli in direct compensation method. Nine holes were drilled at
regular intervals around the sides of this plexiglass plate for placement
of three red, three green and three blue LEDs. When LEDs on the disc
were illuminated, a mixture of total internal reflection and refraction
resulted in the bright disc appearing to an observer. Size of the disc was
1.2 degrees.

17
Figure 2.3. LEDs stimulus used for straylight measurements
The subject was sitting at a distance of 5 m from the stimulus for
measurements of the scattering. The principle of production of the
straylight due to the fog was the same as in the direct compensation
method for the ocular straylight measurement (van den Berg, 1986). The
LED lamps in the outer annulus flickered at 16 Hz and the subject’s task
was to adjust the counter-phase luminance flicker in the central disk to
produce minimal perceived flicker. The luminance of the central
plexiglass stimulus was changed using a power supply with a regulated
output current. Measurements had been done for red, green and blue
color separately. Luminance and illuminance values were calculated
from calibration data. Calibration was made using chromameter Minolta
CS-100 and light meter Meterman LM631.
2.2 High light scattering conditions used in measurements
High light scattering conditions were created using two different
ectopic straylight sources:
• an artificial fog;
• by putting the polymer-dispersed liquid crystal PDLC cell in
front of the eye.
Fog experiments were carried out in a fog chamber in Clermont-
Ferrand. The fog in the chamber was uniform. The mean size of the
droplets was ~4 µm (Colomb et al., 2008). Visibility V of the fog was

18
from 7 to 25 m. These high levels of fog density were chosen because it
was easier to keep stable this level than for a fog with higher V values
and lower density.
Density of the fog was controlled by a transmissometer consisting of a
light source, a sensor and data acquisition system. This system measures
the atmospheric transmission factor, T, defined as the ratio between the
light flux emitted by a light source, Φo, and the light flux transmitted
through a foggy atmosphere, Φ (Colomb et al., 2008). Transmission
factor can be described by Bouguer-Lambert's law :
d
o
teTσ
Φ
Φ −== (2.1.),
where σt – extinction coefficient, d – distance between light source and
sensor. Usually another parameter visibility V is used to describe density
of a fog. Visibility (meteorological range) V can be defined as distance
from a black object on a white background at which contrast ratio due to
atmospheric conditions equals to threshold Weber contrast ratio C. For
C = 0.05 visibility V can be calculated from the Koschmieder equation
(Hinds, 1999):
tt
Vσσ
305.0ln=−= (2.2).
Some of measurements were carried out using the polymer-
dispersed liquid crystal PDLC cell. It is possible to alter the light
transparency of the PDLC plate when there is applied an AC voltage.
The PDLC plate was placed in front of the right eye. One of the aims of
the research was to assess possibility to simulate high level light
scattering conditions (fog, cataract) using light scattering PDLC plate.
Simulating vision through a cataract will allow eye-care specialists
to experience the visual implications for a patient who has a cataract.
Cataract simulation is also useful to research purposes (de Wit et al.,
2006). A cataract and a fog are important factors which can affect
driving safety (Owsley et al., 2002; Cavallo et al., 2001) hence such

19
simulation may be used to investigate the effect of cataract and fog on
driving safety.
The PLDC cell consisted of two glass plates forming a 10 microns
gap of a composite polymer (PN393 MerckKgaA) with dispersed liquid
crystal (BL035 MerckKgaA) droplets of micrometers size. Values of the
refractive index were – for polymer n=1.473 (589 nm) and for liquid
crystal no=1.528. These plates generated different levels of scattering
when AC voltage was applied. When electrical field was not applied to
the PDLC cell, liquid crystal droplets were randomly oriented and the
difference between refractive indices of the polymer and liquid crystal
caused light scattering. When the electric field was applied, the liquid
crystal droplets were aligned in one direction and PDLC transparency
increased (Ozolinsh et al., 2004).
One of the tasks of this research was to measure transparency of the
PDLC cell for red, green and blue light. As light source diode-pumped
all-solid-state laser emitting at three different visible wavelengths (473,
532 and 635 nm) was used. Through PDLC passed light was registered
with photodetector. Results of this measurement are showed in Fig. 2.4.
Spectral dependence of scattered light decreases when there is increased
transparency of the filter (applying AC voltage).
Figure 2.4. Changes in transparency of the PDLC cell by applied AC voltage to
the filter. Measurement were done for red (635 nm, white circles), green
(532 nm, grey circles) and blue (473 nm, black circles) light (Bueno et al.,
2008).
20
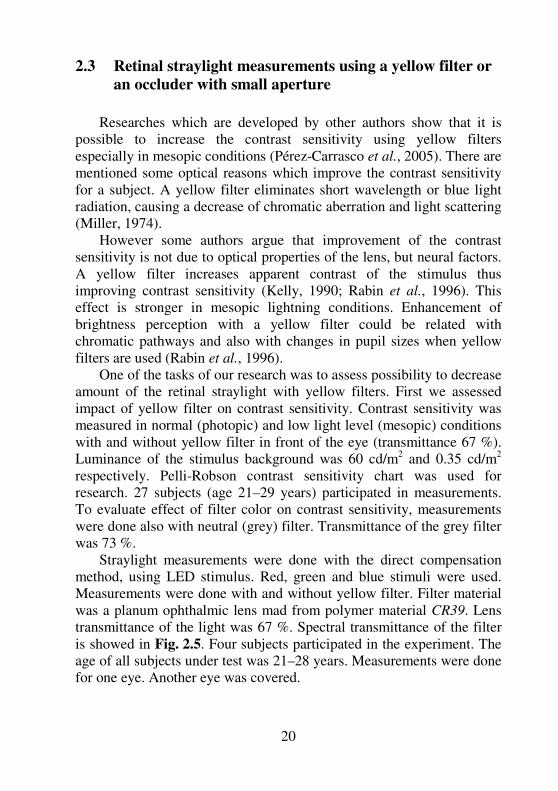
2.3 Retinal straylight measurements using a yellow filter or
an occluder with small aperture
Researches which are developed by other authors show that it is
possible to increase the contrast sensitivity using yellow filters
especially in mesopic conditions (Pérez-Carrasco et al., 2005). There are
mentioned some optical reasons which improve the contrast sensitivity
for a subject. A yellow filter eliminates short wavelength or blue light
radiation, causing a decrease of chromatic aberration and light scattering
(Miller, 1974).
However some authors argue that improvement of the contrast
sensitivity is not due to optical properties of the lens, but neural factors.
A yellow filter increases apparent contrast of the stimulus thus
improving contrast sensitivity (Kelly, 1990; Rabin et al., 1996). This
effect is stronger in mesopic lightning conditions. Enhancement of
brightness perception with a yellow filter could be related with
chromatic pathways and also with changes in pupil sizes when yellow
filters are used (Rabin et al., 1996).
One of the tasks of our research was to assess possibility to decrease
amount of the retinal straylight with yellow filters. First we assessed
impact of yellow filter on contrast sensitivity. Contrast sensitivity was
measured in normal (photopic) and low light level (mesopic) conditions
with and without yellow filter in front of the eye (transmittance 67 %).
Luminance of the stimulus background was 60 cd/m2 and 0.35 cd/m
2
respectively. Pelli-Robson contrast sensitivity chart was used for
research. 27 subjects (age 21–29 years) participated in measurements.
To evaluate effect of filter color on contrast sensitivity, measurements
were done also with neutral (grey) filter. Transmittance of the grey filter
was 73 %.
Straylight measurements were done with the direct compensation
method, using LED stimulus. Red, green and blue stimuli were used.
Measurements were done with and without yellow filter. Filter material
was a planum ophthalmic lens mad from polymer material CR39. Lens
transmittance of the light was 67 %. Spectral transmittance of the filter
is showed in Fig. 2.5. Four subjects participated in the experiment. The
age of all subjects under test was 21–28 years. Measurements were done
for one eye. Another eye was covered.

21
Figure 2.5. Light transmittance of the yellow filter.
Not always the reason for increased straylight level in the eye is
some pathological changes in the eye. The retinal straylight which is
mentioned previously usually is higher for subjects with blue eyes
comparing with the same age brown eye subjects. Subjects with blue
eyes have smaller amount of pigmentation and more light penetrates
trough the sclera and the ris than for subjects with brown eyes.
The amount of reflectance of the fundus and the eye wall
translucency has to be estimated for more accurate identification of
sources which increase the retinal straylight in pathological eyes. Some
other researchers have created an iris pigmentation classification system
based on comparison of iris pigmentation with a set of 24 standard eye
photographs (Franssen et al., 2008). One of our tasks was to assess
possibility to decrease the amount of retinal straylight putting an
occluder with small aperture (diam. 5mm) in front of the eye. This
occluder will decrease amount of light which come into the eye trough
sclera and iris (Fig. 2.6).
Figure 2.6. Straylight sources in the eye are shown in the picture on the left.
Main sources are light scattering and reflectance in the optical part of the eye
and light which penetrates trough the sclera and the iris. If an occluder with a
small aperture is put in the front of the eye, less light comes into the eye
through the sclera and the pupil (in the picture on the right).

22
Straylight measurements were carried out with a circular aperture
(5mm in diameter) placed in a trial frame, and also without the aperture.
The other eye was covered. Measurements with direct compensation
method were done for red and green light. Eight subjects (age 21–28)
participated in these experiments. Size of the aperture 5mm were chosen
to reduce forming of diffraction. It is known that diffraction influences
visual acuity if the eye pupil is smaller than 3 mm (Rabetts, 1998).
3 Results and discussion
3.1 Visual acuity measurements in the fog
Results of visual acuity for two-colored stimuli – Landolt-C in
various colors on the white background-depending on the fog density
are depicted in Fig. 3.1. Two participants with normal (corrected) visual
acuity took part in these experiments.
Figure 3.1. Visual acuity in the fog for different color acuity charts. W–R, W–
G, W–B, and W–Y notes results for charts with red, green, blue and yellow
Landolt-C stimuli on the white background, correspondingly. Data on the right
present visual acuity without the fog (Ozolinsh et al., 2006).

23
Visual acuity in the fog was the highest for blue Landolt-C
optotypes and the lowest for yellow optotypes on the white background.
One of the reasons of these results is different luminance contrast of all
stimuli. The highest contrast was for white-blue (W–B) stimuli, the
smallest for white-yellow (W–Y). The luminance of colored Landolt-C
optotypes presented on a computer screen was chosen corresponding to
the red (R channel), green (G), and blue (B) color contributions in
achromatic white stimuli. The brightest was the G channel, and the
darkest – the B channel. For white-blue stimulus the white background
consists of light emitted by all three channels. The optotype area emits
light only from the B channel. This results in the greatest luminance
contrast for the white-blue stimuli, thus advancing the visual acuity for
the white-blue stimuli. In case of white-yellow the main channel is B,
because the yellow color consists of R and G channels and the white
background consist of all three channels.
These results confirm assumption that short light wavelengths (blue
light) in the fog is scattered more than longer wavelengths similar as in
atmosphere (Godish, 2004). However there are influences on visual
acuity results not only from optical factors, but also from neural factors.
These results do not give full answer about spectral dependence of the
retinal straylight in the fog.
3.2 Visual acuity measurements with the PDLC occluder
In the next visual acuity measurements (Ikaunieks et al., 2008 (2))
we used black Landolt optotypes on different color backgrounds – red,
green or blue. Weber contrast for all stimuli was the same – 0.85. These
stimuli were chosen to reduce influence of neural factors on the results.
High light scattering conditions were created using the PDLC cell (light
transmittance 0.4). The PDLC cell was put in front of the right eye. Left
eye was covered. 4 subjects (S1, S2, S3 and S4) participated in these
measurements. Age of the subject was from 21 to 28 years. Results of
all subjects are shown in Fig. 3.2.
24
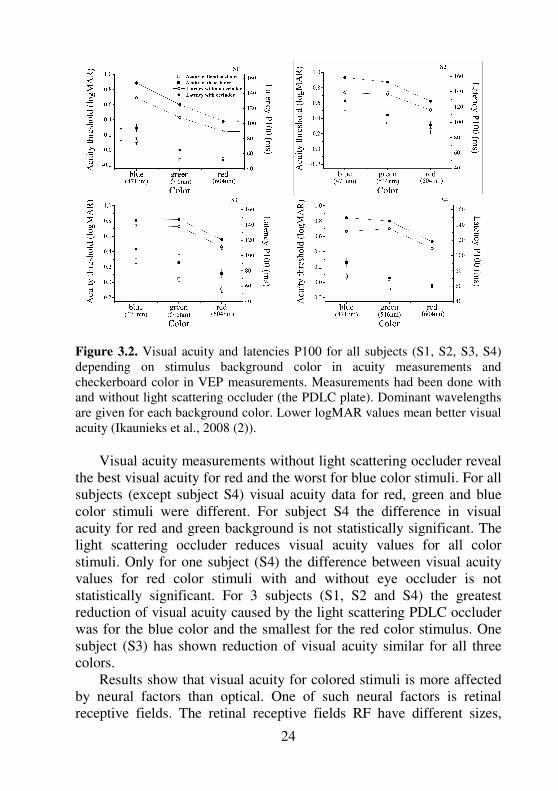
Figure 3.2. Visual acuity and latencies P100 for all subjects (S1, S2, S3, S4)
depending on stimulus background color in acuity measurements and
checkerboard color in VEP measurements. Measurements had been done with
and without light scattering occluder (the PDLC plate). Dominant wavelengths
are given for each background color. Lower logMAR values mean better visual
acuity (Ikaunieks et al., 2008 (2)).
Visual acuity measurements without light scattering occluder reveal
the best visual acuity for red and the worst for blue color stimuli. For all
subjects (except subject S4) visual acuity data for red, green and blue
color stimuli were different. For subject S4 the difference in visual
acuity for red and green background is not statistically significant. The
light scattering occluder reduces visual acuity values for all color
stimuli. Only for one subject (S4) the difference between visual acuity
values for red color stimuli with and without eye occluder is not
statistically significant. For 3 subjects (S1, S2 and S4) the greatest
reduction of visual acuity caused by the light scattering PDLC occluder
was for the blue color and the smallest for the red color stimulus. One
subject (S3) has shown reduction of visual acuity similar for all three
colors.
Results show that visual acuity for colored stimuli is more affected
by neural factors than optical. One of such neural factors is retinal
receptive fields. The retinal receptive fields RF have different sizes,

25
those in the periphery are larger and are more efficient in discriminating
of blue-yellow, whereas those in the fovea centre are smaller and more
efficient in discriminating of green-red stimuli (Schwartz, 2004).
Additional measurements with different methods would be useful to get
more accurate data about the intraocular light scattering in a fog and
other high level light scattering conditions.
3.3 Results of the VEP measurements
The VEP results for the red-black, green-black and blue-black
checkerboard stimuli are shown in Fig. 3.2. Latencies P100 were
analyzed in the VEP measurements for the three color stimuli.
Differences in VEP amplitudes measured with and without the eye
occluder were not statistically significant due to the low signal to noise
ratio, therefore amplitudes were not analyzed. In experiments without
the light scattering occluder all subjects had the smallest value of P100
latencies for the red color (red-black checkerboard stimuli). Subjects S2,
S3 and S4 had revealed no statistically significant difference of the P100
latencies for the blue and green color stimuli. Only the subject S1 had a
statistically significant greater value for the blue P100 latency in
comparison with the green stimuli. The light scattering occluder caused
increase of P100 values for all color stimuli. The smallest values of
P100 latencies, similar as in conditions without the scattering plate,
were for the red stimuli. The higher of P100 values in measurements
with the light scattering occluder were determined for the blue stimuli
(subjects S1, S2, S4). On the contrary, the P100 latencies of the subject
S3 for the blue stimuli were not different in comparison with latencies
for the green stimuli in measurements with the light scattering occluder.
The greatest relative changes in P100 latency values comparing results
of measurements with and without the scattering occluder were
observed for the blue color stimuli, the smallest – for the red color
stimuli (subjects S1, S2 and S4). For the subject S3 we have revealed
more or less proportional increase of P100 latencies for all color stimuli.
By analysis of results of the P100 latencies and visual acuity
measurements we have found good correlation between these
characteristics for subjects S1 and S2 (R2>0,79). For two other subjects
correlation had lower R2 values.

26
Results in VEP method for subjects have more differences than in
acuity measurements. The one of the reason could be that VEP results
are affected by different properties of stimuli and subject’s anatomical
and physiologic parameters of visual pathways (Arden et al., 1977).
Hidajat and Goode found that the glare affect only VEP amplitudes, not
latencies (Hidajat et al., 2000). This data do not correspond to our
results which have shown significant changes in latencies when light
scattering was increased. Hidajat and Goode put light sources near the
stimuli to create the straylight. As it was previously mentioned (see
chapter “Method for assessment of visual acuity in normal conditions
and in high light scattering conditions”), such method not always is
good to create the glare, because not only optical factor, but neural
lateral interactions are involved in such measurements (van den Berg,
1994).
VEP method did not show advantages in comparison with visual
acuity method. Results are affected not only by optical but also by
neural factors in both methods. Beside precision in the VEP method is
affected by the signal to noise ratio. However, results for the colored
stimuli in both methods have shown good correlation and it is possible
to use the VEP method for the assessment of visual acuity for the
colored stimuli.

27
3.4 Spectral dependence of retinal straylight measured with
direct compensation method
Retinal straylight values for the red, green and blue color are shown
in Fig. 3.3. Measurements were done with LED stimulus. Data are
compared with other authors’ results. 9 subjects (age 21–28)
participated in this experiment.
Figure 3.3. In the picture on the left retinal straylight values of 9 subjects for
the blue (dominant wavelength 471 nm), green (546 nm) and red (604 nm)
stimuli are shown. The black line corresponds to the Rayleigh type scatter
(∝λ–4). In the picture on the right data from other authors are shown. Results
are grouped by age of subjects and eye colors (bl – blue; gr – grey; br – brown,
pbr – dark brown).
The largest retinal straylight was for light with short wavelength
(blue color), the smallest straylight was for light with middle
wavelength (red light). For measurements of the retinal straylight we
used broad band stimuli (Fig. 2.2.). Coppens et al. in their measure-
ments used monochromatic stimuli. However, our results show similar
tendencies with other researchers’ data for the same age group (Coppens
et al., 2006). We did not group subjects by color of the eye, because it
was not task of our research.
Since we get similar spectral dependence of the retinal straylight
with other authors’ data, in next intraocular light scattering researches
we used only the direct compensation method. And the principle used in
Ikaunieks et al, 2009 (2) Coppens et al., 2006

28
the direct compensation method is the most promising in comparison
with other light scattering tests (van Rijn et al., 2005).
3.5 Spectral dependence of retinal straylight in the fog
Straylight parameter values s and their standard deviations, obtained
by subjects GI and MO (aged 29 and 59 respectively) in different
visibility levels of fog for different color light sources, are shown in
Fig. 3.4.
Figure 3.4. Values of the logarithm of the straylight parameter s for two
subjects at different levels of fog visibility V and for different colors (blue (471
nm), green (546 nm) and red (604 nm)) of scattered light s. For subject MO,
measurements were made only at fog visibility V of 7 and 15 m. Data for
subject MO are shifted 0.6 units to the right (Ikaunieks et al., 2009 (1)).
Reduction in the visibility V, of the fog results in an increase in the
straylight values for all three colors. Values of log(s) under any
visibility condition are very similar for all colors, implying that the
scattering by the fog droplets shows little or no spectral dependence.
Such results will be expected due to the relatively large size of the
scatterers – water droplets of mean size 4 µm (Colomb et al., 2008).
For subject GI measurements were done at fog visibility 7, 10, 15
and 25m. For subject MO, measurements were made only at fog
visibility V of 7 and 15 m. No statistically significant differences were
found between the intraocular straylight values of s determined by the
two subjects for different colors.

29
Straylight measurements taken with a commercial device show that
subjects GI and MO have different levels of entoptic (intraocular)
scatter due to their different ages.
As mentioned previously retinal straylight could be produced by
entoptic factors sent and ectoptic factors sekt (Vos, 2003). Total retinal
straylight is the sum of both factors:
ektent SSS += (3.1).
Therefore we might expect that different straylight values would be
found for the two subjects in fog (at least for low fog densities).
However our measurements showed similar values in fog for both
subjects. This inconsistency could be due to the limited precision of our
measurements but can more probably be attributed to the fact that the
straylight values in fog were much higher than those under normal
conditions (Table 1). We can suppose that, for the dense fogs, entoptic
straylight has only a weak impact on the total straylight value.
The relationship between the visibility V and the straylight
parameter s is close to exponential (R2 > 0.85). Such a relationship
would be expected from Equations (2.1) and (2.2). Expressing the
extinction coefficient σt from Equation (2.2) and placing this expression
in Equation (2.1), we can obtain a relationship between the visibility V
and the transmission factor T:
dVeT
−
=3
(3.2).
The distance between the light source and sensor d in our fog
measurements was constant at 5 m (and equal to the distance at which
measurements were made). Equation (7) shows that the relation between
visibility V and the transmission factor T, both of which are related to
the light scattering properties of the fog, is exponential. If we
hypothesize that, for dense fogs, entoptic straylight has only a weak
impact on total straylight, in our experiment we actually measured the
light scattering properties of the dense fog. With increasing or
decreasing visibility V, the light scattering properties of the fog changed
exponentially. Our results confirm that entoptic straylight has a weak
impact on total straylight in dense fog conditions.

30
3.6 Use of PDLC cell for simulating of high level light
scattering conditions
Results with and without the light scattering filter under normal
laboratory conditions using the CRT stimuli are shown in Fig. 3.5. For
both subjects (GI and VK) intraocular straylight values with and without
the PDLC plate are the greatest for the blue color. Under natural
conditions (without the light scattering filter) significantly greater s
values were found with red stimuli as compared with green. These
results agree with those of previous studies, which showed higher
straylight values for red compared with green light (Coppens et al.,
2006). When light scattering was induced by the PDLC plate with
transparency 0.4 both subjects showed a greater straylight value s for the
green than for red stimulus.
Fig. 3.6. shows in more detail the dependence for subject GI of the
straylight parameter s on the light transparency and scattering levels of
PDLC plate for the three colors. Measurements at transmittance 1.0
were made with the naked eye, without any scattering filter. For all
transmittance levels, the greatest straylight values s were observed for
blue stimuli. Comparing the results for green and red stimuli, although
for the low-scattering, high-transmittance condition the red scattering sr
was higher, the straylight values sg for green stimuli increased relatively
faster as the transmittance decreased and the scattering increased, so that
at high scattering levels sg > sr.

31
Figure 3.5. Logarithm of straylight parameter, s, at different wavelengths for
two subjects (GI and VK) without and with a polymer dispersed liquid crystal
(PDLC) filter. A fit to the spectral dependence of the straylight measured with
PDLC filter is shown for both subjects (Ikaunieks et al., 2009 (1)).
Figure 3.6. Logarithm of straylight parameter s for broadband red, green and
blue stimuli using PDLC filters with different transparencies (measured at 530
nm) for subject GI. Measurements at transmittance 1.0 were made without any
filter in front of the eye (Ikaunieks et al., 2009 (1)).

32
Measured straylight in experiments with electrically controllable
scattering in the PDLC plate reached values up to 1.6 log(s) units and
showed a noticeable wavelength-dependence (Fig. 3.5). Physical
measurements of light scattering by PDLC filters also show wavelength-
dependence (Fig. 2.4) (Ozolinsh et al., 2004, Bueno et al., 2008). The
scatterers in a PDLC filter are, however, of submicron size and hence
larger than the scattering particles in the young cornea or clear lens
(radius of protein α-crystallins is ~10 nm (van den Berg, 1997)). Thus
the straylight initiated by light scattering in the PDLC plate has a
weaker spectral dependence than that of Rayleigh scattering (∝ λ–4
).
Approximation of the spectral dependence of the scattering to a power
function of the form s ∝λm gives a power value m= –2.2 for subject GI
and m= –3.4 for subject VK (Fig. 3.5). Such spectral dependence means
that PDLC plates cannot adequately simulate the scattering produced by
cataract or fog when polychromatic stimuli are used.
However, by itself the scattering parameter s fails to give enough
information to allow decisions on visual quality in different conditions
to be made. When choosing an appropriate light scattering filter for
cataract simulation, the impact of the filter on contrast vision and visual
acuity is also important (de Wit et al., 2006). Our previous
measurements show (Ikaunieks et al., 2008 (1); Ikaunieks et al., 2008
(2)) that decimal visual acuity when looking through the PDLC plate
with high-contrast Landolt stimuli is ~1.4 (–0.15 in logMAR units).
Such a level of visual acuity is acceptable for early cataract stimulation
(de Wit et al., 2006). We also found a similar visual acuity (~1.3 in
decimal units) for fog with a visibility V = 15 m (Ozolinsh et al., 2006).
This shows that, with a PDLC filter, we can roughly simulate some
levels of fog or cataract when achromatic stimuli are used.
33
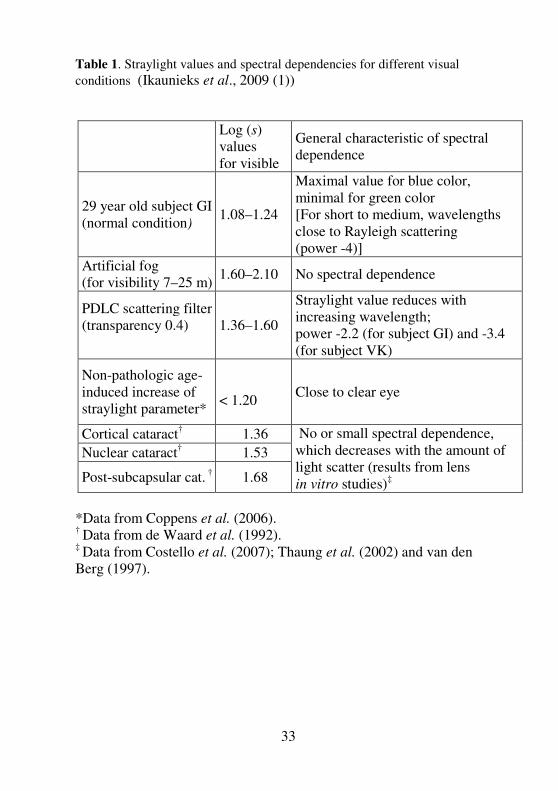
Table 1. Straylight values and spectral dependencies for different visual
conditions (Ikaunieks et al., 2009 (1))
Log (s)
values
for visible
General characteristic of spectral
dependence
29 year old subject GI
(normal condition) 1.08–1.24
Maximal value for blue color,
minimal for green color
[For short to medium, wavelengths
close to Rayleigh scattering
(power -4)]
Artificial fog
(for visibility 7–25 m) 1.60–2.10 No spectral dependence
PDLC scattering filter
(transparency 0.4)
1.36–1.60
Straylight value reduces with
increasing wavelength;
power -2.2 (for subject GI) and -3.4
(for subject VK)
Non-pathologic age-
induced increase of
straylight parameter*
< 1.20
Close to clear eye
Cortical cataract† 1.36
Nuclear cataract† 1.53
Post-subcapsular cat. † 1.68
No or small spectral dependence,
which decreases with the amount of
light scatter (results from lens
in vitro studies)‡
*Data from Coppens et al. (2006). † Data from de Waard et al. (1992).
‡ Data from Costello et al. (2007); Thaung et al. (2002) and van den
Berg (1997).

34
3.7 Changes in retinal straylight looking through yellow
filters
Averaged contrast sensitivity values of 27 subjects in mesopic and
photopic conditions are showns in Fig. 3.6.a. Measurements done with
yellow filter didn’t show statistically significant values comparing with
measurements done without filter. In mesopic conditions contrast
sensitivity was significantly lower with grey filter than with yellow
filter. In mesopic conditions we also asked subjects to assess in which
case – without filter; with yellow filter or with grey filter – they feel
more comfortably. 56 % subjects answered that they feel more
comfortable with yellow filters than with grey filter or without any filter
in front of the eye. Our measurements partly approve other author
results (Kelly, 1990), which showed small improvement of object
perception looking through yellow filter.
Results of the straylight parameter s measurements done with and
without a yellow filter for one subject are shown in Fig. 3.6.b.
a) b)
Figure 3.6.
a) Averaged contrast sensitivity values of 27 subjects in mesopic and photopic
conditions. Measurements first were done without filter, than with yellow filter
(transmittance 67 %) and the last with grey filter (transmittance 73 %).
Standard deviations are showed for each measurement. (Slica et. al., 2010).
b) Straylight values with and without a yellow filter for the blue (471 nm),
green (546 nm) and red (604 nm) stimuli. Results are shown for one subject.
Standard deviations are showed for each measurement (Ikaunieks et al., 2009
(2)).

35
The straylight was stronger in the measurement with a yellow filter
than in the normal conditions for all three colors. The same tendency
was also found for others subjects. Our additional measurements
showed that tinted spectacle lens increases retinal straylight more than
clear lens (Stepanovs et al., 2010). Other authors have shown that
colored contact lenses (amber and grey-green) also show larger
straylight values than clear contact lenses (Cerviño et al., 2008). We can
conclude that tinted filters (also yellow) increase the retinal straylight.
Larger retinal straylight was also for the blue light, which is absorbed
for the greater part by yellow filter. These results do not confirm the
assumption that yellow filter removes blue light and thus reduces light
scattering in the eye. In other investigations authors argued that the
improvement of contrast sensitivity in low light condition should be
more related to neural mechanisms (brightness – enhancement effect)
than to optical ones (Kelly, 1990; Rabin et al., 1996). Our results
confirm such assumption.

36
3.8 Evaluation of amount of light which penetrates through
sclera and iris using occluder with small aperture
Results of measurements of the straylight parameter s which had
been done with and without aperture (diam. 5 mm) for green and red
color are shown in Fig. 3.7. For each measurement the standard
deviations is shown. A circular aperture in front of the eye reduces
intraocular light scattering from both light sources (red and green). As it
was expected, the greatest changes are for the red color, since less light
penetrates through the ocular wall when the aperture is used.
Figure 3.7. Straylight values for red and green color stimuli with and without
5mm aperture (Ikaunieks et al., 2009 (2)).
Statistical analysis (t-Test: Paired Two Sample for Means) shows
that the retinal straylight for the red light significantly decreases
(p<0.004) if a small aperture is put in front of the eye. Results for the
green color measured with and without an aperture did not change
significantly. Results show that it is possible to use a small aperture for
evaluation of amount of the light which penetrates through the sclera
and the iris. Additional measurements are needed to assess possibility to
use such method for evaluation of pigmentation level of the eye in
clinics.

37
4 Conclusions
1. Three methods – psychophysical visual acuity measurements with
and without glare source, VEP method and direct compensation
method – were evaluated for disability glare and straylight
measurements. Straylight the mostly reduces perception of blue
color stimuli. Perception of color stimuli in normal and high level
light scattering conditions is more affected by neural than optical
factors.
2. For subjects younger than 30 years retinal straylight has spectral
dependence close to Rayleigh scattering (∝ λ–4
) with increment of
straylight values for long wavelengths light.
3. Psychophysical retinal straylight measurements didn’t show spectral
dependency in the dense fog (Visibility V= 7–25 m). Entoptic
straylight (Log(s) ≈1.10) in such conditions is significantly smaller
than ectoptic straylight created by artificial fog (Log(s) ≈1.80).
4. With PDLC plate it is possible to simulate the same light scattering
level as created by dense fog or cataract. The straylight initiated by
light scattering in the PDLC plate has spectral dependence therefore
it is possible to use PDLC plate for stimulation of dense fog or
cataract only when achromatic stimuli are used.
5. Measurements show that for subjects younger than 30 years yellow
filter don’t reduce light scattering in the eye.
6. When light which penetrates through the sclera is reduced by
putting small aperture (diam.=5 mm) in front of the eye, retinal
straylight for red light decreases more than for green light. Results
show that it is possible to use small aperture for evaluation amount
of pigmentation in the eye and amount of light which penetrates
through sclera.

38
5 Publications
1. Ozolinsh, M., Colomb, M., Ikaunieks, G. and Karitans, V.
(2006). Color stimuli perception in presence of light scattering.
Visual. Neuroscience. 23, 597–601.
2. Bueno, J. M., Ozolinsh, M. and Ikaunieks G. (2008). Scattering
and depolarization in a polymer dispersed liquid crystal cell.
Ferroelectrics 370, 18–28.
3. Ikaunieks, G., Colomb, M. and Ozolinsh, M. (2009). Light
scattering in artificial fog and simulated with light scattering
filter. Ophthalmic and Physiological Optics. 29, 351–356.
4. Ikaunieks G., Ozolinsh M., Stepanovs A., Lejiete V. and Reva
N. (2009). Factors influencing light scattering in the eye.
Latvian Journal of Physics and Technical Sciences. 46, 37–42.
5. Ikaunieks, G. and Ozolinsh, M. (2008). Effect of light scattering
simulation in the eye on different color stimuli perception.
IFMB Proceedings, 20, 367–370.
6. Ikaunieks, G. and Ozolinsh, M. (2008). Factors affecting
intraocular light scattering from different color straylight
sources. Proc. SPIE, Vol. 7142, p. 71421A.1–71421A.6;
DOI:10.1117/12.815622.

39
Thesis in international conferences
1. „Developments in Optics and Communications”, Riga, April
23–25, 2010. Influence of tinted spectacle lenses on intraocular
stray light. Stepanovs A., Ikaunieks G., Ozola K. and Ozolinsh
M., Abstract book, Riga, 2010, in press
2. „Developments in Optics and Communications”, Riga, April
23–25, 2010. Effect of yellow filters on vision. Slica S. and
Ikaunieks G., Abstract book, Riga, 2010, in press
3. „Developments in Optics and Communications”, Riga, April
24–26, 2009., Effect of optical and physiological factors on light
scattering in the eye. Ikaunieks G., Ozolinsh M., Stepanovs A.,
Lejiete V. and Reva N., Abstract book, Riga, 2009, p. 40
4. „14-th Nordic – Baltic Conference on Biomedical Engineering
and Medical Physics”, Riga, June 9–13, 2008. Effect of light
scattering simulation in the eye on different color stimuli
perception. Ikaunieks G. and Ozolinsh M., Abstract book, Riga,
2008, p. 100
5. ”The 6-th International Conference on Advanced Optical
Materials and Devices”, Riga, August 24–27. 2008. Factors
affecting intraocular light scattering from different color
straylight sources. Ikaunieks G. and Ozolinsh M., Abstract book,
Riga, 2008, p. 89
6. „4-th European Meeting in Visual & Physiological Optics”,
August 31 – September 2, 2008. Heraklion, Greece. Intraocular
light scattering from different color straylight sources. Ikaunieks
G. and Ozolinsh M., Abstract book, Greece, 2008, p. 40
7. „30-th European Conference on Visual Perception”, Arezzo,
Italy, August 27–31.2007. Light-scattering effect on colour-
pattern VEP response. Ikaunieks G., Ozolinsh M. and Fomins S.,
Perception. ECVP Abstract Supplement, Vol. 36, Great Britain,
2007., p. 39
8. „Developments in Optics and Communications”, Riga, April
27–29, 2007. Retinal straylight measurements with different
wavelength light. Ikaunieks G, Lejiete V. and Ozolinsh M.,
Abstract book, Riga, 2007, p. 16.
40
9. „29-th European Conference on Visual Perception”, St-
Petersburg, Russia, August 20–25. 2006. Light scattering effect
on central and peripheral visual acuity. Ikaunieks G. and Ozolinsh
M., Perception. ECVP Abstract Supplement, Vol. 35, Great
Britain, 2006., p. 129
10. „29-th European Conference on Visual Perception”, St-
Petersburg, Russia, August 20–25. 2006. Scattering-induced
luminance and colour contrast decrease in visual perception.
Ozolinsh M, Colomb M, Parkkinen J, Ikaunieks G, Fomins S,
Karitans V and Krumina G., Perception. ECVP Abstract
Supplement, Vol. 35, Great Britain, 2006., p. 136
11. „28-th European Conference on Visual Perception” Different
colour contrast stimuli perception in fog. Ozolinsh M., Colomb
M., Ikaunieks G. and Karitans V., Perception. ECVP Abstract
Supplement, Vol. 34, Great Britain, 2005., p. 192

41
References
1. Arden, G.B., Bodis-Wollner, I., Halliday, A.M., Jeffreys, A.,
Kulikowski, J., Spekreijse, H. and Regan, D. (1977).
Methodology of Patterned Visual Stimulation, Oxford Univ Press,
Oxford, 3–15.
2. Aslam, T.M., Haider, D. and Murray, I.J. (2007). Principles of
disability glare measurement: an ophthalmological perspective.
Acta Ophthalmol Scand 85(4), 354–60.
3. Bach, M. (2007). The Freiburg Visual Acuity Test-variability
unchanged by post-hoc re-analysis. Graefes Arch. Clin. Exp.
Ophthalmol 245(7), 965–971.
4. Beckman, C., Scott, R. and Garner, L.F. (1992). Comparison of
three methods of evaluating glare. Acta Ophthalmologica 70, 53–
59.
5. van den Berg, T. J. (1986). Importance of pathological intraocular
light scatter for visual disability. Doc. Ophthalmol. 61, 327–333.
6. van den Berg, T.J. Ijspeert, J.K., and de Waard, P.W. (1991).
Dependence of intraocular straylight on pigmentation and light
transmission through the ocular wall. Vis. Res 31, 1361–1367.
7. van den Berg, T.J. (1994). On the relation between intraocular
straylight and visual function parameters. Invest Ophthalmol. Vis.
Sci. 35(6), 2659–2661
8. van den Berg, T.J. (1997). Light scattering by donor lenses as a
function of depth and wavelength. Invest. Ophthalmol. Vis. Sci 38,
1321–1332.
9. Cavallo, V., Colomb, M. and Dore, J. (2001). Distance perception
of vehicle rear lights in fog. Hum. Factors 43, 442–451.
10. Cerviño, A, Gonzalez-Meijome, J.M., Linhares, J.M., Hosking,
S.L, Montes-Mico, R. (2008). Effect of sport-tinted contact lenses
for contrast enhancement on retinal straylight measurements.
Ophthalmic Physiol Opt 28(2), 151–6.
11. Colomb, M., Hirech, K., André, P., Boreux, J.J., Lacôte, P. and
Dufour, J. (2008). An innovative artificial fog production device

42
improved in the European project ‘‘FOG’’. Atmospheric Research
87, 242–251.
12. Coppens, J.E., Franssen, L. and van den Berg, T.J. (2006).
Wavelength dependence of intraocular straylight. Exp.Eye Res.
82(4), 688–692.
13. Costello, M.J., Johnsen, S., Gilliland, K.O., Freel, C.D. and
Fowler, W.C. (2007). Predicted light scattering from particles
observed in human age-related nuclear cataracts using Mie
scattering theory. Invest. Ophthalmol. Vis. Sci 48, 303–312.
14. Elliott, D.B., Bullimore, M.A., Patla, A.E and Whitaker, D.
(1996). Effect of a cataract simulation on clinical and real world
vision. Br J Ophthalmol 80(9):799–804.
15. Franssen, L, Coppens, J.E. and van den Berg, T.J. (2006).
Compensation comparison method for assessment of retinal
straylight. Invest Ophthalmol Vis Sci 47(2):768–76.
16. Franssen, L., Tabernero, J., Coppens, J.E. and van den Berg, T.J.
(2007). Pupil size and retinal straylight in the normal eye. Invest
Ophthalmol Vis Sci 48(5), 2375–82.
17. Franssen, L., Coppens, J.E., and van den Berg T.J. (2008).
Grading of iris color with an extended photographic reference set.
J. Optom 1(1), 36–40.
18. Friedlander, S.K. (2000). Light scattering. In: Smoke, Dust and
Haze (ed. S.K. Friedlander), 2nd edn. Oxford University Press,
Oxford, pp. 125–156.
19. Godish, T. (2004). Air Quality (ed. T. Godish), 4th edn., Lewis
Publishers, USA, pp. 94–95.
20. Hidajat, R.R. and Goode, D.H. (2000). Pattern VEP for glare
sensitivity testing. Australas. Phys. Eng Sci. Med. 23(2), 52–56.
21. Hinds, W.C. (1999). Optical properties. In: Aerosol technology:
properties, behavior, and measurement of airborne particles (ed.
W.C. Hinds), 2nd edn. John Wiley & Sons Inc, NY, pp. 349–377.
22. Holladay, L.L. (1926). The fundamentals of glare and visibility.
J Opt Soc Am 12, 271–319.
23. Kaufman, P.L., Alm, A. (2003). Adler's Physiology of the Eye
(ed. P. L. Kaufman, A. Alm), 10nt edn., Mosby, USA, pp. 173–
177.

43
24. Kelly, S.A. (1990). Effect of yellow-tinted lenses on brightness.
J Opt Soc Am A. 7(10), 1905–11.
25. Mainster, M.A. and Timberlake, G.T. (2003). Why HID
headlights bother older drivers. Br. J. Ophthalmol 87, 113–117.
26. Marron, J.A., Bailey, I.L. (1982). Visual factors and orientation-
mobility performance. Am J Optom Physiol Opt 59(5):413–26.
27. Miller, D. (1974). The effect of sunglasses on the visual
mechanism. Surv Ophthalmol 19(1), 38–44.
28. Narisada, K., Schreuder, D. (2004). Light Pollution Handbook.
Series: Astrophysics and Space Science Library, Vol. 322.,
Springer, Netherlands, pp. 296–307.
29. Owsley, C., McGwin, G.Jr., Sloane, M., Wells, J., Stalvey, B.T.
and Gauthreaux, S. (2002). Impact of cataract surgery on motor
vehicle crash involvement by older adults. JAMA 288, 841–849.
30. Ozolinsh, M. and Papelba, G. (2004). Eye cataract simulation
using polymer dispersed liquid crystal scattering obstacles.
Ferroelectrics 304, 207–212.
31. Rabetts, R.B. (1998). Bennett and Rabbetts' Clinical Visual Optics
(ed. R. B. Rabetts), 3rd edn., Butterworth-Heinemann, Great
Britain, pp. 23–26.
32. Rabin, J. and Wiley, R. (1996). Differences in apparent contrast in
yellow and white light. Ophthalmic Physiol. Opt 16(1), 68–72.
33. Pérez-Carrasco, M.J., Puell, C., Sánchez-Ramos, C., López-
Castro, A. and Langa, A. (2005). Effect of a yellow filter on
contrast sensitivity and disability glare after laser in situ
keratomileusis under mesopic and photopic conditions, J. Refr.
Surgery 21(2), 158–165.
34. van Rijn, L.J. New standards for the visual functions of drivers.
Report of the Eyesight Working Group. (editor of report: L.J. van
Rijn). Brussels, 2005. In:
http://ec.europa.eu/transport/road_safety/behavior/doc/new_stand
ards_final_version_en.pdf
35. van Rijn, L.J., Nischler, C., Gamer, D., Franssen, L., de Wit, G.,
Kaper, R., Vonhoff, D., Grabner, G., Wilhelm, H., Volker-
Dieben, H.J. and van den Berg, T.J. (2006). Measurement of stray
light and glare: comparison of Nyktotest, Mesotest, stray light

44
meter, and computer implemented stray light meter.
Br. J. Ophthalmol 89(3), 345–351.
36. Schwartz, S.H. (2004). Visual Perception: A Clinical Orientation
(ed. D. Cooke and A. Seils), 3rd edn., McGraw-Hill, USA, pp.
108–114.
37. Stiles, W.S. (1929). The effect of glare on the brightness
difference threshold. Proc Roy Soc 104, 322–355.
38. Tetsuka, H., Katsumi, O., Morandi, A.J., Tetsuka, S., Wang, G.J.
and Hirose, T. (1992). Effect of light scatter on the pattern
reversal visual evoked response: comparison with psychophysical
results. Vision Res. 32(7), 1211–1218.
39. Thaung, J. and Sjostrand, J. (2002). Integrated light scattering as a
function of wavelength in donor lenses. J. Opt. Soc. Am. A. Opt.
Image. Sci. Vis 19, 152–157.
40. Vos, J.J. (1984). Disability glare—a state of the art report. Comm.
Int. Eclairage J 3/2, 39–53.
41. de Waard, P.W., IJspeert, J.K., van den Berg, T.J. and de Jong,
P.T. (1992). Intraocular light scattering in age-related cataracts.
Invest Ophthalmol Vis Sci 33, 618–625.
42. Whitaker, D., Steen, R. and Elliott D.B. (1993). Light scatter in
the normal young, elderly, and cataractous eye demonstrates little
wavelength dependency. Optom.Vis.Sci. 70(11), 963–968.
43. Williams, M.A., Moutray, T.N. and Jackson A.J. (2008).
Uniformity of visual acuity measures in published Studies. Invest
Ophthalmol Vis Sci. 49(10):4321–4327.
44. de Wit, G.C., Coppens J.E. (2003). Stray light of spectacle lenses
compared with stray light in the eye. Optom Vis Sci 80(5), 395–
400.
45. de Wit G.C., Franssen L., Coppens J.E. and van den Berg T.J.
(2006). Simulating the straylight effects of cataracts. J Cataract
Refract Surg 32(2), 294–300.
46. Wooten, B.R. and Geri, G.A. (1987). Psychophysical
determination of intraocular light scatter as a function of wave-
length. Vision Res 27(8), 1291–1298.

45
Acknowledgments
I would like to say thanks to department of Optometry and vision
science, University of Latvia. Thanks to my students – Velta Lejiete,
Natalja Reva, Dana Rinkus, Santa Slica and Antons Stepanovs – for
helping with experimental part. Thanks to my old friends and family for
moral support. And the greatest thanks to my supervisor prof. Maris
Ozolins for patience and optimism.
This work was supported by the European Social Fund.