vision of today is tomorrow's achievement
TRANSCRIPT

National Refinery Limited
Vision of today is
Tomorrow'sAchievement
Annual Report 2015


ContentsCOMPANY OVERVIEW 04 Vision 05 Mission 07 Core Values08 Corporate Information11 NRL at a Glance13 Corporate Objectives & Development Strategy14 Directors’ Profile16 Chairman’s Review18 Directors’ Report
CORPORATE GOVERNANCE32 Code of Conduct35 Statement of Compliance38 Review Report to the Members39 The Terms of Reference of the Audit Committee41 Terms of Reference of Human Resource & Remuneration (HR&R) Committee
STAKEHOLDER’S INFORMATION44 Statement of Value Added45 Six Years at a Glance46 Horizontal Balance Sheet47 Vertical Balance Sheet48 Horizontal Profit & Loss Account49 Vertical Profit & Loss Account50 Graphical Representation
ANNUAL AUDITED FINANCIAL STATEMENTS55 Auditors’ Report56 Balance Sheet57 Profit & Loss Account58 Statement of Comprehensive Income59 Cash Flow Statement60 Statement of Changes in Equity61 Notes to the Financial Statements
PATTERN OF SHAREHOLDING, NOTICE & FORMS107 Pattern of Shareholding110 Notice of Annual General Meeting113 Form of Proxy115 Dividend Mandate Form


COMPANYOVERVIEW

VISIONOur passion is to attain distinctive leadership amongst the corporate success stories of tomorrow.
We at NRL recognize that realization of this passion needs superior professional competencies, continuous value addition and improvising, development of human capital and complete commitment to safety, occupational health and environment.
4 National Refi nery Limited

5Annual Report 2015
MISSIONTo remain the premium and
preferred supply source for various petroleum products and
petrochemicals.
Offer products that are not only viable in terms of desirability and price but most
importantly give true and lasting value to our customers.
Deliver strong returns on existing and projected investments of our stakeholders by use of specialised
and high quality corporate capabilities.
Business development by adoption of emerging technologies, growth in professional competence, support
to innovation, enrichment of human resource and performance recognition.
Be a responsible corporate citizen by serving the community through a variety of socio-economic acts and maintaining a high level of safety,
occupational health and environmental care.
preferred supply source for
in terms of desirability and price but most
investments of our stakeholders by use of specialised
technologies, growth in professional competence, support
a variety of socio-economic acts and maintaining a high level of safety,

6 National Refi nery Limited

CORE VALUESFollowing concepts and ideas guide the Management and Staff of National Refinery Limited in conducting its business practices in most ethical ways:
1. Ethical Conduct and Integrity We value lifestyle in our organization where ethics
like truth, honesty, integrity and fair play are basic ingredients while inter-acting within the organization or dealing with the outside world.
2. Teamwork and Responsibility We share information and resources and step in to help out other
team members. Conflicts are worked out in spite of obstacles and difficulties. We accept responsibility with “can do” attitude.
3. Customer satisfaction We endeavor to provide quality products to our customers at competitive
prices. We value their satisfaction essential for continued growth of our business.
4. Continuous improvement We generate new ideas and creative approaches to upgrade and update
our refinery to best available technology and processes so that our products are at the level of internationally accepted standards.
5. Profitability We believe in enhancing our profitability to the maximum so that
Employees, Shareholders and Government all benefits from it.
6. Corporate Citizenship As a good Corporate Citizen, we are more than willing and happy to meet
our social responsibilities towards the community around us. We are also committed to meet requirements of health, safety and environment.
7Annual Report 2015

CORPORATE INFORMATIONBoard of DirectorsDr. Ghaith R. Pharaon – Chairman Alternate Director: Abdus Sattar
Laith G. Pharaon Alternate Director: Jamil A. Khan
Wael G. Pharaon Alternate Director: Babar Bashir Nawaz
Shuaib A. MalikMusa BojangBahauddin KhanTariq Iqbal Khan
Chief Executive Offi cerShuaib A. Malik
Chief Financial Offi cerAnwar A. Shaikh
Company SecretaryNouman Ahmed Usmani
8 National Refi nery Limited

Audit Committee Tariq Iqbal Khan ChairmanAbdus Sattar Alternate to Dr. Ghaith R. Pharaon MemberBabar Bashir Nawaz Alternate to Wael G. Pharaon MemberBahauddin Khan MemberShaikh Ather Ahmed Secretary
Human Resource and Remuneration (HR&R) Committee Musa Bojang ChairmanBahauddin Khan MemberBabar Bashir Nawaz Alternate to Wael G. Pharaon MemberShuaib A. Malik MemberNouman Ahmed Usmani Secretary
AuditorsA. F. Ferguson & Co.Chartered Accountants
SolicitorsAli Sibtain Fazli & Associates
Primary BankersMCB Bank LimitedAllied Bank LimitedHabib Bank LimitedAskari Bank LimitedFaysal Bank LimitedUnited Bank LimitedSamba Bank LimitedBank Al-Falah LimitedBank Al-Habib LimitedNational Bank of PakistanHabib Metropolitan Bank Limited
Registered Offi ce7-B, Korangi Industrial Area,P.O. Box 8228, Karachi-74900UAN: 111-675-675PABX: + 92-21-35064981-86 + 92-21-35064977-79 Fax: + 92-21-35054663 + 92-21-35066705Website: www.nrlpak.comE-mail: [email protected]
Share RegistrarTHK Associates (Pvt.) Ltd.,2nd Floor, State Life Building-3,Dr. Ziauddin Ahmed Road,Karachi-75530P. O. Box No. 8533UAN: + 92-21-111-000-322Direct: + 92-21-35693094-95Fax: + 92-21-35655595Email: [email protected]: www.thk.com.pk
9Annual Report 2015

10 National Refi nery Limited

NRL AT A GLANCE
First Lube Refi nery Design Capacity 539,700 Tons per year of Crude processingDesign Capacity 76,200 Tons per year of Lube Base OilsDate Commissioned June 1966Project Cost Rs. 103.9 million Fuel Refi nery Before Re-Vamp Design Capacity 1,500,800 Tons per year of Crude processingDate Commissioned April 1977Project Cost Rs. 607.5 million After Re-Vamp Design Capacity 2,170,800 Tons per year of Crude processingDate Commissioned February 1990Project Cost of Revamping Rs. 125.0 million BTX Unit Design Capacity 25,000 Tons per year of BTXDate Commissioned April 1979Project Cost Rs. 66.7 million Second Lube Refi nery Before Re-Vamp Design Capacity 100,000 Tons per year of Lube Base OilsDate Commissioned January 1985Project Cost Rs. 2,082.4 million After Re-Vamp Design Capacity 115,000 Tons per year of Lube Base OilsDate Commissioned June 2008Project Cost of Revamping Rs. 585.0 million Shareholders’ Equity June 1966 Rs. 20.0 million June 2015 Rs. 30,133.7 million
11Annual Report 2015

12 National Refi nery Limited

CORPORATE OBJECTIVES & DEVELOPMENT STRATEGYNational Refi nery Limited is a petroleum refi ning and petrochemical complex engaged in manufacturing and supplying a wide range of fuel products, lubes, BTX, asphalts and specialty products for domestic consumption and export.
NRL objectives and development strategy are aimed at achieving sustainable productivity and profi tability and high standards of safety, occupational health and environmental care. This entails human resource re-engineering & development, enhancing value addition, implementing conservation measures and continuing growth through upgradation of existing as well as addition of new facilities. In the changing global environment, corporate objective and development strategy have been defi ned to meet the challenges of 21st Century.
Corporate Objectives• Ensure that business policies and targets are in conformity with the national goals.• Contribute in meeting the country’s demand of petroleum and petrochemical products.• Customer’s satisfaction by providing best value and quality products.• Optimization of the value of barrel of crude oil and cost reduction through conservation
measures.• Achieving and maintaining a high standard of Occupational Health, Safety and
Environmental care.• Ensure reasonable return on the shareholders’ existing and projected investments.• Maintain modern management systems conforming to international standards needed
for an effi cient organization.
Development Strategy• Contribute in national efforts towards attaining sustainable self-effi ciency in petroleum
products.• Human resource development by upgrading training facilities and exposure to modern
technologies/management techniques.• Balancing and Modernization for energy conservation and enhanced yield of value
added products as well as revamping for environment friendly products.• Expansion of refi ning capacity by de-bottlenecking and adding new facilities.• Acquire newer generation technologies for the effi cient refi nery operations as well as for
attaining highest standards of Occupational Health, Safety and Environmental care. • Acquiring self-suffi ciency in re-engineering, design and fabrication of equipments.
13Annual Report 2015

14 National Refi nery Limited
DIRECTORS' PROFILE
Dr. Ghaith R. PharaonChairman and Director
(Non-Executive Director)
Mr. Laith G. Pharaon(Non-Executive Director)
Mr. Wael G. Pharaon(Non-Executive Director)
Chairman & DirectorThe Attock Oil Company LimitedAttock Petroleum LimitedAttock Cement Pakistan Limited
DirectorPakistan Oilfields LimitedAttock Gen LimitedAttock Leisure & Management Associates (Pvt.) LimitedAttock Refinery LimitedAttock Solar (Pvt.) Limited
DirectorAttock Petroleum LimitedPakistan Oilfields LimitedThe Attock Oil Company LimitedAttock Refinery LimitedAttock Cement Pakistan LimitedAttock Gen LimitedAttock Leisure & Management Associates (Pvt.) Limited
DirectorAttock Petroleum LimitedPakistan Oilfields LimitedThe Attock Oil Company LimitedAttock Refinery LimitedAttock Cement Pakistan LimitedAttock Gen LimitedAngoori Heights Development (Pvt.) LimitedMargalla Farm Houses Development (Pvt.) LimitedRawal Lodges Development (Pvt.) Limited
Mr. Shuaib A. MalikDeputy Chairman &
Chief Executive Officer(Executive Director)
Chairman, Chief Executive & Director
Pakistan Oilfields Limited
Chairman & Director
Attock Hospital (Pvt.) LimitedAttock Refinery Limited
Chief Executive & DirectorAttock Petroleum LimitedThe Attock Oil Company LimitedAttock Information Technology Services (Pvt.) LimitedAngoori Heights Development (Pvt.) LimitedAttock Leisure & Management Associates (Pvt.) LimitedFalcon Pakistan (Pvt.) LimitedAttock Solar (Pvt.) Limited
DirectorAttock Cement Pakistan LimitedAttock Gen LimitedRawal Lodges Development (Pvt.) LimitedMargalla Farm Houses Development (Pvt.) Limited
Resident Director
Pharaon Investment Group Limited Holding SAL
Group Regional Chief Executive
Chairman
NRL Management Staff Pension FundNRL Management Staff Gratuity Fund
Name Other Engagements
15Annual Report 2015
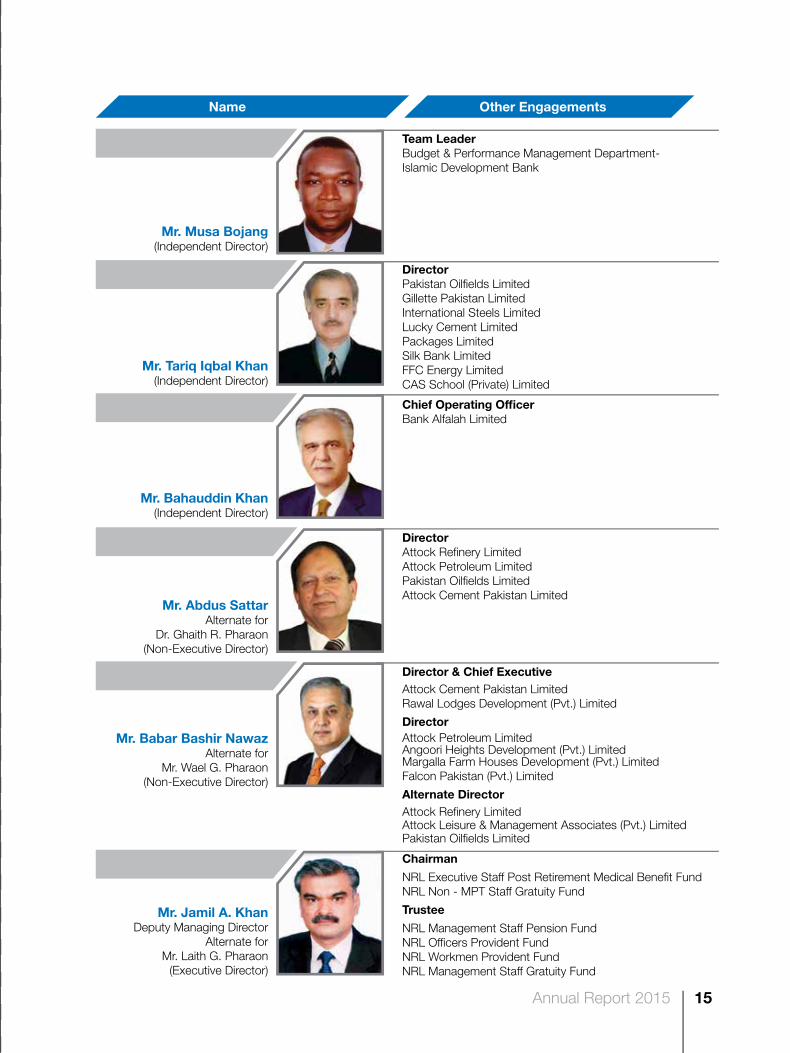
Mr. Musa Bojang(Independent Director)
Team LeaderBudget & Performance Management Department-Islamic Development Bank
Mr. Tariq Iqbal Khan(Independent Director)
DirectorPakistan Oilfields LimitedGillette Pakistan LimitedInternational Steels LimitedLucky Cement LimitedPackages LimitedSilk Bank LimitedFFC Energy LimitedCAS School (Private) Limited
Mr. Bahauddin Khan(Independent Director)
Chief Operating OfficerBank Alfalah Limited
Mr. Abdus SattarAlternate for
Dr. Ghaith R. Pharaon(Non-Executive Director)
DirectorAttock Refinery LimitedAttock Petroleum LimitedPakistan Oilfields LimitedAttock Cement Pakistan Limited
Mr. Babar Bashir NawazAlternate for
Mr. Wael G. Pharaon(Non-Executive Director)
Director & Chief ExecutiveAttock Cement Pakistan LimitedRawal Lodges Development (Pvt.) Limited
DirectorAttock Petroleum LimitedAngoori Heights Development (Pvt.) LimitedMargalla Farm Houses Development (Pvt.) LimitedFalcon Pakistan (Pvt.) Limited
Alternate DirectorAttock Refinery LimitedAttock Leisure & Management Associates (Pvt.) LimitedPakistan Oilfields Limited
Mr. Jamil A. KhanDeputy Managing Director
Alternate forMr. Laith G. Pharaon
(Executive Director)
Chairman
NRL Executive Staff Post Retirement Medical Benefit FundNRL Non - MPT Staff Gratuity Fund
Trustee
NRL Management Staff Pension FundNRL Officers Provident FundNRL Workmen Provident FundNRL Management Staff Gratuity Fund
Name Other Engagements

16 National Refi nery Limited
It gives me immense pleasure to welcome you all, on behalf of the Board of Directors, at the 52nd Annual General Meeting of your Company and to present annual review of results and audited fi nancial statements for the year ended June 30, 2015.
Global economic growth during the outgoing year has witnessed some improvements in macroeconomic indicators of Pakistan. In addition, the Government has signed agreements with China, including agreements for power generation and Pakistan/China Economic Corridor, which are encouraging steps towards the future national economic growth. Government has further reduced mark-up rate to 7% to increase investment activity in the country.
CHAIRMAN'S REVIEW

17Annual Report 2015
As external factors indicate a favourable outlook, your Company’s loss after tax in fi rst six months has turned into profi t after tax mainly due to better margins in the last two quarters. During the fi nancial year crude oil prices in the international market took a nose dive from US$ 109 to US$ 44 and then stayed around US $60 in the last quarter. Your Company achieved profi t after tax of Rs. 3,709 million as compared to Rs. 962 million in the last year.
After improved margins, fuel segment marginally remained in loss after tax of Rs.81 million as compared to loss after tax of Rs.2,835 million in the last year whereas lube segment maintained its profi tability by achieving a profi t after tax of Rs.3,790 million compared to Rs.3,797 million.
Desulphurization project to reduce environmental hazard and Isomerization project for profi tability are in progress. Chinese contractors are actively working while fi nancial closure has been attained from a Syndicate of Banks. Your company is seriously putting all efforts to maintain the pace of the project and complete the same within the contractual period.
Looking at the fi nancial results and ongoing projects, I would like to appreciate the efforts of the management, employees and all other stakeholders for their untiring efforts and anticipate that company will continue receiving support, confi dence and trust of all. Your company will continue to strive through better management and improve effi ciency to achieve even better results for the times to come.
__________________Dr. Ghaith R. PharaonChairman
August 12, 2015Rawalpindi
__________________

18 National Refi nery Limited
The Board of Directors is pleased to present the 52nd Annual Report of National Refi nery Limited together with the audited fi nancial statements and auditors’ report thereon for the year ended June 30, 2015.
DIRECTORS' REPORT

19Annual Report 2015
Financial ResultsYour Company entered into positive zone in the third quarter after facing loss after tax upto December 31, 2014, that included heavy exchange loss. Profi tability of the Company further improved in the fourth quarter, with marginal exchange loss. We feel pleasure to announce that the company earned profi t after tax of Rs. 3,709 million as compared to Rs. 962 million in last year which is the highest profi t in last four years. Profi tability improved due to improvement in margins of refi ned fuel products versus crude oil. Lower prices of crude oil enabled the company to invest unutilized funds to increase the interest income while stable exchange rate during the second half of the year improved the performance.
PROFIT AFTER TAX - (Rs in million)
Fuel SegmentLoss after tax in fuel segment continued despite improvement in margins. Fuel segment incurred loss after tax of Rs.81 million as compared to loss after tax of Rs.2,835 million in the same period last year. The prime factor of reduction in losses is better Gross Refi ning Margin (GRM) and stable exchange rate during the last four months that recovered losses of the previous period. Exchange loss was Rs.851 million as compared to Rs.848 million during last year. However, Price differential claim on High Speed Diesel (HSD) was comparatively on higher side i.e. Rs.1,507 million (2014: Rs.573 million).
2013-2014 SALES VOLUME COMPOSITION 2014-2015

20 National Refi nery Limited
Lube SegmentLube segment maintained profi t after tax of Rs.3,790 million compared to Rs.3,797 million during last year despite reduction in throughput due to turnaround of 26 days.
Local sale volume of Lube Base Oil remained similar to last year, however, export volume of lube base oils was comparatively less due to lower prices in international market. In view of Government initiative for improvement of road infrastructure, Asphalt sale is gaining momentum, resulting in reduction of accumulated inventory at year end and further reduction is foreseen, easing liquidity position of the Company.
Earning Per ShareEarning per share was Rs.46.38 compared to Rs.12.03 in the last year.
Appropriations
Description 2014-15 2013-14
(Rupees in millions)Profi t available for appropriation (including Other Comprehensive Income)
4,486 946
Transfer to General Reserves 3,000 -Final Dividend @ Rs.10 per share (2014: NIL) 800 -
DividendThe Board of Directors has recommended a fi nal cash dividend @ Rs. 10 per share (100 %) for the year ended June 30, 2015. The dividend recommended is subject to the approval by the shareholders in the Annual General Meeting.
Company BusinessThe Company is engaged in the business of Crude Oil Refi ning with three refi neries commissioned in the year 1966, 1977 and 1985. The Company was privatized in the year 2005, whereby 51% shares of the Company are held by Attock Group of Companies.
The Company operates its three refi neries in two business segments “Fuel Segment” and “Lube Segment”. Fuel Segment is the producer of High Speed Diesel, Naphtha, Motor Gasoline,

21Annual Report 2015
Liquefi ed Petroleum Gas, Jet Fuels & Furnace Oil. Lube Segment produces multiple grades of Lube Base Oils, Asphalts, Waxes and Rubber Process Oil and some quantities of fuel products. The products are marketed locally, whereas Naphtha and some quantity of Lube Base Oils are exported. The designed annual processing capacity of Fuel Segment is 2,710,500 M. Tons of Crude Oil and condensate.
Effective May 1, 2015 Government levied Regulatory (later converted to Custom) duty on import of Crude Oil 2%, HSD 2.5%, Mogas 2% and increased the same on Furnace Oil from 5% to 7%. Later on ECC decided that there will be no loss / gain impact of such duty for refi neries/OMCs and a mechanism is to be prepared for adjustment of claims, by OGRA and Ministry of Petroleum & Natural Resources (MOP&NR) in consultation with Federal Board of Revenue (FBR). Future Outlook
Refi nery Upgradation Projects The Company is in process of upgradation of its plant to comply with the Government directives to produce environment friendly HSD and to meet Country’s growing demand of motor gasoline in Phase-I. Phase-II shall be considered for implementation after the completion of Phase-I.
• Diesel Desulphurization and Isomerization Chinese contractors have started the execution of contract for Diesel desulphurization (DHDS)
and Isomerization (ISOM) projects. The company estimates that contract value plus other cost of the project would be US$ 349 million. Initial mobilization advance has been paid by the company to the contractors for supply of plant and machinery and for construction and installation of the plant. The company has entered into syndicate agreement with consortium of banks for fi nancing of these projects for an amount of Rs.24.2 billion at 1.7% above six months KIBOR. The loan is to be repaid in 10 years semi-annual payments with grace period of two years. Government directed to complete the project by 31 December 2015, however, due to various impediments the project would be completed by the mid of 2017, accordingly, your company has applied to government for the extension.
The Government has agreed to increase the deemed duty on HSD by 1.5% on completion of these projects, which will increase refi nery margins. The improved margins due to conversion of Naphtha into Motor gasoline will also contribute favourably to improve company’s margins.
• Other Upgradation Projects These projects are planned in Phase-II of refi nery up-gradation projects and award of job to EPC
Contractor shall be considered after fi nalization of Desulphurization and Isomerization projects.
• Two Stage Unit at Lube–1 Refi nery The project has been planned to enhance the installed crude oil processing capacity from
12,050 Barrel per stream day (bpsd) to 17,000 bpsd and vacuum fractionation capacity from 5,200 bpsd to 6,600 bpsd. Design package and ITB documents for bidding are complete.
• 101 Crude Distillation Unit at Fuel Refi nery The project has been envisioned, to enhance the installed crude oil processing capacity
from 50,000 bpsd to 53,000 bpsd at crude distillation unit of fuel refi nery. Design package

22 National Refi nery Limited
and ITB documents for bidding are complete and the project is expected to be awarded during the year 2015-16.
• Nitrogen Gas Generator For the purpose of fi nancial economization it is planned to use nitrogen gas as inert media
for MEK units and for tank blanketing. Nitrogen gas generator with technology of Pressure Swing Absorption is being planned having capacity of 400 normal cubic meter/hour. The contract for installation is likely to be awarded during the year 2015-16.
• Reverse Osmosis Plant Considering the scarcity of water and its requirement for refi nery operations, Company
has planned another 250,000 gallons per day Reverse Osmosis plant on which work is in progress.
• Up gradation of SAP ERP System from Version 4.6c to SAP ECC6 The Company has successfully completed the up-gradation of its ERP system from 4.6c
to ECC-6 including additions of certain modules. The new version and modules of SAP has enhanced tool for streamlining the work and for improved management and fi nancial reporting.
Pricing FormulaThe Company’s Fuel Segment is regulated by Government under the Import Parity Pricing Formula. However, effective from June 1, 2011, the Government de-regulated the prices of motor gasoline, aviation fuel and Light Diesel Oil with the capping that the prices announced by the refi neries should not exceed the import prices of the relevant product of Pakistan State Oil average actual import prices of previous month including partially the incidentals. In case these prices are not available then refi neries have to fi x their prices as per existing Import Parity Pricing Formula.
According to the Import Parity Pricing formula, the distribution of profi ts from fuel segment is restricted and only 50% of the paid-up capital as of July 1, 2002 can be distributed as dividend to shareholders and the remaining amount is to be transferred to special reserves. Following are the highlights of directives issued last year by Government of Pakistan in this regard:
- Refi neries have been restricted to adjust their losses from Special Reserve from the year June 30, 2013 and onwards.
- Refi neries have been allowed to utilize the Special Reserves for up-gradation and expansion of fuel refi nery operations, subject to government approvals and verifi cation.
- Refi neries have been directed to open Escrow Account for the amount held in Special Reserves less amount utilized as above. (Amount available in Special Reserves has been fully utilized in projects)
- Government of Pakistan has agreed to increase the import duty on High Speed Diesel from 7.5% to 9% effective January 1, 2016.
Signifi cant ResourcesThe Company has suffi cient funds in the form of cash and bank balances and short-term investments to maintain its liquidity. The Company is currently managing its liquidity without any

23Annual Report 2015
long-term and short-term borrowings. With respect to fi nancing of the project, company has entered into Bank syndicate arrangement for which fi nancial closure has been completed.
RelationshipsWe continue to maintain history of making timely payments for the supply of crude oil to Saudi Aramco and other oil exploration companies operating in Pakistan.
We always endeavour to maintain good relationship with our local suppliers, customers and other business partners involved in the whole supply chain.
Key Operating and Financial DataKey operating and fi nancial data of last six years (2010 – 2015) is shown on page 45.
Refi neries Production and Product-Wise Share Participation 2013-2014Based on the latest “Pakistan Oil Report 2013-2014”
According to throughput analysis, NRL is the currently the second largest refi nery of Pakistan currently in operation with a production capacity of 2.71 million tons per year. NRL is the only lube refi nery of Pakistan producing multiple grades of Lube Base Oils to meet the demand of the Country.
Credit RatingsThe long term entity rating of the Company is “AA+” (Previous: “AA+”). The short-term entity rating has been maintained at “A1+”. These ratings denote a very low expectation of credit risk emanating from a very strong capacity for timely payment of fi nancial commitments.
Risk & Threats The volatile crude oil and product prices in international market mostly results in narrow margins. In such case the Company adjusts its throughput to minimize the losses. Sharp decline in crude oil prices may result in inventory losses.

24 National Refi nery Limited
The Company faces exchange losses due to devaluation of Pak rupee in making payments of raw material to suppliers in foreign currencies.
Your Company, being a strategic asset, focuses on security measures including acquiring and installing latest security hardware.
Corporate Social Responsibility The Company realizes its social responsibility towards the national economy apart from its customers, employees and shareholders. As a responsible corporate citizen, the Company has contributed to different social segments of the economy in various ways for improving quality of life in the country. Recently, Company contributed Rs.100,000 as a donation to Child Association to help deprived children.
During the year company has paid Rs.200,000 to Ziauddin University for advertisement / purchase of souvenirs for students. The company is making such contribution for the betterment of institutions providing education to young generation.
Company is ambitious to be recognized as social partner and not only as commercial entity. In this respect, the Company has kept fi ve disabled persons on its manpower strength as prescribed in Employment and Rehabilitation Ordinance, 1981 and also made payments to National Council for the Rehabilitation of Disabled Persons in lieu of less number of such persons in the Company’s employment.
Employees & Management Relations The cordial relationship between the management and union persisted unabatedly. The productivity achieved refl ects the concerted and sincere collective endeavours. The Company lays emphasis on enhancing the sports activities and has provided the required facilities to achieve this objective which may go a long way in maintaining good health of the employees, boosting up their morale and sense of belonging. The major events held during the year are Inter-Department Cricket Tournament, participation of NRL Cricket team in PARCO Cricket Tournament.
Occupational Health, Safety and Environment We ensure that our manufacturing activities are in line with the Government environmental laws and Company’s standard operating procedures and safe work practices to support toward environment protection.
Environmental performance is continuously reviewed at planned intervals to ensure its continuing suitability, adequacy and effectiveness. Opportunities of improvement and need for changes where required are discussed in HSE Committees and Steering Committee meetings. Decisions are taken, where needed, strategies are developed and implemented.
Management is committed towards acquiring excellence in overall performance specially for the conservation of environment, which is evident from implementation of IMS (Integrated Management System) based on ISO 9001:2008, ISO 14001:2004 & OHSAS 18001:2007 standards.

25Annual Report 2015
NRL has achieved 22.06 million Safe Hours without Lost Time Injury (LTI) as on June 30, 2015. Your company is doing continuous efforts to ensure the effective application of operational controls for minimizing Occupational Health & Safety risk’s and environmental impacts.
Environment Excellence Awards Company has participated in the following Environment Excellence Awards:
1 National Forum for Environment & Health (NFEH), Excellence award 2015, consecutively winner since last twelve years.
2 Continually participating in the ACCA-WWF Pakistan Best Environment Reporting Awards since 2003 and was winner of the victory stand in 2003, 2009 & 2010.
Your Company is an environmental friendly enterprise in the petroleum-refi ning sector of the country.
Contribution to National ExchequerDuring the fi nancial year, the Company contributed Rs. 40,231 million to the National exchequer in the shape of direct and indirect taxes and earned valuable foreign exchange of US$ 157 million through the export of Naphtha and Lube Base Oils.
In addition to the above, the Company has paid to government Rs. 4,656 million as discount and windfall levy on account of local crude oil and condensates purchased from oil and gas exploration companies.
Human Resource DevelopmentHuman Resource of the Company is playing a very signifi cant role in achieving the short and long term corporate and strategic objectives of the Company. Therefore, your Company focuses special attention on their training and development. Various staff members were nominated for local courses and workshops in different technical and non-technical disciplines. In addition to hands on executive training programs, the Company has also conducted apprenticeship program where theoretical and practical training in Refi nery operations and maintenance was imparted which will not only meet the additional requirement of trained manpower for expansion projects of the Company but would extend a great help to the Petroleum Refi ning industry in the availability of trained manpower.
Corporate GovernanceThe Company is committed to good corporate governance and has complied with the applicable ‘Code of Corporate Governance’ contained in the listing regulations of the stock exchanges. As required by the Code, following is the statement in compliance with the Corporate and Financial Reporting Framework of Code of Corporate Governance.
a) The fi nancial statements, prepared by the management of the Company, present its state of affairs fairly, the result of its operations, cash fl ows and change in equity.
26 National Refi nery Limited
b) Proper books of account have been maintained in the manner required under the Companies Ordinance 1984.
c) Appropriate accounting policies have been consistently applied in the preparation of fi nancial statements. Accounting estimates are based on reasonable and prudent judgment.
d) International Financial Reporting Standards, as applicable in Pakistan, have been followed in the preparation of fi nancial statements.
e) The system of internal control is sound in design and has been effectively implemented and monitored.
f) There are no signifi cant doubts upon the Company’s ability to continue as a going concern.
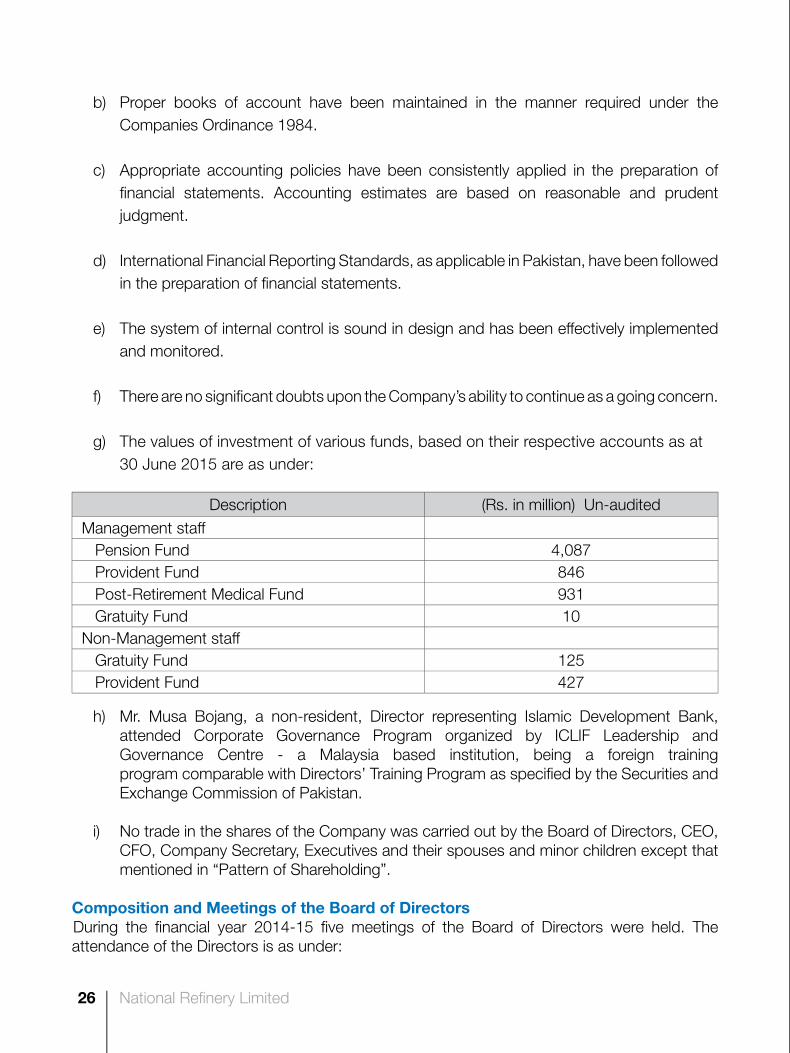
g) The values of investment of various funds, based on their respective accounts as at 30 June 2015 are as under:
Description (Rs. in million) Un-audited Management staff Pension Fund 4,087 Provident Fund 846 Post-Retirement Medical Fund 931 Gratuity Fund 10 Non-Management staff Gratuity Fund 125 Provident Fund 427
h) Mr. Musa Bojang, a non-resident, Director representing Islamic Development Bank, attended Corporate Governance Program organized by ICLIF Leadership and Governance Centre - a Malaysia based institution, being a foreign training program comparable with Directors’ Training Program as specifi ed by the Securities and Exchange Commission of Pakistan.
i) No trade in the shares of the Company was carried out by the Board of Directors, CEO, CFO, Company Secretary, Executives and their spouses and minor children except that mentioned in “Pattern of Shareholding”.
Composition and Meetings of the Board of Directors During the fi nancial year 2014-15 fi ve meetings of the Board of Directors were held. The attendance of the Directors is as under:

27Annual Report 2015
Name of DirectorsTotal No. of Meetings
Meetings Attended
Dr. Ghaith R. Pharaon Alternate Director: Mr. Abdus Sattar
5 5
Mr. Laith G. Pharaon Alternate Director: Mr. Jamil A. Khan
5 5
Mr. Wael G. Pharaon Alternate Director: Mr. Babar Bashir Nawaz
5 5
Mr. Shuaib A. MalikDeputy Chairman /Chief Executive Offi cer
5 5
Mr. Musa Bojang – IDB Nominee Alternate Director: Mr. Abdus Sattar
5 5
Mr. Bahauddin Khan – NIT Nominee 5 5
Mr. Tariq Iqbal Khan 5 5
* attended by directors or their alternates on the Board of the Company at the time of relevant meeting.

28 National Refi nery Limited
Human Resource & Remuneration CommitteeMeeting of the Committee held and attendance of the members during the period from July 01, 2014 to June 30, 2015:
Name of DirectorsTotal No. of Meetings
Meetings Attended
Mr. Musa Bojang 1 1Mr. Bahauddin Khan 1 1Mr. Babar Bashir Nawaz 1 1Mr. Shuaib A. Malik 1 1
Audit CommitteeThe Directors have established Audit Committee. The attendance of the Directors’ for Audit Committee meetings for the year ended June 30, 2015 is as follows.
Name of DirectorsTotal No. of Meetings
Meetings Attended
Mr. Tariq Iqbal Khan 4 4Mr. Babar Bashir Nawaz 4 4Mr. Abdus Sattar 4 4Mr. Bahauddin Khan 4 3
Pattern of ShareholdingPattern of shareholdings is shown on page 107.
AUDITORSPresent Auditors Messrs A. F. Ferguson & Co., Chartered Accountants retire and offer themselves for reappointment. The Board recommends the reappointment of Messrs A. F. Ferguson & Co., Chartered Accountants as auditors for the fi nancial year ending June 30, 2016.
ACKNOWLEDGEMENTThe Board places on record its appreciation and gratitude to the Company’s management and its staff for their untiring efforts. The Board also acknowledges the efforts and contributions of customers, suppliers and other stakeholders for their patronage and business relations.
On behalf of the Board
________________Shuaib A. MalikDeputy Chairman &Chief Executive Offi cer
August 12, 2015 Rawalpindi

29Annual Report 2015 29Annual Report 2015

30 National Refi nery Limited30 National Refi nery Limited

31Annual Report 2015 31Annual Report 2015
CORPORATEGOVERNANCE

32 National Refi nery Limited
National Refi nery Limited (the Company) is engaged in the manufacturing of wide range of petroleum products with the objective to achieve sustainable productivity, profi tability and high standards of safety, occupational health and environmental care. This entails human resource development, enhancing value addition, implementing conservation measures and growth by up-gradation and addition of newer generation technologies.
The Company requires all its Board Members and Employees to act within the authority conferred upon them and in the best interests of the Company and observe all the Company’s policies and procedures as well as relevant laws and regulations, as are applicable in individual capacity or otherwise, including but not limited to the corporate values, business principles and the acceptable and unacceptable behaviour (hereinafter called the Company’s Code of Conduct) embodied in this document.
The Company believes that the credibility, goodwill and repute earned over the years can be maintained through continued conviction in our corporate values of honesty, justice, integrity and respect for people. The Company strongly promotes trust, openness, teamwork and professionalism in its entire business activities.
The business principles are derived from the above stated corporate values and are applied to all facets of business through well-established procedures. These procedures defi ne behaviour expected from each employee in the discharge of his/her responsibility.
NRL recognizes following obligations, which need to be discharged with best efforts, commitment and effi ciency:
o Safeguarding of shareholders’ interest and a suitable return on equity.o Service customers by providing products, which offer value in terms of price, quality,
safety and environmental impact.o Respect human rights, provide congenial working environment, offer competitive terms
of employment, develop human resource and be an equal opportunity employer.o Seek mutually benefi cial business relationship with contractors, suppliers and investment
partners.
The Company believes that profi t is essential for business survival. It is a measure of effi ciency and the value that the customer places on products and services produced by the Company.
The Company requires honesty and fairness in all aspect of its business and in its relationships with all those with whom it does business. The direct or indirect offer, payment, soliciting and accepting of bribe in any form is undesirable.
The Company is fully committed to reliability and accuracy of fi nancial statements and transparency of transactions in accordance with established procedures and practices.
CODE OF CONDUCT

33Annual Report 2015
The Company does not support any political party or contributes funds to groups having political interests. The Company will however, promote its legitimate business interests through trade associations.
The Company, consistent with its commitments to sustainable developments, has a systematic approach to the management of health, safety and environment.
The Company is committed to observe laws of Pakistan and is fully aware of its social responsibility. It would assist the community in activities such as education, sports, environment preservation, training programs, skills development and employment within the parameters of its commercial objectives.
The Company supports free market system. It seeks to compete fairly and ethically within the framework of applicable competition laws in the country. The Company will not stop others from competing freely with it.
In view of the critical importance of its business and impact on national economy, the Company provides all relevant information about its activities to legitimate interested parties, subject to any overriding constraints of confi dentiality and cost.
The Company requires all its board members and employees to essentially avoid confl ict of interest between private fi nancial and/or other activities and their professional role in the conduct of Company business.
No board member or employee shall in any manner disclose to any person or cause disclosure of any information or documents, offi cial or otherwise, relating to the Company, except those published, and unless he/she is authorised by the management.
All papers, books, drawings, sketches, photographs, documents and similar papers containing analysis, formulas, notes or information relating to the Company’s business affairs or operations shall always be treated as the Company property, whether prepared by the employee or otherwise and no employee shall be permitted to carry any of these outside business premises unless specifi cally authorised to do so by the management.
The Company’s property, funds, facilities and services must be used only for authorised purposes.
The board members or employees of the Company specifi cally those coming in direct contact with the vendors doing or seeking to do business with the Company shall not receive favours or incur obligations. In case any contractor/supplier to have business relations with the Company happen to be a relative of an offi cial who is entrusted the responsibility of opening/evaluation/award of supply/contract job or with execution or certifi cation of material/services, he/she shall immediately bring the fact to the notice of Managing Director who may entrust the responsibility to another.

34 National Refi nery Limited
Each employee shall devote his/her full time and energy exclusively to the business and interests of the Company. In particular, no employee (including those on leave) unless otherwise permitted by the Company, shall directly or indirectly engage in any other profession or business or enter the services of or be employed in any capacity for any purpose whatsoever and for any part of his/her time by any other person, government department, fi rm or company and/or shall not have any private fi nancial dealings with any other persons of fi rms having business relations with the company for sale or purchase of any materials or equipments or supply of labour or for any other purpose. Every employee shall hold himself in readiness to perform any duties required of him by his/her superiors to the best of his/her ability.
No board member or employee of the Company shall, directly or indirectly, deal in the shares of the Company in any manner during the closed period, as determined and informed by the Company.
No board member or employee of the Company shall practice insider trading.
Without prejudice to any penal action defi ned in any statute, as applicable, against any kind of non-compliances/violations, non-compliance with the Company’s Code of Conduct may expose the person involved to disciplinary action as per Company’s rules and/or as determined by the management or the Board of Directors of the Company, as the case may be, on case to case basis.
On behalf of the Board
__________________SHUAIB A. MALIKDeputy Chairman & Chief Executive Offi cer
June 18, 2012
35Annual Report 2015
STATEMENT OF COMPLIANCE WITH THE CODE OF CORPORATE GOVERNANCEFOR THE YEAR ENDED JUNE 30, 2015
This statement is being presented to comply with the Code of Corporate Governance (the Code) contained in listing regulations of Stock Exchanges where the shares of the Company are listed, for the purpose of establishing a framework of good governance, whereby a listed Company is managed in compliance with the best practices of corporate governance.
The Company has applied the principles contained in the Code in the following manner:
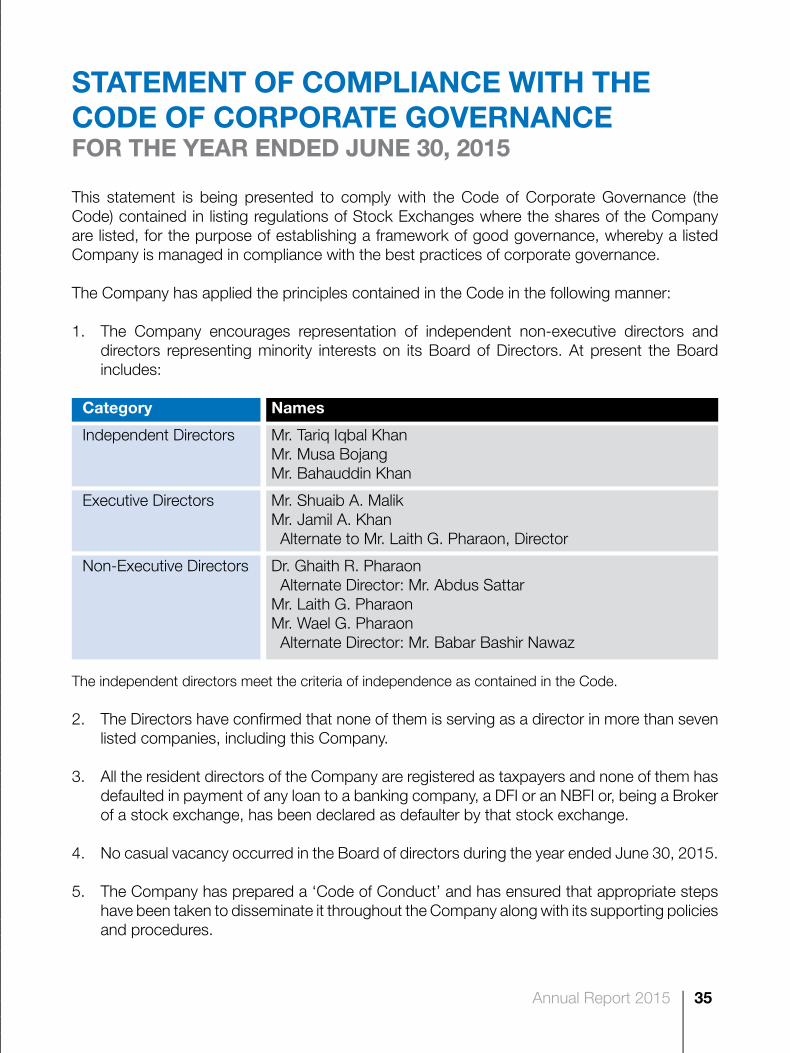
1. The Company encourages representation of independent non-executive directors and directors representing minority interests on its Board of Directors. At present the Board includes:
Category Names
Independent Directors Mr. Tariq Iqbal Khan Mr. Musa Bojang Mr. Bahauddin Khan
Executive Directors Mr. Shuaib A. Malik Mr. Jamil A. Khan Alternate to Mr. Laith G. Pharaon, Director
Non-Executive Directors Dr. Ghaith R. Pharaon Alternate Director: Mr. Abdus Sattar Mr. Laith G. Pharaon Mr. Wael G. Pharaon Alternate Director: Mr. Babar Bashir Nawaz
The independent directors meet the criteria of independence as contained in the Code.
2. The Directors have confi rmed that none of them is serving as a director in more than seven listed companies, including this Company.
3. All the resident directors of the Company are registered as taxpayers and none of them has defaulted in payment of any loan to a banking company, a DFI or an NBFI or, being a Broker of a stock exchange, has been declared as defaulter by that stock exchange.
4. No casual vacancy occurred in the Board of directors during the year ended June 30, 2015.
5. The Company has prepared a ‘Code of Conduct’ and has ensured that appropriate steps have been taken to disseminate it throughout the Company along with its supporting policies and procedures.

36 National Refi nery Limited
6. The Board has developed vision and mission statements, overall corporate strategy and signifi cant policies of the Company. A complete record of particulars of signifi cant policies along with the dates on which they were approved or amended has been maintained.
7. All the powers of the Board have been duly exercised and decisions on material transactions, including appointment and determination of remuneration and terms and conditions of employment of the CEO, other executive and non-executive directors, have been taken by the Board.
8. The meetings of the Board were presided over by the Chairman or Deputy Chairman, and the Chief Financial Offi cer and Company Secretary attended all the meetings. The Board meets at least once in every quarter. Written notices of the Board meetings along with agenda and working papers were circulated at least seven days before the meetings. The minutes of the meetings were appropriately recorded, circulated and signed by the Chairman of the meeting of the Board of Directors.
9. The Directors were apprised of their duties and responsibilities from time to time.
10. The Board has approved terms of appointment and remunerations of Chief Financial Offi cer (CFO), Company Secretary and Head of Internal Audit.
11. The director’s report for this year has been prepared in compliance with the requirements of the code and fully describes the salient matters required to be disclosed.
12. The CEO and CFO duly endorsed the fi nancial statements of the Company before approval of the Board.
13. The directors, CEO and executives do not hold any interest in the shares of the Company other than that disclosed in the pattern of shareholding.
14. The Company has complied with all the corporate and fi nancial reporting requirements of the Code.
15. The Board has formed an Audit Committee. It comprises of four members, of whom two are non-executive directors, one is independent director and the Chairman of the committee is also an independent director.
16. The meetings of the audit committee were held at least once every quarter prior to approval of interim and fi nal results of the Company and as required by the Code. The terms of reference of the committee have been formed and advised to the committee for compliance.
17. The Board has formed an HR and Remuneration Committee. It comprises of four members, of whom one is non-executive director, one is independent director and the Chairman of the Committee is also an independent director.
18. The Board has set-up an effective internal audit function and that is involved in the Internal

37Annual Report 2015
Audit on full time basis relating to the business and other affairs of the Company.
19. The statutory auditors of the Company have confi rmed that they have been given a satisfactory rating under the quality control review program of the Institute of Chartered Accountants of Pakistan, that they or any of the partners of the fi rm, their spouses and minor children do not hold shares of the Company and that the fi rm and all its partners are in compliance with International Federation of Accountants (IFAC) guidelines on code of ethics as adopted by the Institute of Chartered Accountants of Pakistan.
20. The statutory auditors or the persons associated with them have not been appointed to provide other services except in accordance with the listing regulations and the auditors have confi rmed that they have observed IFAC guidelines in this regard.
21. The related party transactions have been placed before the audit committee and approved by the Board of Directors along with pricing methods for transactions carried out on terms equivalent to those that prevail in the arm’s length transactions.
22. The ‘closed period’, prior to the announcement of interim/fi nal results, and business decisions, which may materially affect the market price of Company’s securities, was determined and intimated to directors, employees and stock exchanges.
23. Material/price sensitive information has been disseminated among all market participants at once through stock exchanges.
We confi rm that all other material principles contained in the Code have been complied with.
On behalf of the Board
__________________SHUAIB A. MALIKDeputy Chairman &Chief Executive Offi cer
August 12, 2015

38 National Refi nery Limited

39Annual Report 2015
The Board has constituted a fully functional Audit Committee. The features of the terms of reference of the Committee in accordance with the Code of Corporate Governance are as follows:
a) Determination of appropriate measures to safeguard the company’s assets;
b) Review of preliminary announcements of results prior to publication;
c) Review of quarterly, half-yearly and annual fi nancial statements of the company, prior to their approval by the Board of Directors, focusing on:
• major judgemental areas; • signifi cant adjustments resulting from the audit; • the going concern assumption; • any changes in accounting policies and practices; • compliance with applicable accounting standards; • compliance with listing regulations and other statutory and regulatory requirements; and• signifi cant related party transactions.
d) Facilitating the external audit and discussion with external auditors of major observations arising from interim and fi nal audits and any matter that the auditors may wish to highlight (in the absence of management, where necessary);
e) Review of management letter issued by external auditors and management’s response thereto;
f) Ensuring coordination between the internal and external auditors;
g) Review of the scope and extent of internal audit and ensuring that the internal audit function has adequate resources and is appropriately placed;
h) Consideration of major fi ndings of internal investigations of activities characterized by fraud, corruption and abuse of power and management’s response thereto;
i) Ascertaining that the internal control systems including fi nancial and operational controls, accounting systems for timely and appropriate recording of purchases and sales, receipts and payments, assets and liabilities and reporting structure are adequate and effective;
j) Review of company’s statement on internal control systems prior to endorsement by the Board of Directors and internal audit reports;
THE TERMS OF REFERENCE OF THE AUDIT COMMITTEE

40 National Refi nery Limited
k) Instituting special projects, value for money studies or other investigations on any matter specifi ed by the Board of Directors, in consultation with the Chief Executive and to consider remittance of any matter to the external auditors or to any other external body;
l) Determination of compliance with relevant statutory requirements;
m) Monitoring compliance with the best practices of corporate governance and identifi cation of signifi cant violations thereof;
n) Consideration of any other issue or matter as may be assigned by the Board of Directors; and
o) Recommend to the Board of Directors the appointment of external auditors, their removal, audit fees, the provision by the external auditors of any service to the company in addition to audit of its fi nancial statements.
41Annual Report 2015
The Board adopted the responsibilities contained in clause (xxv) of the Code 2012 from (i) to (iv) as the Terms of Reference (TOR) of the HR&R Committee.
The committee shall be responsible for:
i) recommending human resource management policies to the board;
ii) recommending to the board the selection, evaluation, compensation (including retirement benefi ts) and succession planning of the CEO;
iii) recommending to the board the selection, evaluation, compensation (including retirement benefi ts) of COO, CFO, Company Secretary and Head of Internal Audit; and
iv) consideration and approval on recommendations of CEO on such matters for key management positions who report directly to CEO or COO.
TERMS OF REFERENCE OF HUMAN RESOURCE ANDREMUNERATION (HR&R) COMMITTEE

42 National Refi nery Limited

43Annual Report 2015
STAKEHOLDERS’INFORMATION

44 National Refi nery Limited
STATEMENT OF VALUE ADDEDFOR THE YEAR ENDED JUNE 30, 2015
Rupees in million %
Rupees in million %
Revenue Generated Gross sales revenue 188,935 249,769
Less: Bought in material and services 142,677 205,968 46,258 43,801
Add: Income from investment 1,107 797 Other Income 418 639
1,525 1,436 Total Revenue 47,783 100.0% 45,237 100.0%
Revenue Distributed
To Employees remuneration as:
Salaries, wages and benefits 1,700 3.5% 1,603 3.6%
To Government as:
Levies 39,762 83.2% 41,288 91.3% Company taxation 1,851 3.9% 918 2.0% Worker's fund 412 0.9% 139 0.3%
42,025 88.0% 42,345 93.6%To Shareholders as:
Cash Dividend 800 1.8% - 0.0%
Retained in the business :
Depreciation & Amortization 349 0.6% 327 0.7% Net earnings 2,909 6.1% 962 2.1%
3,258 6.7% 1,289 2.8%
47,783 100% 45,237 100%
2015 2014

45Annual Report 2015
SIX YEARS AT A GLANCE
2014-15 2013-14 2012-13 2011-12 2010-11 2009-10
Profit and Loss AccountNet sales 148,457 207,403 179,184 174,797 148,558 110,186 Cost of sales 141,611 204,350 174,118 170,075 138,551 103,854 Purchases 126,374 200,565 166,130 171,149 141,383 98,964 Gross profit 6,846 3,053 5,067 4,722 10,007 6,333 Operating profit 6,413 2,732 5,347 5,795 10,179 5,831 Profit before tax 5,560 1,880 4,477 4,452 10,029 5,136 Profit after tax 3,709 962 2,846 2,618 6,569 3,285
Balance SheetShare Capital 800 800 800 800 800 800 Reserves 29,334 25,794 25,994 24,491 23,808 18,838 Shareholder equity 30,134 26,594 26,794 25,290 24,607 19,638 Fixed Assets 8,066 5,061 4,363 3,696 3,235 3,248 Current Assets 39,901 47,465 51,232 53,323 53,366 47,868 Current Liabilities 17,163 25,802 28,440 31,492 31,858 31,862 Net current assets/ liabilities 22,738 21,663 22,792 21,831 21,508 16,006
Rupees in million
2014-15 2013-14 2012-13 2011-12 2010-11 2009-10
Profitability RatiosGross profitNet profit to salesEBITDA Margin to salesReturn on EquityReturn on Capital Employed
4.612.503.98
12.3113.08
1.480.461.063.623.60
2.831.592.68
10.6210.93
2.701.502.72
10.3510.50
6.744.427.02
26.6929.69
5.752.985.20
16.7317.76
%%%%%
Liquidity RatiosCurrent RatioQuick /Acid test ratioCash to Current Liabilities
2.321.531.01
1.840.920.34
1.801.010.56
1.690.890.32
1.681.070.28
1.501.130.51
TimesTimesTimes
Activity / Turnover RatiosInventory turnoverDebtors turnoverCreditors turnoverTotal Assets turnover ratioFixed assets turnover ratio
47.5921.1745.72
3.0918.40
40.8918.3937.60
3.9340.98
49.5424.3553.03
3.2241.07
47.3228.1855.47
3.0647.30
40.4636.8267.63
2.6245.93
41.6850.8688.67
2.1333.92
DaysDaysDays
TimesTimes
Investment / Market RatiosEarnings per share - basic and dilutedPrice earning ratioDividend yield ratioCash Dividend payout ratioDividend cover ratioCash Dividend per shareMarket value per share at year endBreakup value per share
46.385.004.31
21.564.64
10.00232377
12.0317.46
----
215333
35.596.766.23
42.172.37
15.00241336
32.747.076.48
45.822.18
15.00231316
82.144.297.10
30.443.29
25.00352308
41.084.45
10.9448.69
2.0520.00
183246
Rs.TimesTimesTimesTimes
Rs. /shareRs. /shareRs. /share
Description

46 National Refi nery Limited
HO
RIZ
ON
TAL
BA
LAN
CE
SH
EE
TA
S A
T JU
NE
, 30
Rup
ees
in
milli
on
% R
upee
s in
m
illion
%
Rup
ees
in
milli
on
Rup
ees
in
milli
on
Rup
ees
in
milli
on
Rup
ees
in
milli
on
%%
%%
AS
SE
TS
NO
N-C
UR
RE
NT
AS
SE
TS
Fixe
d as
sets
8,06
6.11
248.
3%5,
061.
22
15
5.8%
4,36
2.94
134.
3%3,
695.
73
11
3.8%
3,23
4.79
99.6
%3,
248.
36
10
0.0%
Def
erre
d ta
xatio
n -
-
165.
34
38.2
%-
-
-
-
-
-
432.
73
100.
0%Lo
ng te
rm lo
ans
42.5
8
70
.9%
41.4
9
69
.1%
52.2
4
87
.0%
65.4
1
10
8.9%
62.8
6
10
4.7%
60.0
6
10
0.0%
Long
term
dep
osits
30.1
9
99
.2%
30.1
9
99
.2%
30.1
9
99
.2%
30.1
9
99
.2%
30.1
7
99
.1%
30.4
4
10
0.0%
Ret
irem
ent b
enefi
t pre
paym
ents
22.4
0
-
12.7
1
-
--
-
-
--
-
-
8,16
1.28
216.
4%
5,
310.
95
14
0.8%
4,44
5.37
117.
9%3,
791.
33
10
0.5%
3,32
7.82
88.2
%3,
771.
59
10
0.0%
CU
RR
EN
T A
SS
ET
S
Sto
res,
spa
res
and
chem
ical
s 1,
003.
10
110.
9%1,
149.
43
12
7.1%
788.
08
87.1
%98
6.57
10
9.1%
887.
29
98.1
%90
4.37
10
0.0%
Sto
ck-in
-tra
de
13,5
85.6
6
11
5.2%
23,8
56.5
6
20
2.2%
22,5
63.7
5
19
1.3%
25,3
59.7
1
21
5.0%
19,3
46.9
3
16
4.0%
11,7
98.2
0
10
0.0%
Trad
e de
bts
7,25
3.04
44.5
%10
,207
.07
62.7
%10
,976
.99
67.4
%13
,262
.18
81.4
%14
,100
.49
86.6
%16
,291
.70
100.
0%Lo
ans
and
adva
nces
74.6
0
34
8.1%
48.4
3
22
6.0%
36.2
8
16
9.3%
40.1
3
18
7.2%
23.9
6
11
1.8%
21.4
3
10
0.0%
Trad
e de
posi
ts a
nd s
hort
-ter
m p
repa
ymen
ts
8.92
54
.7%
53.2
4
32
6.6%
8.22
50
.4%
6.67
40
.9%
18.4
5
11
3.2%
16.3
0
10
0.0%
Inte
rest
acc
rued
32.2
4
46
.6%
40.8
4
59
.0%
86.1
2
12
4.4%
110.
69
159.
9%57
.00
82.3
%69
.23
100.
0%O
ther
rec
eiva
bles
54
7.33
58
.1%
301.
90
32.1
%19
3.3%
274.
71
29.2
%24
8.13
26
.4%
932.
49
99.0
%94
1.59
10
0.0%
Sho
rt te
rm in
vest
men
ts12
3.54
8.
0%
492.
52
31.7
%3,
230.
47
20
7.9%
8,94
1.63
575.
5%1,
553.
67
10
0.0%
Tax
refu
nds
due
from
Gov
ernm
ent -
Sal
es ta
x-
-
-
-
-
-
62.0
3
10
0.0%
-
3,00
2.86
--
-C
ash
and
bank
bal
ance
s 17
,272
.94
106.
6%8,
804.
87
54
.3%
16,0
04.8
8
98
.7%
10,0
78.5
5
62
.2%
9,05
8.20
55.9
%16
,209
.01
100.
0%39
,901
.37
83.4
%47
,465
.20
99.2
%51
,231
.55
107.
0%53
,323
.10
111.
4%53
,366
.44
111.
5%47
,867
.53
100.
0%
TO
TA
L A
SS
ET
S
48,0
62.6
5
93
.1%
52,7
76.1
5
10
2.2%
55,6
76.9
2
10
7.8%
57,1
14.4
3
11
0.6%
56,6
94.2
6
10
9.8%
51,6
39.1
2
10
0.0%
EQ
UIT
Y A
ND
LIA
BIL
ITIE
S
SH
AR
E C
AP
ITA
L A
ND
RE
SE
RV
ES
Sha
re c
apita
l 79
9.67
100.
0%79
9.67
10
0.0%
799.
67
100.
0%79
9.67
10
0.0%
799.
67
100.
0%79
9.67
10
0.0%
Res
erve
s29
,334
.04
155.
7%25
,793
.97
136.
9%25
,994
.04
138.
0%24
,490
.80
130.
0%23
,807
.51
126.
4%18
,838
.31
100.
0%
30,1
33.7
1
15
3.5%
26,5
93.6
4
13
5.4%
26,7
93.7
1
13
6.4%
25,2
90.4
7
12
8.8%
24,6
07.1
8
12
5.3%
19,6
37.9
8
10
0.0%
LIA
BIL
ITIE
S
NO
N-C
UR
RE
NT
LIA
BIL
ITIE
S
Ret
irem
ent b
enefi
t obl
igat
ions
594.
46
426.
2%38
0.86
27
3.0%
396.
00
283.
9%13
1.50
94
.3%
179.
86
128.
9%13
9.49
10
0.0%
Def
erre
d ta
xatio
n 17
1.56
-
--
--
--
-
47
.32
200.
51
48.9
1
CU
RR
EN
T L
IAB
ILIT
IES
Tr
ade
and
othe
r pa
yabl
es16
,433
.02
55
.0%
24,9
31.2
7
83
.4%
26,5
46.4
6
88
.8%
29,7
48.8
9
99
.5%
29,4
00.1
6
98
.4%
29,8
88.9
0
10
0.0%
Pro
visi
ons
112.
36
37.6
%24
6.19
82
.5%
411.
40
137.
8%39
8.91
13
3.6%
428.
68
143.
6%29
8.57
10
0.0%
Taxa
tion
- pr
ovis
ion
less
pay
men
ts61
7.54
36
.9%
624.
19
37.3
%1,
482.
03
88
.5%
1,34
4.15
80.3
%2,
029.
47
12
1.2%
1,67
4.18
100.
0%17
,162
.92
53.9
%25
,801
.65
81.0
%28
,439
.89
89.3
%31
,491
.95
98.8
%31
,858
.31
100.
0%31
,861
.65
100.
0%
TO
TA
L E
QU
ITY
AN
D L
IAB
ILIT
IES
48
,062
.65
93.1
%52
,776
.15
102.
2%55
,676
.92
107.
8%57
,114
.43
110.
6%56
,694
.26
109.
8%51
,639
.12
100.
0%
2011
2010
2015
2013
- R
esta
ted
2014
2012
46N
atio
nal R
efi n
ery
Lim
ited

47Annual Report 2015
VE
RT
ICA
L B
ALA
NC
E S
HE
ET
AS
AT
JUN
E, 3
0
Rup
ees
in
milli
on
% R
upee
s in
m
illion
%
Rup
ees
in
milli
on
Rup
ees
in
milli
on
Rup
ees
in
milli
on
Rup
ees
in
milli
on
%%
%%
AS
SE
TS
NO
N-C
UR
RE
NT
AS
SE
TS
Fixe
d as
sets
8,06
6.11
16
.7%
5,06
1.22
9.6%
4,36
2.94
7.7%
3,69
5.73
6.4%
3,23
4.79
5.7%
3,24
8.36
6.3%
Def
erre
d ta
xatio
n -
-
165.
34
0.3%
- --
--
--
--
-
--
-
-
432.
73
0.8%
Long
term
loan
s 42
.58
0.1%
41.4
9
0.
1%52
.24
0.1%
65.4
1
0.
1%62
.86
0.1%
60.0
6
0.1%
Long
term
dep
osits
30.1
9
0.
1%30
.19
0.1%
30.1
9
0.
1%30
.19
0.1%
30.1
7
0.
1%30
.44
0.1%
Ret
irem
ent b
enefi
t pre
paym
ents
22.4
0
0.
1%12
.71
0.0%
8,16
1.28
17.0
%5,
310.
95
10
.1%
4,44
5.37
8.0%
3,79
1.33
6.6%
3,32
7.82
5.9%
3,77
1.59
7.3%
CU
RR
EN
T A
SS
ET
S
Sto
res,
spa
res
and
chem
ical
s 1,
003.
10
2.1%
1,14
9.43
2.2%
788.
08
1.4%
986.
57
1.7%
887.
29
1.6%
904.
37
1.8%
Sto
ck-in
-tra
de
13,5
85.6
6
28
.3%
23,8
56.5
6
45
.2%
22,5
63.7
5
40
.4%
25,3
59.7
1
44
.3%
19,3
46.9
3
34
.1%
11,7
98.2
0
22
.9%
Trad
e de
bts
7,25
3.04
15.1
%10
,207
.07
19.3
%10
,976
.99
19.7
%13
,262
.18
23.2
%14
,100
.49
24.9
%16
,291
.70
31.6
%Lo
ans
and
adva
nces
74.6
0
0.
2%48
.43
0.1%
36.2
8
0.
1%40
.13
0.1%
23.9
6
0.
0%21
.43
0.0%
Trad
e de
posi
ts a
nd s
hort
-ter
m p
repa
ymen
ts
8.92
0.
0%53
.24
0.1%
8.22
0.
0%6.
67
0.0%
18.4
5
0.
0%16
.30
0.0%
Inte
rest
acc
rued
32.2
4
0.
1%40
.84
0.1%
86.1
2
0.
2%11
0.69
0.
2%57
.00
0.1%
69.2
3
0.
1%O
ther
rec
eiva
bles
54
7.33
1.
1%30
1.90
0.
6%27
4.71
0.
5%24
8.13
0.
4%93
2.49
1.
6%94
1.59
1.
8%12
3.54
0.
3%49
2.52
0.
9%3,
230.
47
5.
7%8,
941.
63
15
.8%
1,55
3.67
3.0%
Tax
refu
nds
due
from
Gov
ernm
ent -
Sal
es ta
x-
-
-
-
-
-
-
-
-
-
62.0
3
0.
1%S
hort
term
inve
stm
ent
3,00
2.86
5.7%
Cas
h an
d ba
nk b
alan
ces
17,2
72.9
4
35
.8%
8,80
4.87
16.7
%16
,004
.88
28.8
%10
,078
.55
17.8
%9,
058.
20
16
.0%
16,2
09.0
1
31
.4%
39,9
01.3
7
83
.0%
47,4
65.2
0
89
.9%
51,2
31.5
5
92
.0%
53,3
23.1
0
93
.4%
53,3
66.4
4
94
.1%
47,8
67.5
3
92
.7%
TO
TA
L A
SS
ET
S
48,0
62.6
5
10
0.0%
52,7
76.1
5
10
0.0%
55,6
76.9
2
10
0.0%
57,1
14.4
3
10
0.0%
56,6
94.2
6
10
0.0%
51,6
39.1
2
10
0.0%
EQ
UIT
Y A
ND
LIA
BIL
ITIE
S
SH
AR
E C
AP
ITA
L A
ND
RE
SE
RV
ES
Sha
re c
apita
l 79
9.67
1.
7%79
9.67
1.
5%79
9.67
1.
4%79
9.67
1.
4%79
9.67
1.
4%79
9.67
1.
6%
Res
erve
s29
,334
.04
61
.0%
25,7
93.9
7
48
.9%
25,9
94.0
4
46
.7%
24,4
90.8
0
42
.9%
23,8
07.5
1
42
.0%
18,8
38.3
1
36
.4%
30,1
33.7
1
62
.7%
26
,593
.64
50.4
%
26,7
93.7
1
48
.1%
25,2
90.4
7
44
.3%
24,6
07.1
8
43
.4%
19,6
37.9
8
38
.0%
LIA
BIL
ITIE
S
NO
N-C
UR
RE
NT
LIA
BIL
ITIE
S
Ret
irem
ent b
enefi
t obl
igat
ions
594.
46
1.2%
380.
86
0.7%
396.
00
0.7%
131.
50
0.2%
179.
86
0.3%
139.
49
0.3%
Def
erre
d ta
xatio
n 17
1.56
0.
4%-
-
47.3
2
0.
1%20
0.51
0.
4%48
.91
0.1%
-
-
CU
RR
EN
T L
IAB
ILIT
IES
Tr
ade
and
othe
r pa
yabl
es16
,433
.02
34
.2%
24,9
31.2
7
47
.2%
26,5
46.4
6
47
.7%
29,7
48.8
9
52
.0%
29,4
00.1
6
51
.8%
29,8
88.9
0
57
.9%
Pro
visi
ons
112.
36
0.2%
246.
19
0.5%
411.
40
0.7%
398.
91
0.7%
428.
68
0.8%
298.
57
0.6%
Taxa
tion
- pr
ovis
ion
less
pay
men
ts61
7.54
1.
3%62
4.19
1.
2%1,
482.
03
2.
7%1,
344.
15
2.
4%2,
029.
47
3.
6%1,
674.
18
3.
2%17
,162
.92
35.7
%
25,8
01.6
5
48
.9%
28
,439
.89
51.1
%31
,491
.95
55.1
%31
,858
.31
56.2
%31
,861
.65
61.7
%
TO
TA
L E
QU
ITY
AN
D L
IAB
ILIT
IES
48
,062
.65
100.
0%52
,776
.15
100.
0%55
,676
.92
100.
0%57
,114
.43
100.
0%56
,694
.26
100.
0%51
,639
.12
100.
0%
2012
2015
2014
2013
- R
esta
ted
2011
2010
47N
atio
nal R
efi n
ery
Lim
ited

48 National Refi nery Limited
HO
RIZ
ON
TAL
PR
OFI
T &
LO
SS
AC
CO
UN
TFO
R T
HE
YE
AR
EN
DE
D
Rup
ees
inm
illion
R
upee
s in
milli
on
Rup
ees
inm
illion
R
upee
s in
milli
on
Rup
ees
inm
illion
R
upee
s in
milli
on
%%
%%
%%
Net
sal
es
148,
456.
51
134.
7%20
7,40
3.26
18
8.2%
179,
184.
42
162.
6%17
4,79
7.07
15
8.6%
148,
558.
50
134.
8%11
0,18
6.38
10
0.0%
Cos
t of s
ales
(141
,610
.76)
13
6.4%
(204
,349
.84)
19
6.8%
(174
,117
.51)
16
7.7%
(170
,074
.58)
16
3.8%
(138
,551
.42)
13
3.4%
(103
,853
.57)
10
0.0%
Gro
ss p
rofi
t6,
845.
75
10
8.1%
3,05
3.42
48.2
%5,
066.
91
80
.0%
4,72
2.49
74.6
%10
,007
.08
158.
0%6,
332.
81
10
0.0%
Dis
trib
utio
n an
d m
arke
ting
expe
nses
(879
.12)
88
.3%
(1,0
90.2
9)
10
9.5%
(1,0
37.5
7)
10
4.2%
(1,2
64.0
3)
12
6.9%
(1,1
36.0
0)
11
4.0%
(996
.10)
10
0.0%
Adm
inis
trat
ive
expe
nses
(649
.03)
17
3.6%
(520
.72)
13
9.3%
(507
.51)
13
5.8%
(464
.10)
12
4.2%
(421
.00)
11
2.6%
(373
.78)
10
0.0%
Oth
er o
pera
ting
inco
me
1,52
5.32
119.
3%1,
436.
15
11
2.4%
2,17
9.74
170.
5%3,
136.
82
24
5.4%
2,49
7.58
195.
4%1,
278.
11
10
0.0%
Oth
er o
pera
ting
expe
nses
(430
.00)
10
5.0%
(146
.60)
35
.8%
(354
.52)
86
.5%
(336
.45)
82
.1%
(768
.58)
18
7.6%
(409
.66)
10
0.0%
Op
erat
ing
pro
fit
6,41
2.91
110.
0%2,
731.
95
46
.9%
5,34
7.05
91.7
%5,
794.
73
99
.4%
10,1
79.0
8
17
4.6%
5,83
1.38
100.
0%
Fina
nce
cost
(852
.69)
12
2.6%
(852
.32)
12
2.5%
(870
.54)
12
5.1%
(1,3
42.8
6)
19
3.0%
(150
.47)
21
.6%
(695
.76)
10
0.0%
Pro
fit
bef
ore
tax
atio
n 5,
560.
22
10
8.3%
1,87
9.63
36.6
%4,
476.
51
87
.2%
4,45
1.87
86.7
%10
,028
.61
195.
3%5,
135.
62
10
0.0%
Taxa
tion
(1,8
51.2
4)
10
0.0%
(917
.77)
49
.6%
(1,6
30.8
6)
88
.1%
(1,8
33.4
9)
99
.1%
(3,4
60.0
8)
18
7.0%
(1,8
50.8
1)
10
0.0%
Pro
fit
afte
r ta
xati
on
3,70
8.98
112.
9%96
1.87
29
.3%
2,84
5.65
86.6
%2,
618.
38
79
.7%
6,56
8.53
200.
0%3,
284.
81
10
0.0%
2012
2011
2010
2015
2014
2013
48N
atio
nal R
efi n
ery
Lim
ited

49Annual Report 2015
VE
RT
ICA
L P
RO
FIT
& L
OS
S A
CC
OU
NT
FOR
TH
E Y
EA
R E
ND
ED
Net
sal
es
Cos
t of s
ales
Gro
ss p
rofi
t
Dis
trib
utio
n an
d m
arke
ting
expe
nses
Adm
inis
trat
ive
expe
nses
Oth
er o
pera
ting
inco
me
Oth
er o
pera
ting
expe
nses
Op
erat
ing
pro
fit
Fina
nce
cost
Pro
fit
bef
ore
tax
atio
n
Taxa
tion
Pro
fit
afte
r ta
xati
on
Rup
ees
in
milli
on
% R
upee
s in
m
illion
R
upee
s in
m
illion
R
upee
s in
m
illion
R
upee
s in
m
illion
R
upee
s in
m
illion
%
%%
%%
148,
456.
51
100.
0%20
7,40
3.26
10
0.0%
179,
184.
42
100.
0%17
4,79
7.07
10
0.0%
148,
558.
50
100.
0%11
0,18
6.38
10
0.0%
(141
,610
.76)
-9
5.4%
(204
,349
.84)
-9
8.5%
(174
,117
.51)
-9
7.2%
(170
,074
.58)
-9
7.3%
(138
,551
.42)
-9
3.3%
(103
,853
.57)
-9
4.3%
6,84
5.75
4.6%
3,05
3.42
1.5%
5,06
6.91
2.8%
4,72
2.49
2.7%
10,0
07.0
8
6.
7%6,
332.
81
5.
7%
(879
.12)
-0
.6%
(1,0
90.2
9)
-0
.5%
(1,0
37.5
7)
-0
.6%
(1,2
64.0
3)
-0
.7%
(1,1
36.0
0)
-0
.8%
(996
.10)
-0
.9%
(649
.03)
-0
.4%
(520
.72)
-0
.3%
(507
.51)
-0
.3%
(464
.10)
-0
.3%
(421
.00)
-0
.3%
(373
.78)
-0
.3%
1,52
5.32
1.0%
1,43
6.15
0.7%
2,17
9.74
1.3%
3,13
6.82
1.8%
2,49
7.58
1.7%
1,27
8.11
1.2%
(430
.00)
-0
.3%
(146
.60)
-0
.1%
(354
.52)
-0
.2%
(336
.45)
-0
.2%
(768
.58)
-0
.5%
(409
.66)
-0
.4%
6,41
2.91
4.3%
2,73
1.96
1.3%
5,34
7.05
3.0%
5,79
4.73
3.3%
10,1
79.0
8
6.
8%5,
831.
38
5.
3%
(852
.69)
-0
.5%
(852
.32)
-0
.4%
(870
.54)
-0
.5%
(1,3
42.8
6)
-0
.8%
(150
.47)
-0
.1%
(695
.76)
-0
.6%
5,56
0.22
3.8%
1,87
9.64
0.9%
4,47
6.51
2.5%
4,45
1.87
2.5%
10,0
28.6
1
6.
7%5,
135.
62
4.
7%
(1,8
51.2
4)
-1
.3%
(917
.77)
-0
.4%
(1,6
30.8
6)
-0
.9%
(1,8
33.4
9)
-1
.0%
(3,4
60.0
8)
-2
.3%
(1,8
50.8
1)
-1
.7%
3,70
8.98
2.5%
961.
87
0.5%
2,84
5.65
1.6%
2,61
8.38
1.6%
6,56
8.53
4.4%
3,28
4.81
3.0%
2010
2015
2014
2013
2012
2011
49N
atio
nal R
efi n
ery
Lim
ited

50 National Refi nery Limited
GRAPHICAL REPRESENTATION
Total Net SalesRs. in million
Profi t after TaxRs. in million
Earning per shareRs. per share
Dividend per shareRs. per share
Gross profi t percentage%
Net profi t percentage%

51Annual Report 2015
GRAPHICAL REPRESENTATION
ReservesRs. in million
Break-up value per shareRs. per share
Return on equity%
Current Ratio
ThroughputM. Tons
Crude Oil and Product InventoriesM. Tons

52 National Refi nery Limited
GRAPHICAL REPRESENTATION
Balance Sheet Composition
Assets
As at June 30, 2014
As at June 30, 2014
2013-14 2014-15
As at June 30, 2015
As at June 30, 2015
Share Capital, Reserves and Liabilities
Composition of Local and Export Sales

53Annual Report 2015
ANNUAL AUDITEDFINANCIAL STATEMENTS
FOR THE YEAR JUNE 30, 2015

54 National Refi nery Limited

55Annual Report 2015

56 National Refi nery Limited
BALANCE SHEETAS AT JUNE 30, 2015
Note 20142015
ASSETS
NON-CURRENT ASSETSFixed assets 3 8,066,114 5,061,222 Long term investment 4 - - Long term loans 5 42,575 41,486 Long term deposits 6 30,189 30,189 Retirement benefit prepayments 17 22,399 12,711 Deferred taxation 18 - 165,344
8,161,277 5,310,952 CURRENT ASSETS
Stores, spares and chemicals 7 1,003,102 1,149,428 Stock-in-trade 8 13,585,660 23,856,560 Trade debts 9 7,253,035 10,207,068 Loans and advances 10 74,602 48,432 Trade deposits and short-term prepayments 11 8,921 53,237 Interest accrued 32,240 40,843 Other receivables 12 547,326 301,904 Short term investments 13 123,543 3,002,863 Cash and bank balances 14 17,272,944 8,804,865
39,901,373 47,465,200
TOTAL ASSETS 48,062,650 52,776,152
EQUITY AND LIABILITIES
SHARE CAPITAL AND RESERVES
Share capital 15 799,666 799,666
Reserves 16 29,334,041 25,793,973 30,133,707 26,593,639
LIABILITIES
NON-CURRENT LIABILITIES
Retirement benefit obligations 17 594,464 380,867 Deferred taxation 18 171,555 -
766,019 380,867
CURRENT LIABILITIES
Trade and other payables 19 16,433,021 24,931,269 Provisions 20 112,361 246,187 Taxation - provision less payments 617,542 624,190
17,162,924 25,801,646
TOTAL LIABILITIES 17,928,943 26,182,513
CONTINGENCIES AND COMMITMENTS 21
TOTAL EQUITY AND LIABILITIES 48,062,650 52,776,152
(Rupees in thousand)
The annexed notes 1 to 43 form an integral part of these fi nancial statements.
Chief Executive Director

57Annual Report 2015
PROFIT & LOSS ACCOUNTNote 2015 2014
(Rupees in thousand)
Gross sales 22 188,935,328 249,769,259
Trade discounts, taxes, duties, levies and price differential 23 (40,478,819) (42,366,001)
Net sales 148,456,509 207,403,258
Cost of sales 24 (141,610,755) (204,349,836)
Gross profit 6,845,754 3,053,422
Distribution and marketing expenses 25 (879,124) (1,090,296)
Administrative expenses 26 (649,030) (520,716)
Other income 27 1,525,316 1,436,152
Other operating expenses 28 (430,002) (146,597)
Operating profit 6,412,914 2,731,965
Finance cost 29 (852,694) (852,319)
Profit before taxation 5,560,220 1,879,646
Taxation 30 (1,851,240) (917,771)
Profit after taxation 3,708,980 961,875
Earnings per share - basic and diluted 31 46.38 12.03
(Rupees)
The annexed notes 1 to 43 form an integral part of these fi nancial statements.
Chief Executive Director
FOR THE YEAR ENDED JUNE 30, 2015

58 National Refi nery Limited
STATEMENT OF COMPREHENSIVE INCOME
NATIONAL REFINERY LIMITED
STATEMENT OF COMPREHENSIVE INCOME FOR THE YEAR ENDED JUNE 30, 2015
2015 2014
Profit after taxation 3,708,980 961,875
Other comprehensive income
Items that will not be reclassified
to Profit and Loss
Remeasurements of post employment
benefit obligations - note 17 (163,301) 56,318
Deferred tax thereon (5,611) (18,760)
(168,912) 37,558
Total comprehensive income 3,540,068 999,433
(Rupees in thousand)
The annexed notes 1 to 43 form an integral part of these financial statements.
Chief Executive Director
Chief Executive Director
FOR THE YEAR ENDED JUNE 30, 2015

59Annual Report 2015
CASH FLOW STATEMENT
Note 2015 2014
CASH FLOWS FROM OPERATING ACTIVITIES
Cash generated / (used in) from operations 32 9,431,735 (1,216,724)
Income tax paid (1,526,600) (2,007,030)
(Increase) / decrease in long term loans and advances (1,089) 10,756
Payment made to staff retirement benefit funds (82,810) (102,058)
Net cash flow from / (used in) operating activities 7,821,236 (3,315,056)
CASH FLOWS FROM INVESTING ACTIVITIES
Purchase of property, plant and equipment (3,315,468) (1,025,917)
Purchase of intangible assets (35,627) (100)
Proceeds from disposal of property, plant and equipment 4,847 4,131
Return on investments and bank accounts 1,117,499 842,166
Net cash flow used in investing activities (2,228,749) (179,720)
CASH FLOWS FROM FINANCING ACTIVITIES
Dividend paid (1,224) (1,194,855)
Net increase / (decrease) in cash and cash equivalents 5,591,263 (4,689,631)
Cash and cash equivalents at beginning of the year 11,804,769 16,494,400
Cash and cash equivalents at end of the year 33 17,396,032 11,804,769
(Rupees in thousand)
The annexed notes 1 to 43 form an integral part of these fi nancial statements.
Chief Executive Director
FOR THE YEAR ENDED JUNE 30, 2015

60 National Refi nery Limited
STATEMENT OF CHANGES IN EQUITY
SHARECAPITAL Special Total Issued, Capital Exchange General Unappropriated reserve
subscribed compensation equalisation reserve profit (note 16.2)and paid-up reserve reserve
(note 16.1)
Balance as at July 1, 2013 799,666 10,142 4,117 19,461,000 2,745,679 3,773,100 26,793,704
Total comprehensive income for the year ended June 30, 2014
- Profit for the year ended June 30, 2014 - - - - 961,875 - 961,875
- Other comprehensive income for the year ended June 30, 2014 - - - - 37,558 - 37,558
- - - - 999,433 - 999,433
Transfer to general reserve - - - 1,600,000 (1,600,000) - -
Final dividend for the year ended June 30, 2013- Rs. 15 per share - - - - (1,199,498) - (1,199,498)
Balance as at June 30, 2014 799,666 10,142 4,117 21,061,000 945,614 3,773,100 26,593,639
Total comprehensive income for the year ended June 30, 201 5
- Profit for the year ended June 30, 2015 - - - - 3,708,980 - 3,708,980
- Other comprehensive income / (loss) for the year ended June 30, 2015 - - - - (168,912) - (168,912)
- - - - 3,540,068 - 3,540,068
Balance as at June 30, 2015 799,666 10,142 4,117 21,061,000 4,485,682 3,773,100 30,133,707
REVENUE RESERVES
(Rupees in thousand)
CAPITAL RESERVES
The annexed notes 1 to 43 form an integral part of these fi nancial statements.
Chief Executive Director
FOR THE YEAR ENDED JUNE 30, 2015

61Annual Report 2015
NOTES TO AND FORMING PART OF THE FINANCIAL STATEMENTS
1. LEGAL STATUS AND OPERATIONS
2. SUMMARY OF SIGNIFICANT ACCOUNTING POLICIES
2.1 Basis of preparation
2.2 Critical accounting estimates and judgments
National Refinery Limited was incorporated in Pakistan on August 19, 1963 as apublic limited company and its shares are listed on the Karachi, Lahore andIslamabad Stock Exchanges in Pakistan. The registered office of the Company issituated at 7-B, Korangi Industrial Area, Karachi, Pakistan.
The Company is engaged in the manufacturing, production and sale of largerange of petroleum products. The refinery complex of the Company comprises ofthree refineries, consisting of two lube refineries, commissioned in 1966 and1985, and a fuel refinery added to the complex in 1977.
These financial statements have been prepared in accordance with approvedaccounting standards as applicable in Pakistan. Approved accounting standardscomprise of such International Financial Reporting Standards (IFRS) issued bythe International Accounting Standards Board (IASB) as are notified under theCompanies Ordinance, 1984, provisions of and directives issued under theCompanies Ordinance, 1984. In case requirements differ, the provisions ordirectives of the Companies Ordinance, 1984 shall prevail.
The preparation of financial statements in conformity with approved accountingstandards requires the use of certain critical accounting estimates. It alsorequires management to exercise its judgment in the process of applying theCompany's accounting policies.
The principal accounting policies applied in the preparation of these financialstatements are set out below. These policies have been consistently applied toall the years presented.
During the year, the Company has executed contracts for Diesel De-sulphurisation and Naphtha Isomerisation as part of upgradation and expansionof fuel refinery operations. The estimated project cost is US$ 349 million(Rs. 35.49 billion) whereas these projects are expected to be completed in twentythree months. The arrangement for the funding of the project is disclosed in note 34.3.
FOR THE YEAR ENDED JUNE 30, 2015
62 National Refi nery Limited
i. Taxation
ii. Post employment benefits
2.3 Changes in accounting standards, interpretations and pronouncements
(a)
(b)
The areas involving a higher degree of judgment or complexity, or areas whereassumptions and estimates are significant to the financial statements are asfollows:
Standards, interpretations and amendments to published approved accountingstandards that are effective but not relevant
Estimates and judgments are continually evaluated and are based on historicalexperience and other factors, including expectations of future events that arebelieved to be reasonable under the circumstances.
No critical judgment has been used in applying the accounting policies.
Management believes that the change in outcome of estimates would not have amaterial impact on the amounts disclosed in the financial statements.
Standards, interpretations and amendments to published approved accountingstandards that are effective and relevant
IFRIC 21, "Levies" a new interpretation is applicable for the Company for the firsttime for the financial year beginning on July 1, 2014, sets out the accounting foran obligation to pay a levy that is not income tax. The interpretation addresseswhat the obligating event is that gives rise to pay a levy and when should aliability be recognised. The Company is not currently subject to significant leviestherefore the impact on the Company is not material.
The Company recognises provision for income tax based on best currentestimates. However, where the final tax outcome is different from theamounts that were initially recorded, such differences impact the incometax provision in the period in which such determination is made.
The new standards, amendments and interpretations that are mandatory foraccounting periods beginning on or after July 1, 2014 are considered not to berelevant for Company's financial statements and hence have not been detailedhere.
Significant estimates relating to post employment benefits are disclosed innote 17.
FOR THE YEAR ENDED JUNE 30, 2015
NOTES TO AND FORMING PART OF THE FINANCIAL STATEMENTS

63Annual Report 2015
(c)
-
-
-
2.4 Overall Valuation Policy
2.5 Property, plant and equipment
IFRS 10, 'Consolidated financial statement' replaces all of the guidance oncontrol and consolidation in IAS 27, 'Consolidation and separate financialstatement', and SIC-12,'Consolidation - special purpose entities'. IAS 27 isrenamed 'Separate financial statement', it continue to be a standard dealingsolely with separate financial statements. IFRS 10 has the potential toaffect all reporting entities (investors) that control one or more investeesunder the revised definition of control. The standard presently does notimpact financial statements of the Company.
IFRS 12, 'Disclosures of interests in other entities' includes the disclosurerequirements for all forms of interests in other entities, including jointarrangement, associates, structured entities and other off balance sheetvehicles. The standard will affect the disclosures in the financial statementsof the Company.
IFRS 13, 'Fair value measurement', aims to improve consistency andreduce complexity by providing a precise definition of fair value and a single source of fair value measurement and disclosure requirement for useacross IFRSs. The requirement do not extend the use of fair valueaccounting but provide guidance on how it should be applied where its useis already required or permitted by other standards within IFRSs. Thestandard will affect the determination of fair value and its relateddisclosures in the financial statements of the Company.
These financial statements have been prepared under the historical costconvention except as otherwise disclosed in the respective accounting policiesnotes.
The following are the new standards, amendments to existing approvedaccounting standards and new interpretations that will be effective for the periodsbeginning January 1, 2015 that may have an impact on the financial statementsof the Company.
Standards, interpretations and amendments to published approvedstandards that are not yet effective but relevant
Major spare parts and stand-by equipment which qualify as property, plant andequipment when an entity expects to use them during more than one year.Transfers are made to relevant operating assets category as and when suchitems are available for use.
These are initially recognised at cost and are subsequently carried at cost lessaccumulated depreciation and impairment, if any, except major spare parts andstand-by equipments which are stated at cost less accumulated impairment, ifany, and capital work-in-progress, which are stated at cost.
accounting
FOR THE YEAR ENDED JUNE 30, 2015
NOTES TO AND FORMING PART OF THE FINANCIAL STATEMENTS

64 National Refi nery Limited
2.6 Intangible assets
Capital work-in-progress consists of expenditure incurred and advances made inrespect of tangible and intangible assets in the course of their construction andinstallation. Transfers are made to relevant operating assets category as andwhen assets are available for use.
The carrying value of intangible assets are reviewed for impairment when eventsor changes in circumstances indicate that the carrying value may not berecoverable. If any such indication exists and where the carrying value exceedthe estimated recoverable amount, the assets are written down to theirrecoverable amount.
Gains and losses on disposal or retirement of property, plant and equipment arerecognised in income currently.
Costs that are directly associated with identifiable software and have probableeconomic benefits exceeding the cost beyond one year, are recognised asintangible asset. Direct costs include the purchase cost of software,implementation cost and related overhead cost.
Maintenance and normal repairs are charged to income as and when incurred.Major renewals and improvements are capitalised and the assets so replaced, ifany, are retired.
Intangible assets are amortised using the straight-line method over a period ofthree years or license period, whichever is shorter.
Depreciation is charged to income using the straight-line method whereby thecost of an asset is written off over its estimated useful life at the rates stated innote 3.1 to the financial statements. Depreciation on additions is charged fromthe month in which the asset is put to use and on disposals up to the monthimmediately preceding the disposal. Assets’ residual values and useful lives arereviewed, and adjusted if appropriate, at each balance sheet date.
The carrying value of operating assets are reviewed for impairment when eventsor changes in circumstances indicate that the carrying value may not berecoverable. If any such indication exists and where the carrying values exceedthe estimated recoverable amount, the assets are written down to theirrecoverable amount.
An intangible asset is recognised if it is probable that future economic benefitsattributable to the asset will flow to the Company and that the cost of such assetcan be measured reliably. These are stated at cost less accumulatedamortisation and impairment, if any.
FOR THE YEAR ENDED JUNE 30, 2015
NOTES TO AND FORMING PART OF THE FINANCIAL STATEMENTS

65Annual Report 2015
2.7 Investments
2.8 Stores, spares and chemicals
2.9 Stock-in-trade
The Company determines the appropriate classification of its investment at thetime of purchase.
Net realisable value signifies the estimated selling price in the ordinary course ofbusiness less costs necessarily to be incurred to make the sale .
Stocks of semi-finished and finished products are valued at lower of cost,determined on a FIFO basis and net realisable value. Cost in relation to semi-finished and finished products represents cost of crude oil and an appropriateportion of manufacturing overheads.
Investments classified as investments at fair value through profit or loss areinitially measured at cost being fair value of consideration given. At subsequentdates these investments are measured at fair value with any resulting gains orloses recognised directly in the profit and loss account. The fair value of suchinvestments is determined on the basis of prevailing market prices. In the case ofinvestments in open ended mutual funds, fair value is determined on the basis ofperiod end Net Asset Value (NAV) as announced by the Asset ManagementCompany.
Available for sale investments in unlisted securities whose fair value can not bereliably measured are carried at cost less impairment, if any.
Investment in securities which are intended to be held for an undefined period oftime are classified as available for sale. These are initially measured at fair valueincluding the transaction costs. Subsequent measurement of investments whosefair value can be reliably measured is stated at fair value with gains or lossestaken to other comprehensive income.
Stock of crude oil is valued at lower of cost, determined on aFirst-In-First-Out (FIFO) basis and net realisable value. Crude oil in transitis valued at cost comprising invoice value plus other charges incurred thereon.
Items in transit are valued at cost comprising invoice value plus other chargesincurred thereon.
Investments with fixed payments and maturity that the Company has positiveintent and ability to hold till maturity are classified as held-to-maturityinvestments. These are measured at amortised cost using effective interestmethod.
Impairment, if any is charged to profit and loss account.
Stores, spares and chemicals, except items in transit, are stated at movingaverage cost. Cost comprises invoice value and other direct costs. Provision ismade for slow moving and obsolete items wherever necessary.
FOR THE YEAR ENDED JUNE 30, 2015
NOTES TO AND FORMING PART OF THE FINANCIAL STATEMENTS

66 National Refi nery Limited
2.10 Trade debts and other receivables
2.11 Cash and cash equivalents
2.12 Staff retirement benefits
2.12.1 Defined contribution plan
2.12.2 Defined benefit plans
The Company operates various post-employment schemes, including bothdefined benefit and defined contribution plans.
Defined benefit plans define an amount of pension or gratuity or medical benefitthat an employee will receive on or after retirement, usually dependent on one ormore factors such as age, years of service and compensation. A defined benefitplan is a plan that is not a defined contribution plan. The liability recognised in thebalance sheet in respect of defined benefit plans is the present value of thedefined benefit obligation at the end of the reporting period less the fair value ofplan assets. The defined benefit obligation is calculated annually by independentactuary using the projected unit credit method.
The present value of the defined benefit obligation is determined by discountingthe estimated future cash outflows using interest rates of high-quality corporatebonds or the market rates on government bond. These are denominated in thecurrency in which the benefits will be paid, and that have terms to maturityapproximating to the terms of the related benefit obligation.
The Company operates an approved contributory provident fund for allemployees. Equal monthly contributions are made, both by the Company and theemployees, to the fund at the rate of 10% per annum of the basic salary. TheCompany has no legal or constructive obligations to pay further contributions ifthe fund does not hold sufficient assets to pay all employees the benefits relatingto employee service in the current and prior periods. The contributions arerecognised as employee benefit expense when they are due.
Cash and cash equivalents are carried in the balance sheet at cost. For thepurposes of the cash flow statement, cash and cash equivalents comprise cash inhand, balances with banks on current, savings and deposit accounts, short-terminvestments and loans & receivables with original maturities of three months orless, running finance under mark-up arrangements and short-term finance.
Trade debts and other receivables are carried at invoice value less a provision forimpairment. A provision for impairment is established when there is objectiveevidence that the Company will not be able to collect all amounts due accordingto the original terms of receivables. Trade debts and other receivablesconsidered irrecoverable are written-off.
FOR THE YEAR ENDED JUNE 30, 2015
NOTES TO AND FORMING PART OF THE FINANCIAL STATEMENTS

67Annual Report 2015
The Company operates the following schemes:
i)
ii)
iii)
iv)
2.13 Compensated absences
2.14 Trade and other payables
The Company accounts for compensated absences on the basis of unavailedleave balance of each employee at the end of the year.
The amount arising as a result of remeasurements are recognised in the balancesheet immediately, with a charge or credit to other comprehensive income in theperiods in which they occur.
Past-service costs are recognised immediately in income.
Funded gratuity scheme for non-management permanent employees of theCompany. Provision is made annually to cover obligations under thescheme, as per actuarial valuation. The most recent valuation of thescheme was carried out as at June 30, 2015, using the ‘Projected UnitCredit Method’.
Trade and other payables are carried at fair value of the consideration to be paidfor goods and services.
Provisions are made to cover the obligations under the scheme on the basis ofactuarial valuation and are charged to income. The most recent valuation wascarried out as at June 30, 2015 using the 'Projected Unit Credit Method'.
Funded medical scheme for its management employees who joined theCompany prior to 1 September 2006. Provision is made annually to coverobligations under the scheme, by way of a charge to income, calculated inaccordance with the actuarial valuation. The most recent valuation of thescheme was carried out as at June 30, 2015, using the ‘Projected UnitCredit Method’.
Funded pension scheme for permanent, regular and full time managerialand supervisory staff of the Company who joined prior to January 01, 2012.Contributions are made to the fund on the basis of actuarial valuation andare charged to income. The most recent valuation of the scheme wascarried out as at June 30, 2015, using the ‘Projected Unit Credit Method’.
Funded gratuity scheme for management employees of the Companyjoining on or after January 1, 2012. Provision is made annually to coverobligations under the scheme, as per actuarial valuation. The most recentvaluation of the scheme was carried out as at June 30, 2015, using the‘Projected Unit Credit Method’.
FOR THE YEAR ENDED JUNE 30, 2015
NOTES TO AND FORMING PART OF THE FINANCIAL STATEMENTS

68 National Refi nery Limited
2.15 Provisions
2.16 Taxation2.16.1 Current
2.16.2 Deferred
2.17 Revenue recognition
a)
b) Export sales are recorded on the basis of products delivered to tankers. c)
d)
e)
f)
Revenue is recognised to the extent that it is probable that the economic benefitswill flow to the Company and the revenue can be reliably measured. Revenue isrecognised as follows:
The charge for current taxation is based on the taxable income for the year,determined in accordance with the prevailing law for taxation on income, usingprevailing tax rates after taking into account tax credits and rebates available, ifany.
Provisions are recognised when the Company has a legal or constructiveobligation as a result of past events, and it is probable that an outflow ofresources embodying economic benefits will be required to settle the obligationand a reliable estimate can be made of the amount of the obligation. Provisionsare reviewed at each balance sheet date and adjusted to reflect the current bestestimates.
Deferred tax is accounted for using the liability method on all temporarydifferences arising between tax base of assets and liabilities and their carryingamounts in the financial statements. Deferred tax liability is generally recognisedfor all taxable temporary differences and deferred tax asset is recognised to theextent that it is probable that future taxable profits will be available against whichthe deductible temporary differences, unused tax losses and tax credits can beutilised. Deferred tax is charged or credited in the profit and loss account.Deferred income tax is determined using tax rates and prevailing law for taxationon income that have been enacted or substantively enacted by the balance sheetdate and are expected to apply when the related deferred income tax asset isrealised or the deferred income tax liability is settled.
Return / interest on bank deposits and advances to employees areon accrual basis.
Handling and storage income, pipelines charges, scrap sales, insurancecommission and rental income are recognised on accrual basis.
Dividend income is recognised as income when the right of receipt isestablished.
Return / interest on short term investments is recognised using the effectiveinterest method.
Local sales of products delivered through pipelines are recorded whenproducts passes through pipelines’ flange. Sale of products loaded throughgantry is recognised when products are loaded into tank lorries.
recognised
FOR THE YEAR ENDED JUNE 30, 2015
NOTES TO AND FORMING PART OF THE FINANCIAL STATEMENTS

69Annual Report 2015
2.18 Borrowings and their cost
2.19 Foreign currency transactions and translation
2.20 Financial assets and liabilities
2.21 Segment reporting
2.22 Dividends and appropriation to general reserve
Borrowings are recognised initially at fair value, net of transaction cost incurred.
The financial statements are presented in Pak Rupees which is the Company’sfunctional and presentation currency.
Transactions in foreign currencies are converted into Pak Rupees using theexchange rates prevailing on the dates of the transactions. All monetary assetsand liabilities denominated in foreign currencies are translated into PakistanRupees using the exchange rates prevailing on the balance sheet date.Exchange differences are taken to income currently.
All financial assets and liabilities are initially measured at cost, which is the fairvalue of the consideration given and received respectively. These financialassets and liabilities are subsequently measured at fair value, amortised cost orcost, as the case may be.
A financial asset and a financial liability is offset and the net amount is reportedin the balance sheet if the Company has a legally enforceable right to set-off therecognised amount and intends either to settle on a net basis or to realise theasset and settle the liability simultaneously.
Operating segments are reported in a manner consistent with the internalreporting provided to the chief operating decision-maker. The chief operatingdecision-maker, who is responsible for allocating resources and assessingperformance of the operating segments, has been identified as Chief ExecutiveOfficer of the Company.
Dividends and appropriation to general reserves are recognised in the financialstatements in the period in which these are approved.
Borrowing costs are recognised as an expense in the period in which these areincurred except where such costs are directly attributable to the acquisition,construction or production of a qualifying asset in which case such costs arecapitalised as part of the cost of that asset.
FOR THE YEAR ENDED JUNE 30, 2015
NOTES TO AND FORMING PART OF THE FINANCIAL STATEMENTS

70 National Refi nery Limited
3.2015 2014
FIXED ASSETS
3.1 Operating assets
Property, plant and equipment
- Operating assets - note 3.1 2,834,463 2,878,179 - Major spare parts and stand-by
equipments - note 3.2 199,244 164,123 - Capital work-in-progress - note 3.3 5,007,238 2,017,277
8,040,945 5,059,579
Intangible assets - note 3.4 25,169 1,643
8,066,114 5,061,222
(Rupees in thousand)
Year ended June 30, 2015Opening net book value 46,025 176,538 350,229 1,108,200 32,737 160,909 572,938 16,336 5,274 9,298 399,695 2,878,179
Reclassification
Cost - 1,118 (671,304) 364,029 - 120,072 1,658 - - - 184,427 -
Depreciation - (482) 321,075 (180,178) - (77,492) (1,048) - - - (61,875) -
- 636 (350,229) 183,851 - 42,580 610 - - - 122,552 - Additions including
transfers - note 3.1.2 - 7,287 - 138,425 34,510 4,120 19,736 9,730 568 5,187 78,570 298,133
Disposals
Cost - - - (581) - - - (8,366) - (56) (1,266) (10,269)
Depreciation - - - 581 - - - 3,976 - 56 1,262 5,875
- - - - - - - (4,390) - - (4) (4,394) Written off
Cost - (3,756) - (13,867) - (831) (22,782) - (35) (14,928) (2,023) (58,222)
Depreciation - 3,559 - 13,651 - 831 22,637 - 33 14,928 1,276 56,915
- (197) - (216) - - (145) - (2) - (747) (1,307)
Depreciation charge (596) (15,718) - (150,663) (24,687) (29,374) (53,219) (3,362) (890) (4,221) (53,418) (336,148)
Closing net book value 45,429 168,546 - 1,279,597 42,560 178,235 539,920 18,314 4,950 10,264 546,648 2,834,463
As at June 30, 2015Cost 60,035 431,375 - 5,626,841 793,837 542,842 1,475,316 79,881 14,000 52,301 961,178 10,037,606
Accumulated depreciation (14,606) (262,829) - (4,347,244) (751,277) (364,607) (935,396) (61,567) (9,050) (42,037) (414,530) (7,203,143)
Net book value 45,429 168,546 - 1,279,597 42,560 178,235 539,920 18,314 4,950 10,264 546,648 2,834,463
Year ended June 30, 2014
Opening net book value 46,625 178,080 377,978 1,227,299 70,599 178,159 470,514 14,639 5,228 8,845 399,717 2,977,683 Additions including
transfers - note 3.1.2 - 13,766 4,092 4,732 574 7,517 146,518 6,112 860 6,343 36,754 227,268 Disposals
Cost - - - - - - (1,067) (7,237) - - (84) (8,388)
Depreciation - - - - - - 1,067 6,093 - - 84 7,244
- - - - - - - (1,144) - - - (1,144)
Depreciation charge (600) (15,308) (31,841) (123,831) (38,436) (24,767) (44,094) (3,271) (814) (5,890) (36,776) (325,628)
Closing net book value 46,025 176,538 350,229 1,108,200 32,737 160,909 572,938 16,336 5,274 9,298 399,695 2,878,179
As at June 30, 2014
Cost 60,035 426,726 671,304 5,138,835 759,327 419,481 1,476,704 78,517 13,467 62,098 701,470 9,807,964 Accumulated depreciation (14,010) (250,188) (321,075) (4,030,635) (726,590) (258,572) (903,766) (62,181) (8,193) (52,800) (301,775) (6,929,785)
Net book value 46,025 176,538 350,229 1,108,200 32,737 160,909 572,938 16,336 5,274 9,298 399,695 2,878,179
Annual Rate of
Depreciation % 1 5 & 20 5 to 20 5 to 33.33 7 to 33.33 5 to 8 5 to 33.33 20 7.5 to 33.33 10 to 33.33 5 to 33.33
Leasehold land
(note 3.1.1)
Buildings
on leasehold
land
Oil terminal
Processing plant and storage tanks
Furniture and
fixtures
Computers and other
related accessories
Office and other
equipments
Total
(Rupees in thousand)
Power generation
plant
Pipelines Water, power and
other utilities
Vehicles
FOR THE YEAR ENDED JUNE 30, 2015
NOTES TO AND FORMING PART OF THE FINANCIAL STATEMENTS

71Annual Report 2015
3.1.1
• Pak-Hy Oils (Private) Limited
• Chevron Pakistan Limited
• Pakistan State Oil Company Limited
• PERAC Research & Development Foundation
• Petroleum Packages (Private) Limited
• Anoud Power Generation Limited
• Pakistan Oilfields Limited
• Attock Petroleum Limited
The carrying value of each of the above is immaterial.
3.1.2
2015 2014
Buildings on leasehold land 4,962 13,766
Processing plant and storage tanks 142,956 4,732
Pipelines 4,120 7,517
Water, power and other utilities 6,819 146,518
Power generation plant 34,510 -
Office and other equipments 50,929 17,361
Intangibles 33,447 -
277,743 189,894
(Rupees in thousand)
During the year, the following amounts have been transferred fromcapital work-in-progress (note 3.3) to operating assets (note 3.1) and intangibleassets (note 3.4):
Leasehold land includes land subleased / licensed to the following lessees /licensees:
FOR THE YEAR ENDED JUNE 30, 2015
NOTES TO AND FORMING PART OF THE FINANCIAL STATEMENTS

72 National Refi nery Limited
3.1.3
2015 2014
3.2 MAJOR SPARE PARTS AND STAND-BYEQUIPMENTS
Gross carrying value
Balance at beginning of the year 289,388 275,062
Additions during the year 171,839 206,064
Transfers made during the year (144,465) (191,738)
Balance at end of the year 316,762 289,388
Provision for impairment - note 3.2.1 (117,518) (125,265)
Net carrying value 199,244 164,123
3.2.1
(Rupees in thousand)
During the year net reversal of provision amounting to Rs. 7.75 million(2014: Rs. 0.60 million) has been made.
The details of property, plant and equipment disposed of during the year are asfollows:
Cost Net Sales Mode of Particulars of book value proceeds disposal buyer
Vehicle 1,512 271 1,241 967 Company Policy Mr. Zaman Bhatti - Executive
" 1,432 419 1,013 733 " Mr. Khawaja Zafar Jawed - Executive
" 1,393 765 628 692 " Mr. M. Fahim Siddiqui - Executive
" 1,393 749 644 571 " Mr. Meraj Ahmed Khawaja - Executive
" 1,318 886 432 432 " Mr. Anwar Ahmed Sheikh - Executive
" 1,318 886 432 432 " Mr. Shakil Ahmed Asif - Executive
Written down value below Rs. 50,000 each
Processing plant andstorage tanks 581 581 - 751
Office and other equipments 1,266 4 262
Computer and otherrelated accessories 56 - 7
10,269 4,394 4,847
Accumulateddepreciation
5,875
1,262
(Rupees in thousand)
56
FOR THE YEAR ENDED JUNE 30, 2015
NOTES TO AND FORMING PART OF THE FINANCIAL STATEMENTS
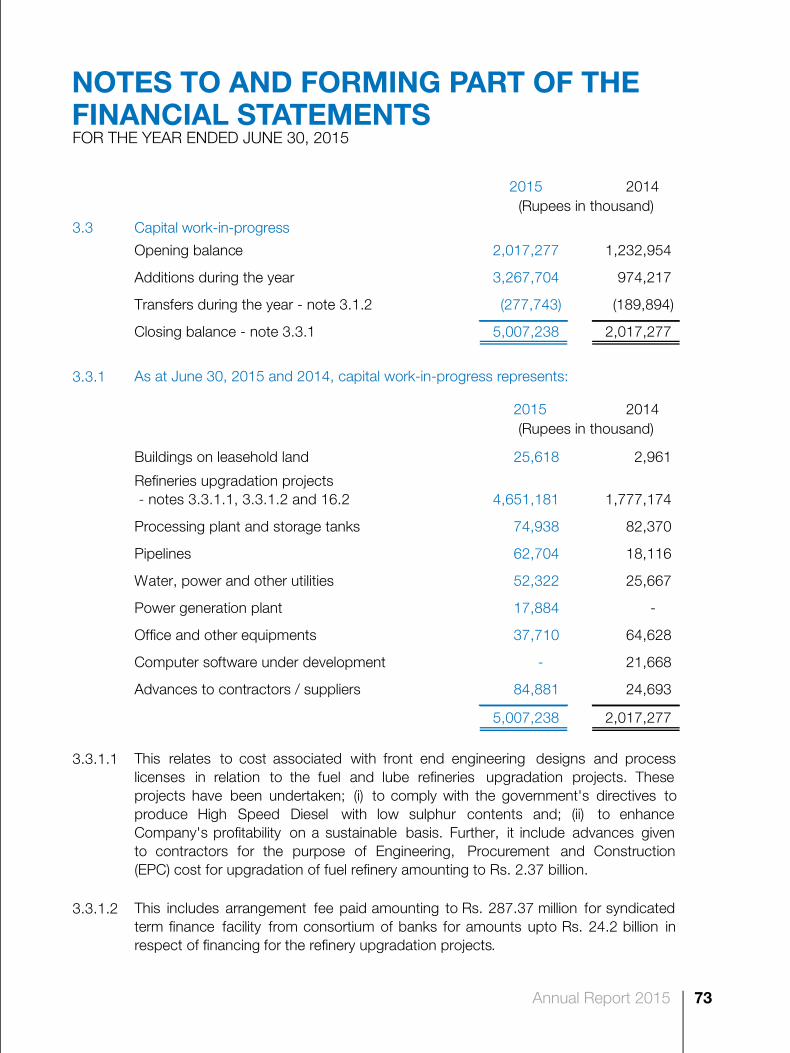
73Annual Report 2015
2015 2014
3.3 Capital work-in-progress
Opening balance 2,017,277 1,232,954
Additions during the year 3,267,704 974,217
Transfers during the year - note 3.1.2 (277,743) (189,894)
Closing balance - note 3.3.1 5,007,238 2,017,277
3.3.1 As at June 30, 2015 and 2014, capital work-in-progress represents:
2015 2014
Buildings on leasehold land 25,618 2,961
4,651,181 1,777,174
Processing plant and storage tanks 74,938 82,370
Pipelines 62,704 18,116
Water, power and other utilities 52,322 25,667
Power generation plant 17,884 -
Office and other equipments 37,710 64,628
Computer software under development - 21,668
Advances to contractors / suppliers 84,881 24,693
5,007,238 2,017,277
3.3.1.1
3.3.1.2
(Rupees in thousand)
This relates to cost associated with front end engineering designs and processlicenses in relation to the fuel and lube refineries upgradation projects. Theseprojects have been undertaken; (i) to comply with the government's directives toproduce High Speed Diesel with low sulphur contents and; (ii) to enhanceCompany's profitability on a sustainable basis. Further, it include advances givento contractors for the purpose of Engineering, Procurement and Construction(EPC) cost for upgradation of fuel refinery amounting to Rs. 2.37 billion.
This includes arrangement fee paid amounting to Rs. 287.37 million for syndicatedterm finance facility from consortium of banks for amounts upto Rs. 24.2 billion inrespect of financing for the refinery upgradation projects.
Refineries upgradation projects - notes 3.3.1.1, 3.3.1.2 and 16.2
(Rupees in thousand)
FOR THE YEAR ENDED JUNE 30, 2015
NOTES TO AND FORMING PART OF THE FINANCIAL STATEMENTS

74 National Refi nery Limited
2015 20143.4 INTANGIBLE ASSETS – Computer softwares
Net carrying value Balance at beginning of the year 1,643 3,106 Additions during the year - note 3.4.1 35,627 100 Amortisation for the year (12,101) (1,563) Balance at end of the year 25,169 1,643
Gross carrying value Cost 91,176 55,549 Accumulated amortisation (66,007) (53,906) Net book value 25,169 1,643
Amortisation is charged at the rate of 33.33% per annum.
3.4.1
2015 20144. LONG TERM INVESTMENT
Available for sale
Anoud Power Generation Limited 10,800 10,800 [1,080,000 (2014: 1,080,000) Ordinary shares of Rs.10 each, Equity held 9.09 percent (2014: 9.09 percent)]
Less: Provision for impairment 10,800 10,800
- - 5. LONG TERM LOANS
Loans - considered goodSecured - note 5.2
- Executives 34,873 38,257 - Employees 20,289 16,179
55,162 54,436 Less: Recoverable within one year shown under
current assets - note 10- Executives 10,565 11,521 - Employees 2,780 2,278
13,345 13,799 41,817 40,637 Unsecured - note 5.3
- Executives 374 452 - Employees 695 747
1,069 1,199 Less: Recoverable within one year shown under
current assets - note 10- Executives 134 178 - Employees 177 172
311 350 758 849
42,575 41,486
(Rupees in thousand)
This includes cost associated with upgradation for Enterprise Resources Planningsystem from previous version.
(Rupees in thousand)
(ERP)
FOR THE YEAR ENDED JUNE 30, 2015
NOTES TO AND FORMING PART OF THE FINANCIAL STATEMENTS

75Annual Report 2015
5.1 Reconciliation of the carrying amount of loans:
5.2
5.3
2015 2014
6. LONG TERM DEPOSITSUtilities 14,216 14,216 Others 15,973 15,973
30,189 30,189 7. STORES, SPARES AND CHEMICALS
In hand
- Stores 491,167 495,899 - Spares 682,722 825,762 - Chemicals 219,940 151,657
1,393,829 1,473,318 In transit 11,839 86,387
1,405,668 1,559,705 Provision for slow moving and obsolete stores,
spares and chemicals - note 7.1 (402,566) (410,277) 1,003,102 1,149,428
7.1
The unsecured loans to executives and employees are either personal loans orgiven for the purchase of furniture and motor cycles. These are granted inaccordance with the terms of their employment and are recoverable in monthlyinstallments over a period of 4 to 12 (2014: 4 to 12) years and are interest free.
(Rupees in thousand)
The secured loans to executives and employees are for the purchase of motor carsand house building. These are granted in accordance with the terms of theiremployment and are recoverable in monthly installments over a period rangingbetween 5 to 10 (2014: 5 to 10) years. Out of these car loans carry interest rangingfrom 3% to 7% (2014: 3% to 7%) per annum. These loans are secured againstoriginal title documents of respective assets.
The Company made a reversal of provision (net of write off) for slow moving andobsolete stores, spares and chemicals of Rs. 2.36 million (2014: Rs. 15.93 million).
Executives Employees Total Executives Employees Total
Balance at beginning of the year 38,709 16,926 55,635 49,091 19,931 69,022 Effect of promotions to Executives 635 (635) - 2,179 (2,179) - Add: Disbursements 10,509 7,900 18,409 7,008 8,505 15,513 Less: Recoveries (14,606) (3,207) (17,813) (19,569) (9,331) (28,900)
Balance at end of the year 35,247 20,984 56,231 38,709 16,926 55,635
2015 2014
(Rupees in thousand)
FOR THE YEAR ENDED JUNE 30, 2015
NOTES TO AND FORMING PART OF THE FINANCIAL STATEMENTS

76 National Refi nery Limited
2015 2014
8. STOCK-IN-TRADE Crude oil and condensate [including
in transit Rs. 85.95 million (2014: Rs. Nil)] 4,541,367 9,062,132
Semi finished products 1,733,952 2,471,067
Finished products - notes 8.1 and 8.2 7,310,341 12,323,361
13,585,660 23,856,560
8.1
8.2 Includes stocks held with the following third parties: Lube based oils for export sales at Keamari terminal- Home Products International (Private) Limited 118,792 200,164
Fuel products for onward sale to customers- Pakistan State Oil Company Limited 5,569 63,125
124,361 263,289
9. TRADE DEBTS - unsecuredConsidered good- Related party - Attock Petroleum Limited - note 9.1 5,379,667 8,257,036 - Others - note 9.2 1,873,368 1,950,032 Considered doubtful 7,832 7,832
7,260,867 10,214,900 Provision for doubtful debts (7,832) (7,832)
7,253,035 10,207,068
9.1
9.2 The age analysis of debt past due but not impaired is as follows:
2015 2014
Up to 3 months - 424
3 to 6 months - 314
More than 6 months 184 9,087
2015 2014(Rupees in thousand)
(Rupees in thousand)
There are no trade debts receivable from related party that are past due or impaired.
As at June 30, stock of finished goods has been written down by Rs. 75.87 million(2014: Rs. 154.71 million) to arrive at its net realisable value.
(Rupees in thousand)
FOR THE YEAR ENDED JUNE 30, 2015
NOTES TO AND FORMING PART OF THE FINANCIAL STATEMENTS

77Annual Report 2015
2015 2014
10. LOANS AND ADVANCES
Loans - considered good
Current portion of long term loans - note 5
Secured
- Executives 10,565 11,521
- Employees 2,780 2,278
13,345 13,799 Unsecured
- Executives 134 178
- Employees 177 172
311 350 Short term loans to employees - unsecured,
interest free 1,112 1,306
Advances
- Executives 1,864 732
- Employees 881 1,117
- Suppliers 57,089 31,128
59,834 32,977
74,602 48,432
11. TRADE DEPOSITS AND SHORT-TERM PREPAYMENTS
Deposits 1,235 3,264
Prepayments
- Insurance 564 194
- Advisory and arrangement fee - 41,745
- Others 7,122 8,034
7,686 49,973
8,921 53,237
(Rupees in thousand)
FOR THE YEAR ENDED JUNE 30, 2015
NOTES TO AND FORMING PART OF THE FINANCIAL STATEMENTS

78 National Refi nery Limited
2015 2014
12. OTHER RECEIVABLES – considered good
Receivable from related parties:
- Attock Petroleum Limited 5,331 4,441
- Attock Refinery Limited 13,634 7,026
Others:
- Government of Pakistan - note 12.1 232,809 232,809
- Workers’ profits participation fund - note 19.2 - 18,952
- Sales tax receivable - note 12.2 237,538 -
- Regulatory duty receivable - note 12.3 36,148 -
- Various 21,866 38,676
547,326 301,904
12.1
12.2
12.3
2015 2014
13. SHORT TERM INVESTMENTS
Held to maturity
123,543 -
Loans and receivables
- 3,002,863
123,543 3,002,863
13.1 This is held by the Company's banker on behalf of the Company. The yield on this
bill is 6.75% and it will mature on September 3, 2015.
3 months treasury bill - at amortised cost - note 13.1
This represents the differential of regulatory duty levied on import of crude oil andsale of petroleum products based on SROs issued by Government of Pakistan andMoPNR. The Oil and Gas Regulatory Authority (OGRA) has been advised byMoPNR to establish a recovery mechanism through which refineries are expected tooperate on no gain / loss basis on this account. The Company is in the process oflodging its claim to OGRA and MoPNR.
This represents receivable on account of sales tax paid to Federal Board of
Revenue amounting to Rs. 237.54 million in respect of sales tax demand for theperiod from July 2009 to June 2010, on account of unitary conversion differences,against an order received during the year. The Company filed an appeal against theorder which was subsequently annulled in favour of the Company. The Companyhas filed refund application with FBR which is in process.
Pakistan Investment Bonds - repo arrangement
(Rupees in thousand)
This represents price differential claims receivable from Government of Pakistan.On behalf of oil refineries, Oil Companies Advisory Committee (OCAC) haspresented the claims before the Ministry of Petroleum & Natural Resources(MoPNR), which are under review.
(Rupees in thousand)
FOR THE YEAR ENDED JUNE 30, 2015
NOTES TO AND FORMING PART OF THE FINANCIAL STATEMENTS

79Annual Report 2015
2015 2014
14. CASH AND BANK BALANCES
500 138,653
Current accounts 69,958 46,283
Savings accounts - note 14.1 2,166,799 4,305,415
Deposit accounts - notes 14.1 and 14.2 15,035,687 4,314,514
17,272,444 8,666,212
17,272,944 8,804,865
14.1
14.2
2015 201415. SHARE CAPITAL
Number of shares
Ordinary shares of Rs. 10 each 1,000,000 1,000,000
Ordinary shares ofRs. 10 each fully paid in cash 594,504 594,504
Ordinary shares ofRs. 10 each issued forconsideration other than cash 64,700 64,700
Ordinary shares ofRs. 10 each issued as fullypaid bonus shares 140,462 140,462
799,666 799,666
These will mature latest by April 30, 2016 and include Rs. 435.99 million(2014: Rs. 365.22 million) under lien with banks against bank guarantees issued onbehalf of the Company.
These carry mark-up rates varying from 4.90% to 9.80% (2014: 6% to 10.10%) perannum.
(Rupees in thousand)
(Rupees in thousand)
14,046,180
100,000,000
6,469,963
59,450,417
79,966,560
FOR THE YEAR ENDED JUNE 30, 2015
NOTES TO AND FORMING PART OF THE FINANCIAL STATEMENTS

80 National Refi nery Limited
15.1
2015 2014
- Attock Refinery Limited 19,991,640 19,991,640
- Pakistan Oilfields Limited 19,991,640 19,991,640
- Attock Petroleum Limited 799,665 799,665
16. RESERVES
Capital compensation reserve - note 16.1 10,142 10,142
Exchange equalisation reserve 4,117 4,117
14,259 14,259
General reserve 21,061,000 21,061,000
Unappropriated profit 4,485,682 945,614
25,546,682 22,006,614
3,773,100 3,773,100
29,334,041 25,793,973
16.1
(Number of shares)
Capital compensation reserve includes net amounts for (a) premature termination ofcrude oil sales, bareboat charter-party and technical assistance agreements,(b) design defects and terminated service agreements and (c) termination ofbareboat charter-party and affreightment agreements.
As at June 30, 2015 and 2014, Attock Group holds 51% equity stake in theCompany through the following companies:
FOR THE YEAR ENDED JUNE 30, 2015
NOTES TO AND FORMING PART OF THE FINANCIAL STATEMENTS

81Annual Report 2015
16.2
-
-
-
During 2013, Government of Pakistan issued a policy framework for upgradationand expansion of refinery project which interalia states that:
refineries will not be allowed to offset losses, if any, for year endingJune 30, 2013 or subsequent years against the amount of profit above 50%accumulated or to be accumulated in the Special Reserve Account as percurrent pricing formula; and
the amount of profits above 50% will be accumulated in the Special Reserveaccount as per the pricing formula (including unutilised balance), which shallalong with amounts presently available with refineries be deposited on halfyearly basis (with final adjustment on annual basis) in an ESCROW Account tobe operated jointly with Finance Division and shall be available for utilisationexclusively for upgradation of refineries.
As at June 30, 2015, the Company has incurred capital expenditure ofRs. 4.65 billion (2014: Rs. 1.78 billion) on upgradation and expansion projects. Itincludes Rs. 4.44 billion (2014: Rs. 1.58 billion) for the upgradation and expansionof fuel refinery operations. The transfer of Special reserve to General reserve in thefinancial information for the nine months ended March 31, 2015 has been reversed.
As per the Import Parity Pricing (IPP) formula, effective July 1, 2002, certainrefineries including the Company have been directed to transfer from their net profitafter tax for the year from fuel refinery operations, an amount in excess of 50% ofthe paid-up share capital, as on July 1, 2002 attributable to fuel segment, to offsetagainst any future losses or to make investment for expansion or upgradation and istherefore not available for distribution.
with effect from January 1, 2016, subject to completion of Diesel HydroDesulphurisation (DHDS) project, the 7.5% deemed duty on High Speed Diesel(HSD) will be enhanced to 9.0% which may remain applicable till the envisagedcomplete deregulation. Further, penalty clauses will apply in IPP of HSD fromJanuary 1, 2016 if the project is not completed by the said date. However theCompany has started the DHDS project and has approached the Ministry ofPetroleum and Natural Resources (MoPNR) for extension in the time limit forcompletion of the project by May 2017.
FOR THE YEAR ENDED JUNE 30, 2015
NOTES TO AND FORMING PART OF THE FINANCIAL STATEMENTS
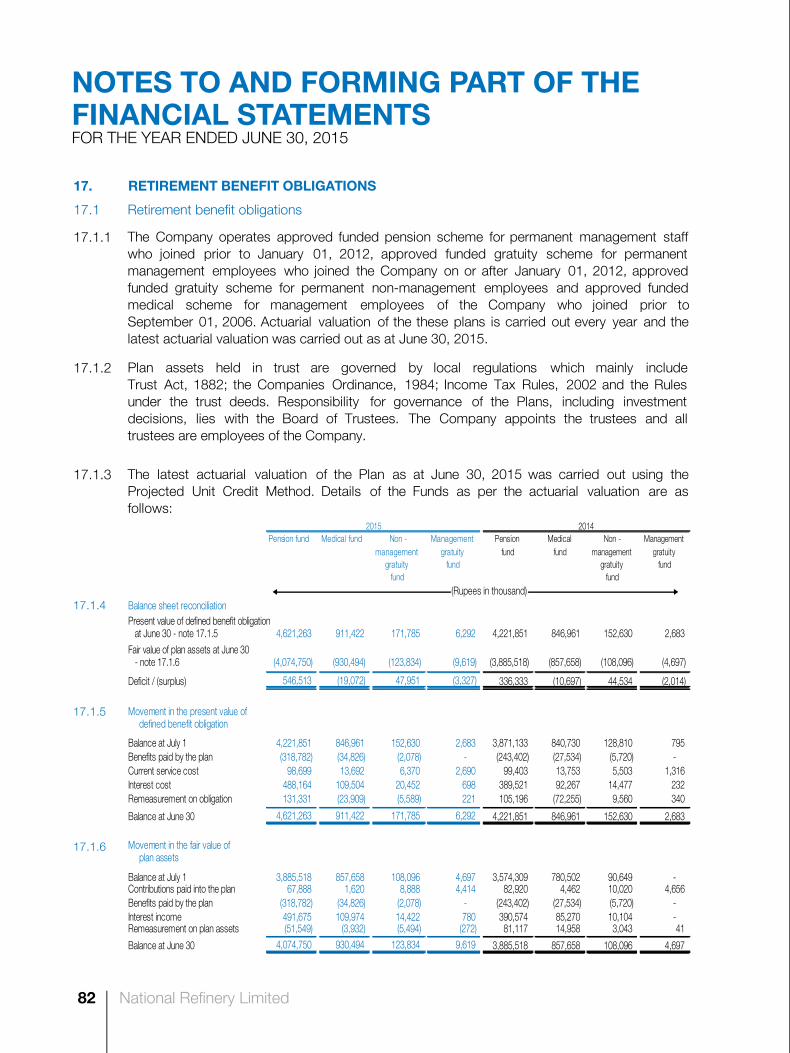
82 National Refi nery Limited
17. RETIREMENT BENEFIT OBLIGATIONS
17.1 Retirement benefit obligations
17.1.1
17.1.2
17.1.3
17.1.4
17.1.5
17.1.6
The Company operates approved funded pension scheme for permanent management staffwho joined prior to January 01, 2012, approved funded gratuity scheme for permanentmanagement employees who joined the Company on or after January 01, 2012, approvedfunded gratuity scheme for permanent non-management employees and approved fundedmedical scheme for management employees of the Company who joined prior toSeptember 01, 2006. Actuarial valuation of the these plans is carried out every year and thelatest actuarial valuation was carried out as at June 30, 2015.
Plan assets held in trust are governed by local regulations which mainly includeTrust Act, 1882; the Companies Ordinance, 1984; Income Tax Rules, 2002 and the Rulesunder the trust deeds. Responsibility for governance of the Plans, including investmentdecisions, lies with the Board of Trustees. The Company appoints the trustees and alltrustees are employees of the Company.
The latest actuarial valuation of the Plan as at June 30, 2015 was carried out using theProjected Unit Credit Method. Details of the Funds as per the actuarial valuation are asfollows:
Balance sheet reconciliation Present value of defined benefit obligation
4,621,263 911,422 171,785 6,292 4,221,851 846,961 152,630 2,683 Fair value of plan assets at June 30
- note 17.1.6 (4,074,750) (930,494) (123,834) (9,619) (3,885,518) (857,658) (108,096) (4,697)
Deficit / (surplus) 546,513 (19,072) 47,951 (3,327) 336,333 (10,697) 44,534 (2,014)
Movement in the present value of defined benefit obligation
Balance at July 1 4,221,851 846,961 152,630 2,683 3,871,133 840,730 128,810 795 Benefits paid by the plan (318,782) (34,826) (2,078) - (243,402) (27,534) (5,720) - Current service cost 98,699 13,692 6,370 2,690 99,403 13,753 5,503 1,316 Interest cost 488,164 109,504 20,452 698 389,521 92,267 14,477 232 Remeasurement on obligation 131,331 (23,909) (5,589) 221 105,196 (72,255) 9,560 340
Balance at June 30 4,621,263 911,422 171,785 6,292 4,221,851 846,961 152,630 2,683
Movement in the fair value of plan assets
Balance at July 1 3,885,518 857,658 108,096 4,697 3,574,309 780,502 90,649 - Contributions paid into the plan 67,888 1,620 8,888 4,414 82,920 4,462 10,020 4,656 Benefits paid by the plan (318,782) (34,826) (2,078) - (243,402) (27,534) (5,720) - Interest income 491,675 109,974 14,422 780 390,574 85,270 10,104 - Remeasurement on plan assets (51,549) (3,932) (5,494) (272) 81,117 14,958 3,043 41
Balance at June 30 4,074,750 930,494 123,834 9,619 3,885,518 857,658 108,096 4,697
Non - management
gratuity fund
Management gratuity
fund
(Rupees in thousand)
2015 2014Non -
management gratuity
fund
Management gratuity
fund
Pension fund
Medical fund
at June 30 - note 17.1.5
Pension fund Medical fund
FOR THE YEAR ENDED JUNE 30, 2015
NOTES TO AND FORMING PART OF THE FINANCIAL STATEMENTS

83Annual Report 2015
17.1.7
17.1.8
17.1.10
17.1.9
17.1.11
Expense recognised in profit and loss account
Current service cost 98,699 13,692 6,370 2,690 99,403 13,753 5,503 1,316
Net interest (income) / cost (3,511) (470) 6,030 (82) (1,053) 6,997 4,373 232
Expense recognised in profit and loss account 95,188 13,222 12,400 2,608 98,350 20,750 9,876 1,548
Remeasurement recognised in OtherComprehensive Income
Remeasurement of presentvalue of defined benefit obligation 131,331 (23,909) (5,589) 221 105,196 (72,255) 9,560 340
Remeasurement of fair value of plan assets 51,549 3,932 5,494 272 (81,117) (14,958) (3,043) (41)
Remeasurements 182,880 (19,977) (95) 493 24,079 (87,213) 6,517 299
Net recognised liability / (asset)
Net liability / (asset) at the beginning of the year 336,333 (10,697) 44,534 (2,014) 296,824 60,228 38,161 795
Expense recognised in profitand loss account 95,188 13,222 12,400 2,608 98,350 20,750 9,876 1,548
Contribution made to the fundduring the year (67,888) (1,620) (8,888) (4,414) (82,920) (4,462) (10,020) (4,656)
Remeasurements recognised inother comprehensive income 182,880 (19,977) (95) 493 24,079 (87,213) 6,517 299
Recognised liability / (asset)as at June 30 546,513 (19,072) 47,951 (3,327) 336,333 (10,697) 44,534 (2,014)
Major categories / composition of plan assets are as follows:
2015 2014 2015 2014 2015 2014 2015 2014
Debt Instrument 85.30% 86.58% 60.11% 62.05% 86.10% 83.46% 54.18% 36.66%
Equity 2.99% 3.34% 0.00% 0.00% 4.44% 7.54% 0.00% 0.00%
Mutual funds 10.00% 9.28% 39.02% 37.92% 0.00% 0.00% 0.00% 0.00%
Others 1.71% 0.80% 0.87% 0.03% 9.46% 9.00% 45.82% 63.34%
Actuarial Assumptions
Discount rate at June 30 9.75% 13.00% 9.75% 13.00% 9.75% 13.00% 9.75% 13.00%
Future salary increases / increase in cost
- First year following the valuation 7.00% 8.00% 6.75% 10.00% 9.00% 10.00% 7.00% 8.00%
- Second year following the valuation 7.00% 8.00% 6.75% 10.00% 9.00% 10.00% 7.00% 8.00%
- Third year following the valuation 7.00% 10.00% 6.75% 10.00% 9.00% 10.00% 7.00% 10.00%- Long term increase 8.00% 12.00% 6.75% 10.00% 8.75% 12.00% 8.75% 12.00%Expected rate of increase in pension 3.75% 7.00% - - - - - - Expected retirement age 60 years 60 years 60 years 60 years 60 years 60 years 60 years 60 years
Medical fund
Medical fund
Pension fund Medical fund Non - management
gratuity fund
Management gratuity
fund
Pension fund
gratuity fund gratuity fundNon - management Management
Pension fund
2014
(Rupees in thousand)
Non - management
gratuity fund
Management gratuity
fund
2015
FOR THE YEAR ENDED JUNE 30, 2015
NOTES TO AND FORMING PART OF THE FINANCIAL STATEMENTS

84 National Refi nery Limited
17.1.12
17.1.13
17.1.14
17.2 Sensitivity analysis for actuarial assumptions
If longevity increases by 1 year, the resultant increase in obligation is insignificant.
The above sensitivity analyses are based on a change in an assumption while holding allother assumptions constant. In practice, this is unlikely to occur, and changes in some of theassumptions may be correlated. When calculating the sensitivity of the defined benefitobligation to significant actuarial assumptions the same method (present value of the definedbenefit obligation calculated with the projected unit credit method at the end of the reportingperiod) has been applied as when calculating the gratuity, pension and medical benefitliability recognised within the balance sheet.
The methods and types of assumptions used in preparing the sensitivity analysis did notchange compared to the previous period.
Mortality was assumed to be SLIC (2001-05) table.
In case of the funded plans, the Company ensures that the investment positions aremanaged within an asset-liability matching (ALM) framework that has been developed toachieve long-term investments that are in line with the obligations under the retirementbenefit plan. Within this framework, the Company’s ALM objective is to match assets to theretirement benefit obligations by investing in long-term fixed interest securities withmaturities that match the benefit payments as they fall due and in the appropriate currency.The Company actively monitors how the duration and the expected yield of the investmentsare matching the expected cash outflows arising from the retirement benefit plan obligations.The Company has not changed the processes used to manage its risks from previousperiods. The Company does not use derivatives to manage its risk. Investments are welldiversified, such that the failure of any single investment would not have a material impact on the overall level of assets. A large portion of assets in 2015 consists of national savingsscheme and government securities. The Company believes that national savings schemeoffer the best returns over the long term with an acceptable level of risk.
The expected return on plan assets has been determined by considering the expectedreturns available on the assets underlying the current investment policy. Expected yields onfixed interest investments are based on gross redemption yields as at the balance sheetdate.
The actuary conducts separate valuations for calculating contribution rates and the Companycontributes to the pension, gratuity and medical benefit funds according to the actuary'sadvice. Expense of the defined benefit plan is calculated by the actuary.
The sensitivity of the defined benefit obligation to changes in the weighted principalassumptions is:
The Company's contributions to gratuity, pension and medical benefit funds in 2016 isexpected to amount to Rs. 153.70 million.
Change in assumption
Increase in assumption
Decrease in assumption
Discount rate at June 30 0.5% 5,384 6,069 Future salary increases 0.5% 4,881 4,721 Future pension increases 0.5% 5,768 5,315 Future medical increases 0.5% 920 904
(Rupees in thousand)
Impact on defined benefit obligation
FOR THE YEAR ENDED JUNE 30, 2015
NOTES TO AND FORMING PART OF THE FINANCIAL STATEMENTS

85Annual Report 2015
17.3
17.4
17.5 The weighted average duration of the plans are as follows:
Pension fund 10.2 Gratuity fund - Non-management 10.4 Medical fund 14.7 Gratuity fund - Management 20.5
17.6
No. of years
Figures in this note are based on the latest actuarial valuation carried out as atJune 30, 2015.
The Company's contributions towards the provident fund for the year endedJune 30, 2015 amounted to Rs. 44.57 million (2014: Rs. 44.98 million).
2015 2014 2013 2012 2011
Historical informationPension fund
4,621,263 4,221,851 3,871,133 3,264,638 2,938,458
(4,074,750) (3,885,518) (3,574,309) (3,252,080) (2,950,214)
546,513 336,333 296,824 12,558 (11,756)
Experience Adjustments
131,331 105,196 298,281 20,271 223,123
51,549 81,117 38,689 (19,252) 104,861
Medical Benefit
911,422 846,961 840,730 786,802 728,221
(930,494) (857,658) (780,502) (712,300) (651,744)
(19,072) (10,697) 60,228 74,502 76,477
Experience Adjustments
(23,909) (72,255) (41,600) (38,084) 7,611
3,932 14,958 2,861 (12,454) 5,708
Gratuity fund - Non-management
171,785 152,630 128,810 118,209 90,789
Fair value of plan assets (123,834) (108,096) (90,649) (73,844) (59,039)
Deficit in the plan 47,951 44,534 38,161 44,365 31,750
Experience Adjustments
(5,589) 9,560 (9,822) 10,361 12,092
5,494 3,043 1,437 (775) 1,006
Gratuity fund - management
6,292 2,683 795 80 -
(9,619) (4,697) - - -
(3,327) (2,014) 795 80 -
Experience Adjustments
221 340 377 - -
272 41 - - -
Rupees in thousand
Present value of defined benefit obligation
(Gain) / loss on obligation
Gain / (loss) on plan assets
Loss on obligation
Gain / (loss) on plan assets
Present value of defined benefit obligation
Fair value of plan assets
Deficit / (surplus) in the plan
Loss on obligation
Gain / (loss) on plan assets
Gain on plan assets
Present value of defined benefit obligation
Fair value of plan assets
(Surplus) / deficit in the plan
(Gain) / loss on obligation
Present value of defined benefit obligation
Fair value of plan assets
(Surplus) / deficit in the plan
FOR THE YEAR ENDED JUNE 30, 2015
NOTES TO AND FORMING PART OF THE FINANCIAL STATEMENTS

86 National Refi nery Limited
2015 2014
18. DEFERRED TAXATION
Debit / (Credit) balances arising in respect of:
Provisions for:
- slow moving & obsolete stores,
spares and chemicals 149,775 156,603
- duties and taxes 14,113 14,331
- long term investment, doubtful debts, doubtful
receivables, staff retirement benefits,
pending litigations and others 3,496 3,501
- old outstanding liabilities offered for tax 148,733 142,696
316,117 317,131
Minimum tax - 366,803 Accelerated tax depreciation and amortisation (487,672) (518,590)
(171,555) 165,344
19. TRADE AND OTHER PAYABLES Trade creditors 10,924,859 18,005,884
Due to Government of Pakistan 1,191,153 1,973,811 Due to related parties:
- Attock Petroleum Limited 4,497 26,553
- Attock Refinery Limited - 6,575 - Pakistan Oilfields Limited 339,013 842,851 Accrued liabilities 694,161 681,244
633,967 429,011 Sales tax payable 1,447,775 1,606,115
Retention money 43,270 18,766 Deposits from contractors 33,615 33,332 Advances from customers 169,181 292,455
Workers’ profits participation fund - note 19.2 48,616 -
Workers' welfare fund 145,368 70,255
Income tax deducted at source 13,355 260,491
Unclaimed dividend 67,329 68,553 Excise duty and petroleum levy 668,648 604,912 Others 8,214 10,461
16,433,021 24,931,269
Surplus price differential payable - notes 19.1 and 12.3
(Rupees in thousand)
FOR THE YEAR ENDED JUNE 30, 2015
NOTES TO AND FORMING PART OF THE FINANCIAL STATEMENTS

87Annual Report 2015
19.1
2015 2014
(Rupees in thousand)
19.2 Workers’ profits participation fund
Receivable / (payable) at beginning of the year 18,952 (16,256)
Allocation for the year - note 28 (298,615) (101,049)
Interest on funds utilised in the
Company’s business - note 29 - (1,904)
(279,663) (119,209)
Amount paid to the Trustees of the Fund 231,047 138,161
(Payable) / receivable at end of the year (48,616) 18,952
20. PROVISIONS
Duties and taxes - note 20.1 29,006 29,006 Others - note 20.2 83,355 217,181
112,361 246,187
20.1 These represent provisions for:
Sales tax and central excise duty - note 20.1.1 29,006 29,006
29,006 29,006
20.1.1
20.2 This includes Rs. 55.62 million (2014: Rs. 55.62 million) in respect of sales tax andexcise duty on account of purchases of crude oil and drums.
This represents provision made by the Company in respect of sales tax and centralexcise duty aggregating to Rs. 29.01 million (2014: Rs. 29.01 million), determined bythe Collectorate of Customs, Sales Tax and Central Excise (Adjudication) in 2004 inrespect of goods sold by the Company to one of its customer without deduction ofsales tax and central excise duties.
This represents amount payable in respect of surplus of High Speed Diesel (HSD)price as per Pakistan State Oil Limited's (PSO) actual import price excluding oceanlosses over HSD price based on import price parity formula in accordance with theEconomic Coordination Committee's decision dated February 26, 2013.
FOR THE YEAR ENDED JUNE 30, 2015
NOTES TO AND FORMING PART OF THE FINANCIAL STATEMENTS

88 National Refi nery Limited
2015 2014
20.3 Reconciliation of provisions
Balance at the beginning of the year 246,187 411,401
Payment (90,000) -
Reversal - note 27.1 (43,826) (165,214)
Balance at the end of the year 112,361 246,187
21. CONTINGENCIES AND COMMITMENTS
21.1 Contingencies
21.1.1
21.1.2
21.1.3
21.2 Commitments
21.2.1
21.2.2
2015 2014
22. GROSS SALES
Local 173,147,074 222,444,797
Exports 15,788,254 27,324,462
188,935,328 249,769,259
The Company has raised claims on certain Oil Marketing Companies (OMCs) inrespect of interest on late payments against receivables aggregating toRs. 5.07 billion (2014: Rs. 5.07 billion). However, these have not been recognised inthe financial statements as these claims have not been acknowledged by the OM Cs.
Commitments outstanding for capital expenditures as at June 30, 2015 amounted toRs. 21.26 billion (2014: Rs. 426.87 million).
(Rupees in thousand)
Outstanding letters of credit at the end of the year amounted to Rs. 15.10 billion(2014: Rs. 19.87 billion).
Claims not acknowledged by the Company as debt at the end of the year amountedto Rs. 4.53 billion (2014: Rs. 4.53 billion). These include claims accumulating toRs. 4.31 billion (2014: Rs. 4.31 billion) in respect of late payment surcharge claimedby crude oil suppliers and Rs. 16.45 million (2014: Rs. 16.45 million) relating to freightclaims.
Outstanding counter guarantees at the end of the year amounted to Rs. 456.43 million(2014: Rs. 365.22 million).
(Rupees in thousand)
FOR THE YEAR ENDED JUNE 30, 2015
NOTES TO AND FORMING PART OF THE FINANCIAL STATEMENTS

89Annual Report 2015
2015 2014
23. TRADE DISCOUNTS, TAXES, DUTIES, LEVIES AND PRICE DIFFERENTIAL
Trade discounts 716,335 1,078,559 Sales tax 28,217,415 32,321,508 Excise duty 557 495 Petroleum levy 9,791,884 8,392,121 Regulatory duty - note 12.3 245,500 - Surplus price differential - note 19.1 1,507,128 573,318
40,478,819 42,366,001
24. COST OF SALES
Opening stock of semi-finished products 2,471,067 2,906,729 Crude oil, condensate and drums
consumed - notes 24.1 and 24.2 130,933,521 197,525,738
Stores, spares and chemicals consumed 592,627 563,626
Salaries, wages and staff benefits - note 24.3 1,085,405 1,056,818
Staff transport and canteen 104,555 114,645
Fuel, power and water 2,238,402 2,358,527
Rent, rates and taxes 101,781 43,962
Insurance 228,339 260,433
Contract services 59,240 61,235
Repairs and maintenance 193,359 89,837
Reversal of provision for slow moving and obsolete stores, spares and chemicals (10,103) (16,538)
Stores, spares and chemicals written off 5,389 -
Depreciation - note 3.1 297,625 290,036 Amortisation of intangible assets - note 3.4 556 -
Professional charges 3,205 3,159
Consultancy charges 5,278 7,725
Security charges 12,931 6,312
Others 8,510 11,471
135,860,620 202,376,986
Closing stock of semi-finished products - note 8 (1,733,952) (2,471,067)
Cost of products manufactured 136,597,735 202,812,648
Opening stock of finished products 12,323,361 13,860,549
Closing stock of finished products - note 8 (7,310,341) (12,323,361) 5,013,020 1,537,188
141,610,755 204,349,836
(Rupees in thousand)
FOR THE YEAR ENDED JUNE 30, 2015
NOTES TO AND FORMING PART OF THE FINANCIAL STATEMENTS

90 National Refi nery Limited
2015 2014
24.1
Crude oil and condensate
- Opening stock 9,062,132 5,796,476
- Purchases 126,373,531 200,565,489
- Closing stock - note 8 (4,541,367) (9,062,132)
130,894,296 197,299,833 Drums 39,225 225,905
130,933,521 197,525,738
24.2
24.3
2015 2014
25. DISTRIBUTION AND MARKETING EXPENSES
Commission on local sales 465,947 548,469 Commission on export sales 158,616 274,226 Export expenses 86,072 139,798 Salaries and staff benefits - note 25.1 74,335 57,858 Depreciation - note 3.1 22,980 22,313 Security charges 18,283 8,925 Repairs and maintenance 11,024 10,460 Bad debts written off 10,293 - Pipeline charges 7,951 5,566 Selling expenses 7,031 6,942 Postage and periodicals 6,570 3,637 Staff transport and canteen 6,024 6,910 Others 3,998 5,192
879,124 1,090,296
25.1
Includes Rs.75.42 million (2014: Rs. 85.39 million) and Rs. 28.03 millionin respect of defined benefit and defined contribution plans respectively.
Crude oil, condensate and drums consumed
(Rupees in thousand)
Cost of local crude oil and condensate consumed in respect of non-finalised CrudeOil Sale Purchase Agreements (COSA) has been recorded provisionally inaccordance with Petroleum Concession Agreement.
(Rupees in thousand)
Includes Rs. 6.62 million (2014: Rs. 7.24 million) and Rs. 2.99 million (2014:Rs. 2.56 million)in respect of defined benefit and defined contribution plans respectively.
(2014: Rs.31.22 million)
FOR THE YEAR ENDED JUNE 30, 2015
NOTES TO AND FORMING PART OF THE FINANCIAL STATEMENTS
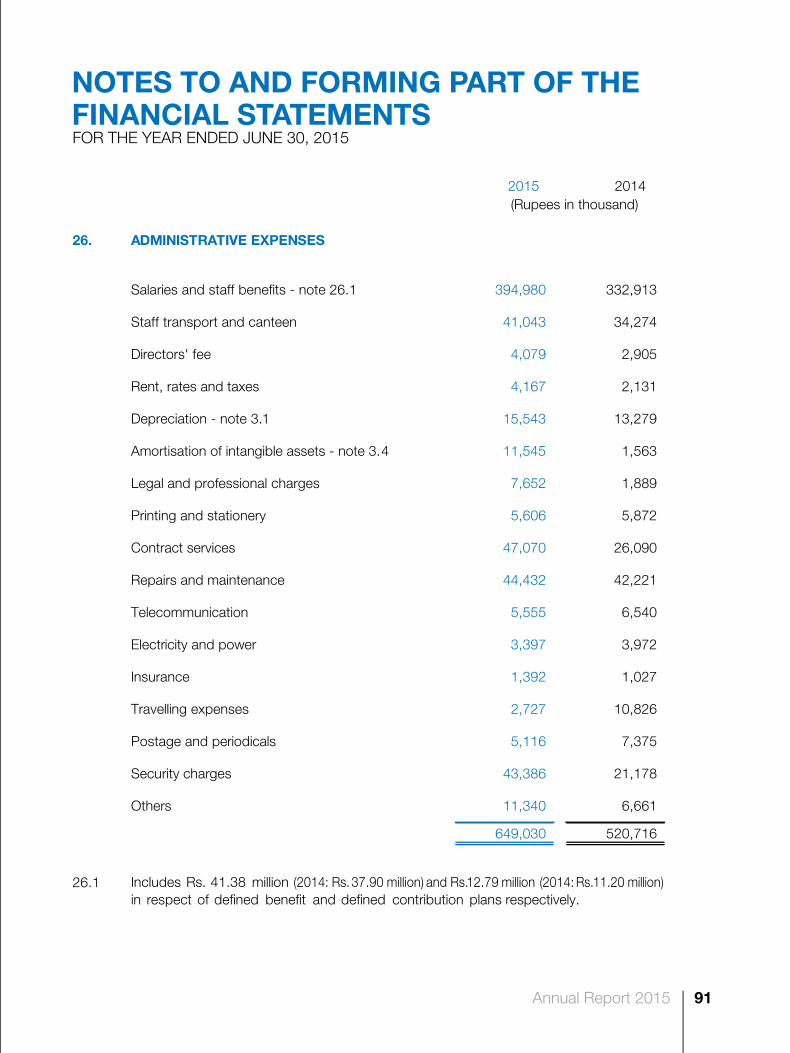
91Annual Report 2015
2015 2014
26. ADMINISTRATIVE EXPENSES
Salaries and staff benefits - note 26.1 394,980 332,913
Staff transport and canteen 41,043 34,274
Directors' fee 4,079 2,905
Rent, rates and taxes 4,167 2,131
Depreciation - note 3.1 15,543 13,279
Amortisation of intangible assets - note 3.4 11,545 1,563
Legal and professional charges 7,652 1,889
Printing and stationery 5,606 5,872
Contract services 47,070 26,090
Repairs and maintenance 44,432 42,221
Telecommunication 5,555 6,540
Electricity and power 3,397 3,972
Insurance 1,392 1,027
Travelling expenses 2,727 10,826
Postage and periodicals 5,116 7,375
Security charges 43,386 21,178
Others 11,340 6,661
649,030 520,716
26.1
(Rupees in thousand)
Includes Rs. 41.38 million (2014: Rs.37.90 million) and Rs.12.79 million (2014: Rs.11.20 million)in respect of defined benefit and defined contribution plans respectively.
FOR THE YEAR ENDED JUNE 30, 2015
NOTES TO AND FORMING PART OF THE FINANCIAL STATEMENTS

92 National Refi nery Limited
2015 2014
27. OTHER INCOME
Income from financial assets
Return / interest / mark-up on:
- PLS savings and deposit accounts 680,695 652,296
- Secured loans to employees and executives 556 597
- Treasury bills 169,396 99,335
- Pakistan Investment Bonds 256,301 45,218
1,106,948 797,446
Others
Handling and storage income 228,532 210,609
Hospitality income 65,098 50,243
Liabilities no longer payable writtenback - note 27.1 95,639 321,411
453 2,987
Sale of scrap and empties 5,092 32,043
Pipeline charges recovered 6,799 5,371
Rental income 8,612 8,495
Profit commission 5,814 6,504
Others 2,329 1,043
1,525,316 1,436,152
27.1 This includes write back of liabilities considered no longer payable accumulating toRs. 51.6 million in respect of reversal of amounts payable to local crude oil suppliersand Rs. 43.8 million consequent to settlement of a legal case with a supplier.
Profit on disposal of property, plant and equipment
(Rupees in thousand)
FOR THE YEAR ENDED JUNE 30, 2015
NOTES TO AND FORMING PART OF THE FINANCIAL STATEMENTS

93Annual Report 2015
2015 2014
28. OTHER OPERATING EXPENSES
Workers' profits participation fund - note 19.2 298,615 101,049
Workers' welfare fund 113,474 38,360
Auditors’ remuneration - note 28.1 6,654 7,088
Corporate Social Responsibility 100 100
Property, plant and equipment written off 1,307 -
Others 9,852 -
430,002 146,597
28.1 Auditors’ remuneration
Audit fee 2,200 2,000
Taxation services 2,499 3,427
Fee for review of half yearly financial information, special reports and certifications 1,543 1,240
Out-of-pocket expenses 412 421
6,654 7,088
29. FINANCE COST
Exchange loss - note 29.1 851,258 848,465
Interest on workers' profits participation fund - 1,904
Guarantee commission and service charges 1,316 1,517
Bank charges 120 433
852,694 852,319
29.1
2015 2014
30. TAXATION
Current - for the year - note 30.1 1,606,351 1,175,376
- for prior year (86,399) (26,182)
1,519,952 1,149,194 Deferred 331,288 (231,423)
1,851,240 917,771
This is net of exchange gain on export sales amounting Rs. 72.26 million(2014: Rs. 116.59 million).
(Rupees in thousand)
(Rupees in thousand)
FOR THE YEAR ENDED JUNE 30, 2015
NOTES TO AND FORMING PART OF THE FINANCIAL STATEMENTS

94 National Refi nery Limited
30.1
30.2 Relationship between tax expense and accounting profit
2015 2014
Accounting profit before taxation 5,560,220 1,879,646
Tax at the applicable tax rate of 33% (2014: 34%) 1,834,873 639,080
Tax effect of expenses not allowed for tax - 34
Tax effect of Final Tax Regime 13,744 327,039
Effect of tax credits (68,149) (13,716)
Effect of super tax 164,743 -
Effect of income taxable at lower rate (1,615) (1,679)
Effect of prior year tax (86,399) (26,182)
Effect of change in tax rate (5,957) (6,805)
Tax expense for the year 1,851,240 917,771
2015 2014
31. EARNINGS PER SHARE - basic and diluted
Profit after taxation (Rupees in thousand) 3,708,980 961,875
Weighted average number of ordinaryshares in issue (in thousand) 79,967 79,967
Basic earnings per share (Rupees) 46.38 12.03
This includes one-time super tax of Rs. 164.74 million imposed for rehabilitation oftemporarily displaced persons under section 4B of the Income Tax Ordinance 2001(as inserted by Finance Act 2015).
There were no dilutive potential ordinary shares in issue as at June 30, 2015 and2014.
(Rupees in thousand)
FOR THE YEAR ENDED JUNE 30, 2015
NOTES TO AND FORMING PART OF THE FINANCIAL STATEMENTS

95Annual Report 2015
2015 2014
32. CASH GENERATED FROM / (USED IN)
OPERATIONS
Profit before taxation 5,560,220 1,879,646
Adjustment for non cash charges and other items:
Depreciation and amortisation 348,249 327,191
Provision for staff retirement benefit funds 123,418 130,524
- -
(10,103) (16,538)
Stores, spares and chemicals written off 5,389 -
Bad debts written off 10,293 -
Return on investments and bank accounts (1,106,392) (796,849)
(453) (2,987)
Property, plant and equipment written off 1,307 -
Decrease / (Increase) in working capital - note 32.1 4,499,807 (2,737,711)
9,431,735 (1,216,724)
32.1 Decrease / (Increase) in working capital
Decrease / (Increase) in current assets
Stores, spares and chemicals 143,293 (345,416)
Stock-in-trade 10,270,900 (1,292,806)
Trade debts 2,943,740 769,924
Loans and advances (26,170) (12,156)
Deposits and prepayments 44,316 (45,016)
Other receivables (245,422) (27,193) 13,130,657 (952,663)
(Increase) / Decrease in current liabilities
Trade and other payables (8,497,024) (1,619,834)
Provisions (133,826) (165,214) 4,499,807 (2,737,711)
(Rupees in thousand)
Profit on disposal of property, plant and equipment
Mark-up on late payment to supplier
Reversal of provision for slow moving and obsolete stores, spares and chemicals
FOR THE YEAR ENDED JUNE 30, 2015
NOTES TO AND FORMING PART OF THE FINANCIAL STATEMENTS

96 National Refi nery Limited
2015 2014
33. CASH AND CASH EQUIVALENTS
Cash and bank balances 17,272,944 8,804,865
Short term investments 123,088 2,999,904
17,396,032 11,804,769
34. UNAVAILED CREDIT FACILITIES
Short term running finance - note 34.1 2,000,000 1,000,000
Letters of credit and guarantee - note 34.2 35,444,742 37,781,480
Syndicate term finance - note 34.3 24,200,000 -
Letter of credit (sublimit to the
syndicate term finanace) - note 34.3 20,993,481 -
34.1 Short term running finance
34.2 Letters of credit and guarantee
(Rupees in thousand)
The rates of mark-up on these finance ranges between 7.25% and 10.95%(2014: 9.39% and 10.73%) per annum, payable quarterly.
The facilities are secured by way of pari passu charge against hypothecation ofCompany's plant and machinery and ranking charge on Company's stocks,receivables and other current assets.
The facilities are secured against joint pari passu charge on Company’s stocks,receivables and other current assets.
FOR THE YEAR ENDED JUNE 30, 2015
NOTES TO AND FORMING PART OF THE FINANCIAL STATEMENTS

97Annual Report 2015
34.3 Syndicate term finance
35. REMUNERATION OF CHIEF EXECUTIVE, DIRECTORS AND EXECUTIVES
35.1
35.2
This facility is secured by first pari passu charge by way of hypothecation over allpresent and future current assets, movable fixed assets and mortgage overimmovable property to the extent of Rs. 32.27 billion. Further, a non-funded letter ofcredit facility (being sublimit to syndicate term finance) has been established forfinancing the Diesel De-sulphurisation and Naphtha Isomerisation as part ofupgradation and expansion of fuel refinery operations.
In addition to the above, fee to executive and non-executive directors during theyear amounted to Rs. 1.16 million (2014: Rs. 0.77 million) and Rs. 2.92 million(2014: Rs. 2.14 million) respectively.
The Company has entered into a syndicated finance agreement with a consortium ofbanks which includes United Bank Limited as the Agent Bank for a term financefacility of Rs. 24.2 billion for the Company's upgradation and expansion projects. Thefacility carries a mark-up of 6 month KIBOR plus 1.7% p.a. which will be payable onsemi-annually basis. The tenure of this facility is 12 years including the grace periodof 2 years. Upto June 30, 2015 no draw down was made.
The Chief Executive, executive director and some of the executives of the Companyare provided with free use of Company's cars and additionally, the Chief Executive,executive director and executives are also entitled to medical benefits and clubsubscriptions in accordance with their terms of service.
Executive Executives Chief Executive ExecutivesDirector Executive Director
Managerial remuneration 12,207 6,630 365,004 9,828 5,806 331,239
Bonus 3,415 1,361 67,137 1,538 630 33,700
Retirement benefits - 1,698 85,466 - 1,613 88,491
House rent 4,886 2,547 142,871 4,154 2,358 134,266
Conveyance 253 358 29,902 316 448 37,514
Leave benefits 991 542 34,843 853 506 33,647
21,752 13,136 725,223 16,689 11,361 658,857
Number of person(s) 1 1 377 1 1 372
2015 2014
(Rupees in thousand)
Chief Executive
FOR THE YEAR ENDED JUNE 30, 2015
NOTES TO AND FORMING PART OF THE FINANCIAL STATEMENTS

98 National Refi nery Limited
FINANCIAL INSTRUMENTS AND RELATED DISCLOSURESFinancial assets and liabilities
Maturity Maturity Sub total Maturity Maturity Sub total Totalup to one after one up to one after one
year year year year
Financial assetsLoans and receivablesLoans and advances 2,258 9,335 11,593 72,344 33,240 105,584 117,177 Deposits - - - 1,235 30,189 31,424 31,424 Trade debts - - - 7,253,035 - 7,253,035 7,253,035 Accrued interest - - - 32,240 - 32,240 32,240 Other receivables - - - 273,640 - 273,640 273,640 Cash and bank balances 17,202,486 - 17,202,486 70,458 - 70,458 17,272,944 Short term investments 123,543 - 123,543 - - - 123,543
2015 17,328,287 9,335 17,337,622 7,702,952 63,429 7,766,381 25,104,003
2014 11,624,498 7,458 11,631,956 10,753,613 64,217 10,817,830 22,449,786
Financial liabilitiesTrade and other payables 254,392 - 254,392 13,051,719 - 13,051,719 13,306,111
2015 254,392 - 254,392 13,051,719 - 13,051,719 13,306,111
2014 241,365 - 241,365 21,426,665 - 21,426,665 21,668,030
On balance sheet gap2015 17,073,895 9,335 17,083,230 (5,348,767) 63,429 (5,285,338) 11,797,892
2014 11,383,133 7,458 11,390,591 (10,673,052) 64,217 (10,608,835) 781,756
OFF BALANCE SHEET ITEMS
Commitments for capital expenditure 21,262,965 Letters of credit 15,097,871 Letters of guarantees 456,433
2015 36,817,269
2014 20,658,919
Financial risk management objectives and policies
Capital Risk Management
Concentration of credit risk
Credit risk represents the accounting loss that would be recognised at the reporting date ifcounterparties failed to perform as contracted. The financial assets that are subject to creditrisk amounted to Rs. 24.69 billion (2014: Rs. 19.08 billion).
(Rupees in thousand)
Interest/mark-up bearing Non-interest/mark-up bearing
The Company's objectives when managing capital are to safeguard the Company's ability tocontinue as going concern in order to provide returns for shareholders and benefit for otherstakeholders. As mentioned in note - 16.2, the Company operates under tariff protectionformula for fuel operations whereby profits after tax attributable to fuel segment in excess of50% of the paid up capital as of July 1, 2002 attributable to fuel segment are transferred tospecial reserve.
During the year, the Company has executed long term financing agreements to fund theDiesel De-sulphurisation and Naphtha Isomerisation projects.
36.2
36.1
36.
(i)
(ii)
FOR THE YEAR ENDED JUNE 30, 2015
NOTES TO AND FORMING PART OF THE FINANCIAL STATEMENTS

99Annual Report 2015
(iii) Foreign exchange risk
(iv) Liquidity risk
(v) Interest rate risk
(vi) Price risk
(vii) Fair values of financial assets and liabilities
The Company monitors its exposure to credit risk on an ongoing basis at various levels.The Company believes that it is not exposed to any major concentration of credit risk as itoperates in an essential products industry and has as customers only a few soundorganisations.
The Company manages liquidity risk by maintaining sufficient cash and bank balancesand the availability of financing through banking arrangements.
The Company is not exposed to any price risk with respect to its investments in TreasuryBills.
As at June 30, 2015, if the Pakistan Rupee had weakened / strengthened by 10% againstUS Dollar with all other variables held constant, profit before tax for the year would havebeen lower / higher by Rs. 0.11 billion (2014: Rs. 1.38 billion), mainly as a result offoreign exchange losses / gains on translation of US Dollar-denominated trade payablesand trade debts.
The carrying values of all financial assets and liabilities reflected in the financialstatements approximate their fair values.
Foreign currency risk arises mainly when receivables and payables exist due totransactions in foreign currencies primarily with respect to US Dollar. Financial assetsinclude Rs. 0.22 billion (2014: Nil) and financial liabilities include Rs. 1.28 billion(2014: Rs. 13.83 billion) which are subject to foreign currency risk. The Companybelieves that itis not materially exposed to foreign exchange risk as its product prices arelinked to the currency of its imports.
The carrying values of financial assets which are neither past due nor impaired are asunder:
Interest rate risk is the risk that the value of a financial instrument will fluctuate due tochanges in the market interest rates. The Company is exposed to cash flow interest raterisk on its syndicate term finance which is priced at 1.7% above six months KIBOR.
Liquidity risk reflects the Company's inability in raising funds to meet commitments.
2015 2014
Loans and advances 117,177 58,790 Deposits 31,424 33,453 Trade debts 7,252,851 10,197,243 Accrued interest 32,240 40,843 Other receivables 273,640 301,904 Short term investments 123,543 3,002,863 Cash and bank balances 17,272,944 8,804,865
25,103,819 22,439,961
(Rupees in thousand)
FOR THE YEAR ENDED JUNE 30, 2015
NOTES TO AND FORMING PART OF THE FINANCIAL STATEMENTS

100 National Refi nery Limited
37. SEGMENT INFORMATION
37.1
37.2
2015 2014 2015 2014 2015 2014
Segment RevenueSales to external customers
- local, net of discounts, taxes, duties, levies
and price differential 91,688,706 128,791,591 40,979,549 51,287,205 132,668,255 180,078,796
- exports 14,449,008 23,234,879 1,339,246 4,089,583 15,788,254 27,324,462
106,137,714 152,026,470 42,318,795 55,376,788 148,456,509 207,403,258
Inter-segment transfers 29,639,635 43,820,063 - - 29,639,635 43,820,063
Elimination of inter- segment transfers - - - - (29,639,635) (43,820,063)
Net sales 135,777,349 195,846,533 42,318,795 55,376,788 148,456,509 207,403,258
Segment results after tax (80,958) (2,835,105) 3,789,938 3,796,980 3,708,980 961,875
Other comprehensive income (56,304) 12,519 (112,608) 25,039 (168,912) 37,558
(137,262) (2,822,586) 3,677,330 3,822,019 3,540,068 999,433
Segment assets 26,480,454 31,513,855 19,618,154 19,702,044 46,098,608 51,215,899
Unallocated assets - - - - 1,964,042 1,560,253
Total assets 26,480,454 31,513,855 19,618,154 19,702,044 48,062,650 52,776,152
Segment liabilities 16,100,022 24,400,760 1,039,824 1,157,561 17,139,846 25,558,321
Unallocated liabilities - - - - 789,097 624,192
Total liabilities 16,100,022 24,400,760 1,039,824 1,157,561 17,928,943 26,182,513
Other Segment Information:
Capital expenditure 119,240 19,180 136,003 164,990 255,243 184,170
Unallocated capital expenditure - - - -
78,517 43,198
119,240 19,180 136,003 164,990 333,760 227,368
Depreciation and amortisation 129,701 109,799 218,548 217,392 348,249 327,191
Interest income 368,982 265,815 737,966 531,631 1,106,948 797,446
Interest expense - 635 - 1,269 - 1,904
Non-cash expenses
other than depreciation 8,721 (5,513) (3,142) (11,025) 5,579 (16,538)
Stock-in-trade written down 51,409 154,712 24,457 - 75,867 154,712
(Rupees in thousand)
FUEL LUBE TOTAL
The financial information regarding operating segments is as follows:
Total Comprehensive income / (loss)
The Company’s operating segments are organised and managed separately according tothe nature of production process for products and services provided, with each segmentrepresenting a strategic business unit. The fuel segment is primarily a diverse supplier offuel products and offers gasoline, diesel oils, and furnace oil. The lube segment mainlyprovides different types of lube base oils, asphalt, wax free oil and other petroleumproducts for different sectors of the economy. Inter-segment transfers are made atrelevant costs to each segment.
Segment results and assets include items directly attributable to a segment as well asthose that can be allocated on a reasonable basis. Unallocated assets include property,plant and equipment.
FOR THE YEAR ENDED JUNE 30, 2015
NOTES TO AND FORMING PART OF THE FINANCIAL STATEMENTS
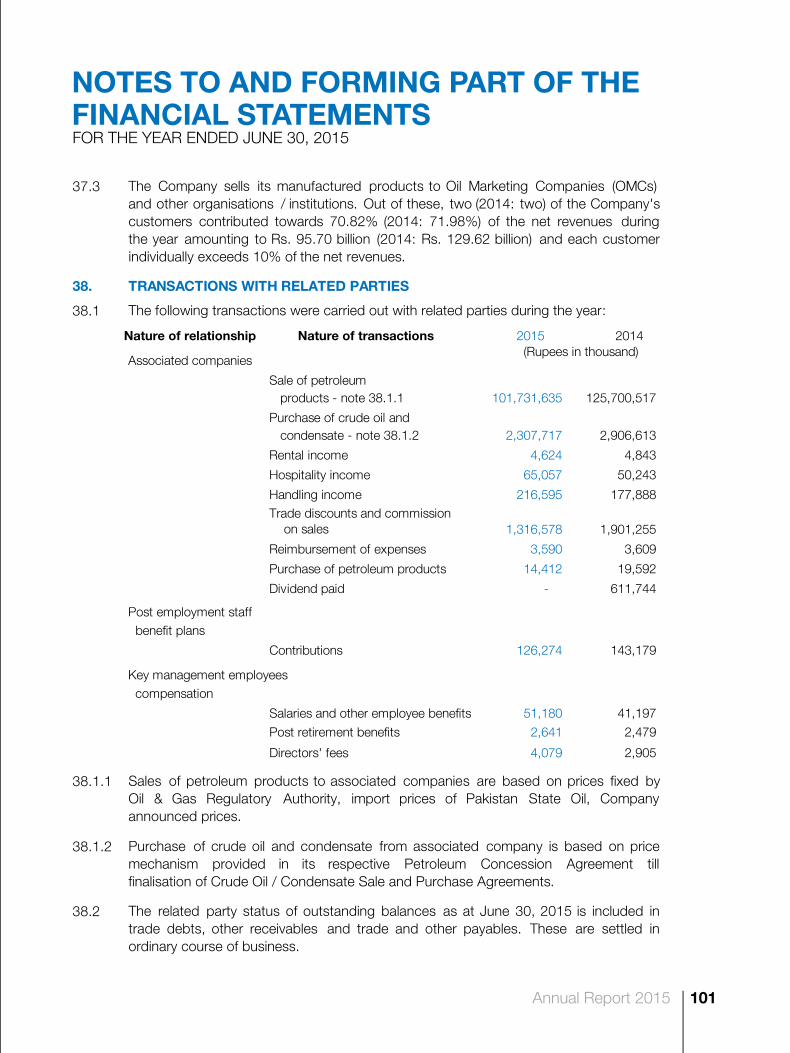
101Annual Report 2015
37.3
38. TRANSACTIONS WITH RELATED PARTIES
38.1 The following transactions were carried out with related parties during the year:
Nature of relationship Nature of transactions 2015 2014
Associated companies
Sale of petroleum products - note 38.1.1 101,731,635 125,700,517
Purchase of crude oil and condensate - note 38.1.2 2,307,717 2,906,613
Rental income 4,624 4,843
Hospitality income 65,057 50,243
Handling income 216,595 177,888 Trade discounts and commission on sales 1,316,578 1,901,255
Reimbursement of expenses 3,590 3,609
Purchase of petroleum products 14,412 19,592
Dividend paid - 611,744
Post employment staff benefit plans
Contributions 126,274 143,179
Key management employees compensation
Salaries and other employee benefits 51,180 41,197
Post retirement benefits 2,641 2,479
Directors' fees 4,079 2,905
38.1.1
38.1.2
38.2
Purchase of crude oil and condensate from associated company is based on pricemechanism provided in its respective Petroleum Concession Agreement tillfinalisation of Crude Oil / Condensate Sale and Purchase Agreements.
(Rupees in thousand)
Sales of petroleum products to associated companies are based on prices fixed byOil & Gas Regulatory Authority, import prices of Pakistan State Oil, Companyannounced prices.
The Company sells its manufactured products to Oil Marketing Companies (OMCs)and other organisations / institutions. Out of these, two (2014: two) of the Company'scustomers contributed towards 70.82% (2014: 71.98%) of the net revenues duringthe year amounting to Rs. 95.70 billion (2014: Rs. 129.62 billion) and each customerindividually exceeds 10% of the net revenues.
The related party status of outstanding balances as at June 30, 2015 is included intrade debts, other receivables and trade and other payables. These are settled inordinary course of business.
FOR THE YEAR ENDED JUNE 30, 2015
NOTES TO AND FORMING PART OF THE FINANCIAL STATEMENTS

102 National Refi nery Limited
Annual designed
throughputcapacity 2015 2014
39. CAPACITY
of crude oil - note 39.1 2,710,500 2,230,425 2,357,624
of reduced crude oil 620,486 629,716 684,021
39.1
40. PROVIDENT FUNDS RELATED DISCLOSURE
2015 2014
Size of the fund - Total assets 1,380,329 1,298,536
Fair value of investments 1,273,519 1,191,016
Percentage of investments made 92% 92%
40.1
40.2 The break-up of fair value of investments is as follows:
2015 2014 2015 2014
National savings scheme 64% 60% 820,610 709,230 Bank deposits 2% 4% 21,968 42,450 Government securities 10% 13% 125,263 152,478
Equity securities 1% 2% 19,904 24,848
Unit trust schemes 23% 21% 285,774 262,010
40.3
Reduction is due to day to day monitoring of throughput based on expected productmargins.
Actual throughput
Lube section - throughput
(In Metric Tons)
Percentage
(Rupees in thousand)
The investments out of provident fund have been made in accordance with theprovision of Section 227 of the Companies Ordinance, 1984 and the rulesformulated for this purpose.
The cost of above investments amounted to Rs. 1,053.4 million (2014: Rs. 1,072.3 million).
(Rupees in thousand)
Fuel section - throughput
The following information is based on un-audited financial statements of the Fundsas at June 30, 2015:
FOR THE YEAR ENDED JUNE 30, 2015
NOTES TO AND FORMING PART OF THE FINANCIAL STATEMENTS
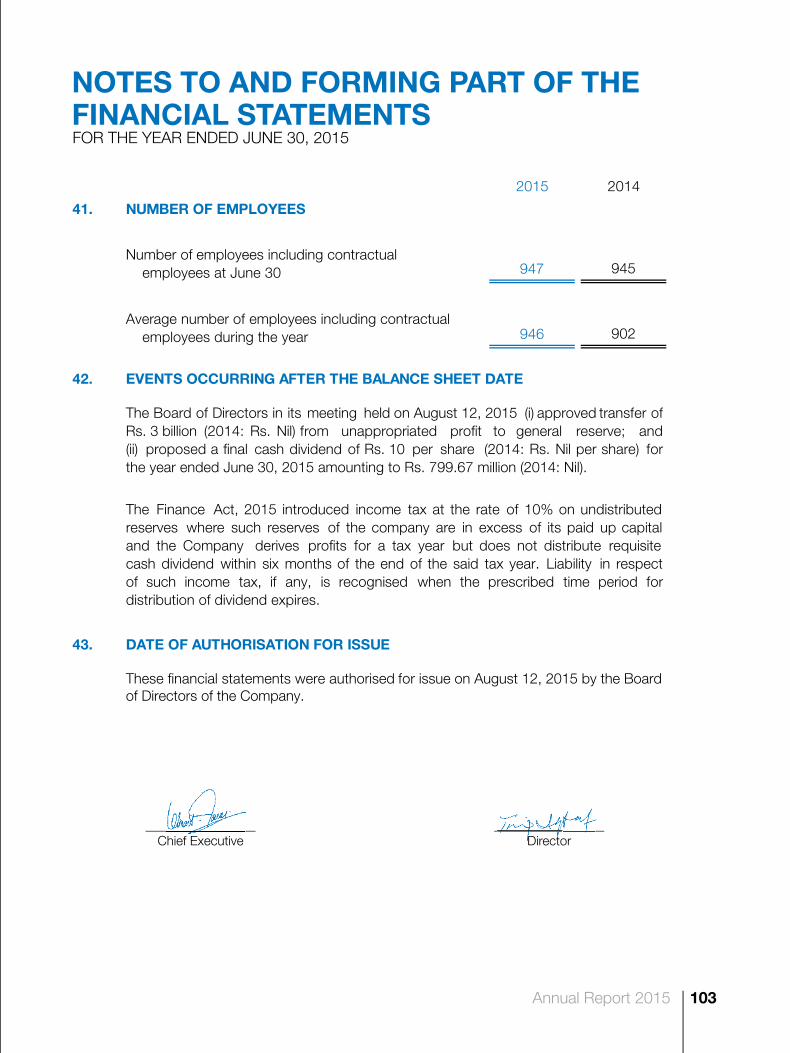
103Annual Report 2015
2015 2014
41. NUMBER OF EMPLOYEES
947 945
946 902
42. EVENTS OCCURRING AFTER THE BALANCE SHEET DATE
43. DATE OF AUTHORISATION FOR ISSUE
Number of employees including contractual employees at June 30
Average number of employees including contractual employees during the year
These financial statements were authorised for issue on August 12, 2015 by the Boardof Directors of the Company.
The Board of Directors in its meeting held on August 12, 2015 (i) approved transfer ofRs. 3 billion (2014: Rs. Nil) from unappropriated profit to general reserve; and(ii) proposed a final cash dividend of Rs. 10 per share (2014: Rs. Nil per share) forthe year ended June 30, 2015 amounting to Rs. 799.67 million (2014: Nil).
The Finance Act, 2015 introduced income tax at the rate of 10% on undistributedreserves where such reserves of the company are in excess of its paid up capitaland the Company derives profits for a tax year but does not distribute requisitecash dividend within six months of the end of the said tax year. Liability in respectof such income tax, if any, is recognised when the prescribed time period fordistribution of dividend expires.
FOR THE YEAR ENDED JUNE 30, 2015
NOTES TO AND FORMING PART OF THE FINANCIAL STATEMENTS
Chief Executive Director

104 National Refi nery Limited

105Annual Report 2015
PATTERN OF SHARE HOLDING NOTICE & FORMS

106 National Refi nery Limited106 National Refi nery Limited

107Annual Report 2015
PATTERN OF SHAREHOLDINGAS AT JUNE 30, 2015 Form-34
From ToNUMBER OF SHARES NO. OF
SHAREHOLDERSNUMBER OF SHARES
HELD % ON ISSUED
0.060.390.522.391.270.710.620.680.250.330.240.160.180.200.220.160.170.460.100.310.330.120.500.140.160.170.350.380.190.200.230.470.260.290.300.340.430.440.450.450.560.570.590.630.800.861.001.051.081.091.454.495.21
15.0050.00
100.00
48,571313,025416,358
1,910,8891,012,762563,295500,747565,367196,395263,342190,912131,116144,300158,000176,406126,317134,829366,47879,700
250,411262,60093,900
398,000115,600125,000132,385282,700300,000150,800158,700184,200376,460205,000233,285240,000268,658341,600350,000358,596361,185445,584455,400474,000502,363635,900684,200799,665841,800869,554870,055
1,161,6003,589,8194,165,451
12,000,00039,983,280
79,966,560
1,5261,15253882113845282478533332251331411122111211111111111111111111112
4,361
100500
1,0005,000
10,00015,00020,00025,00030,00035,00040,00045,00050,00055,00060,00065,00070,00075,00080,00085,00090,00095,000
100,000120,000125,000135,000145,000150,000155,000160,000185,000190,000205,000235,000240,000270,000345,000350,000360,000365,000450,000460,000475,000505,000640,000685,000800,000845,000870,000875,000
1,165,0003,590,0004,170,000
12,000,00019,995,000
1101501
10015,001
10,00115,00120,00125,00130,00135,00140,00145,00150,00155,00160,00165,00170,00175,00180,00185,00190,00195,001
115,001120,001130,001140,001145,001150,001155,001180,001185,001200,001230,001235,001265,001340,001345,001355,001360,001445,001455,001470,001500,001635,001680,001795,001840,001865,001870,001
1,160,0013,585,0014,165,001
11,995,00119,990,001
107Annual Report 2015

108 National Refi nery Limited
CATEGORIES OF SHAREHOLDINGAS AT JUNE 30, 2015
79,966,560 79966560
Percentage Number of Number of
% Shareholders Shares held
Directors, Chief Executive Officer, and their spouse(s)
and minor children
Associated Companies
NIT and ICP
Banks, Development Financial Institutions and
Non Banking Financial Institutions
Insurance Companies
Modarabas and Mutual Funds
Shareholders holding 10% - Islamic Development Bank
General Public:
a. Local
b. Foreign
Joint Stock Companies
Foreign Investors - other than Individual
Others
Categories
INFORMATION REQUIRED UNDER CODE OF
CORPORATE GOVERNANCE
Associated Companies
Attock Refinery Limited 19,991,640
Pakistan Oilfields Limited 19,991,640
Mutual Funds (as per LOBO* from CDC)
CDC-Trustee MCB Pakistan Stock Market Fund 341,600
CDC-Trustee Pakistan Strategic Allocation Fund 100
CDC-Trustee Meezan Balanced Fund 2,500
CDC-Trustee Alfalah GHP Value Fund 54,500
CDC-Trustee AKD Index Tracker Fund 5,560
CDC-Trustee Al Meezan Mutual Fund 1,800
CDC-Trustee Meezan Islamic Fund 3,056
CDC-Trustee NAFA Stock Fund 184,200
CDC-Trustee NAFA Multi Asset Fund 18,300
CDC-Trustee Alfalah GHP Islamic Stock Fund 52,500
CDC-Trustee NAFA Islamic Asset Allocation Fund 70,400
CDC-Trustee KASB Asset Allocation Fund 75,000
CDC-Trustee MCB Pakistan Asset Allocation Fund 2,200
CDC-Trustee Alfalah GHP Stock Fund 141,900
CDC-Trustee Alfalah GHP Alpha Fund 79,700
CDC-Trustee Crosby Dragon Fund 24,600
CDC-Trustee NAFA Asset Allocation Fund 17,300
CDC-Trustee NAFA Pension Fund Equity Sub-Fund Account 12,900
CDC-Trustee NAFA Islamic Pension Fund Equity Account 14,400
CDC-Trustee NAFA Islamic Principal Protected Fund - II 85,100
CDC-Trustee NAFA Islamic Stock Fund 59,700
CDC-Trustee NIT-Equity Market Opportunity Fund 870,055
CDC-Trustee National Investment (Unit) Trust 4,165,451
NH Capital Fund Ltd 1,200
* List of Beneficial Owner Report
0.03 7 20,008
50.00 2 39,983,280
7.40 8 5,917,627
2.75 28 2,200,704
6.13 8 4,899,189
1.61 26 1,291,016
15.00 1 12,000,000
9.40 4,120 7,522,479
0.29 73 229,423
1.10 13 876,281
3.86 11 3,085,502
2.43 64 1,941,051
100.00 4,361 79,966,560

109Annual Report 2015
CategoriesPercentage
%
Number of
Shares held
Directors, Chief Executive Officer,
their spouse(s) and minor children
Dr. Ghaith R. Pharaon 1
Mr. Laith G. Pharaon 1
Mr. Wael G. Pharaon 1
Mr. Shuaib A. Malik 2
Mr. Tariq Iqbal Khan 20,001
Mr. Babar Bashir Nawaz 1
Mr. Abdus Sattar 1
Executives 1,598
Public Sector Companies and Corporations 4,964,420
Banks, DFIs, NBFCs, Insurance Companies,
Takaful, Modarabas & Pension Funds 7,808,324
Shareholders holding 5% or more
voting interest
Attock Refinery Limited 25% 19,991,640
Pakistan Oilfields Limited 25% 19,991,640
Islamic Development Bank 15% 12,000,000
NIT & ICP 7% 5,917,627
Trade in the shares of the Company carried out by
directors, executives, their spouse(s) and minor children
The expression “executive” means the CEO, CFO, Head of Internal Audit, Company Secretary and otheremployees of the Company drawing annual basic salary of Rs.738,000 including all employees of
Finance Divison.
One of the executives has purchased 500 shares of the company during the year.

110 National Refi nery Limited
Notice is hereby given that the Fifty Second (52nd) Annual General Meeting of National Refi nery Limited will be held on Monday, September 21, 2015 at 1600 hours at Marriott Hotel, Karachi to transact the following business:
ORDINARY BUSINESS
1. To receive, consider and approve the Audited Accounts of the Company for the year ended June 30, 2015 together with the Directors’ Report and the Auditors’ Report thereon.
2. To consider and, if thought fi t, to approve the payment of Final Cash Dividend at the rate of Rs.10/- per share i.e. 100% for the year ended June 30, 2015 as recommended by the Board of Directors.
3. To appoint Company’s auditors for the year ending June 30, 2016 and to fi x their remuneration.
4. Any other business with the permission of the Chair.
Karachi:Dated: August 31, 2015
NOTES:
1. The Register of Members of the Company will remain closed and no transfer of shares will be accepted for registration from September 11, 2015 to September 21, 2015 (both days inclusive). Transfers received in order at the offi ce of the Share Registrar:
THK Associates (Pvt.) Ltd., Second Floor, State Life Building-3, Dr. Ziauddin Ahmed Road, Karachi-75530, Telephone No. 021-111-000-322, Fax No. 0213-5655595, Email: [email protected]
at the close of business on September 10, 2015 will be in time for the purpose of determination of entitlement to the transferees.
2. A member entitled to attend, speak and vote at the Annual General Meeting is entitled to appoint a proxy to attend, speak and vote instead of him/her. A proxy need not be a member.
Proxy in order to be effective must be duly signed, witnessed and deposited at the offi ce of the Share Registrar not less than 48 hours before the meeting.
3. The shareholder/proxy shall produce his/her original CNIC or passport at the time of the meeting.
4. Shareholders are requested to promptly notify the offi ce of the Share Registrar of any change in their addresses.
NOTICE OF ANNUAL GENERAL MEETING
By Order of the Board
Nouman Ahmed UsmaniCompany Secretary

111Annual Report 2015
5. CDC account holders will further have to follow the under mentioned guidelines as laid down in Circular 1 dated January 26, 2000 issued by the Securities and Exchange Commission of Pakistan.
A. For attending the meeting:
(i) In case of individuals, the account holder or sub-account holder and/or the person whose securities are in group account, and their registration details are uploaded as per the Regulations, shall authenticate his identity by showing his original Computerised National Identity Card (CNIC) or original passport at the time of attending the Meeting.
(ii) In case of corporate entity, the Board of Directors’ resolution/power of attorney with specimen signature of the nominee shall be produced (unless it has been provided earlier) at the time of the Meeting.
B. For appointing proxies:
(i) In case of individuals, the account holder or sub-account holder and/or the person whose securities are in group account, and their registration details are uploaded as per the CDC Regulations, shall submit the proxy form as per the above requirement.
(ii) The proxy form shall be witnessed by two persons whose names, addresses and CNIC numbers shall be mentioned on the form.
(iii) Attested copies of CNIC or the passport, of the benefi cial owners and the proxy shall be furnished with the proxy form.
(iv) The proxy shall produce his original CNIC or original passport at the time of the Meeting.
(v) In case of corporate entity, the Board of Directors’ resolution/power of attorney with specimen signature shall be submitted (unless it has been provided earlier) along with proxy form to the Company.
6. Form of proxy is attached to the notice of meeting being sent to the members.
7. In compliance with the directives issued by the Securities and Exchange Commission of Pakistan and/or Federal Board of Revenue from time to time, members who have not yet provided their dividend mandate information and/or CNIC and/or NTN (as the case may be) are requested to kindly provide the same at the earliest as follows:
• The shareholders who hold Company’s shares in physical form are requested to submit the above information to the Share Registrar at the address mentioned above.
• Shareholders maintaining their shareholdings under Central Depository System (CDS) are advised to submit the above information directly to relevant Participant/CDC Investor Account Service.
Members are also requested to update their tax paying status (Filer/Non-Filer) to the Company’s Share Registrar.

112 National Refi nery Limited
The above information may please be provided as follows:
This would enable us to process future dividend payments, if any, in accordance with the tax payment status of the members in pursuant to the provisions of Finance Act, 2015, effective July 1, 2015 whereby the rates of deduction of income tax under Section 150 of the Income Tax Ordinance, 2001 from dividend payment have been revised as follows:
1. Rate of tax deduction for fi ler of income tax returns 12.5% 2. Rate of tax deduction for non-fi lers of income tax return 17.5%
The audited fi nancial statement of the Company for the year ended June 30, 2015 have been placed at the Company’s website www.nrlpak.com
Folio/CDC ID/AC#
Name National Tax #CNIC #
(in case of individuals)
Income tax return for the year 2014 fi led (Yes or No)

FORM OF PROXY52nd Annual General Meeting
NATIONAL REFINERY LIMITED
I ______________________________________ of ____________________________________in the
district of ______________________________ being a Member of NATIONAL REFINERY LIMITED
hereby appoint _________________________________ of ________________________ as my proxy,
and failing him, ____________________ of _____________________ another Member of the Company
to vote for me and on my behalf at the 52nd Annual General Meeting of the Company to be held on
the 21st day of September 2015 and at any adjournment thereof.
Signed this _________ day of __________ 2015. Signed by the said Member
Signed in the presence of:
1. Signature: _____________________ 2. Signature: _______________________ Name: _______________________ Name: ________________________
Address: _____________________ Address: _______________________ CNIC/Passport No.______________ CNIC/Passport No._______________

Notes:
1. A member entitled to attend and vote at Annual General Meeting is entitled to appoint a proxy to attend and vote instead of him/her. A proxy need not be a member.
2. This Proxy Form, duly completed and signed, together with Board Resolution / Power of Attorney, if any, under which it is signed or a notarially certified copy thereof, should be deposited, with our Share Registrar, THK Associates (Pvt.) Ltd., 2nd Floor, State Life Building-3, Dr. Ziauddin Ahmed Road, Karachi-75530, Telephone No. 021-111-000-322, not later than 48 hours before the time of holding the meeting.
3. The instrument appointing a proxy should be signed by the member or his/her attorney duly authorized in writing. If the member is a corporate entity its common seal should be affixed on the instrument.
4. Any alteration made in this instrument of proxy should be initialled by the person who signs it.
5. Attested copies of CNIC or the passport of the beneficial owners and of the proxy shall be provided with the proxy form.
6. If a member appoints more than one proxy and more than one instruments of proxies are deposited by a member with the Company, all such instruments of proxy shall be rendered invalid.
7. In the case of joint holders the vote of the senior who tenders a vote whether in person or by Proxy will be accepted to the exclusion of the votes of the other joint holders, and for this purpose seniority will be determined by the order in which the names stand in the Register of Members.
8. The proxy shall produce his / her original CNIC or passport at the time of the meeting.
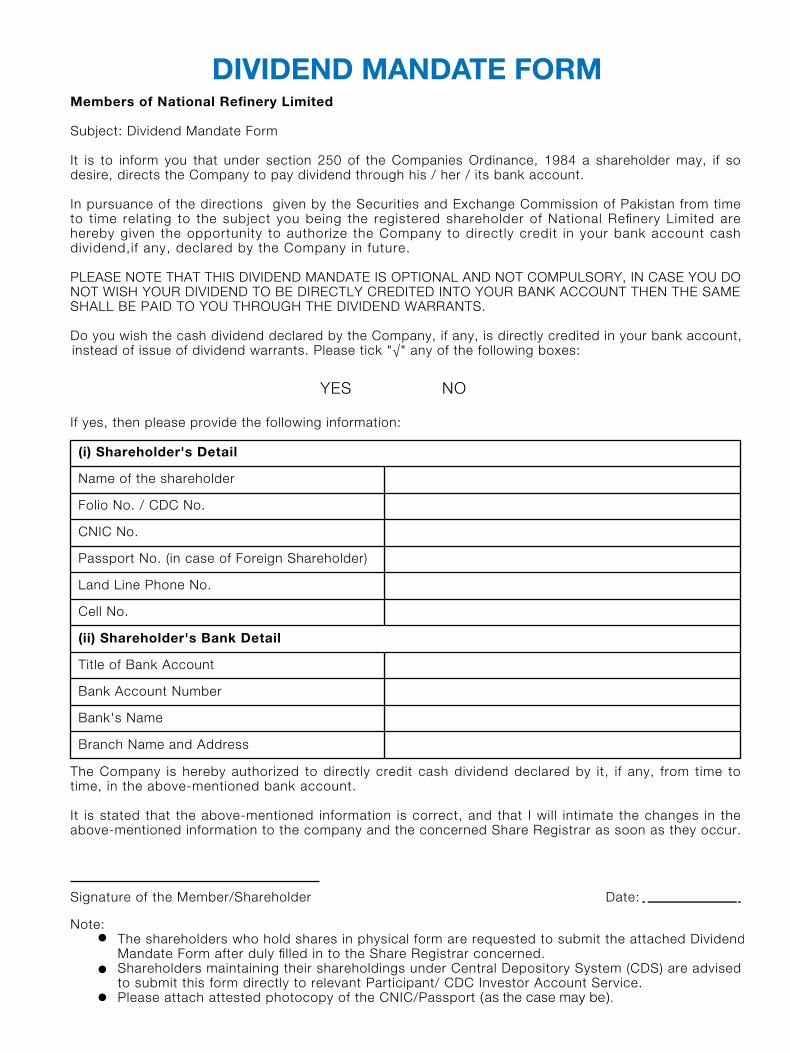
DIVIDEND MANDATE FORM


7-B, Korangi Industrial Area, P.O. Box 8228, Karachi-74900UAN No. 111-675-675 Fax: +92-21 35054663, +92-21 35066705
Website: www.nrlpak.com E-mail: [email protected]
National Refinery Limited