vision zero task force february 28, 2017
TRANSCRIPT

Vision Zero Task Force
Collision Landscape Analysis
February 28, 2017
Welcome!
What happened since our last Task Force meeting:
• City Council adopted the Vision Zero Resolution
• Applied for an OTS grant for a
Vision Zero Safety and Outreach Campaign
• Data analysis

Updated Schedule
October 2016: Introduction and Purpose (done)
November 2016: Guiding Principles (done)
February 2017: Data Analysis
March-April 2017: Collision Profiles
June 2017: Draft Actions, Engineering
June 2017: Draft Actions, Non-Engineering
August 2017: Draft Action Plan
Today’s Agenda
1. Review data analysisa. Trends
b. Location
c. Vulnerable populations
d. Behavior
2. Breakout discussion
3. Next steps

About the Data
Transportation Injury Mapping System (TIMS)
• Injury collisions only (not property damage)
• 2009 – 2013 (2014 and 2015 data is provisional)
• Does not include state highway facilities
• Only includes collisions within the City of Sacramento
Key Terms
• “KSI” = killed or severely injured
• “vehicle” includes motorcycle and truck, unless otherwise
stated

TRENDS

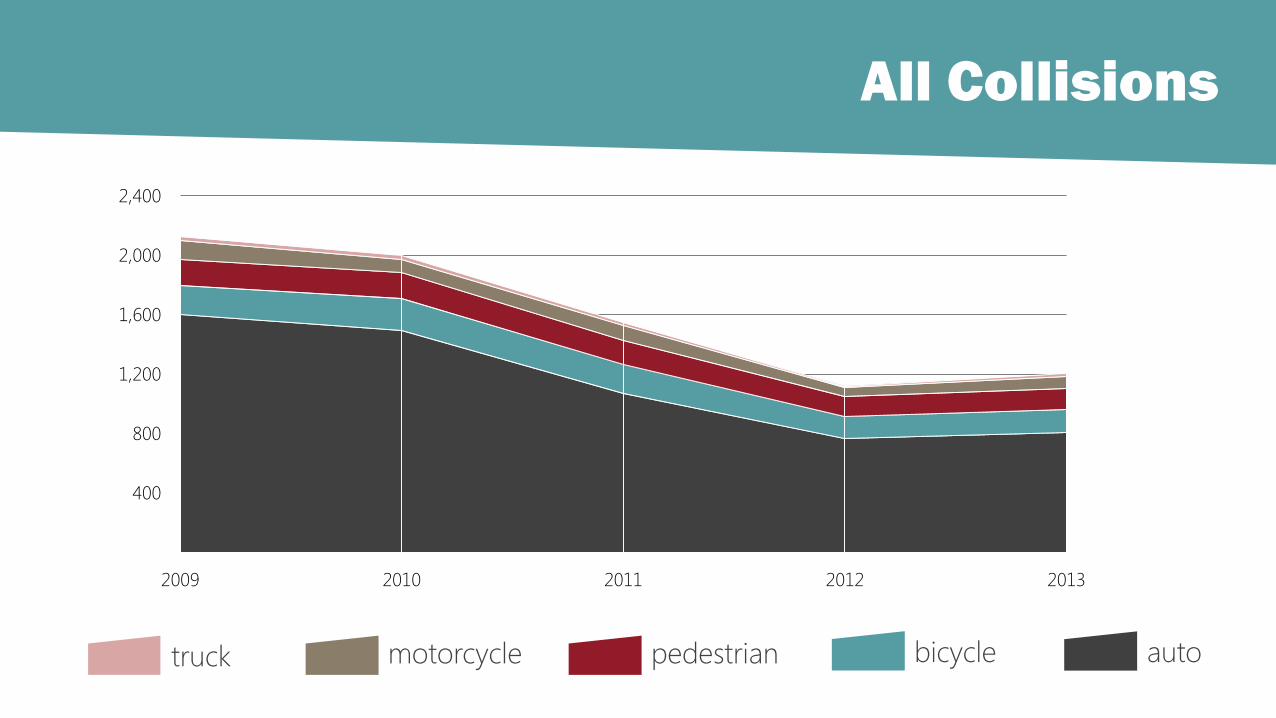
All Collisions
519 collisions with victims killed or severely
injured (KSI) between 2009 and 2013
non-KSI KSI
All Collisions
truck auto
400
800
1,200
1,600
2,000
2,400
2009 2010 2011 2012 2013
motorcycle pedestrian bicycle

Over the same period of time, the number of
collisions with victims killed or severely injured
increased by 7%
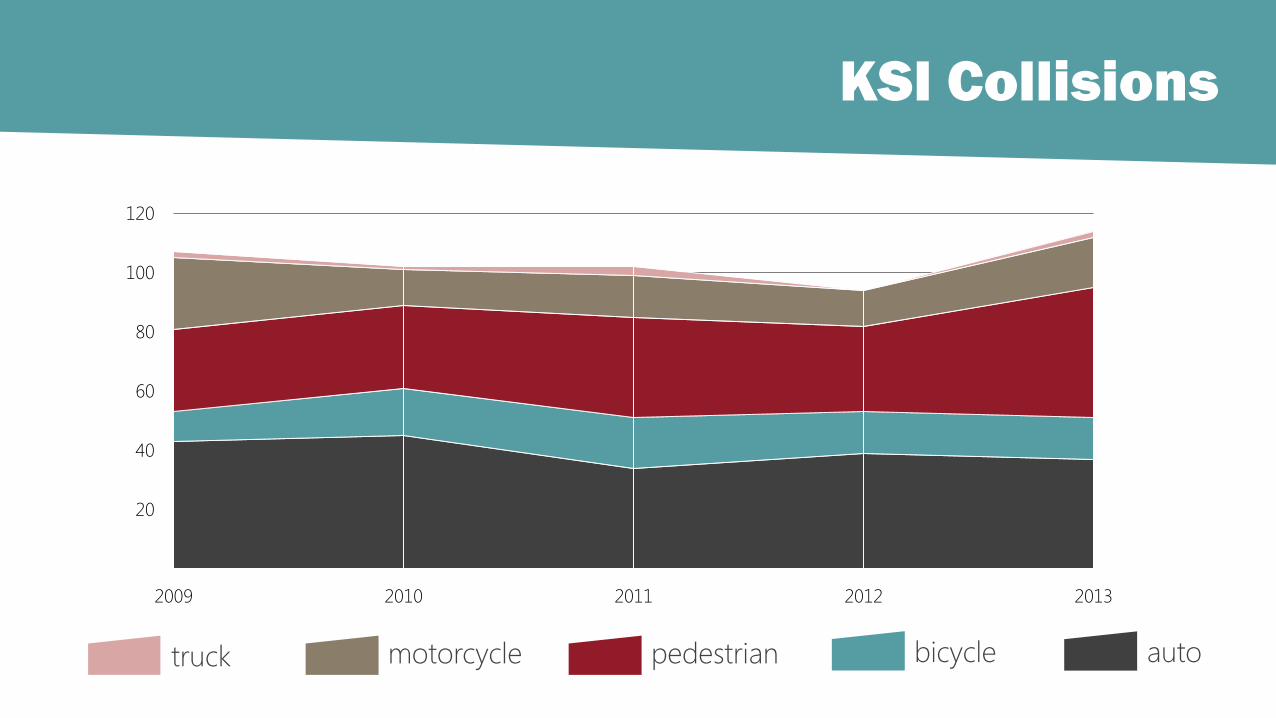
KSI Collisions
truck automotorcycle pedestrian bicycle
20
40
60
80
100
120
2009 2010 2011 2012 2013
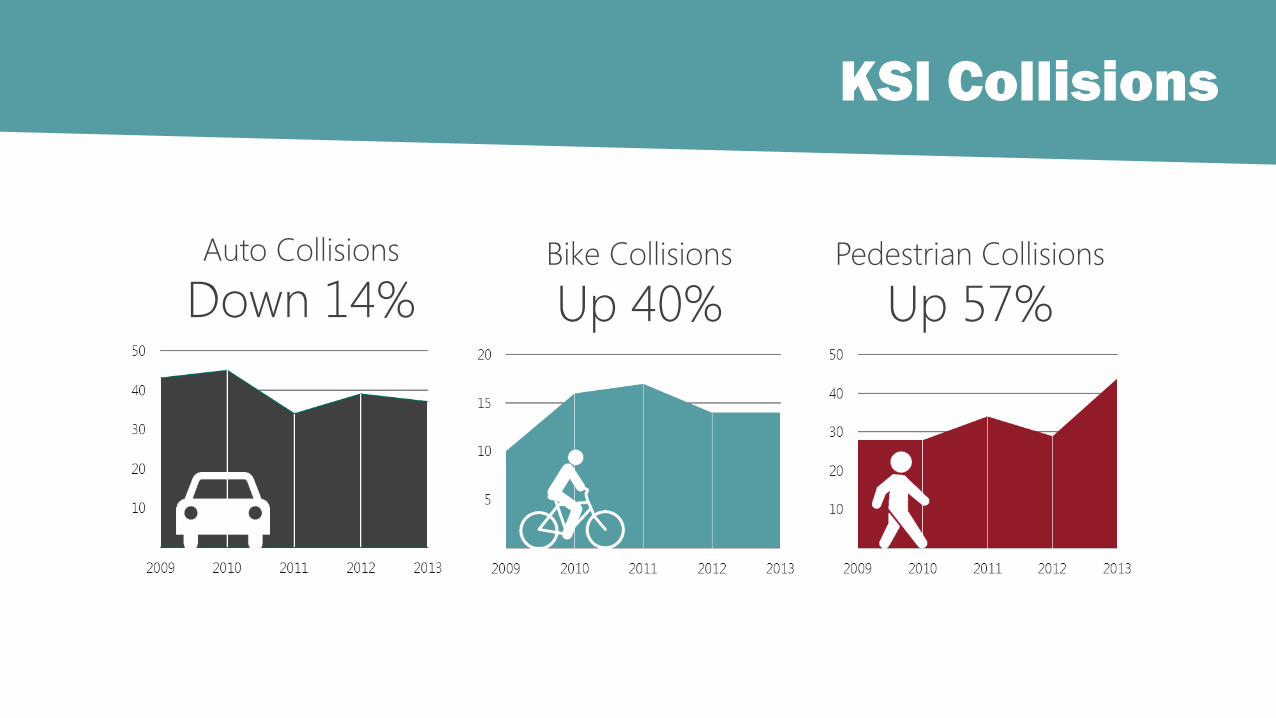
KSI Collisions
Auto Collisions
Down 14%Bike Collisions
Up 40%Pedestrian Collisions
Up 57%
Pedestrian collisions account for 10% of all collisions, but 43% of
fatal collisions
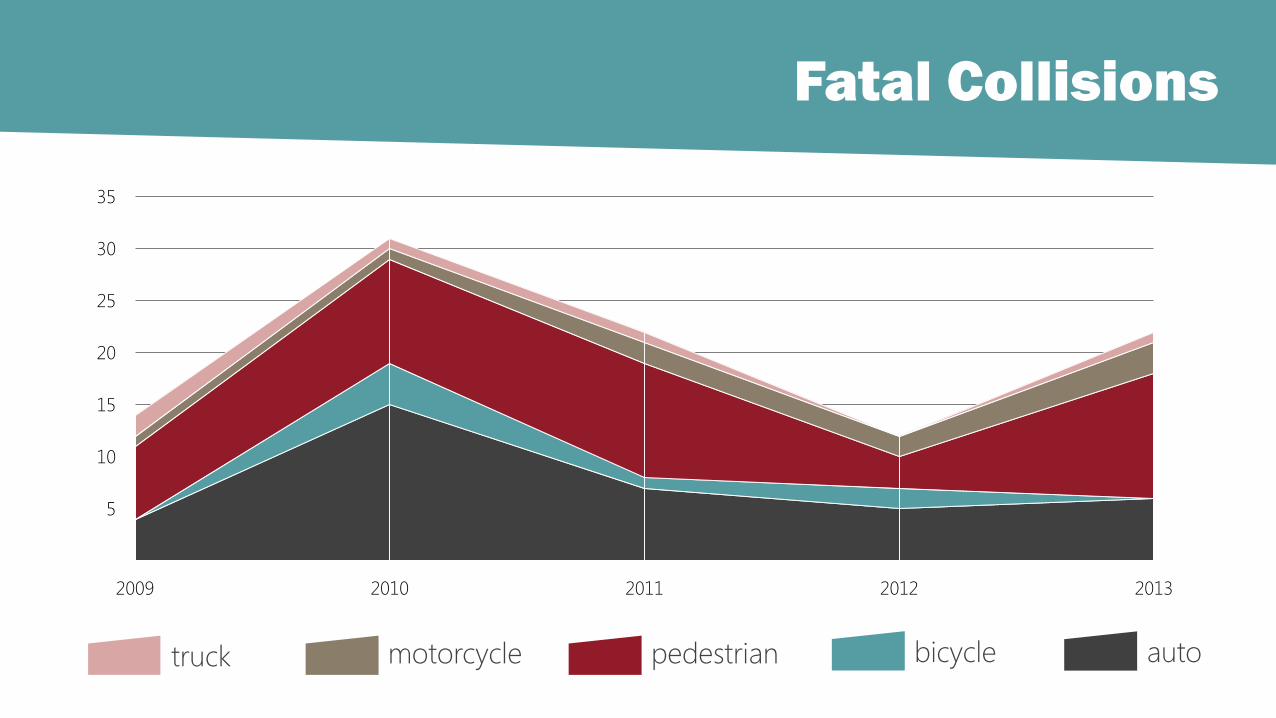
Fatal Collisions
truck automotorcycle pedestrian bicycle
5
10
15
20
25
30
35
2009 2010 2011 2012 2013

Mode Split
vehiclepedestrian bicycle
79%
11%
10%
84%
3% 13%
55%
14%
31%
50%
7%
43%
ALL TRIPS*
ALLCOLLISIONS
FATALCOLLISIONS
KSICOLLISIONS
*2012 California Household Travel Survey, City of Sacramento

LOCATION

High Injury Network
ALL COLLISIONS
The HIN accounts for
64% of all collisions,
on 11% of the
roadway network

Commercial Areas
non-commercial areascommercial areas
KSI CollisionsTotal Roadway
Network
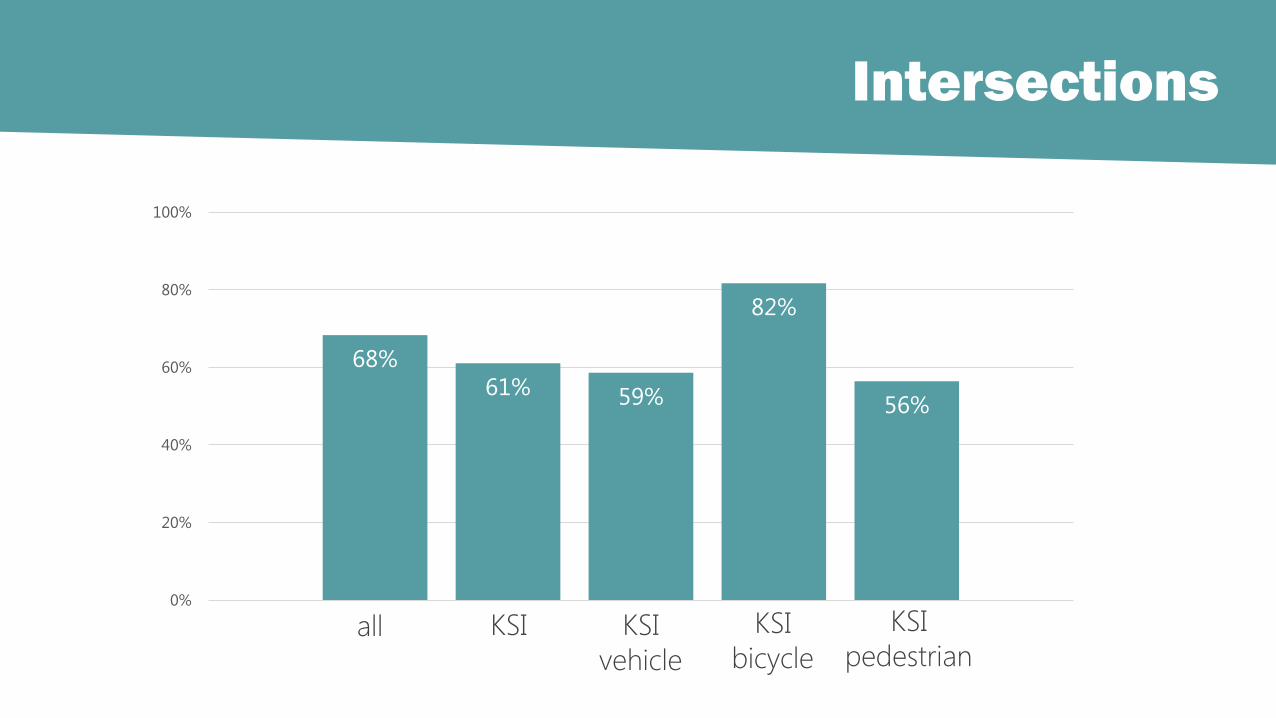
Intersections
KSIall KSI
vehicle
KSI
pedestrianKSI
bicycle
68%
61% 59%
82%
56%
0%
20%
40%
60%
80%
100%

60% of fatal collisions occur on streets with posted speed 40+ mph. These
streets account for less than 10% of street network.

Posted Speeds
40-45 mph 50+ mph30-35 mph25 mph and under
79%
16% 18% 16%20% 19%
10%
12%
44% 40% 40%
46%
39%
29%
8%
36% 39% 41%
30%40%
56%
0%
20%
40%
60%
80%
100%
Total Miles All Collisions KSI Collisions KSI Vehicle
Collisions
KSI Bike Collisions KSI Ped Collisions Fatal Collisions

Roadway Types
minor collectors local/othermajor collectorsarterials
13%
70% 65% 64% 62% 67% 67%
11%11% 10% 11%
14% 19%7%
8% 11%
7%
77%
13% 16% 15%21%
14%7%
0%
20%
40%
60%
80%
100%
Share of Roadway
Network
All Collisions KSI Collisions Vehicle KSI
Collisions
Bike KSI Collisions Pedestrian KSI
Collisions
Fatal Collisions
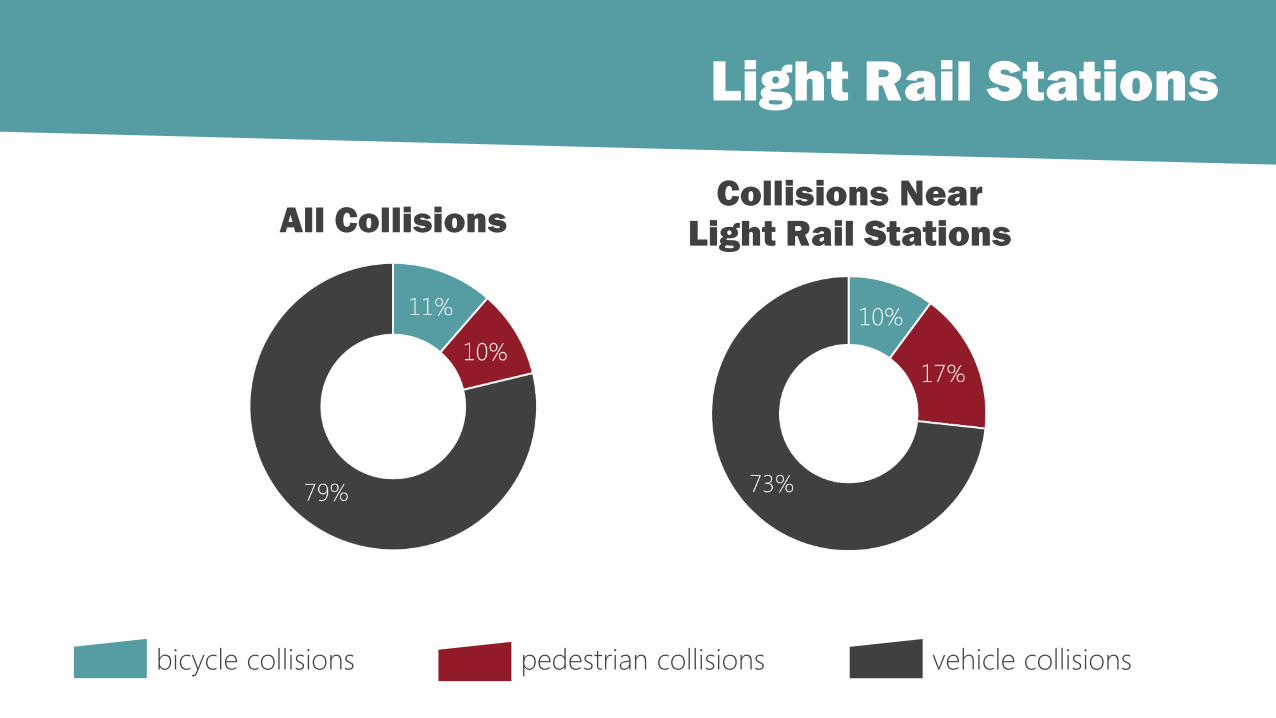
Light Rail Stations
vehicle collisionspedestrian collisionsbicycle collisions
All CollisionsCollisions Near
Light Rail Stations

VULNERABLE POPULATIONS
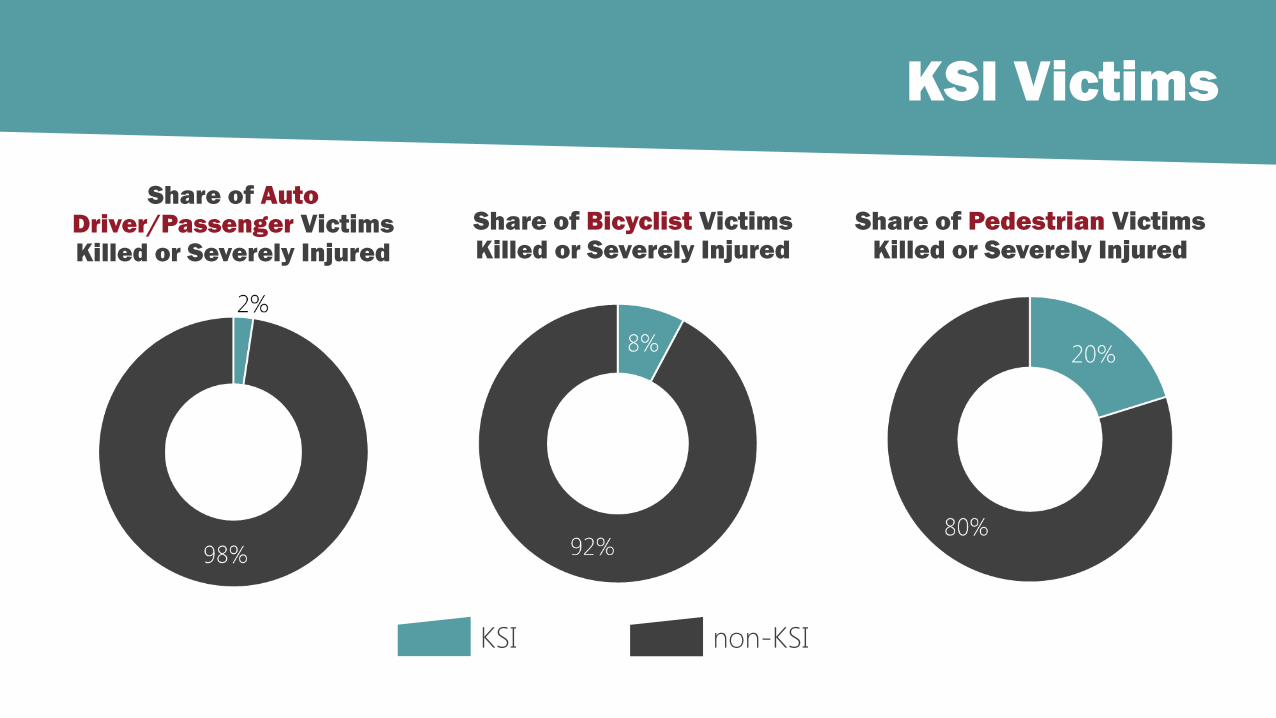
KSI Victims
Share of Auto Driver/Passenger Victims Killed or Severely Injured
Share of Pedestrian Victims Killed or Severely Injured
Share of Bicyclist Victims Killed or Severely Injured
non-KSIKSI

People age 60 and older account for less than 10% of
all collisions, but over 25% of KSI pedestrian collisions

Age
20-59 60+under 19
27% 25% 25%14% 16% 19%
16%9% 6%
11%
26%13%
57%66% 68%
75%
58%69%
0%
20%
40%
60%
80%
100%
Total Population All Victims Bicyclist Victims KSI Driver and
Passenger Victims
KSI Pedestrian Victims KSI Bike Victims
Disadvantaged communities account for ¼ of street
network, but nearly half of fatal collisions

Disadvantaged Communities
CalEnviroScreen 2.0 Disadvantaged Communities are defined under Senate Bill 535 as the top 25% census tracts within the State of California with the highest CalEnviroScreen 2.0
score. The score takes into account indicators related to environmental exposure and effects, sensitive populations, and socioeconomic factors.
non-disadvantaged
communities
disadvantaged
communities
25%38% 39% 37% 32%
46% 48%
75%62% 61% 63% 68%
54% 52%
0%
20%
40%
60%
80%
100%
Share of Roadway
Network
All Collisions KSI Collisions Vehicle KSI
Collisions
Bike KSI Collisions Pedestrian KSI
Collisions
Fatal Collisions

HIN in Disadvantaged Communities
38% of the HIN falls within disadvantaged communities

BEHAVIOR

Alcohol Involved
no alcohol involvedalcohol involved
All Collisions KSI Collisions
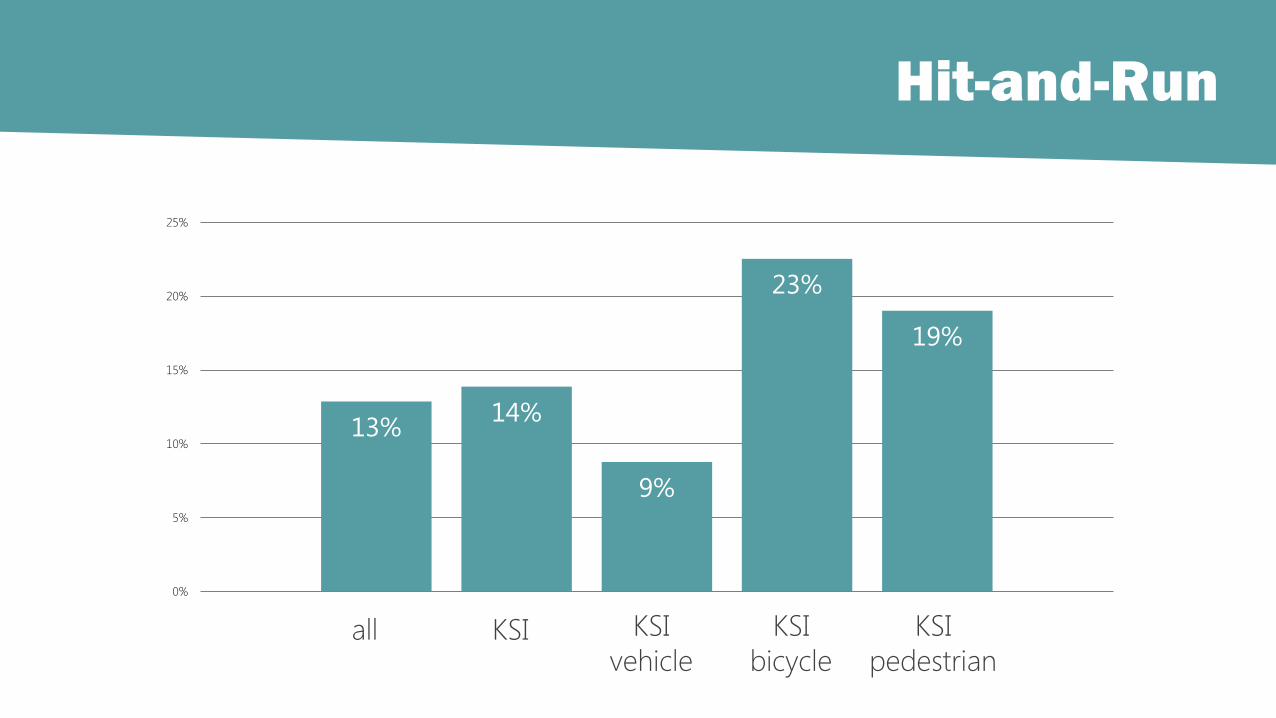
Hit-and-Run
KSIall KSI
vehicle
KSI
pedestrian
KSI
bicycle
13%14%
9%
23%
19%
0%
5%
10%
15%
20%
25%

Top Violation for all collisions: Unsafe Speed (25%)
Under the influence: 22% of KSI vehicle collisions
Wrong side of road: 18% of KSI bike collisions
Pedestrian violation: 46% of KSI pedestrian
collisions

Driver Action
otherproceeding
straightleft turnright turn
56%62% 59%
65%70%
14%13%
14%
19%8%
26% 23% 26%
9%18%
0%
20%
40%
60%
80%
100%
Drivers in All Collisions Drivers in KSI Collisions Drivers in KSI Vehicle
Collisions
Drivers in KSI Bike
Collisions
Drivers in KSI Pedestrian
Collisions
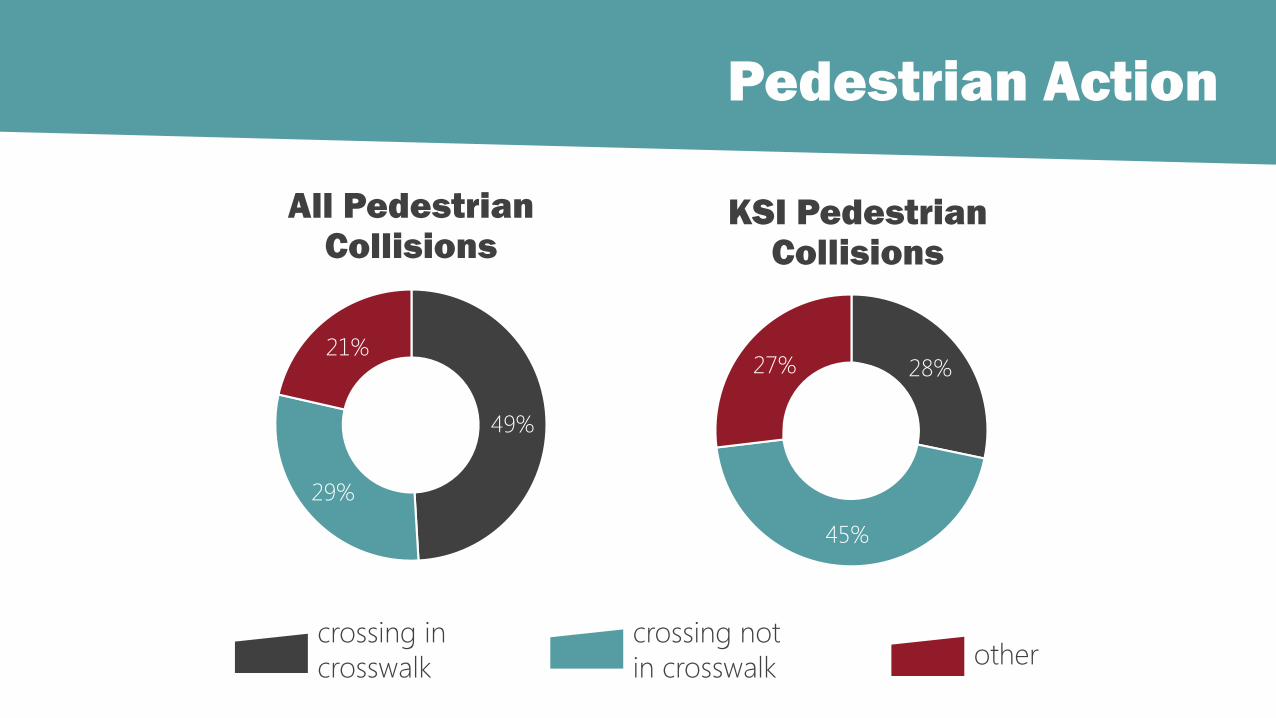
Pedestrian Action
49%
29%
21%28%
45%
27%
crossing in
crosswalk othercrossing not
in crosswalk
All Pedestrian Collisions
KSI Pedestrian Collisions

Bicyclist Action
73%
2%
5%
7%
13%
67%3%
7%
7%
16%
All Bicycle Collisions
KSI Bicycle Collisions
otherproceeding
straight
traveling
wrong wayleft turnright turn
Breakout Discussion
• What was unexpected?
• Which findings do you think the community will find
most compelling?
• Which findings make you want to learn more?
• What follow-up questions do you have?

Next Steps
March-April 2017: Collision Profiles
June 2017: Draft Actions, Engineering
June 2017: Draft Actions, Non-Engineering
August 2017: Draft Action Plan