visions 2050 summary b5 eng - vtt.fi | vtt · 3 in june 2009, vtt technical research centre of...
TRANSCRIPT

Summary
www.vtt.fi
Radical greenhouse gas emission reductions are needed in order to mit-igate climate change. The energy sector is the main source of green-house gases, so revolutionary changes in the global energy system, which today is mainly based on fossil fuels, are essential. Global en-ergy demand is forecast to continue growing in the coming decades, especially in the developing economies. This growing demand, accom-panied by depleting and geographically concentrated fossil fuel re-sources, will highlight the importance of energy security in the future.
Energy Visions 2050 considers measures for addressing the enormous future challenges facing the energy sector, focusing on technological and techno-economic perspectives. The topics are approached from a global perspective. In some technological details, however, Finnish technology and Finland’s technological achievements are highlighted. This summary presents highlights and key messages of the results of the book. The analysis of the development of technologies covers the whole energy chain, highlighting the necessity of effi cient energy use in all activities of societies. The contents include a discussion on potential future low-emission and renewable energy conversion technologies, as well as new technology solutions in the industrial, building and transport sectors and in energy supply systems. The move towards zero-emission energy systems has consequences for energy supply, and makes the analysis of energy resources presented in the book all the more valuable.
Scenarios of alternative development paths to 2050 are presented, assum-ing different technological development options, economic growth rates, degrees of globalisation and information fl ows. The results show interest-ing differences between the scenarios with regard to energy production and use, mitigation of greenhouse gas emissions, and global warming.
Summary
EnErgy Visions 2050 - summary
VTT Technical Research Centre of Finland published a book entitled ‘Energy Visions 2050’ in June 2009. The book deals with the long-term (by 2050) development of the energy sector from a global perspective. It includes assessments of technology development and future technologies throughout the energy system, i.e. energy resources, energy conversion, transmission, distribution and end-use.
The book presents energy scenarios obtained from model calculations. The results provide indications of the structure of future energy systems, assuming the greenhouse gas emission reductions needed to tackle climate change are optimally implemented.
3
In June 2009, VTT Technical Research Centre of Finland published a book entitled Energy Visions 2050, which reveals the central future challenges facing the global energy system and the future development of clean en-ergy technologies. The book examined ways of addressing the challenges involved in tackling climate change without hampering human wellbeing, applying global modelling as tools for analysing different development paths for the global economy and energy systems. The timeframe spans up until the year 2050.
The contents of the book covers the whole energy chain: future tech-nologies for energy conversion, end-use, transmission and distribution. Furthermore, a comprehensive outlook for energy resources is included in the book. This summary presents highlights and key messages of the results of the book.
The book includes separate sections entitled ‘vision boxes’, which deal with various topics. In most cases these boxes discuss more visionary ideas, the realisation or wide penetration to the markets not necessarily even seem probable within the timeframe of the book. A couple of examples of vision boxes are also presented in this summary.
The results presented in the book, obtained through broadly based and national and international co-operation, introduce a Finnish vision of the potential for technology development in meeting the global energy chal-lenges of the future, especially climate change.
The Energy Visions 2050 project was funded by the ClimBus Programme of Tekes (Finnish Funding Agency for Technology and Innovation), VTT and the Government Institute of Economic Research (VATT).

4
Global challenGes and their implications for the enerGy sectorThe main global drivers of the energy system are the growth of energy demand due to increasing population and economic output and, on the other hand, challenges linked to energy security and mitigation of environ-mental impacts, especially climate change.
Globally, the annual growth in primary energy use has been on average almost 3% in the beginning of the 21st century. Much of the growth can be traced back to rapidly developing economies, especially China and India. The global demand in terms of pri-mary energy was about 490 EJ in 2006. To-day, over 80% of the global energy supply is based on fossil energy sources, the most important being oil (35% of global primary energy supply), coal (26%) and natural gas
(20%) (IEA 2008).Energy production, as it is today, causes
acidification and air quality problems and, especially, greenhouse gas emissions that are seen as the main contributor to climate change. The most important greenhouse gas from energy production is carbon dioxide (CO2). Climate change is widely acknowledged as the largest environmental risk globally.
The energy sector is presently the larg-est source of greenhouse gas emissions on a global scale. The stabilisation of the at-mospheric greenhouse gas concentrations at a safe level requires very deep emission reductions in the long term. In addition, the global CO2 emissions should peak between 2000-2015, i.e. start declining within the next few years at the latest. The history of CO2 emissions from the energy sector and the scale of the mitigation challenge in the coming decades is illustrated in Figure 1.
fiGure 1. CO2 emissions from fossil energy use for the industrial countries (s.c. Annex I countries) and the developing countries (other than Annex I countries). Emission history for 1900-2005 and emission reduction sce-narios for limiting the emissions by 50% and by 85%, corresponding to the upper limit emissions and lower limit emissions for a temperature rise level of 2 ºC according to IPCC (2007). (Data sources: CDIAC, IEA, VTT, CAIT)
CO2 emissions from energy use and the scale of mitigation challenge
0
10
20
30
40
50
60
70
1900 1920 1940 1960 1980 2000 2020 2040
Gt CO2/aIndustrial countriesDeveloping countriesTotal
Industrial countries, 2000-2005
Developing countries, 2000-2005
Total 2000-2005
Baseline, IEA Energy TechnologyPerspectives 2008
50% Emission reduction level
85% Emission reduction level

5
The conventional energy resources of the world, especially in case of oil and gas, are very concentrated. According to many stud-ies, oil and gas production based on con-ventional resources are expected to peak in the coming decades. Many countries are highly dependent on imported energy (see e.g. Figure 2 on imports of oil). Often this is thought to expose the country to crises con-cerning the price and availability of energy. The development trend has implied increas-ing discussion on the need for improvement of energy security of countries or groups of countries. This is considered to be one of the central drivers affecting energy sector devel-opment in the future.
The developed countries and the develop-ing countries are still in very different situ-ations with respect to energy-related chal-lenges. In the developing countries there are one and a half billion people without access to modern energy services, which is a seri-ous obstacle to development. In the devel-
The share of imports in oil consumption
0%
20%
40%
60%
80%
100%
1965 1970 1975 1980 1985 1990 1995 2000 2005
India
European Union
China
Japan
US
fiGure 2. The imported share of oil consumption in some countries and in the EU. The share of im-ported oil in the EU and USA decreased after the oil crises in the 1970s and 1980s, but in recent years oil imports have increased. Oil imports to China and India are also increasing. (Data source: BP 2008)
oped countries the problems arise from the ageing energy systems and large greenhouse gas emissions. Environmentally sound en-ergy solutions are also required in the de-veloping countries, where the energy need is rising rapidly.
Revolutionary changes are needed in the energy sector in order to cope with the fu-ture challenges. Principal measures related to meeting the challenges of mitigation and climate change, security of energy supply, as well as economic and environmental chal-lenges, can be divided into two categories: 1) measures enabled by technology and 2) measures enabled by changes in the struc-ture of consumption. These categories are, however, not independent of each other. The main emphasis in Energy Visions 2050 is on measures enabled by technology, but changes in the structure of consumption are also dealt with to some extent.
More efficient technologies with regards to energy conversion and end-use should be

6
intensively developed, and carbon-neutral and low-carbon energy sources (renewable energy sources and nuclear energy) as well as carbon capture and storage (CCS) tech-nologies need to be favoured. Adoption of novel energy technologies form carbon-neutral and low-carbon sources involves challenges and development needs for en-ergy supply systems, e.g. electricity infra-structure including power transmission and distribution.
Technological development has consid-erable inertia; it is typically a slow process. The development of a technology from the laboratory to widespread market penetra-tion can take decades. There are two types of inertial aspects in the case of energy technology. These are, fi rst, the innovation process and, second, the slow penetration to the real energy system.
Energy technology is often very capi-tal intensive and it is characterised by long life-times of investments. This slows down
the changes in the energy sector. The typi-cal life-times of infrastructure investments and buildings are of the order of fi fty to a hundred years. The life-time of hydro and nuclear plants can exceed 50 years, and in the case of fossil-fuel-fi red plants the life-time may also be several decades. Industrial plants in energy-intensive industries typi-cally have life-times of two decades or more. Cars are used typically from ten to fi fteen years and domestic electrical appliances also for several years. Due to the inertia, long-term analysis up to 2050 can be regarded as feasible in the context of the energy sector.
enerGy useEnergy is used widely in society, but ultimately by consumers. Visions, technology opportu-nities and their potential presented in Energy Visions 2050 are reviewed in the following by end-use sectors, i.e. industry, buildings (resi-dential and commercial) and transport.
fiGure 3. Global fi nal energy demand of the Baseline scenario in Energy Visions 2050 by main sector. Indus-trial and commercial fi nal energy usage increases most rapidly.
Global final energy demand in the Baseline scenario by main sector
0
100
200
300
400
500
600
700
800
2000 2020 2040 2060 2080 2100
Fina
l ene
rgy,
EJ
Transport
Residential
Commercial
Industry

7
The concept of energy effi ciency and its improvement have particular signifi cance when future energy use is analysed. Simply put, this means introducing technology or adopting new operating practices that re-quire less energy input to produce the same product or service, thereby improving en-ergy security and reducing environmental effects of energy production.
industry
During the development of industry, energy consumption has increased in relation to production volumes. In the past, industrial energy use and GDP were strongly con-nected, but recently the growth of the ICT and service sectors has reduced this de-pendency. The trend in many products has been towards higher added value, which has
often meant higher energy input. This de-velopment has been compensated by proc-ess development, which has raised energy effi ciency. Energy effi ciency should be an integral part of process and product design and operation. The most important choices are made during the design and construc-tion phase.
Globally, the most important industrial sector with respect to energy use is the chemical and petrochemical industry, with some 30% of global fi nal industrial energy use in 2004, followed by iron and steel (19%) and non-metallic mineral industries (9%). Paper, pulp and print is the fourth largest specifi ed category (6%); however, in the Finnish context, this category has traditionally been the most signifi cant in-dustrial sector. Altogether, these four in-dustrial sectors accounted for over 60% of
fiGure 4. Energy consumption by industrial sector. Energy consumption in regions is dependent on e.g. the industrial structure, population and development phase. For example, overall consumption in Japan is higher than in India despite a tenfold difference in population. The chemical, petrochemical and iron and steel industries account for roughly half of the total global fi nal energy use in industry. (Data source: IEA)
Industrial final energy use in the world - 113 EJ in 2004
0
5
10
15
20
25
Afr
ica
Aus
tral
ia-N
ew Z
eala
nd
Can
ada
Cen
tral
and
Eas
tern
Eur
ope
Chi
na
Cen
tral
and
Sou
th A
mer
ica
Form
er S
ovie
t U
nion
Ind
ia
Jap
an
Sou
th K
orea
Mid
dle
Eas
t
Mex
ico
Oth
er D
evel
opin
g A
sia
Uni
ted
Sta
tes
Wes
tern
Eur
ope
Chemical and petrochemical 29.7% Iron and Steel 18.9%Non-metallic minerals 9.4% Paper, pulp and print 5.7%Other industrial sectors 19.8% Non-specified 16.4%
Group other industrial sectors consists of: Food and tobacco 5.2%Non-ferrous metals 3.7%Machinery 3.8%Textile and leather 1.9%Mining and quarrying 1.6% Construction 1.2%
Wood and wood products 1.2%
Transport equipment 1.1%
EJ

8
industrial final energy use in the world in 2004 (Figure 4).
Energy consumption in industry can be divided into consumption of the process and consumption of the auxiliary functions (space heating, lighting etc.) In all processes thermodynamics sets the theoretical mini-mum for energy consumption. For example, water evaporation needs a certain amount of energy, as do chemical reactions. These limitations might be overcome by redesign-ing the process concept, e.g. papermaking without water as a process medium. An-other option is to replace the current en-ergy input with a lower grade of energy, like low-temperature waste heat streams. Major improvements thus require fundamental changes in the process, but there is still plenty of potential to improve current sys-tems. Even if the main process is found to be near its minimum energy consumption, the auxiliary operations may offer possibili-ties for substantial savings.
Industrial processes are quite different in their energy requirements and energy ef-ficiency, and even similar processes have a lot of internal and external factors that make them unique in this sense. Thus, tech-
nological opportunities within different in-dustrial sectors are numerous. Table 1 illus-trates long-term potentials for the energy efficiency improvement of some industrial products. One can see that there are signifi-cant differences between present best and prospective technologies and theoretical minima, i.e. the potential to improve energy efficiency in the manufacturing of indus-trial products. The sections describing tech-nology developments for different industri-al sectors in Energy Visions 2050 include a more detailed analysis of future technology opportunities for industry, complemented with a section on generic technologies com-mon to all the sectors.
building sector
In the building sector (i.e. residential and commercial sectors), the main end-uses of energy include space heating, hot water production, cooling, lighting, cooking, and various electrical appliances. When improv-ing the energy efficiency of buildings, and decreasing CO2 emissions, there are two major steps: (i) reduction of building-level overall energy demand, and (ii) fulfilling re-duced energy demand by utilising primarily renewable energy sources.
In order to reduce overall energy demand in the building sector, a holistic approach and professional planning are strongly rec-ommended. Such an approach allows com-prehensive planning and design of building architecture, structural components, elec-tricity, building automation, and all build-ing service system solutions.
Typical technical life-cycles in our built environment are several decades, and ma-jor changes in the building stock take place quite slowly. Therefore, it is very important to make wise and sustainable decisions when balancing energy demand and supply – on both regional and individual building levels. Technology development of building
table 1. Long-term potentials for energy-efficien-cy improvement of some industrial products. There are significant differences between products with re-gard to the present state and theoretically achievable levels. The abbreviation SEC stands for specific energy consumption. (Turkenburg 2007)
Paper/board
Primary steel
Secund. steel
Ammonia
Nitric acid
2.3-8.6
19.0
7.0
33.0
26.8
0.6-4.3
12.5
3.5
28.6
15.3
0.0
6.6
0.0
19.2
3.2
SEC’s inGJ/tonproduct
Long-term potentials for energyefficiency improvement
Presentbest
Prospectivetechnology
Theoreticalminimum
SEC

9
and construction components over the past two decades, together with careful planning and design methods for the future built environment, has opened a huge energy-saving potential throughout the building sector. According to several demonstration projects, this saving potential can be more than 50% with marginal additional life-cy-cle costs (see Figure 5).
The market situation for the energy-ef-ficient building concept seems to be in the early development phase, but it is expected to strengthen in the near future due to envi-ronmental, economic and political reasons. Realisation of the global building sector’s CO2 emission mitigation potential requires dramatic changes in building-related regu-lations and conventions.
According to dozens of international demonstration cases, an energy-efficient building is also a good investment. Though the initial construction costs of a low-ener-
Relative performance of building technologies
Currentbuildingtechnology
100
80
60
40
20
110
108
106
104
102
100
2005 2010 2015 2020 2025 2030
Investmentcost
Total building level heat energy use
Low-energy building with present technologies
Passivehouseconcept
Zero-energybuildingconcept
Energy-positivebuildingconcept
Conventionalenergy demand
Renewablenet energy
112
fiGure 5. Relative heating energy demand and investment cost of energy-efficient buildings compared with current building technology according to a Finnish full-scale demonstration project. Additional investment is very low compared with e.g. market price fluctuations or choices in the standard of interior equipment.
gy building with present technologies are 2-5% higher than for a conventional build-ing, these costs are recouped in energy sav-ings over 5-15 years.
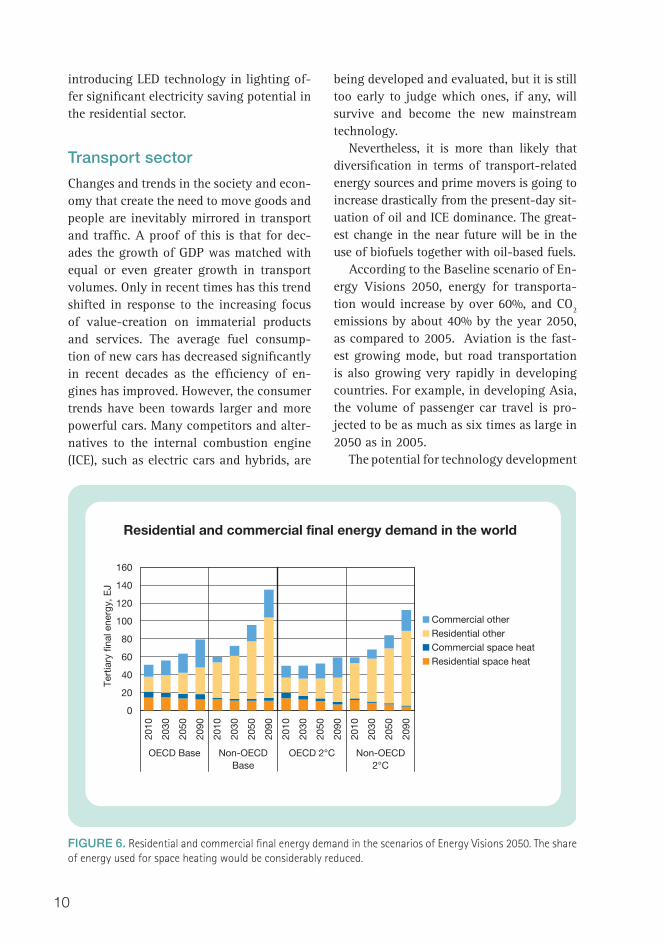
Figure 6 shows the relative shares of space heating and other uses (including hot water production, cooling, lighting, cook-ing, and various electrical appliances) in global final energy consumption according to the scenarios presented in Energy Visions 2050. The share of space heating was about one-third of the total final energy in 2005, but according to the scenarios it will be considerably reduced by 2050.
In many countries, the efficiency of space heating is still rather poor and, there-fore, large improvements can be achieved. On the other hand, the use of energy for cooling and for various electrical applianc-es is projected to increase rapidly in devel-oping countries. Reducing stand-by power consumption of domestic appliances and
10
introducing LED technology in lighting of-fer signifi cant electricity saving potential in the residential sector.
transport sector
Changes and trends in the society and econ-omy that create the need to move goods and people are inevitably mirrored in transport and traffi c. A proof of this is that for dec-ades the growth of GDP was matched with equal or even greater growth in transport volumes. Only in recent times has this trend shifted in response to the increasing focus of value-creation on immaterial products and services. The average fuel consump-tion of new cars has decreased signifi cantly in recent decades as the effi ciency of en-gines has improved. However, the consumer trends have been towards larger and more powerful cars. Many competitors and alter-natives to the internal combustion engine (ICE), such as electric cars and hybrids, are
fiGure 6. Residential and commercial fi nal energy demand in the scenarios of Energy Visions 2050. The share of energy used for space heating would be considerably reduced.
Residential and commercial final energy demand in the world
0
20
40
60
80
100
120
140
160
Tert
iary
fina
l ene
rgy,
EJ
2010
2030
2050
2090
2010
2030
2050
2090
2010
2030
2050
2090
2010
2030
2050
2090
OECD Base Non-OECDBase
OECD 2°C Non-OECD2°C
Commercial otherResidential otherCommercial space heatResidential space heat
being developed and evaluated, but it is still too early to judge which ones, if any, will survive and become the new mainstream technology.
Nevertheless, it is more than likely that diversifi cation in terms of transport-related energy sources and prime movers is going to increase drastically from the present-day sit-uation of oil and ICE dominance. The great-est change in the near future will be in the use of biofuels together with oil-based fuels.
According to the Baseline scenario of En-ergy Visions 2050, energy for transporta-tion would increase by over 60%, and CO2 emissions by about 40% by the year 2050, as compared to 2005. Aviation is the fast-est growing mode, but road transportation is also growing very rapidly in developing countries. For example, in developing Asia, the volume of passenger car travel is pro-jected to be as much as six times as large in 2050 as in 2005.
The potential for technology development

11
fiGure 7. Options and their time span to decrease the environmental impacts of the transport sector. Depend-ing on the option, there is a signifi cant difference in time needed for implementation.
in the transportation sector is substantial, but the technological transition required for deep emission cuts also presents enor-mous challenges. During recent years, fuel effi ciency in all transport modes has been improving quite favourably, and this trend is assumed to continue in the scenarios.
Additional effi ciency improvements and emission reductions are achieved in scenar-ios where the aim is mitigation of climate change (the ‘2ºC’ scenarios in Figure 8). In these scenarios, alternative fuel vehicles start penetrating into the market. The use of biofuel components in diesel engine ve-hicles is already feasible at present, and the proportion of the biofuel component can be technically increased to a very high level by 2050. Hybrid electric vehicles and plug-in hybrid electric vehicles have already entered the market and represent feasible near-term options for the transition to full electric vehicles. Another important long-
term technology alternative is fuel cells, in particular hydrogen-fuelled cells. In the 2ºC scenarios, electric vehicles turned out to be a more competitive alternative in the light-duty vehicle categories. Hydrogen fuel cell vehicles gained notable market share pri-marily in heavy-duty transportation after 2050. Nonetheless, large uncertainties are embodied in the results for the transpor-tation sector due to immature technolo-gies and especially due to the uncertainties related to future policies and regulations made nationally.
enerGy conVersion technoloGiesThe energy conversion technologies re-viewed in the Energy Visions 2050 repre-sent possibilities to reduce greenhouse gas emissions from energy production and to
Development of public transport
Society
Technology
Trafficcontrol
Choice oftransportmethod
Catalysers andother cleaning
systems
Motordevelopment
New powerapplications
Renewableenergies
Alternativefuels
Drivingstyle
Benefitsof ICT
Roadnetwork
DAYS MONTHS YEARS DECADE S
Planning andland use
Placement ofoperation
New energy
Options to decrease the environmental impact of the transport sector

12
fiGure 8. Transportation final energy demand in the scenarios of Energy Visions 2050. Electric vehicles pen-etrate the market for low-duty vehicles under the 2°C target.
Global transportation final energy demand in the scenarios
0
20
40
60
80
100
120
140
160
180
200
Baseline 2°C Market 2°C Boost
Fina
l ene
rgy
in t
rans
por
t, E
J
2010
2030
2050
2070
2090
2010
2030
2050
2070
2090
2010
2030
2050
2070
2090
Electricity
Biofuel
Synfuels
Coal
Gas
Oils
reduce the use of depleting fossil resources by means of renewable energy, near-zero-emission technologies and conversion proc-esses of greater efficiency.
Most of the conversion technologies in-troduced and assessed aim at electricity pro-duction or the production of liquid and gase-ous biofuels to replace fossil oil and natural gas. The focus of liquid and gaseous biofuels is on the transport sector, but applications in residential heating and industrial processes are also included. Large-scale heating, such as in municipalities and industry, is covered by novel combined heat and power (CHP) conversion technologies. Small-scale heat-ing technologies are limited to solar heating, CHP based on fuel cells, and novel slow-heat-release appliances with high efficien-cies and low fine particle emissions.
Technological possibilities to improve the competitiveness of renewable electric-ity generation by converting energy from
wind, biomass, the sun, the oceans, and waterfalls are dealt with in Energy Visions 2050. The future development steps for nu-clear power and carbon capture and storage (CCS) from fossil fuel plants are presented as near-zero-emission technologies.
The prospects for nuclear power are characterised by the future plant options, which include several advanced concepts such as fast reactors with closed fuel cycle enabling much more effective use of ura-nium resources and thus providing a long-lasting basis for electricity production. Fur-thermore, some of the new concepts could also serve as co-producers of process heat or hydrogen. The spent fuel repository, for which the construction licence application is planned to be submitted to the authorities by 2012, is an example of Finland’s efforts in this international sector. Energy from the fusion of heavy hydrogen fuel (deuterium, tritium) is actively being pursued as a long-

13
Vision box: 5 million electric vehicles in the nordic countries – impacts on the electricity system
What will happen to the electricity system if half of all personal vehicles in the Nor-dic countries are turned over to electric vehicles (EV) or plug-in electric vehicles (PHEV)? The yearly increase in consumption is less than 4%, or approximately 14 TWh. And the effect on the system peak load, assuming;
all cars are charged through household outlets (max 2500 W), and •
the charging system is smart enough to move 90% of all evening activities to • after midnight,
can be seen in Figure 9. The peak load week from 2006 is used as the basis. The peak load increases by less than 2%, and electricity consumption is not that noticeable.
The effects of 5 million EVs on the Nordic power system during peak load week
0
20000
40000
60000
80000
0:00 12:00 0:00 12:00 0:00 12:00 0:00 12:00 0:00 12:00 0:00 12:00 0:00 12:00
16.1.-22.1.2006
MW
FI+SE+DE+NO Electric vehicles
Nordel old maximum load 20 Jan 8:00-9:00: 67.8 GW
New peak 20 Jan 9:00-10:00: 68.8 GW
fiGure 9. The effects 5 million electric personal vehicles on the Nordic system during peak load week. Year 2006 actual peak load week was used.
term, almost inexhaustible supply of energy. The scientifi c feasibility of fusion energy has been proven, but technical feasibility remains to be demonstrated in experimen-tal facilities. Upon successful demonstration of fusion power production, commercialisa-tion of fusion is contemplated to begin at the earliest in about 2050.
The possibilities of CCS in connection with oxygen combustion in fl uidised bed boilers, which provides an option for new large CHP and mid-scale (600-800 MWe)
coal and co-fi ring plants, as well as retro-fi ts of existing plants, are the main focus of the present development activities in Fin-land. Also, integrated plant concepts based on fl uidised bed pressurised gasifi cation are especially feasible for CCS.
Centralised, large-scale bioenergy uti-lisation is dependent on an effi cient pro-curement system to enable the harvesting or collection, transportation and storage of huge volumes of biomass from fi elds or for-ests to the plant. The most effi cient and
14
economic concepts of bioenergy utilisa-tion are typically integrated into processes where biomass is primarily utilised as a raw material and its residues or waste are used for energy production. A classic example is the pulp mill, where fibres of wood are utilised for pulp production, and the rest of wood for energy production in excess of the mill’s own consumption. Integrated energy production at the mill can present-ly include steam and electricity from CHP
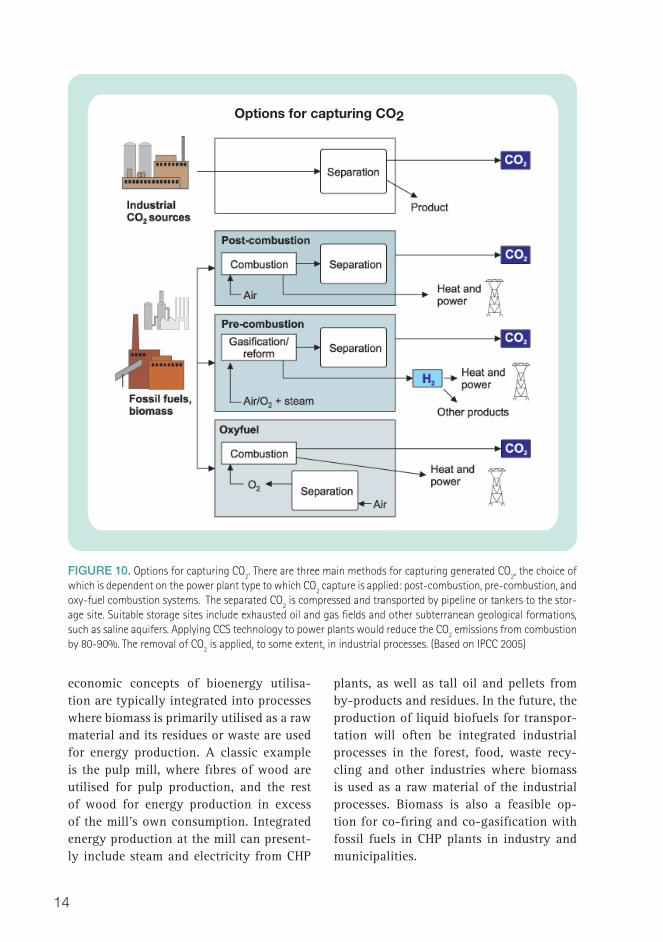
fiGure 10. Options for capturing CO2. There are three main methods for capturing generated CO2, the choice of which is dependent on the power plant type to which CO2 capture is applied: post-combustion, pre-combustion, and oxy-fuel combustion systems. The separated CO2 is compressed and transported by pipeline or tankers to the stor-age site. Suitable storage sites include exhausted oil and gas fields and other subterranean geological formations, such as saline aquifers. Applying CCS technology to power plants would reduce the CO2 emissions from combustion by 80-90%. The removal of CO2 is applied, to some extent, in industrial processes. (Based on IPCC 2005)
Options for capturing CO2
plants, as well as tall oil and pellets from by-products and residues. In the future, the production of liquid biofuels for transpor-tation will often be integrated industrial processes in the forest, food, waste recy-cling and other industries where biomass is used as a raw material of the industrial processes. Biomass is also a feasible op-tion for co-firing and co-gasification with fossil fuels in CHP plants in industry and municipalities.

15
deVelopment of enerGy conVersion technoloGies
1200
1100
1000
900
800
700
600
500
400
CO
em
issi
on
(g/k
Wh)
2
25 30 35 40 45 50 55 60
Current average
Reference plant
Thermie700 Thermie
ultimo
Average EUcountries 2010
100% coal
20% biomass
10% biomass
100% nat. gas
CO emission reduction possibilities with supercritical boilers2
Net efficiency (%)
’85 ’87 ’89 ’91 ’93 ’95 ’97 ’99 ’01 ’03 ’05 ?
15 m O
112 m O
126 m O
160 m O
1st year of operation
installed power
Airbus A380wing span 80m
Rot
or d
iam
eter
(m)
0.05 0.3 0.5 1.3 1.6 2 4.5 5 8/10 MW
Development of wind turbine technology from 1980’s to 2010
An indicative timeline for the emergence of new types of nuclear reactors
G IVG IVG IV
Limited by fuel properties
High substitution ratio (BTL,CTL,GTL)
Roadmap for future transportation fuel technologies
First commercial BTL plant 2012-2014Limited by vehicles and
distribution channels
ReducedWTW CO2emissions
Reduced oil consumption
Improvedconventional
fuels
Blending ofrenewable
fuels
Natural gas
Hydrogen
Advancedbiofuels
(blend & neat)
Today Medium term Long term
BTL diesel & gasolinecellulose ethanol
Modifi ed from Röj 2005

16
noVel enerGy technoloGies from finland
Step-wise built multifuel high-efficiency CHP with carbon capture
G
GS team
Tu rb in e
CFBboiler
Oxyfuel-option
Highpressure
pre-heaterLow
pressurepre-heater
Steamturbine
Feed water
Heat recoverysteam generator
Steamturbine
Coolingwaterapp. + 5 OC
Low temp heat
Condenser
Condenser
290 MWe
460 MWe
Steam
GT
Natural gas
Hard coalBiofuel CO2 captureDeSox, DeNox etc.Hard
coal
Gasifier
OxygenNitrogen
Puri-fication
ASUoption
Biofuel
Pre-combCCS
Hydrogen
Refinery
Crude Oil
Integration of FT synthesis plant to a pulp and paper mill
Wood, strawenergy crops,peat, RDF
FT-synthesis& upgrading
Gasification andgas treatment
Pulp andpaper mill
Biomasshandling
anddrying
powerplantProcess steam & power
Paper& pulp
WoodDiesel
Energyto drying
synthesis-gas
bark,forestresidues,otherbiomass
fuel gas+ steam
steam & oxygen
Repository for spent nuclear fuel
4.1 m
Backfill
Bentonite
7.5 m
Metal canister
1.7 m
LO1-2 OL1-2 OL3
Pohjolan Voima

17
Vision box: bioenergy ccs
In principle, carbon capture technologies could be applied to separating the CO2 originating from biomass, provided the power plant is of suffi cient size to justify the cost. Considering the whole life-cycle of biomass, the application of CCS to bio-mass energy conversion would generate negative atmospheric carbon emissions. Biomass bears certain similarities to the fossil fuels, particularly coal, that apply to energy conversion technologies and the range of energy products that can be generated, i.e. dispatchable, base-load electricity, as well as liquid and gaseous fuels. Therefore, all three technological routes for CCS could be applied to bio-mass energy systems. However, due to the large additional consumption of energy related to current capture technologies, its application could only be considered in respect of large-scale (> 500 MW) power and heat plants. Since the majority of biomass-fi red boilers available are typically smaller than what are considered vi-able, practical CCS potential would be limited to black liquor recovery boilers and a few CHP plants.The ambitious goal of the EU’s Biofuel Directive to signifi cantly increase the use of biofuels could provide additional CCS opportunities. Several biofuel refi ning proc-esses produce CO2 gas as a by-product, which could, with relative ease, be de-hydrated, compressed and transported for storage. The EU goal of 10% by 2020 would increase the annual use of biofuels to over 40 Mtoe in the EU. If half of these production facilities were suitable for the application of CCS, and the share of etha-nol and synthetic diesel were, for example, 10 Mtoe ethanol and 10 Mtoe synthetic diesel, then the annual CCS potential would be about 10 Mt CO2. Biomass could also be co-fi red in CCS-equipped coal-fi red boilers, which would further reduce the CO2 emissions from the power plant. The use of biomass is gov-erned by local availability and the cost of biomass. It is likely that biomass co-fi ring would be used predominantly as a means of reducing CO2 emissions in boilers not equipped with CCS. One can see the potential for bio-CCS in the climate change mitigation scenarios of Energy Visions 2050. In the long-term future, bio-CCS ap-pears to be a notable option, signifi cantly penetrating into the energy systems be-yond 2050 (see Figure 11).
fiGure 11. Capture of carbon emissions by category, ‘2°C Market scenario’ aiming to mitigate climate change. Biomass-fuelled plants equipped with CCS appear to represent a signifi cant and cost-effective mitigation option.
Capture of CO2 emissions by category in the world, the 2°C Market scenario
0
2
4
6
8
10
12
14
16
18
20
2030 2050 2070 2090
Gt
CO
2 ca
ptu
red
Fuelconversion
Industry
Bio-CCSelectricity
Fossilelectricity

18
enerGy resources The use of fossil fuel resources (oil, natural gas, coal) has made it possible to establish the industrial community, and has provided the means for the developed countries to become increasingly more prosperous. A supply of secure, equitable and sustainable energy is vital to the future prosperity of the developing countries, too. The historical de-velopment presently faces at least two types of challenges. The resources of fossil fuels are limited and are rapidly being depleted. The present easily exploitable reserves of crude oil and natural gas are estimated to be exhausted within 40 to 70 years. How-ever, there are probable additional resources that can be recovered at higher costs and with larger energy inputs required for their refinement. The easily accessible reserves of
Figure 12. Sufficiency of conventional fossil fuel and uranium resources at today’s consumption levels and tech-nology. The width of the histograms indicates the current consumption level and the area indicates the size of each resource in energy terms (Data source: BGR 2006). Many renewable resources not presented in the figure have theoretical and technical potential to meet the world’s energy demand many times over. Furthermore, ad-vanced nuclear power technology concepts of the future have the potential to increase the resource sufficiency by orders of magnitude.
coal are about twice as large, and probable additional resources would last for centuries at the current energy consumption level.
The world energy supply is predominant-ly based on fossil fuel reserves and will be for several decades to come. The ultimate origin of fossil fuel resources is solar en-ergy, which provided the energy needed for the historical accumulation of large amounts of biomass, followed by transfor-mations through geological processes. In fact, the most important present renewable energy sources are either indirectly (bioen-ergy, wind and hydro) or directly related to the availability of abundant solar energy.
The surface of the Earth receives solar in-solation at an average rate of 81,000 TW a year. This can be compared with the current average energy consumption flow of about 16 TW (490 EJ/year). It is evident that solar
Conventional fuel resources
0
50
100
150
200
250
300
350
Crude oil Natural gas Coal Nuclear fuels
R/P
, yea
rs
Reserves
Resources
109 EJ/a163 EJ/a
Sev
eral
hun
dre
d y
ears
141 EJ/a 27 EJ/a
19
36
40
41
79
87
98
102
115
138
264
Nigeria
0 100 200 300
Kazakhstan
Libya
Russian Federation
Venezuela
United Arab Emirates
Kuwait
Iraq
Iran
Saudi Arabia
Proven reserves of crude oil 2007 Total 1240 Gbl
Total Middle East
61%
S. & Cent. America 9%
Other 9%
Kazakhstan 3%
North America 6%
China 1%Norway 1%Nigeria 3%
Russian Federation 6%European Union 1%
Gbl
fiGure 13. Proven reserves of crude oil 2007 (1 GBl = 1.36 • 108 tonnes (metric)). (Data source: BP 2008)
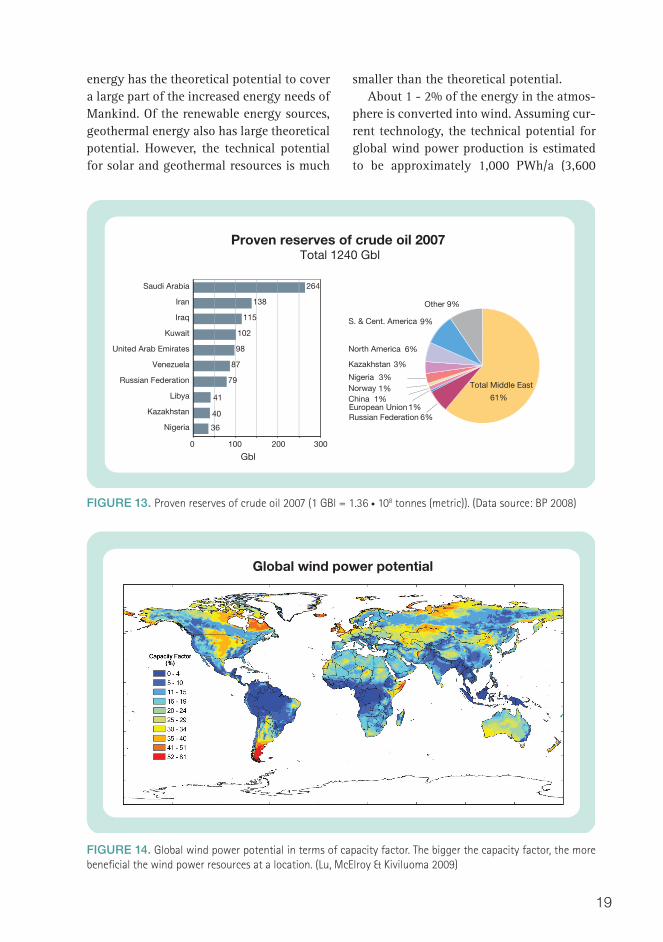
energy has the theoretical potential to cover a large part of the increased energy needs of Mankind. Of the renewable energy sources, geothermal energy also has large theoretical potential. However, the technical potential for solar and geothermal resources is much
smaller than the theoretical potential.About 1 - 2% of the energy in the atmos-
phere is converted into wind. Assuming cur-rent technology, the technical potential for global wind power production is estimated to be approximately 1,000 PWh/a (3,600
Global wind power potential
fiGure 14. Global wind power potential in terms of capacity factor. The bigger the capacity factor, the more benefi cial the wind power resources at a location. (Lu, McElroy & Kiviluoma 2009)

20
EJ/a). This includes offshore resources in regions situated not too far from the main-land and at decent water depths, although the main part of the estimated resource is onshore.
The geographical distribution of the on-shore wind resource can be seen from Fig-ure 14. Current global resource maps are in-dicative only, as the resolution and quality of the data is not high enough to make good estimates. The low resolution of the data means that some areas, especially where the terrain is complex, are not presented cor-rectly. However, a comparison with high-resolution wind atlases indicates reasonable agreement with Figure 14.
Current usage of biomass is concentrated in the developing countries. The develop-ing countries as a whole derive 33% of their energy from biomass, used mostly as tradi-tional fuel for cooking and heating. An as-sessment of the future potential of biomass-
based energy needs to take into account other land uses, such as food production, biodiversity, soil and nature conservation, as well as carbon sequestration. This ques-tion determines its feasibility for climate change mitigation and other challenges in the energy sector. A recent study by VTT and MTT Agrifood Research Finland resulted in a range of 120-210 EJ for the potential of biomass-based energy in 2050 under differ-ent scenarios (Koljonen et al. 2009; Pahkala et al. 2009, see Figure 15). The range is due to different assumptions about factors such as land use and food production. The lower limit of the biomass potential represents a scenario where the emphasis in food pro-duction is on a meat diet, whereas the upper limit represents the potential when a veg-etarian diet is more favoured.
Of the different types of nuclear energy, fusion energy aims to harness the same type of fusion reactions that form the basis for
fiGure 15. Biomass energy potential (EJ/a) in different regions of the world, derived from VTT’s analysis of wood-based energy potentials and MTT’s estimation of agricultural residues and main energy crops (Koljonen et al. 2009; Pahkala et al. 2009).
Global biomass-based energy potential by region in 2050
0
10
20
30
40
50
Afr
ica
Aus
tral
ia a
nd
New
Zea
land
Can
ada
Mid
dle
and
Sou
th A
mer
ica
Chi
na
Eas
tern
Eur
ope
Form
er S
ovie
t U
nion
Ind
ia
Jap
an
Mid
dle
Eas
t
Mex
ico
Sou
th K
orea
US
A
Wes
tern
Eur
ope
Oth
er A
sia
EJ/
a
Wood basedresidues 11 EJ/a
Firewood 22 EJ/a
Agriculturalresidues 49 EJ/aEnergycrops 70 EJ/a

21
Vision box: photosynthetic microbes as a future source of energyIn principal, all photosynthetic organisms can be viewed as sunlight-driven cell factories that convert CO2 into organic molecules with biofuel potential. It has been estimated that on an areal basis the productivity (the yield per unit area) of photosynthetic microbes (PMs), i.e. microalgae sensu stricto comprising prokaryotic cyanobacteria and eukaryotic ‘true’ algae, exceeds that of terrestrial plants by at least one order of magnitude. However, there is huge variation among spe-cies concerning the lipid content they can reach under specifi c conditions. The biodiversity of PMs is estimated to exceed 100,000 species, but only about 40,000 species have been identifi ed so far, and of these only a few species have been investigated in terms of their potential regarding biofuel production. Nevertheless, oil contents of between 20 and 70% dry weight have been re-ported and rather conservative calculations foresee yields starting at 58,700 l/ha (Chisti 2007). By comparison, the yield per unit area of Jatropha, an emerging oil plant in the sub-tropics and trop-ics, which could ease the pressure on arable land because it can be grown on marginal land, is 1,900 l/ha/year. That is too low to allow the replacement of current fuel sources as it would require 17% of the global landmass. These fi gures illustrate the enormous potential of PMs, theoretically allowing TW output to make a signifi cant contribution to future fuel demand.
Technologies that provide practical solutions, including cultivation and processing for the mass production of PMs at the scale required, are currently immature. Only four species exhibiting very specifi c growth requirements have been cultivated on an industrial scale, but only for the production of food supplements and fi ne chemicals. Earlier massive research programmes, like the US Aquatic Species Program (ASP) that focused on open pond cultivation (1,000 m2), came to the conclusion that monospecifi c cultures cannot be maintained in a sustainable way for more than a few months due to contamination. On the other hand, the Japanese ‘Research Institute of Innovative Technology for the Earth’ (RITE), which concentrated entirely on the use and development of photobioreactors, did not reach an industrial scale (Lee 2001). Photobio-reactors are different types of closed systems with transparent walls or fi bres for light supply, which enable exact growth control via nutrient and CO2 dosage. A pragmatic solution that maintains a balance between high costs and simplicity might be a two-stage approach involv-ing the combination of a photobioreactor for axenic feeder production and outdoor ponds for fi nal upscale. Success using this strategy, i.e. combining 25,000 l) photobioreactors and 50,000 l) open ponds, has been reported from a commercial operation in Hawaii producing caroten-oids in Haematococcus. For temperate regions with changing seasonal light levels, convincing concepts have not yet been presented. Potential solutions might be the switch to mixotrophic or heterotrophic growth modes, which would necessitate additional carbon sources that are different from CO2, e.g. from waste water streams.
Apart from the technical and economic problems in photobioreactor design suitable for large-scale use, there are additional diffi culties in biomass recovery and further downstream processing (Molina Grima et al. 2003). Specifi cally, the biomass has to be recovered from relatively dilute (<0,5 kg m-3) culture broths, avoiding energy-demanding methods, such as centrifugation, for example. Suggested methods include fi ltration, which can be problematic due to the small size (3-30 µm) of algal cells, and fl occulation, which could at least be utilised to aggregate cells in order to sediment or fi lter them more easily.
Ultimately, the whole value chain of PM-derived biomass has to be evaluated in order to over-come currently limiting economic constraints. The biorefi nery concept (cf. scheme) fully inte-grates chemicals and energy chains. The remaining biomass, after lipid extraction, can be utilised in different ways, such as microbial conversion to methane, hydrogen, ethanol, lipids or electricity. Additionally, chemical compounds can be extracted as valuable by-products, further benefi ting the overall economics of the process.
Apart from the selection of suitable species as mentioned above, genetic engineering of PMs could help to fi nally achieve the economical production of biofuel. Photosynthetic effi ciency, growth and yield are obvious traits for optimisation. At the moment, however, only a few algal genomes have been sequenced and annotated. More research is needed towards generating a solid knowledge base on algae and for the development of molecular tools for genetic modifi ca-tion. At the same time, biosafety needs to be examined in order to minimise environmental risks.

22
solar energy. Nuclear fission energy is based on splitting some of the heaviest elements, such as uranium and thorium. These have few other uses, and nuclear fission can be an abundant energy source if advanced technological concepts are employed to im-prove the efficiency of the usage of these resources. This effect is illustrated in Fig-ure 16, which presents estimates of resource availability assuming different nuclear fis-sion reactor technologies
enerGy supply systemsA system for providing energy in a useful form to end-users primarily consists of an energy source, transportation (or distribu-tion) and, in many cases, storage, energy conversion and end-use. Since the stor-age of energy in some forms is currently economically or technically unfeasible in present energy systems, energy is often stored in the form of the primary energy source, such as coal, oil, natural gas, etc., and production is matched with momentary
fiGure 16. Estimated years of uranium resource availability for various nuclear technologies at the 2006 level of nuclear power utilisation (2,660 TWhe/a; 29 EJ/a). (Data sources: OECD 2008; OECD 2001; OECD 2006)
Estimated years of uranium resource availability
700
300
1003 000
9 000
21 000168 000
72 000
24 000Identified resources
(5.5 Mt U)
Total conventionalresources(16 Mt U)
Total conventionalresources and
phosphates(38 Mt U)
Years of resource availability at 2006 consumption level
Pure fast reactor fuel cyclewith recycling of U andall actinides
Current fuel cycle (LWR, once-through)
Pure fast reactor fuel cyclewith Pu recycling
1 10 100 1000 10 000 100 000
demand. Energy Visions 2050 is primarily con-
cerned with energy supply systems that have an established and wide-spread infrastruc-ture, i.e. electricity and district heat sup-ply systems. In a longer timeframe, beyond 2050, the hydrogen economy, including all the necessary the infrastructure, could pro-vide a versatile new energy carrier for the storage or transportation of energy.
Electricity supply systems include, in ad-dition to power plants, high-voltage power grids and distribution networks. Nowadays, the power network is integrated with tel-ecommunication and telecontrol systems in order to ensure safe and reliable operation of the electrical power system. In the future, the large penetration of distributed genera-tion (i.e. producing energy from small local energy sources), renewable energy sources, demand-side management and energy stor-ages will partially displace energy produced by large conventional plants. Distributed generation will have particular significance in developing countries, where electricity supply systems are often limited.

23
The function of an active distribution network is to effi ciently link the sources of power with consumer demands, allowing both to decide how best to operate in real time. Enabled by smart metering, modern communications and the increased aware-ness of customers, energy management will play a key part in establishing new serv-ices that will create value to the parties in-volved. In the longer term, a super power grid across regions/countries utilising ad-vanced technology presents a conceivable opportunity.
District heating is presently applied in Europe, Northern America and Asia. Con-sumption in the EU27 countries is about
fiGure 17. Balance between different energy sources in the future.
Virtual power plant
StorageHouses
Office
Wind turbines
Micro-turbines
Central power plant
CHP
Fuel cells
i
Distributed energy resources
Industrial plants
10% of the total heating demand. In the USA, about 4% of house heating is produced by district heating. Finland is a forerunner in district heating: about half of the build-ing stock is nowadays connected to district heating. The proportion is more than 90% in the largest cities. The large penetration rate has contributed to Finland’s internationally high share of effi cient combined heat and power (CHP) production. More than 75% of district heating in Finland is produced by combined heat and power.
In the future, a district heating system must be adapted to low-energy systems in buildings or even heat producer (energy positive) buildings. A heat trading system

24
like the present electricity trade in the EU countries is needed in regional heating systems. Because of low-energy buildings, higher buildings will be needed in towns and cities, and higher density building plans will be needed in the suburbs. Future district heating systems could be operated at a lower temperature (60 °C) than nowa-days (80 – 120 °C). This also makes it pos-sible to plan new types of CHP plants with higher power-to-heat ratios, which better correspond to society’s energy consumption structure.
Hydrogen is seen as a viable possibility for alternative energy carriers because it is clean in use with the only emission being water. Hydrogen has a large energy content per unit mass and it can be stored. However, it has one drawback. In its gaseous form, it has a low density and, therefore, storage and
transportation creates some challenges. Like electricity, hydrogen can be pro-
duced by a number of technologies using several primary energy sources, many of which are renewable. Carbon-lean technol-ogies, electrolysis using nuclear electricity and gasifi cation of biomass are proposed as the technologies for producing the bulk of the hydrogen.
The hydrogen economy, including all the necessary infrastructure, could provide a versatile new energy carrier for the storage or transportation of energy. The ultimate goal is that all hydrogen will be produced from carbon-lean energy sources, i.e. re-newable sources, nuclear fi ssion and, per-haps, fusion after 2100. Hydrogen is esti-mated to be used mainly as a transport fuel and also as an energy storage medium to balance power production and demand.
Vision box: multiple energy carrier system
The electricity, natural gas, and district heating/cooling infrastructures operate al-most independently nowadays. A number of benefi ts can be achieved by combin-ing these systems and taking advantage of their specifi c virtues. Electricity can be transmitted over long distances with low losses. Chemical energy, such as natural gas, can be stored using simple and cheap technologies. Compressible fl uids can be stored in pipeline networks without different storage devices. Combining the infrastructures means coupling them, thereby enabling the ex-change of power among them. Couplings are established by converter devices that transform power into other forms. For this purpose, an energy hub is considered. This is a unit where multiple energy carriers can be converted, conditioned, and stored. It represents an interface between different energy infrastructures and /or loads. Energy hubs consume power at their input ports, which are connected to, e.g. electricity and natural gas infrastructures, and provide certain required energy services, such as electricity, heating, cooling, and compressed air at their output ports. It is also possible to convert and condition energy using, e.g. combined heat and power technology, transformers, power-electronic devices, compressors, heat exchangers, and other equipment.For energy transmission purposes, an energy interconnector is proposed that will en-able the integrated transportation of electrical, chemical, and thermal energy in one underground device. So far, the most promising layout seems to be a hollow electrical conductor carrying a gaseous medium. Concepts involving liquid chemical carriers or other forms of energy may be advantageous as well. The time horizon for the imple-mentation of multiple energy carrier systems is set at 30–50 years from now. Sources: Geidl et al. 2007; Favre-Perrod & Bitschi 2006

25
scenarios on enerGy futuresScenarios for the development of the en-ergy systems and greenhouse gas emissions in the long-term future – to 2050 and be-yond - have been constructed in the Energy Visions 2050 book. They are obtained from model calculations, assuming different glo-bal economic development, information and capital flows and technology development. Among other things, estimates of costs to achieve the emissions reduction targets and their impact on energy systems in the fu-ture are obtained from the results from glo-bal, European and Finnish perspectives. The long-term energy and emission scenarios presented illustrate that through profound technological progress and international agreement to tackle climate change, a sus-tainable energy future is possible.
Energy system scenarios have been cre-ated using the global TIAM model (TIMES Integrated Assessment Model) at VTT. In addition to comprehensive technology char-acterisations, the energy system model also
includes basically all sources of anthropo-genic global greenhouse gas emissions as well as a simplified climate model. In or-der to develop consistent long-term energy scenarios, world-wide economy simula-tions have been carried out in the project using the database and models of the Glo-bal Trade Analysis Project (GTAP) at VATT. The GTAP simulations provide projections of the development of global and regional economies and sectoral outputs, which are used as inputs in the TIAM model.
The scenarios presenting global (and European) energy system results are called ‘Baseline’, ‘2 ºC Market’, ‘2 ºC Boosted’ and ‘Regional world’. The ’Baseline’ sce-nario features a continuation of the trends and policies prevailing before the entry into force of the Kyoto protocol in 2005. No in-ternational agreements on climate change policies are assumed.
In the ‘2 ºC Market’ and ‘2 ºC Boosted’ scenarios, global greenhouse gas emissions are simultaneously optimised to achieve the 2°C limit on global warming by the year 2100. Global markets for greenhouse gas
table 2. Basic characteristics of the scenarios considered.
Characteristic Baseline 2ºC Market Regionalworld
Development of economy
Globalisation Globalisation Globalisation Regionalpolicies
Costs and potential of newtechnologies
Moderatedevelopment
Moderatedevelopment
Boosteddevelopment
Moderatedevelopment
Level of required return on energy efficiencyinvestments
Moderate Moderate Low Moderate
GHG emissionreductionobjective
None 2°Cwarming
limit
2°Cwarming
limit
Regional emission targets
2ºC Boosted

26
emissions are assumed, featuring contin-ued globalisation. Thus, according to the model results, the globally optimum solu-tion to achieve the 2 ºC warming limit is ob-tained. The ‘2 ºC Boosted’ scenario further assumes boosted research and development on energy technologies as well as increased sustainability awareness. These features are reflected in the more rapid development and deployment of new technologies, caus-ing their investment costs to decrease more steeply.
The ‘Regional world’ scenario features development towards a more protectionist world, assuming regional policies obstruct-ing globalisation and thus reduced market openness. The basic characteristics of the scenarios are summarised in Table 2.
For the global energy system scenarios, two different scenarios of economic devel-opment have been constructed by VATT: a ‘Baseline’ scenario featuring continued globalisation, and a ‘Regional world’ sce-
fiGure 18. An example of the results of global economy simulations: manufacturing industry outputs in 2050 in global economy simulations, relative difference of ‘Regional world’ scenario, compared to the Baseline scenario. One can see that in the ‘Regional world’ scenario, industrial output is skewed towards energy-intensive industries, e.g. chemical, iron and steel, and metal industries.
nario featuring a rise in more protection-ist and nationalist agendas. In the results of the world economy simulations, the most striking difference between the ‘Baseline’ and ‘Regional world’ scenarios is in the structures of regional economies. In the ‘Regional world’ scenario, the global output value of all industries in 2050 is only 2–3% below the level of the ‘Baseline’. However, the distribution of this output between sec-tors is different. According to the results, the transition towards a modern economy is slower when protectionist and national-ist agendas arise. This is seen in the fastest growing regions, where the development of traditional industries has taken place to a greater extent than, e.g., services. Figure 18 shows the effect in the structure of econo-mies; one can see that industrial output is skewed towards energy-intensive industries in the ‘Regional world’ scenario, compared to the baseline scenario.
At the time of releasing Energy Visions
Manufacturing industry outputs in 2050Relative difference of Regional world scenario, compared to the Baseline scenario
-4%
-2%
0%
2%
4%
6%
8%
10%
12%
14%
16%
Chemical industry prod.
Iron-steel industry prod.
Non-ferrous metals industry prod.
Pulp and paper industry prod.
Non-metallic minerals industryprod.Other industry prod.
Total output (incl. primary prodsand services)

27
fiGure 19. Global electricity generation by main category in the ‘Baseline’ scenario and in the ‘2 ºC Market’ mitigation scenario, which optimises the energy supply achieving the 2 ºC warming limit. By comparing the fi gures, one can clearly see the difference in the structure of electricity generation implied by climate change mitigation. A wide variety of technology options are needed for tackling climate change.
fiGure 20. Global electricity generation by main category, ‘2°C Boosted’ and ‘Regional world’ mitigation scenarios. Boosted R&D&D accelerates technology penetration but the key technologies may remain the same. Regional policies tend to increase energy consumption.
Global electricity generation by main category in the scenarios
2°C Market
0
20
40
60
80
100
Ele
ctric
ity g
ener
atio
n, P
Wh
0
20
40
60
80
100
CHP-Bio CHP-Coal CHP-Gas/Oil Con-Bio ConBio+CCSCon-Coal Con-Gas/Oil Con+CCS Hydro FissionAdvanced nuclear Solar Wind Other
Baseline
2000 2020 2040 2060 2080 2000 2020 2040 2060 2080 21002100
02000 2020 2040 2060 2080 2000 2020 2040 2060 2080 21002100
Global electricity generation by main category in the scenarios
Regional world2°C Boosted
20
40
60
80
100
120
Ele
ctric
ity g
ener
atio
n, P
Wh
20
40
60
80
100
120
CHP-Bio CHP-Coal CHP-Gas/Oil Con-Bio ConBio+CCSCon-Coal Con-Gas/Oil Con+CCS Hydro FissionAdvanced nuclear Solar Wind Other

28
2050, in the summer of 2009, the world is facing an economic recession. In these eco-nomic conditions, there has been increas-ing discussion on policy changes that could make ‘Regional world’-like scenarios more realistic.
According to the results of the scenarios aimed at climate change mitigation, the average fi nal energy intensity of the glo-bal economy should decrease by over 2% annually in order to limit the increase in the global mean temperature to at most 2°C within this century. Such a decrease would be much more rapid compared to the average improvements of 1.1% between 1990 and 2005. The most signifi cant tech-nological shifts would, however, have to take place in energy production. Up to the year 2050, wind turbines, nuclear power, biomass-based electricity generation and power plants equipped with carbon capture and storage will all have a very important
fiGure 21. Development of regional CO2 emissions in three scenarios. One can see the smaller emission reduc-tions in the ‘Regional world’ scenario than in the ‘2 ºC Market’ scenario. According to the results, this implies greater warming of the climate. OECD countries should reach almost zero net emissions by 2070 under the 2°C target.
role in achieving a more sustainable global energy system. Solar energy also has huge potential, but the costs of solar technolo-gies would have to decrease quite steeply in order to reach a signifi cant market share in power generation before 2050.
Very large investments in new energy technology are needed by 2050 on the path to more sustainable energy use. In the electricity sector alone the global annual capital expenditures related to new plant investments would reach about €1,400 bil-lion and the investments in more effi cient technologies would be high also in all end-use sectors. Although the fi nancing of the investments would be challenging, the in-vestment requirements would also create enormous market opportunities for both technology developers and producers.
Figure 22 shows the investments needed for selected technology groups in power and heat generation in the 2ºC Market scenario.
Development of regional CO2 emissions in the scenarios
0
10
20
30
40
50
60Baseline 2°C Market Regional world
Gt
CO
2
2030
2050
2010
2090
2070
2030
2050
2010
2090
2070
2030
2050
2010
2090
2070
Other Asia
India
China
Middle East
Africa
Latin America
Former SU
OECD Pacific
North America
Europe

29
While in the baseline scenario the use of fossil fuels, especially coal, increases rap-idly, in the 2ºC policy scenarios renewables and nuclear dominate. The annual capital expenditures in 2050 for both wind power and biomass-fired power were each almost €300 billion per year. For electricity pro-duction with CCS the calculated annual in-vestments in 2050 were around €250 bil-lion per year. It should also be noted that global capital expenditures for both nuclear power and hydro power would be very sig-nificant and strongly increase between 2020 and 2050. However, both nuclear and large-scale hydro power investments are usually regulated by national policies, which could prohibit these investments in the future.
The scenarios for the Finnish energy sys-tem (Lehtilä et al. 2008) indicate that the key technologies fall into the same catego-ries in Finland as well. Both nuclear power and wind power appear to have great eco-nomic potential under strict climate policies.
Moreover, the use of biomass for energy can still be substantially expanded in Finland, not only through the more enhanced use of forest residues, but also by utilising the sur-plus in forest growth and through agro-bi-omass production. Achieving a completely carbon-free electricity system nevertheless appears to be a very challenging target by 2050. Moreover, particularly with respect to the transportation sector, the technological challenges are global, and domestic meas-ures have rather limited potential.
conclusions
There is a wide variety of technical solu-tions that can be used to improve overall energy efficiency and reduce energy-related emissions. With regard to energy produc-tion technologies, many advanced technol-ogies based on emission-free energy sourc-es or very low-emission technologies are currently being actively developed. Many
fiGure 22. Annual capital expenditures on new power and heat generation capacity in 2020–2050, 2°C Market scenario.
Annual capital expenditures on new power and heat generation capacity in the world in 2020–2050,
2°C Market scenario
0
50
100
150
200
250
300Wind Bio CCS Fossil Nuclear Hydro
Ann
ual c
apita
l cos
ts, b
illio
n (1
0
)
2020
2030
2050
2020
2030
2050
2020
2030
2050
2020
2030
2050
2020
2030
2050
2020
2030
2050(Global)
OECDNon-OECD9

30
of these technologies have either not yet been commercialised, or are still in the ini-tial stages of market entry. Energy Visions 2050 introduces numerous examples of such advanced energy production technolo-gies for the future. Concerning the end-use of energy, in the very long term, remarkably large improvements may be achieved in the energy efficiency of many end-use applica-tions. Due to the inherent inertia of energy systems, in the short term, large improve-ments through rapid shifts in technology might be quite costly. However, gradually over time, the full technical potential can be expected to become more or less fully commercialised.
Even though addressing the climate change issue appears to require large changes within the next 40 years, in the longer term, technology development may open up yet more sustainable energy op-tions. Gradually, various solar energy tech-nologies will inevitably become much more competitive, and may well have a very sig-nificant role by 2100. In addition, advanced nuclear technologies, including nuclear fu-sion, may acquire a key role in carbon-free
hydrogen production, thereby contributing to the ultimate phasing out of fossil fuels.
The challenges related to the mitigation of climate change, access to energy and en-ergy security will require huge investments in the system of energy production and use in the future. There is plenty of room for new innovations and markets for more effi-cient technologies. This can offer a base for new industries designing and manufactur-ing technologies and offering services and maintenance.
The uncertainty surrounding the long-term development - dozens of years ahead - is naturally high. In the coming decades new technological developments in fields such as ICT, nanotechnologies and materi-als science may improve energy efficiency considerably and offer opportunities that are beyond our present-day understanding. New innovations and technological devel-opment as well as the development of the economic framework are very difficult to predict, so actual development in the com-ing decades may be very different from the scenarios presented in this book.

31
referencesBP 2008. BP Statistical Review of World En-ergy. British Petroleum, June 2008. http://www.bp.com/productlanding.do?categoryId=6929&contentId=7044622
BGR 2006. Reserves, Resources and Availability of Energy Resources 2006. Annual Report. Bun-desanstalt für Geowissenschaft und Rohstoffe.
Chisti, Y. 2007. Biodiesel from microalgae. Bio-technol Adv 25, 294-306.
Favre-Perrod, P., Bitschi, A. 2006. A concept for dual gaseous and electric energy transmission. Power Engineering Society General Meeting, 2006. IEEE. 18-22 June 2006. P. 7 pp.
Geidl, M., Koeppel, G., Favre-Perrod, P., Klockl, B., Andersson, G., Frohlich, K. 2007. Energy hubs for the future. Power and Energy Magazine, IEEE. Volume 5, Issue 1, Jan.-Feb. 2007, P. 24 – 30.
IEA 2008. World Energy Outlook 2008. OECD/IEA: Paris, France.
IPCC 2007. Climate Change 2007. Mitigation of Climate Change. Contribution of Working Group III to the Fourth Assessment Report of the Intergovernmental Panel on Climate Change [B. Metz, O.R. Davidson, P.R. Bosch, R. Dave, L.A. Meyer (eds)] Cambridge University Press, Cambridge, United Kingdom and New York, NY, USA, 851 pp.
IPCC 2005. IPCC Special Report on Carbon Di-oxide Capture and Storage. Prepared by Working Group III of the Intergovernmental Panel on Cli-mate Change. Metz, B., Davidson, O. de Coninck, H.C., Loos, M., Meyer, L.A. (Eds.). Cambridge University Press, Cambridge.
Koljonen, T., Ruska, M., Pahkala, K., Flyktman, M., Forsström, J., Kiviluoma, J., Kirkinen, J. & Lehtilä, A. Energiaresurssit ja -markkinat. 2009. (Energy resources and markets, in Finnish). VTT Tiedotteita – VTT Research Notes 2489.
Lee, Y.K. 2001. Microalgal mass culture systems and methods: Their limitation and potential. J Appl Phycol 13, 307-315.
Lehtilä, A., Syri, S., Savolainen, I. 2008. Te-knologiapolut 2050. Skenaariotarkastelu kasvi-
huonekaasupäästöjen syvien rajoittamistavoit-teiden saavuttamiseksi Suomessa (Technology pathways 2050. Scenarios on deep greenhouse gas emissions reductions in Finland, in Finnish). VTT Research Notes 2433. 65 p.
Lu, X., McElroy, M.B., Kiviluoma, J. 2009. Elec-tricity from Wind: Global Perspective with De-tailed Application to the US. In press.
Molina Grima, E., Belarbi, E.-H., Acién Fern-ández, F.G., Robles Medina, A., Chisti, Y. 2003. Recovery of microalgal biomass and metabolites: process options and economics. Biotechnol Adv 20, 491-515.
OECD 2006. Advanced nuclear fuel cycles and radioactive waste management. OECD, Paris.
OECD 2001. Trend in the nuclear fuel cycle, eco-nomic, environmental and social aspects. OECD, Paris.
OECD 2008. Uranium 2007: Resources, Pro-duction and Demand. Joint Report by the OECD Nuclear Energy Agency and the International Atomic Energy Agency. OECD, Paris.
Pahkala, K., Hakala, K., Kontturi, M., Niemeläin-en, O. 2009. Peltobiomassat globaalina ener-gianlähteenä (Agrobiomass as a global energy source, in Finnish). Maa- ja elintarviketalous numero 137. 53 p.
Röj, A. 2005. Presentation at European Com-mission’s Conference on Renewable Energy for Europe - Research in Action, 21-22 November 2005.
Turkenburg, W.C. 2007. Suggestions for an energy research agenda. Copernicus Institute –Utrecht University. Presentation, EC, Brussels, 24 May 2007.

Summary
www.vtt.fi
Radical greenhouse gas emission reductions are needed in order to mit-igate climate change. The energy sector is the main source of green-house gases, so revolutionary changes in the global energy system, which today is mainly based on fossil fuels, are essential. Global en-ergy demand is forecast to continue growing in the coming decades, especially in the developing economies. This growing demand, accom-panied by depleting and geographically concentrated fossil fuel re-sources, will highlight the importance of energy security in the future.
Energy Visions 2050 considers measures for addressing the enormous future challenges facing the energy sector, focusing on technological and techno-economic perspectives. The topics are approached from a global perspective. In some technological details, however, Finnish technology and Finland’s technological achievements are highlighted. This summary presents highlights and key messages of the results of the book. The analysis of the development of technologies covers the whole energy chain, highlighting the necessity of effi cient energy use in all activities of societies. The contents include a discussion on potential future low-emission and renewable energy conversion technologies, as well as new technology solutions in the industrial, building and transport sectors and in energy supply systems. The move towards zero-emission energy systems has consequences for energy supply, and makes the analysis of energy resources presented in the book all the more valuable.
Scenarios of alternative development paths to 2050 are presented, assum-ing different technological development options, economic growth rates, degrees of globalisation and information fl ows. The results show interest-ing differences between the scenarios with regard to energy production and use, mitigation of greenhouse gas emissions, and global warming.
Summary