visit santa barbara · this report presents the survey data collected from these surveys ......
TRANSCRIPT

Visit Santa Barbara
Santa Barbara Visitor Profile
Q1 (September-November 2016)
Interim Report of Findings
Research prepared for Visit Santa Barbara by Destination Analysts, Inc.

Research Overview
This report presents the interim findings of a comprehensive visitor
profile development and tourism economic impact study conducted
by Destination Analysts, Inc. on behalf of Visit Santa Barbara. The
data presented here comes from an intercept survey of Santa
Barbara area visitors at locations throughout the area, as well as
from a self-administered survey distributed to guests at Santa
Barbara area hotels.
This report presents the survey data collected from these surveys
between September and November 2016. Note that data presented
in this interim report has been weighted based on the destination's
overall visitor mix.
Visit Santa Barbara– Santa Barbara South Coast Area Visitor Profile 2016/2017– Q1 Data (September-November 2016)
Important Note: This report represents only a quarter of the overall data we will collect from Santa Barbara area visitors throughout 2016/2017—and thus sample sizes for some visitor segments’ are small and should be considered informational and not directional at this point.
Page 2

Research Objectives
The overarching goal of this survey-based research is to create an in-depth profile of the Santa Barbara area visitor, including developing the following
marketing intelligence:
• Detailed trip characteristics (i.e. tripographic information like the reason for visiting the Santa Barbara area, length of stay, place of stay, etc.)
• Activities & attractions visited in the Santa Barbara area
• Evaluation of Santa Barbara area brand attributes
• Detailed Santa Barbara area visitor spending estimates
• Travel planning resources used by Santa Barbara area visitors
• Visitor expectations and satisfaction
• Visitor psychographic and demographic profiling
In addition to developing the Santa Barbara area visitor profile, data from this research will be used as inputs into Destination Analysts’ economic model to
estimate the annual impact of tourism to the Santa Barbara South Coast area.
Visit Santa Barbara– Santa Barbara South Coast Area Visitor Profile 2016/2017– Q1 Data (September-November 2016) Page 3

Methodology
The research includes two separate yet carefully integrated survey collection techniques. Destination Analysts, working closely with Visit Santa Barbara,
prepared a base survey questionnaire that was fielded in two ways: (1) an intercept survey of visitors to the Santa Barbara South Coast area collected at
locations around the destination, and (2) a self-administered survey of Santa Barbara area hotel guests distributed at their hotel.
Through the first quarter (September-November 2016), 396 responses were collected from three different groups of visitors:
1. Visitors staying in a hotel inside the Santa Barbara South Coast area (hotel guests)
2. Visitors staying in the private home of a friend or relative inside the Santa Barbara area (VFRs)
3. Day-trippers to the Santa Barbara area (regional residents coming to the area for the day and those on trips staying overnight outside the Santa
Barbara South Coast area)
The survey also collected data from visitors staying overnight in the Santa Barbara area in other types of accommodations, such as a private home rental or
campground. All data collected in the intercept survey and hotel guest survey has been weighted to reflect the actual proportion of hotel guests, VFRs, and
day-trip visitors to the Santa Barbara area. The weighting plan applied to this data has been extracted from the 2013 Santa Barbara Visitor Profile. At the
conclusion of this project the weighting plan will be updated based on actual 2016/17 visitor volume estimates.
Visit Santa Barbara– Santa Barbara South Coast Area Visitor Profile 2016/2017– Q1 Data (September-November 2016) Page 4

Visitor Intercept Survey Overview
1
Destination Analysts’ survey collection team worked at locations
around the destination to randomly select and interview visitors. The
questionnaire was administered to persons residing outside the Santa
Barbara South Coast area at the following locations:
City of Santa Barbara Waterfront
Figueroa Mountain Brewing Company
Santa Barbara Maritime Museum
Santa Barbara Museum of Natural History
Santa Barbara Zoo
Stearns Wharf
Destination Analysts’ team member surveying visitor at the Waterfront
Visit Santa Barbara– Santa Barbara South Coast Area Visitor Profile 2016/2017– Q1 Data (September-November 2016) Page 5

Hotel Guest Survey Overview
The self-administered printed Hotel Guest Survey was distributed at various lodging properties throughout the Santa Barbara South Coast area. Guests
were asked to complete the survey and drop it in the mail at their convenience (postage is paid via BRC). The following Santa Barbara area hotels
distributed the Hotel Guest Survey:
Bacara Resort & Spa
Beach House Inn
Belmond El Encanto
Brisas del Mar Inn
BW Pepper Tree Inn
Cheshire Cat Inn
Coast Village Inn
Courtyard by Marriott Santa Barbara Goleta
Four Seasons Resort The Biltmore Santa Barbara
Franciscan Inn
Hotel Indigo Santa Barbara
Hotel Milo
Visit Santa Barbara– Santa Barbara South Coast Area Visitor Profile 2016/2017– Q1 Data (September-November 2016)
Hotel Santa Barbara
Inn by the Harbor
Pacific Crest Hotel Santa Barbara
Pacifica Suites
Ramada Santa Barbara
Simpson House Inn
Super 8 Goleta
The Eagle Inn
The Fess Parker a Doubletree by Hilton Resort
The Goodland
The Presidio
The Wayfarer
Page 6

In the remainder of this report, data from the survey findings is presented as follows:
Page 7
ABOUT THIS REPORT
• The aggregate total is shown in the chart on the left
• On the right, a data table shows the findings broken out by visitor place of stay:
1. Hotel—Visitors who stayed overnight at a Santa Barbara area hotel during their trip
2. VFR—Visitors who stayed overnight in a private residence of a friend or family member in the Santa Barbara area
3. Day Trip—Visitors who did not stay overnight anywhere in the Santa Barbara area
Note: findings for visitors who stayed in a private home rental was not broken out but is represented within the aggregate total charts.
Visit Santa Barbara– Santa Barbara South Coast Area Visitor Profile 2016/2017– Q1 Data (September-November 2016)
**For questions asked only in the Lodging Guest Survey or in the Visitor Intercept Survey, this is specified in the slide title.

DETAILED FINDINGS

Primary Reason for Visit
Question: Which best describes the primary reason for making this visit to the Santa Barbara South Coast area?
Visitors surveyed between September and November of 2016 came to the Santa Barbara area primarily for leisure. In total, 40.6 percent of visitors surveyed were in the
destination for a vacation, while 28.6 percent were on a getaway weekend. Approximately one-in-ten were in the Santa Barbara area for other personal travel (11.0%) or to visit
friends/relatives (9.5%). Additionally, 2.9 percent of visitors surveyed were in the Santa Barbara area for business or conference/group meetings.
Base: All respondents. 386 responses (weighted).
Figure 1: Primary Reason for Visit Detail by Type of Visitor
Page 9
Hotel Guest VFR Day Trip
Vacation 50.0% 22.6% 37.5%
Getaway weekend 20.9% 25.8% 31.9%
Other personal travel 6.8% 9.7% 12.5%
Visit friends and/or relatives in the area
8.1% 19.4% 9.7%
Attend a festival or special event 4.1% 12.9% 5.6%
Business travel 6.1% 3.2% 1.4%
Attend a wedding 2.7% 6.5% 1.4%
Conference, trade show or other group meeting
1.4% 0.0% 0.0%
Government travel 0.0% 0.0% 0.0%
Sample size: 148 62 144
0.0%
0.3%
1.9%
2.6%
5.4%
9.5%
11.0%
28.6%
40.6%
0% 20% 40% 60%
Government travel
Conference or other group meeting
Attend a wedding
Business travel
Attend a festival or special event
Visit friends/relatives in the area
Other personal travel
Getaway weekend
Vacation
Visit Santa Barbara– Santa Barbara South Coast Area Visitor Profile 2016/2017– Q1 Data (September-November 2016)

Business Travelers: Extended Stay in Santa Barbara for Leisure
A notable proportion of business travelers surveyed said they extended
their stay in Santa Barbara to accommodate leisure activities. Survey
respondents who were in the Santa Barbara area for business, group
meetings or government travel were asked if they extended their stay in
the destination beyond what was needed for their business to enjoy leisure
activities. In total, 16.8 percent of this group said they indeed stayed longer
in the area for this purpose.
*Please note the small sample size. This data should be considered informational and not directional.
Question: If here on business, did you extend your stay in Santa Barbara any additional days beyond what was needed for your business/meeting to accommodate leisure activities? Base: Respondents in the destination for business, group meetings or government travel. 11 responses (weighted).
Figure 2: Extended Stay in Santa Barbara for Leisure
Page 10
Yes, 16.8%
No, 83.2%
Visit Santa Barbara– Santa Barbara South Coast Area Visitor Profile 2016/2017– Q1 Data (September-November 2016)

Place of Stay
Through September to November of 2016, one-in-three visitors surveyed
stayed overnight in the Santa Barbara area during their visit (32.4%). Of
these overnight visitors, 24.0 percent stayed in a Santa Barbara area hotel,
5.3 percent stayed in a private residence and 1.9 percent stayed in private
home rental. The percentage of visitors surveyed who stayed overnight in
Santa Barbara is comparable to the findings in Q1 of the 2012 Visitor Profile
study (32.4% for 2016/2017 vs. 35.4% for 2012). Day-trippers—including
those staying in paid or private accommodations outside the Santa Barbara
area and regional residents on leisure day trips—represented 67.6 percent
of visitors surveyed.
Question: Where are you staying overnight on this visit to the Santa Barbara South Coast area? Base: All respondents. 398 responses (weighted).
Figure 3: Place of Stay
Page 11
56.7%
11.0%
1.2%
1.9%
5.3%
24.0%
0% 20% 40% 60%
Regional resident on a day-trip
Staying in paid or privateaccommodations outside Santa
Barbara South Coast area
Campground/RV site, vacationhome/timeshare, any other type inthe Santa Barbara South Coast area
Home sharing rental (i.e. Airbnb,Homeaway, VRBO) in the Santa
Barbara South Coast area
Private residence of friend or familymember in the Santa Barbara South
Coast area
Hotel, motel, inn, B&B, or hostel inthe Santa Barbara South Coast area
Visit Santa Barbara– Santa Barbara South Coast Area Visitor Profile 2016/2017– Q1 Data (September-November 2016)

Hotel Guests: Method of Booking Lodging Reservation (Intercept Survey)
Question: How was your Santa Barbara South Coast area lodging reservation(s) made? (Select all that apply) Base: Respondents staying overnight in a Santa Barbara hotel; intercept survey only. 79 responses (weighted).
Figure 4: Method of Booking Lodging ReservationOvernight visitors who stayed in paid accommodations in the Santa Barbara
area typically booked their lodging through a travel website or directly
through the hotel’s website. Survey respondents who reported staying
overnight in commercial lodging in the Santa Barbara area were asked how
they made their reservations. One-in-three visitors from this group booked
their reservation through a travel website (31.6%). Another 27.8 percent made
their reservation on the hotel’s website and 8.9 percent called their hotel
directly.
Page 12
3.8%
0.0%
1.3%
1.3%
5.1%
8.9%
27.8%
31.6%
0% 20% 40%
Other
SantaBarbaraCA.com
My company booked it
By my tour arranger/operator or AAA
Travel agent
Telephone call directly to hotel
Hotel’s website
Travel website (Hotels.com, etc.)
Visit Santa Barbara– Santa Barbara South Coast Area Visitor Profile 2016/2017– Q1 Data (September-November 2016)

Hotel Guests: Number of People in Hotel Room
Question: Including yourself, how many people are staying/stayed in your hotel room? Base: Respondents staying overnight in a Santa Barbara hotel.136 responses (weighted).
Figure 5: Number of People in Hotel RoomThe average Santa Barbara area hotel guest had 2.1 people in their room,
including themselves. Visitors who stayed in a Santa Barbara area hotel
were asked how many people, including themselves, stayed in their room. A
large majority, 73.5 percent, stayed with one other person. 13.2 percent of
this group were the sole occupant.
Page 13
13.2%
73.5%
6.6%
3.7%
2.9%
0% 20% 40% 60% 80%
1
2
3
4
5
Mean = 2.1
Visit Santa Barbara– Santa Barbara South Coast Area Visitor Profile 2016/2017– Q1 Data (September-November 2016)
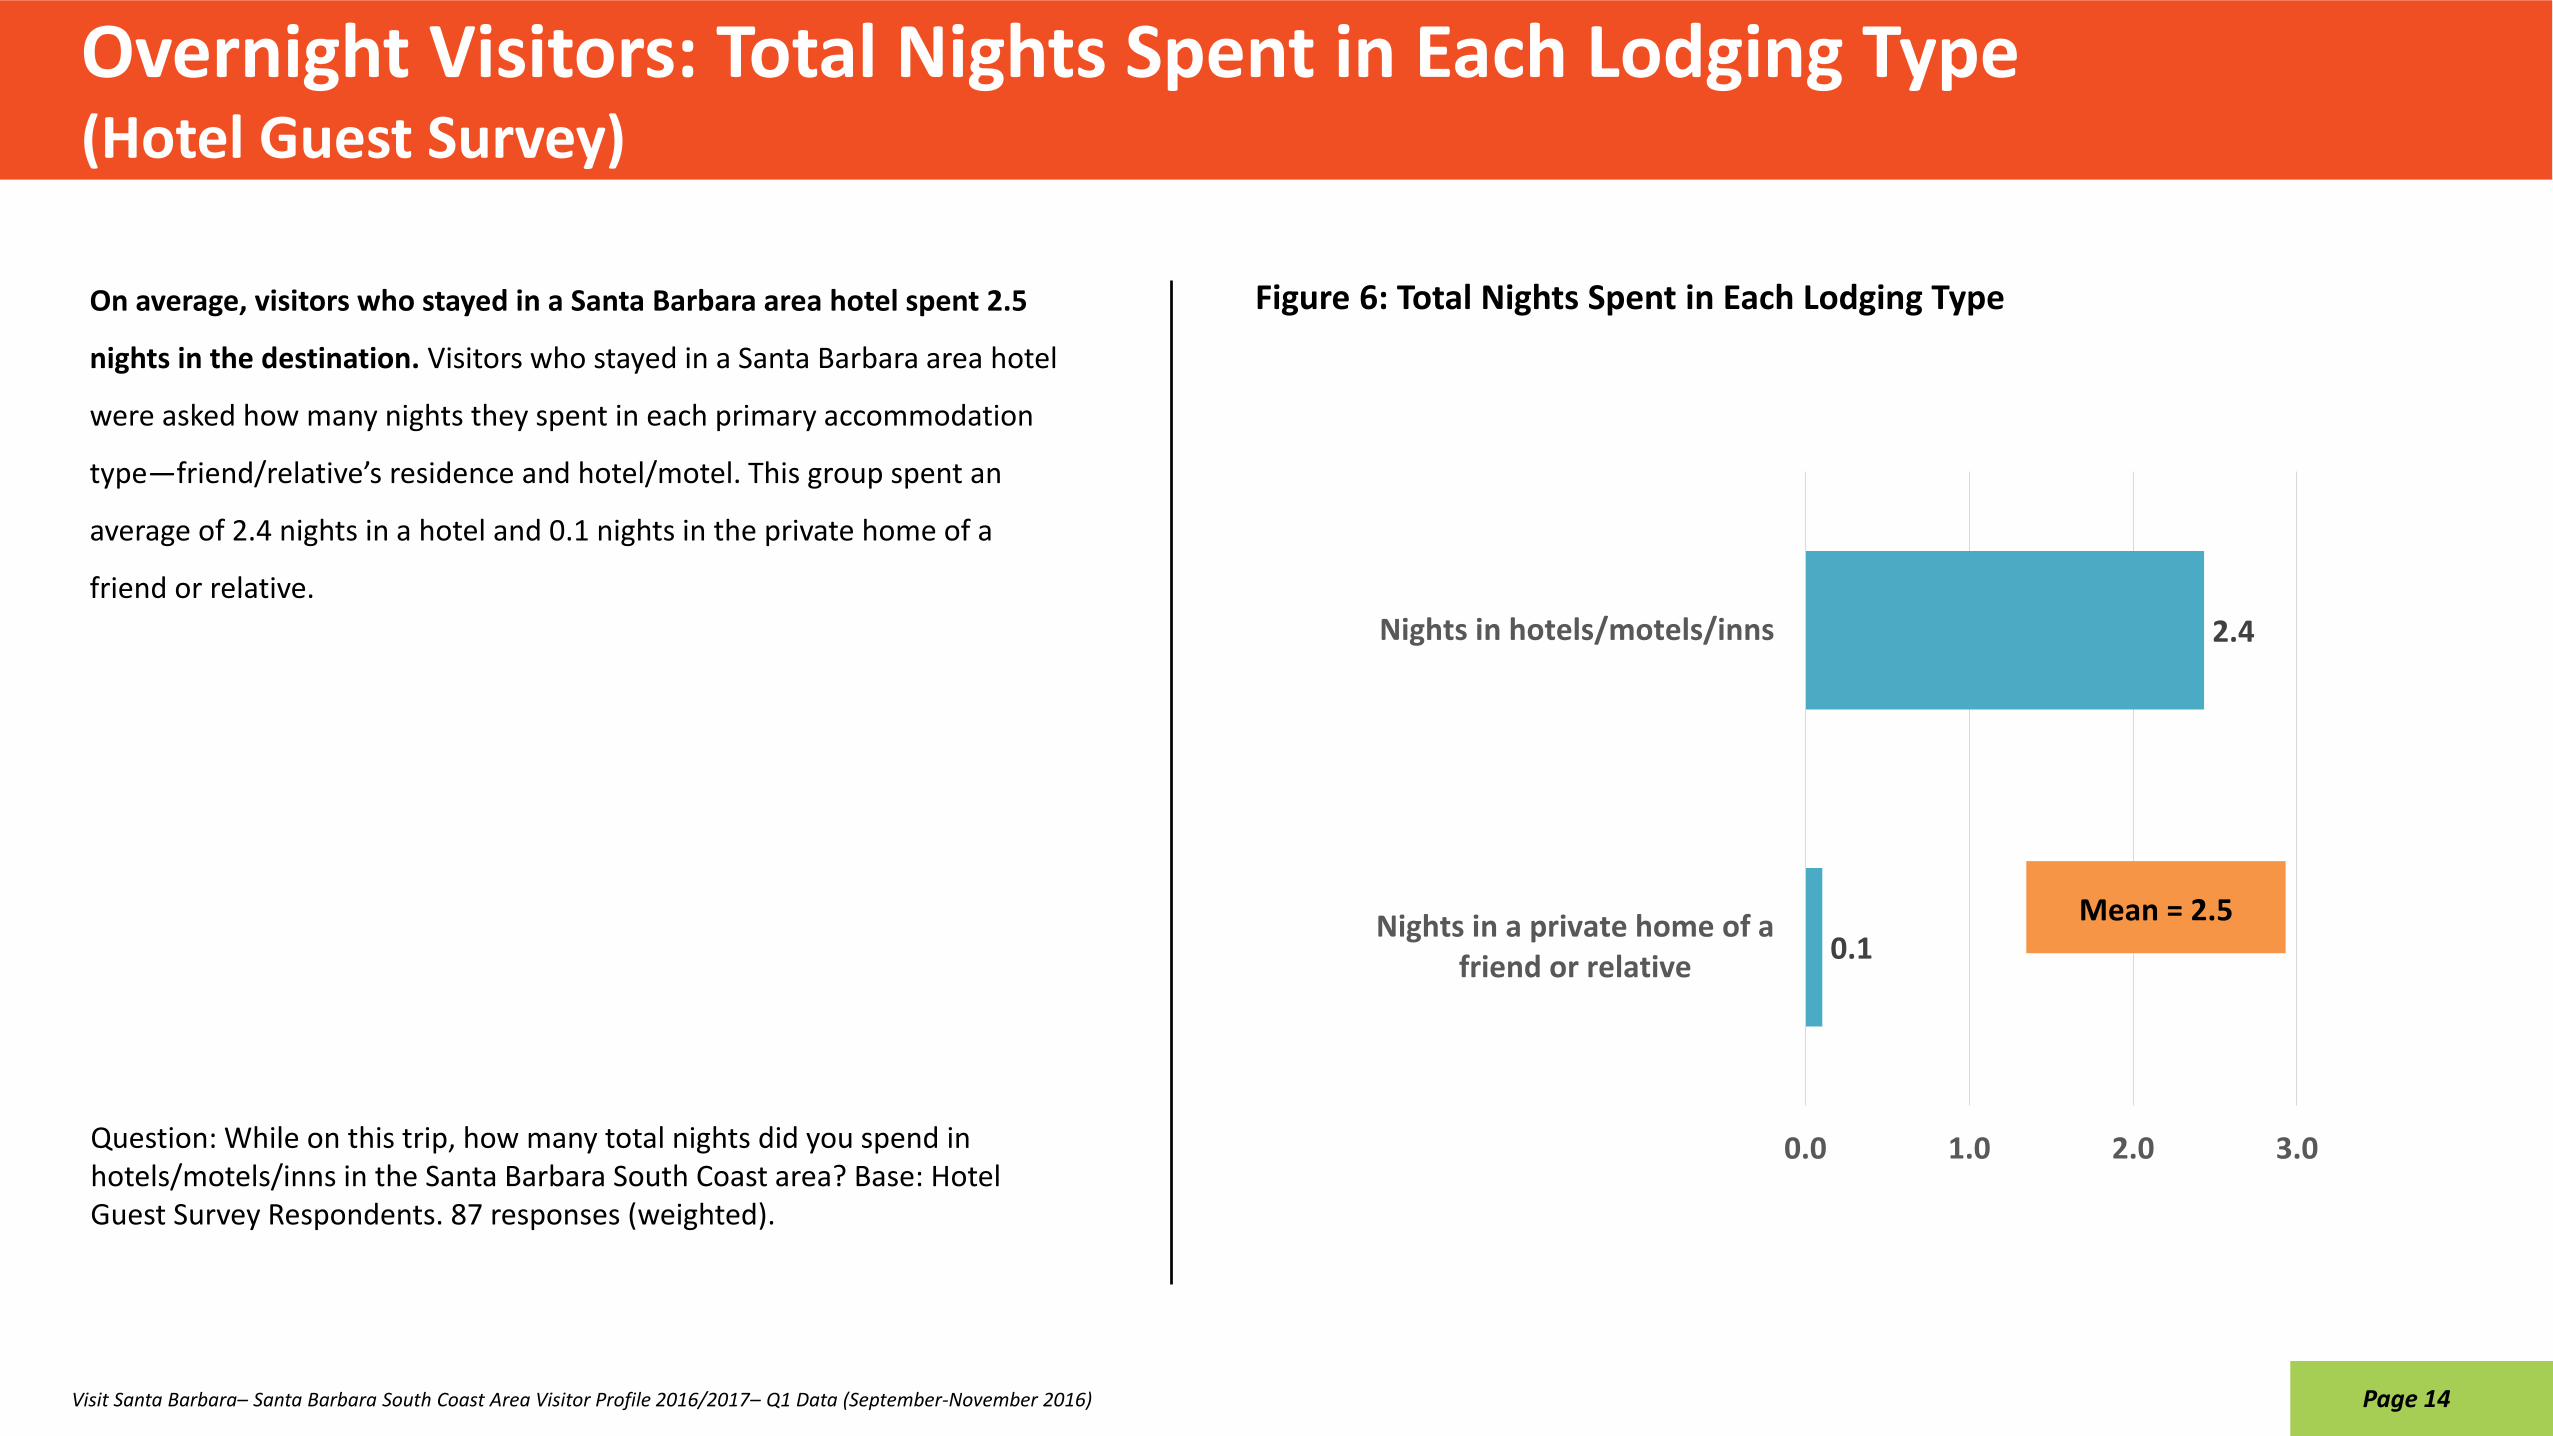
Overnight Visitors: Total Nights Spent in Each Lodging Type (Hotel Guest Survey)
Question: While on this trip, how many total nights did you spend in hotels/motels/inns in the Santa Barbara South Coast area? Base: Hotel Guest Survey Respondents. 87 responses (weighted).
Figure 6: Total Nights Spent in Each Lodging TypeOn average, visitors who stayed in a Santa Barbara area hotel spent 2.5
nights in the destination. Visitors who stayed in a Santa Barbara area hotel
were asked how many nights they spent in each primary accommodation
type—friend/relative’s residence and hotel/motel. This group spent an
average of 2.4 nights in a hotel and 0.1 nights in the private home of a
friend or relative.
Page 14
0.1
2.4
0.0 1.0 2.0 3.0
Nights in a private home of afriend or relative
Nights in hotels/motels/inns
Visit Santa Barbara– Santa Barbara South Coast Area Visitor Profile 2016/2017– Q1 Data (September-November 2016)
Mean = 2.5

Day Trip Visitors: Reasons for not Staying Overnight in Santa Barbara (Intercept Survey)
Question: Why did you decide to not stay overnight in the Santa Barbara South Coast on this trip? (Select all that apply) Base: Respondents who did not stay overnight in the Santa Barbara area. 188 responses (weighted).
Figure 7: Reasons for not Staying Overnight in Santa BarbaraOver 40 percent of day-trip visitors surveyed said they did not stay overnight
in the Santa Barbara area because they live close to the destination (46.0%).
Another 14.0 percent cited “not having enough time” as their reason for not
staying overnight in the area. Additionally, approximately one-in-ten were
staying elsewhere close to Santa Barbara (10.0%) or felt hotels were too
expensive (8.0%) to stay overnight in the destination.
Page 15
30.0%
0.0%
2.0%
8.0%
10.0%
14.0%
46.0%
0% 20% 40% 60%
Other
No hotel room availability
I didn't select my accommodations
Hotels are too expensive
I'm staying elsewhere close to SantaBarbara
I did not have enough time
I live close to Santa Barbara
Visit Santa Barbara– Santa Barbara South Coast Area Visitor Profile 2016/2017– Q1 Data (September-November 2016)

Weeks of Advanced Trip Planning
Question: How many weeks before leaving home did you begin planning this trip?
The average trip planning period across all visitor segments is 3.8 weeks in advance of the trip. Hotel guests (6.3) and VFRs (4.3) have longer planning windows, with an
average of 6.3 and 4.3 weeks of advance travel planning. In contrast, day-trip visitors planning window averaged 2.6 weeks, with three-in-ten of these visitors not doing any
advanced planning for the Santa Barbara area trip (30.2%).
Base: All respondents. 293 responses (weighted).
Figure 8: Weeks of Advanced Trip Planning Detail by Type of Visitor
Page 16
Hotel Guest VFR Day Trip
7 or more 39.0% 24.0% 11.3%
6 6.5% 0.0% 5.7%
5 3.3% 8.0% 0.0%
4 16.3% 16.0% 7.5%
3 8.9% 8.0% 7.5%
2 9.8% 24.0% 18.9%
1 13.8% 12.0% 18.9%
0 2.4% 4.0% 30.2%
Mean 6.3 4.3 2.6
Sample size: 123 50 106
Visit Santa Barbara– Santa Barbara South Coast Area Visitor Profile 2016/2017– Q1 Data (September-November 2016)
21.0%
17.2%
16.5%
7.7%
10.3%
1.3%
5.7%
20.0%
0% 10% 20% 30% 40%
0
1
2
3
4
5
6
7 or more
Mean = 3.8 weeks

Days & Nights in the Santa Barbara Area (Intercept Survey)
Question: How many days and nights are you staying in Santa Barbara area? Base: All respondents. 318 responses (weighted).
The average Santa Barbara area visitor surveyed between September and November of 2016 spent an average of 1.4 days and 0.5 nights in the area during their trip. Hotel
guests had the longest length of stay averaging 3.2 days and 2.8 nights in the Santa Barbara area.
Figure 9: Days & Nights in the Santa Barbara Area Detail by Type of Visitor
Page 17
Q1 Total
5 or more 3.4%
4 2.4%
3 5.3%
2 4.8%
1 84.1%
Mean # of Days 1.4
5 or more 3.2%
4 1.6%
3 3.9%
2 5.4%
1 7.0%
0 79.0%
Mean # of nights 0.5
Hotel Guest VFR Day Trip
5 or more 14.5% 23.5% 0.0%
4 16.4% 17.6% 0.0%
3 25.5% 35.3% 1.4%
2 23.6% 17.6% 1.4%
1 20.0% 5.9% 97.3%
Mean # of Days 3.2 3.1 1.0
5 or more 12.7% 23.5% --
4 9.1% 17.6% --
3 21.8% 11.8% --
2 25.5% 29.4% --
1 30.9% 17.6% --
0 0.0% 0.0% 100.0%
Mean # of nights 2.8 2.7 0.0
Sample size: 55 34 146
Visit Santa Barbara– Santa Barbara South Coast Area Visitor Profile 2016/2017– Q1 Data (September-November 2016)

Travel Party Composition
Question: Please tell us how many people (including yourself) are in your immediate travel party.
Through the first quarter of the survey, the typical travel party to the Santa Barbara area was comprised of 3.1 persons. The average travel party included 1.2 adult females
and 1.2 adult males. Day-trip visitors had an average travel party comprised of 3.4 people, while hotel guests had smaller travel parties – averaging 2.6 people. Approximately
three-in-ten of all travel parties surveyed had children in them (29.3%). Day-trip visitors were the most likely to have children in their traveling party compared to the other
visitor segments (37.5% for day-trip vs. 8.3% for hotel guests and 18.8% for VFRs).
Base: All respondents. 385 responses (weighted).
Figure 10: Travel Party Composition Detail by Type of Visitor
Page 18
Hotel Guest VFR Day Trip
Male adults (18+ years) 1.1 0.8 1.3
Female adults (18+ years) 1.3 0.7 1.2
Male children (17 years or under)
0.1 0.2 0.5
Female children (17 years or under)
0.1 0.1 0.4
% of travel parties with children 8.3% 18.8% 37.5%
Mean 2.6 1.8 3.4
Sample size: 145 64 144
Visit Santa Barbara– Santa Barbara South Coast Area Visitor Profile 2016/2017– Q1 Data (September-November 2016)
0.3
0.4
1.2
1.2
0.0 0.4 0.8 1.2 1.6
Female children (0-17 years)
Male children (0-17 years)
Females adults (18+ years)
Male adults (18+ years)
Mean = 3.1 people

Method of Arrival
Question: How did you arrive in the Santa Barbara area area? (Select one)
Three-quarters of visitors surveyed between September and November of 2016 arrived to the Santa Barbara area by car, either in a personal (59.2%) or rental vehicle
(16.2%). The next most common method of arrival was commercial airline, reported by 7.2 percent of respondents.
Base: All respondents. 391 responses (weighted).
Figure 11: Method of Arrival Detail by Type of Visitor
Page 19
8.7%
0.0%
0.5%
0.9%
1.1%
1.2%
2.0%
2.9%
7.2%
16.2%
59.2%
0% 20% 40% 60% 80%
Other
Private Plane/Charter Airline
Shuttle bus (e.g. airport transportation)
Bicycle
RV/Motor Home
Tour bus
Motorcycle
Train/Amtrak
Commercial Airline
Rental Vehicle
Personal Vehicle
Hotel Guest VFR Day Trip
Personal Vehicle 53.1% 62.5% 62.2%
Rental Vehicle 22.4% 12.5% 14.9%
Commercial Airline 14.0% 15.6% 4.1%
Train/Amtrak 6.3% 6.3% 1.4%
Motorcycle 0.7% 0.0% 2.7%
Tour bus 1.4% 0.0% 1.4%
RV/Motor Home 0.0% 0.0% 0.0%
Bicycle 0.0% 0.0% 1.4%
Shuttle bus (e.g. airport transportation)
0.7% 3.1% 0.0%
Private Plane/Charter Airline 0.0% 0.0% 0.0%
Other 1.4% 0.0% 12.2%
Sample size: 143 64 148
Visit Santa Barbara– Santa Barbara South Coast Area Visitor Profile 2016/2017– Q1 Data (September-November 2016)

Transportation Used In-Market (Intercept Survey)
Question: How did you (or will you) get around the Santa Barbara South Coast area? (Select all that apply)
Nearly three-quarters of visitors surveyed used a personal or rental vehicle while in-market (73.6%). In addition, over half of visitors walked (52.4%), while another 9.5 percent
used a public bus or shuttle to get around the Santa Barbara area. Ride-sharing services like Uber and Lyft were used by 4.5 percent, while taxis were used by 1.1 percent of
visitors surveyed. Compared to other visitor types, hotel guest visitors were more likely to use a rental car (28.1%) and a public bus/shuttle (15.6%).
Base: All respondents. 342 responses (weighted).
Figure 12: Transportation Used In-Market Detail by Type of Visitor
Page 20
0.5%
1.1%
4.0%
4.5%
5.9%
9.5%
11.8%
52.4%
61.8%
0% 20% 40% 60% 80%
RV/Motor Home
Taxi
Bicycle
Uber or Lyft
Tour Bus
Public Bus/Shuttle
Rental Vehicle
Walking
Personal Vehicle
Hotel Guest VFR Day Trip
Personal Vehicle 54.7% 75.8% 62.2%
Walking 54.7% 42.4% 54.1%
Rental Vehicle 28.1% 6.1% 9.5%
Public Bus/Shuttle 15.6% 9.1% 8.1%
Tour Bus 3.1% 3.0% 6.8%
Uber or Lyft 3.1% 12.1% 4.1%
Bicycle 6.3% 15.2% 2.7%
Taxi 0.0% 0.0% 1.4%
RV/Motor Home 0.0% 0.0% 0.0%
Sample size: 64 66 148
Visit Santa Barbara– Santa Barbara South Coast Area Visitor Profile 2016/2017– Q1 Data (September-November 2016)

Daily Spending, Per Travel Party
Question: How much PER DAY did (or will) your immediate party spend on each of the following while in the Santa Barbara South Coast area?
Through the first quarter of the survey, visiting travel parties to the Santa Barbara area spent an average of $302.21 per day in the destination. A majority of this spending is
attributed to lodging ($91.23 across all visitor segments – Hotel guests spent an average of $239.24 for lodging) and restaurants ($68.63). Hotel guests represent the greatest visitor
spend, averaging $527.73 per day, per travel party. Overall spending is up significantly compared to findings in the 2012 Visitor Profile ($255.75) with the most notable spending
increases on lodging ($91.23 in 2016 vs. $64.07 in 2012), entertainment & sightseeing ($47.07 in 2016 vs. $19.32 in 2012) and local transportation ($22.15 in 2016 and $11.90 in 2012).
Base: All respondents. 380 responses (weighted).
Figure 13: Daily Spending, Per Travel Party Detail by Type of Visitor
Page 21
$1.30
$8.75
$9.30
$13.18
$16.99
$19.21
$21.37
$22.15
$30.08
$68.63
$91.23
$0 $20 $40 $60 $80 $100
Spa/Beauty/Health Club Services
Wine Tasting Fees/Wine Tours
Wine (Bottles purchased)
Groceries/Personal Items
Entertainment
Shopping (Gifts/Souvenirs)
Shopping (Clothing/Jewelry)
Local Transportation
Sightseeing & Activities
Restaurants & Dining
Hotel/Lodging
Mean spending per travel party
= $302.21
Hotel Guest VFR Day Trip
Hotel/Lodging $239.24 $0.00 $0.00
Restaurants & Dining $121.24 $83.94 $48.69
Sightseeing & Activities $18.75 $25.97 $34.56
Local Transportation $16.94 $27.48 $23.37
Shopping (Clothing/Jewelry) $42.60 $66.61 $11.30
Shopping (Gifts/Souvenirs) $21.32 $38.65 $17.37
Entertainment $21.94 $14.90 $14.63
Groceries/Personal Items $14.49 $32.26 $11.15
Wine (Bottles purchased) $12.13 $17.74 $7.46
Wine Tasting Fees/Wine Tours $14.63 $18.06 $4.79
Spa/Beauty/Health Club Services $4.44 $5.00 $0.00
Mean spending per travel party: $527.73 $330.61 $173.33
Sample size: 144 62 142
Visit Santa Barbara– Santa Barbara South Coast Area Visitor Profile 2016/2017– Q1 Data (September-November 2016)

Daily Spending, Per Person
Question: How many persons’ travel expenses does this spending fully cover?
It is estimated that the average Santa Barbara area visitor represents $99.72 in daily in-market spending. This is based on the reported daily spending of $302.21 covering an
average of 3.0 travelers. When comparing these findings to the 2012 Visitor Profile, per person daily spending in Santa Barbara for Hotel Guests has increased considerably ($221.20
for 2016 and $200.30 for 2012).
Base: All respondents. 380 responses (weighted).
Figure 14: Daily Spending, Per Person Detail by Type of Visitor
Page 22
$0.43
$2.89
$3.07
$4.35
$5.61
$6.34
$7.05
$7.31
$9.93
$22.65
$30.11
$0 $10 $20 $30 $40
Spa/Beauty/Health Club Services
Wine Tasting Fees/Wine Tours
Wine (Bottles purchased)
Groceries/Personal Items
Entertainment
Shopping (Gifts/Souvenirs)
Shopping (Clothing/Jewelry)
Local Transportation
Sightseeing & Activities
Restaurants & Dining
Hotel/Lodging
Mean spending per person =
$99.72
Hotel Guest VFR Day Trip
Hotel/Lodging $100.28 $0.00 $0.00
Restaurants & Dining $50.82 $44.97 $14.43
Sightseeing & Activities $7.86 $13.91 $10.25
Local Transportation $7.10 $14.72 $6.93
Shopping (Clothing/Jewelry) $17.86 $35.69 $3.35
Shopping (Gifts/Souvenirs) $8.94 $20.70 $5.15
Entertainment $9.20 $7.98 $4.34
Groceries/Personal Items $6.07 $17.28 $3.31
Wine (Bottles purchased) $5.09 $9.50 $2.21
Wine Tasting Fees/Wine Tours $6.13 $9.68 $1.42
Spa/Beauty/Health Club Services $1.86 $2.68 $0.00
Mean # of people covered by spending: 2.4 1.9 3.4
Mean spending per travel party: $221.20 $177.11 $51.39
Sample size: 144 62 142
Visit Santa Barbara– Santa Barbara South Coast Area Visitor Profile 2016/2017– Q1 Data (September-November 2016)

Santa Barbara County Areas Visited
Question: On this trip, which of these Santa Barbara County areas and towns did you visit? (Select all that apply)
Visitors surveyed between September and November of 2016 were most likely to have visited the city of Santa Barbara, Montecito and Goleta during their trip. Survey
respondents were asked which Santa Barbara County areas and towns they visited. A large majority visited the city of Santa Barbara (87.6%) while one-in-five visited Montecito
(20.4%) and Goleta (20.1%). Hotel guests were the most likely to visit the city of Santa Barbara and the Santa Ynez Valley compared to the other visitor segments.
Base: All respondents. 396 responses (weighted).
Figure 15: Santa Barbara County Areas Visited Detail by Type of Visitor
Page 23
5.9%
8.2%
11.1%
12.8%
20.1%
20.4%
87.6%
0% 20% 40% 60% 80% 100%
Summerland
Santa Maria Valley
Lompoc
Santa Ynez Valley/Solvang/LosOlivos
Goleta
Montecito
Santa Barbara (city of)Hotel Guest VFR Day Trip
Santa Barbara (city of) 91.4% 84.8% 86.5%
Montecito 15.9% 33.3% 21.6%
Goleta 15.9% 48.5% 17.6%
Santa Ynez Valley/Solvang/Los Olivos 16.6% 9.1% 10.8%
Lompoc 6.6% 15.2% 12.2%
Santa Maria Valley 5.3% 6.1% 9.5%
Summerland 6.0% 15.2% 5.4%
Sample size: 151 66 148
Visit Santa Barbara– Santa Barbara South Coast Area Visitor Profile 2016/2017– Q1 Data (September-November 2016)

Activities Participated in while in the Santa Barbara Area
Question: On this trip, which of the following activities did you (or will you) participate in while in Santa Barbara South Coast area? (Select all that apply) Base: All respondents. 396 responses (weighted).
Visitors surveyed between September and November of 2016 participated in
a variety of activities while in the Santa Barbara area. Visitors surveyed were
presented with a list of activities and asked which they participated in during
their time in the Santa Barbara area. The chart to the right shows the top
activities visitors participated in during their trip. Of these, dining in restaurants
(64.0%) and going to the beach (61.7%) were, by far, the most popular activities
amongst Santa Barbara area visitors. These were followed by shopping (35.8%),
visiting gardens or parks (26.7%), visiting museums (20.1%) and bars or nightlife
(19.4%). In comparing these findings to Q1 of the 2012 Visitor Profile we see
that a notably higher percentage of Hotel Guests surveyed in 2016 participated
in wine tasting in Santa Barbara City (15.9% in 2016 –see data on next page vs.
10.1% in 2012).
The full list of activities tested are shown in a table segmented by visitor place of stay on the next page.
Figure 16: Top Activities Participated in while in the Santa Barbara Area
Page 24
9.0%
9.0%
10.3%
10.3%
10.6%
12.8%
14.0%
19.4%
20.1%
26.7%
35.8%
61.7%
64.0%
0% 20% 40% 60% 80%
Historic Walking Tours
Guided Tours
Recreational Bicycling
Art Gallery
Wine Tasting in Santa Barbara City
Hiking
Family Friendly Activities
Bars or Nightlife
Visit Museums
Visit Gardens/Parks
Shopping
Beaches
Dining in Restaurants
Visit Santa Barbara– Santa Barbara South Coast Area Visitor Profile 2016/2017– Q1 Data (September-November 2016)

Activities – Full Detail
Question: On this trip, which of the following activities did you (or will you) participate in while in the Santa Barbara South Coast area? (Select all that apply)
Base: All respondents. 396 responses (weighted).
Detail by Type of Visitor
Page 25
Hotel Guest VFR Day TripDining in Restaurants 78.1% 63.6% 58.1%
Beaches 62.3% 72.7% 59.5%Shopping 47.7% 54.5% 29.7%
Visit Gardens/Parks 22.5% 24.2% 28.4%Visit Museums 22.5% 24.2% 18.9%
Bars or Nightlife 21.9% 36.4% 16.2%Family Friendly Activities 12.6% 24.2% 12.2%
Hiking 15.9% 30.3% 9.5%Wine Tasting in Santa Barbara City 15.9% 18.2% 8.1%
Art Gallery 9.3% 15.2% 10.8%Recreational Bicycling 12.6% 18.2% 8.1%
Guided Tours 11.3% 12.1% 8.1%Historic Walking Tours 13.2% 6.1% 8.1%
View Theater/Performing Arts 11.9% 18.2% 5.4%Beer Tasting 7.9% 9.1% 5.4%
Kayaking 3.3% 18.2% 4.1%Surfing / Stand-up Paddle Boarding 2.0% 12.1% 4.1%
Special Event or Festival 10.6% 9.1% 1.4%Whale watching 2.6% 6.1% 4.1%
Wine Tasting in Santa Ynez Valley 7.9% 0.0% 1.4%Sailing 1.3% 3.0% 2.7%
Visit Spa 3.3% 0.0% 1.4%Sports Tournament or Event 2.0% 0.0% 1.4%
Channel Islands excursion 0.7% 0.0% 1.4%Wine Tasting in Lompoc 2.6% 0.0% 0.0%
Golfing 0.7% 0.0% 0.0%
Wine Tasting in Santa Maria Valley 1.3% 0.0% 0.0%
Cycling (Organized Tour, Event, Race or Independent Touring) 1.3% 0.0% 0.0%Sample size: 151 66 148

Attractions Visited while in the Santa Barbara Area
Santa Barbara area visitors surveyed between September and November 2016
went to many area attractions while in the destination. Presented with a list of
15 Santa Barbara area sites and attractions, respondents were asked to identify
which they had or planned to visit during their trip. The most frequented
attractions were Downtown/State Street (55.3%), Santa Barbara Harbor (52.5%)
and Stearns Wharf (43.0%). Approximately one-quarter of survey respondents
also visited the Santa Barbara Wharf/Pier (27.6%), Santa Barbara Paseo Nuevo
(23.8%) and Old Mission Santa Barbara (23.1%). Compared to findings in the
2012 Visitor Profile we see that Downtown/State Street continues to be one of
the top frequented attractions in Santa Barbara.
The full list of sites and attractions tested are shown in a table segmented by
visitor place of stay on the next page.
Question: On this trip, which of the following did you (or will you) visit while in Santa Barbara area? (Select all that apply) Base: All respondents. 396 responses (weighted).
Figure 17: Attractions Visited while in the Santa Barbara area
Page 26
0.7%
0.8%
1.1%
1.6%
3.3%
6.6%
12.8%
13.5%
21.7%
23.1%
23.8%
27.6%
43.0%
52.5%
55.3%
0% 20% 40% 60%
Goleta Stow House
Lake Los Carneros
Goleta Butterfly Grove
El Presidio de Santa Barbara Historic State Park
Goleta Beach
UCSB/SBCC
Other historic or architectural sites
Santa Barbara Courthouse
Funk Zone
Old Mission Santa Barbara
Santa Barbara Paseo Nuevo
Santa Barbara Wharf/Pier
Stearns Wharf
Santa Barbara Harbor
Downtown /State Street
Visit Santa Barbara– Santa Barbara South Coast Area Visitor Profile 2016/2017– Q1 Data (September-November 2016)

Attractions Visited – Complete Detail
Page 27
Detail by Type of Visitor
Question: On this trip, which of the following did you (or will you) visit while in the Santa Barbara South Coast area? (Select all that apply)
Base: All respondents. 396 responses (weighted).
Hotel Guest VFR Day Trip
Downtown/State Street 71.5% 84.8% 45.9%
Santa Barbara Harbor 58.9% 60.6% 48.6%
Stearns Wharf 53.0% 60.6% 36.5%
Santa Barbara Wharf/Pier 38.4% 45.5% 21.6%
Santa Barbara Paseo Nuevo 23.2% 36.4% 21.6%
Old Mission Santa Barbara 31.8% 48.5% 17.6%
Funk Zone 18.5% 42.4% 20.3%
Santa Barbara Courthouse 17.2% 24.2% 10.8%
Other historic or architectural sites 6.6% 0.0% 16.2%
UCSB/SBCC 7.3% 24.2% 4.1%
Goleta Beach 4.6% 9.1% 1.4%
El Presidio de Santa Barbara Historic State Park 5.3% 3.0% 0.0%
Goleta Butterfly Grove 1.3% 6.1% 0.0%
Lake Los Carneros 0.7% 9.1% 0.0%
Goleta Stow House 0.7% 6.1% 0.0%
Sample size: 151 66 148
Visit Santa Barbara– Santa Barbara South Coast Area Visitor Profile 2016/2017– Q1 Data (September-November 2016)
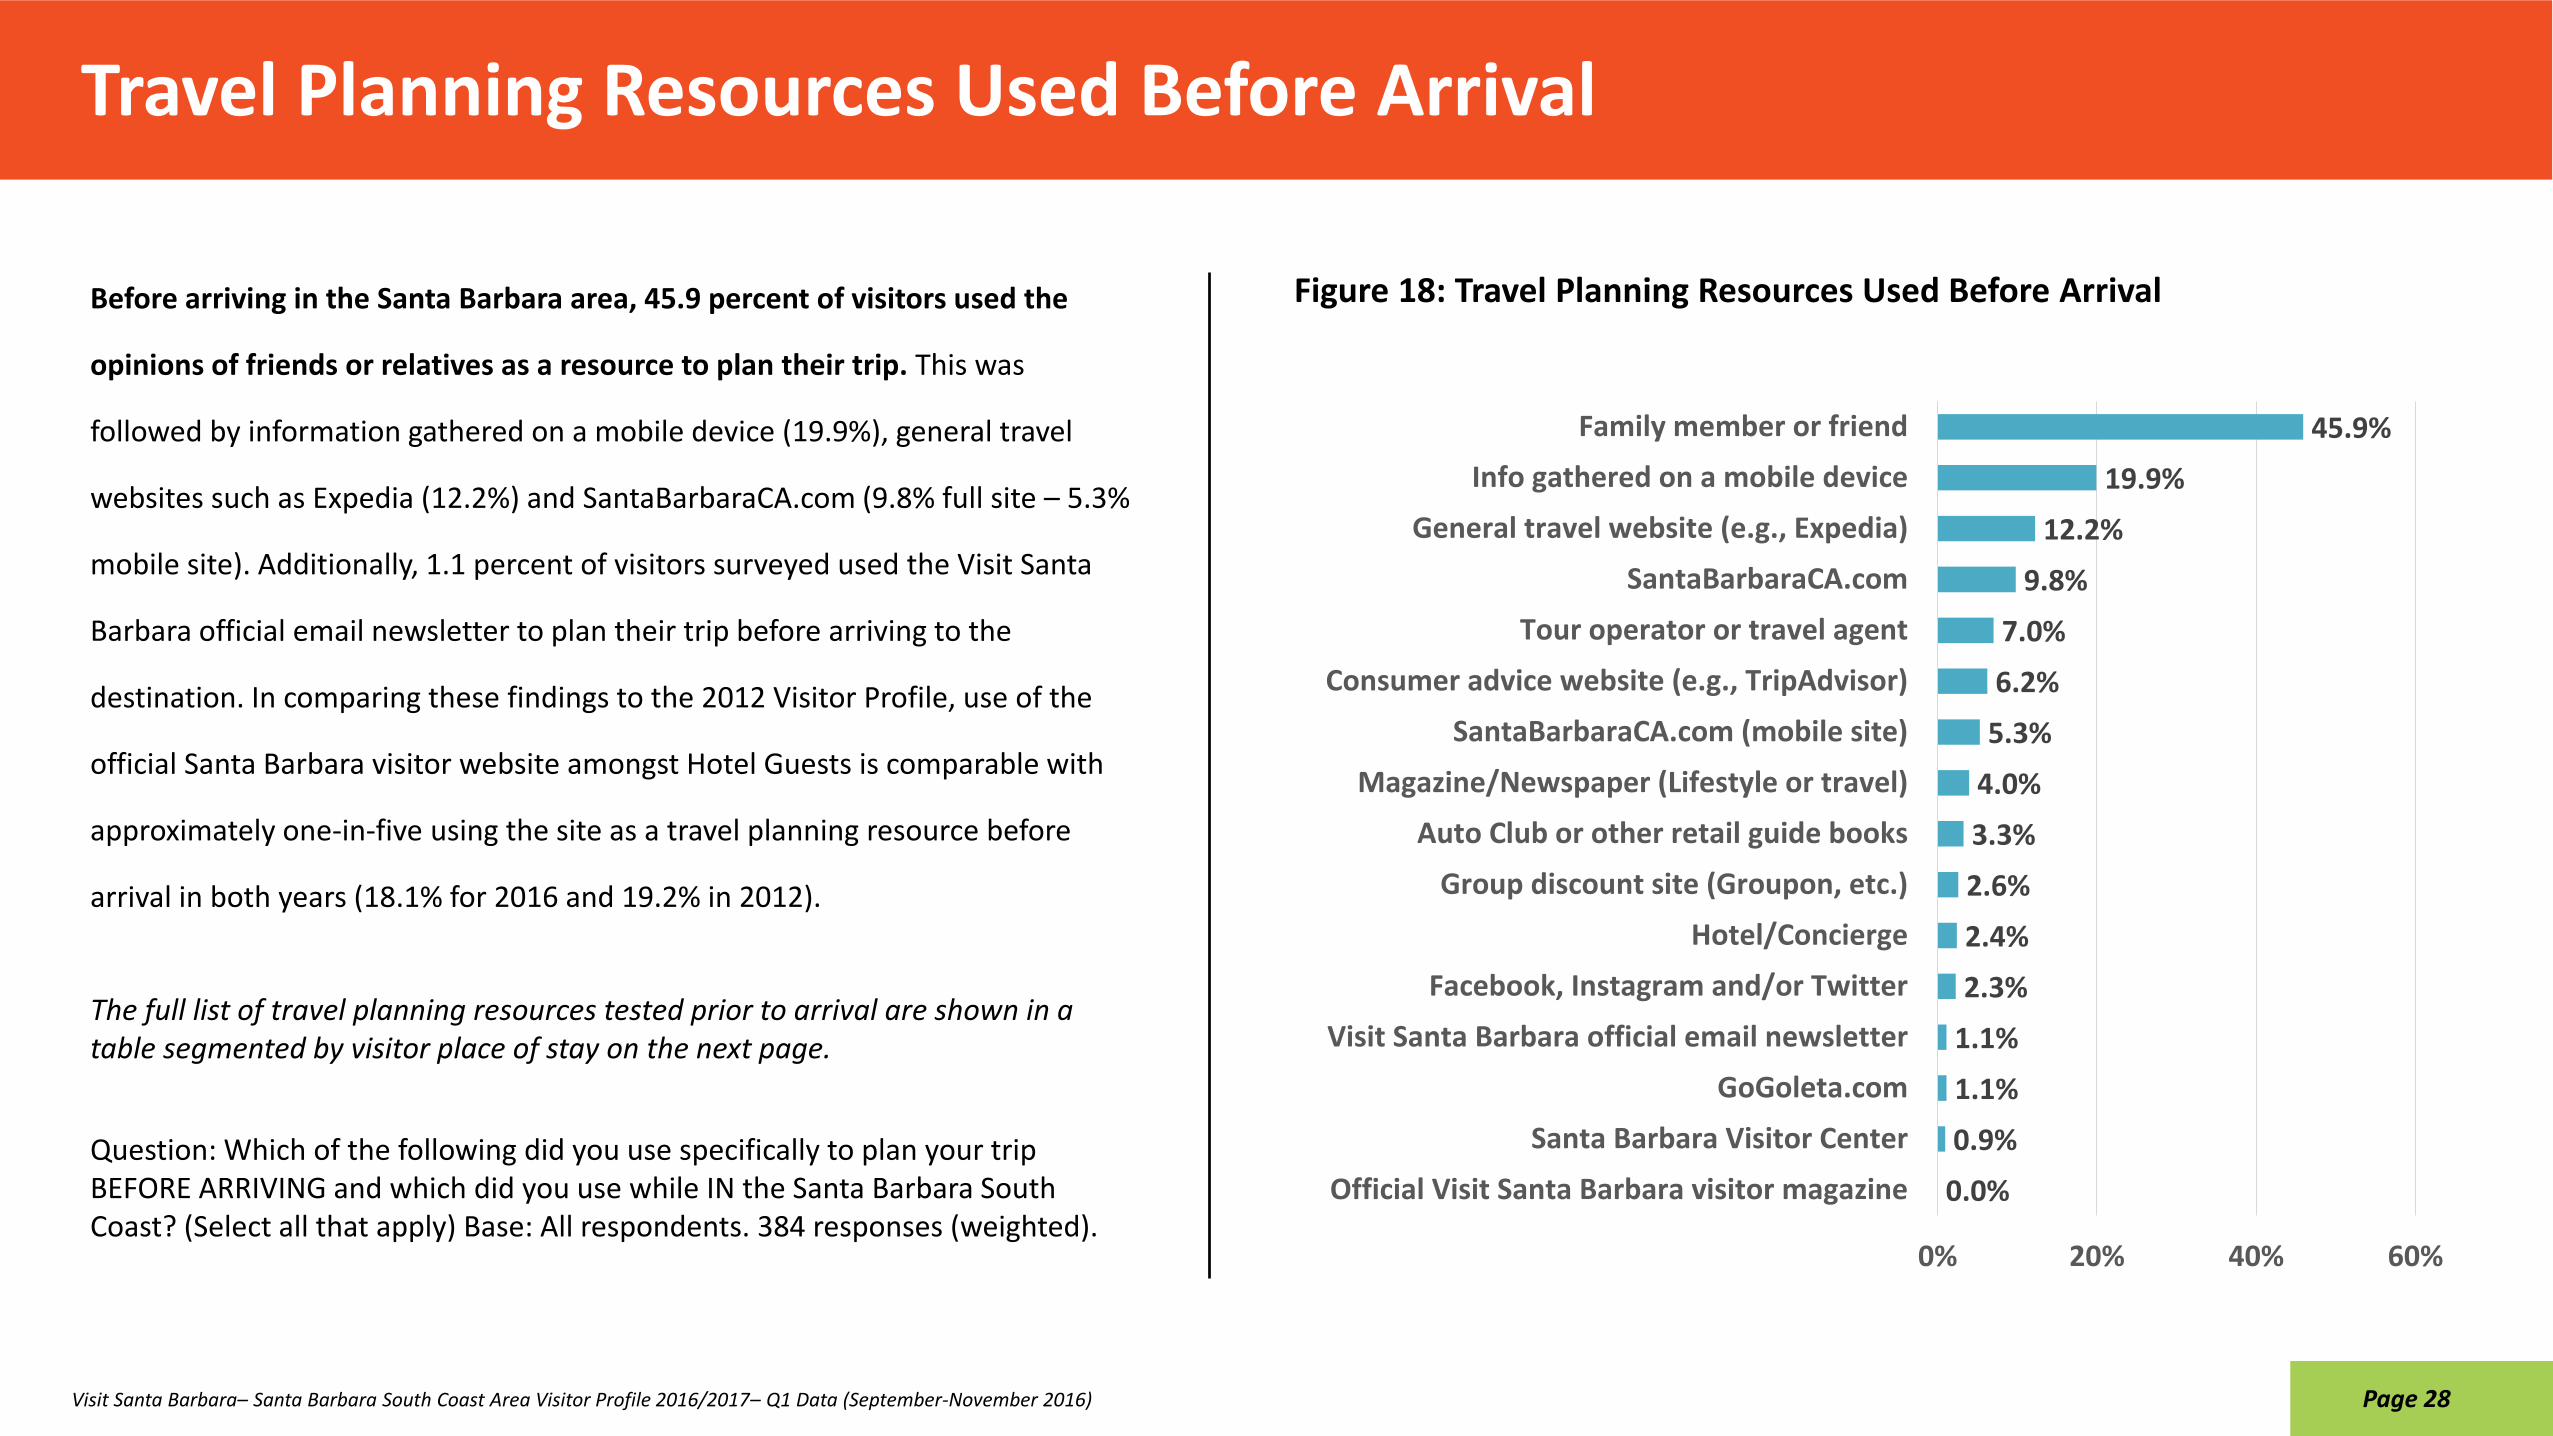
Travel Planning Resources Used Before Arrival
Question: Which of the following did you use specifically to plan your trip BEFORE ARRIVING and which did you use while IN the Santa Barbara South Coast? (Select all that apply) Base: All respondents. 384 responses (weighted).
Before arriving in the Santa Barbara area, 45.9 percent of visitors used the
opinions of friends or relatives as a resource to plan their trip. This was
followed by information gathered on a mobile device (19.9%), general travel
websites such as Expedia (12.2%) and SantaBarbaraCA.com (9.8% full site – 5.3%
mobile site). Additionally, 1.1 percent of visitors surveyed used the Visit Santa
Barbara official email newsletter to plan their trip before arriving to the
destination. In comparing these findings to the 2012 Visitor Profile, use of the
official Santa Barbara visitor website amongst Hotel Guests is comparable with
approximately one-in-five using the site as a travel planning resource before
arrival in both years (18.1% for 2016 and 19.2% in 2012).
The full list of travel planning resources tested prior to arrival are shown in a table segmented by visitor place of stay on the next page.
Figure 18: Travel Planning Resources Used Before Arrival
Page 28
0.0%
0.9%
1.1%
1.1%
2.3%
2.4%
2.6%
3.3%
4.0%
5.3%
6.2%
7.0%
9.8%
12.2%
19.9%
45.9%
0% 20% 40% 60%
Official Visit Santa Barbara visitor magazine
Santa Barbara Visitor Center
GoGoleta.com
Visit Santa Barbara official email newsletter
Facebook, Instagram and/or Twitter
Hotel/Concierge
Group discount site (Groupon, etc.)
Auto Club or other retail guide books
Magazine/Newspaper (Lifestyle or travel)
SantaBarbaraCA.com (mobile site)
Consumer advice website (e.g., TripAdvisor)
Tour operator or travel agent
SantaBarbaraCA.com
General travel website (e.g., Expedia)
Info gathered on a mobile device
Family member or friend
Visit Santa Barbara– Santa Barbara South Coast Area Visitor Profile 2016/2017– Q1 Data (September-November 2016)

Travel Planning Resources Used Before Arrival – Complete Detail
Page 29
Detail by Type of Visitor
Question: Which of the following did you use specifically to plan your trip BEFORE ARRIVING and which did you use while IN the Santa Barbara South Coast? (Select all that apply)
Base: All respondents. 384 responses (weighted).
Hotel Guest VFR Day Trip
Family member or friend 24.2% 81.8% 50.7%
Info gathered on a mobile device 22.1% 9.1% 19.7%
General travel website (e.g., Expedia) 20.8% 3.0% 9.9%
SantaBarbaraCA.com 18.1% 9.1% 7.0%
Tour operator or travel agent 4.0% 3.0% 8.5%
Consumer advice website (e.g., TripAdvisor) 13.4% 3.0% 4.2%
SantaBarbaraCA.com (mobile site) 5.4% 0.0% 5.6%
Magazine/Newspaper (Lifestyle or travel) 0.7% 0.0% 5.6%
Auto Club or other retail guide books 8.7% 0.0% 1.4%
Group discount site (Groupon, etc.) 2.0% 0.0% 2.8%
Hotel/Concierge 10.1% 0.0% 0.0%
Facebook, Instagram and/or Twitter 4.0% 12.1% 0.0%
Visit Santa Barbara official email newsletter 0.7% 0.0% 1.4%
GoGoleta.com 0.7% 0.0% 1.4%
Santa Barbara Visitor Center 0.0% 0.0% 1.4%
Official Visit Santa Barbara visitor magazine 0.0% 0.0% 0.0%
Sample size: 149 66 142
Visit Santa Barbara– Santa Barbara South Coast Area Visitor Profile 2016/2017– Q1 Data (September-November 2016)

Travel Planning Resources Used In-Market
Question: Which of the following did you use specifically to plan your trip BEFORE ARRIVING and which did you use while IN the Santa Barbara South Coast? (Select all that apply) Base: All respondents. 384 responses (weighted).
Visitors surveyed were most likely to use information gathered on mobile
devices and the opinions of friends or relatives for trip planning while in-
market. While in the Santa Barbara area, one-in-five visitors surveyed gathered
trip planning information on a mobile device (19.3%) and nearly one-in-ten used
the opinions of their family or friends (9.0%). The next most utilized resources
were the hotel concierge (5.5%), Santa Barbara Visitor Center (3.5%) and official
Visit Santa Barbara visitor magazine (2.9%).
The full list of travel planning resources tested used in market are shown in a
table segmented by visitor place of stay on the next page
Figure 19: Travel Planning Resources Used In-Market
Page 30
0.0%
0.2%
0.3%
0.6%
0.7%
1.0%
1.0%
1.5%
2.1%
2.4%
2.8%
2.9%
3.5%
5.5%
9.0%
19.3%
0% 10% 20% 30% 40%
Visit Santa Barbara official email newsletter
GoGoleta.com
Group discount site (Groupon, etc.)
Magazine/Newspaper (Lifestyle or travel)
General travel website (e.g., Expedia)
Auto Club or other retail guide books
Facebook, Instagram and/or Twitter
SantaBarbaraCA.com (mobile site)
SantaBarbaraCA.com
Tour operator or travel agent
Consumer advice website (TripAdvisor, etc.)
Official Visit Santa Barbara visitor magazine
Santa Barbara Visitor Center
Hotel/Concierge
Family member or friend
Info gathered on a mobile device
Visit Santa Barbara– Santa Barbara South Coast Area Visitor Profile 2016/2017– Q1 Data (September-November 2016)

Travel Planning Resources Used In-Market – Complete Detail
Page 31
Detail by Type of Visitor
Question: Which of the following did you use specifically to plan your trip BEFORE ARRIVING and which did you use while IN the Santa Barbara South Coast? (Select all that apply)
Base: All respondents. 384 responses (weighted).
Hotel Guest VFR Day Trip
Info gathered on a mobile device 22.1% 15.2% 18.3%
Family member or friend 8.1% 18.2% 8.5%
Hotel/Concierge 22.1% 0.0% 0.0%
Santa Barbara Visitor Center 2.7% 0.0% 4.2%
Official Visit Santa Barbara visitor magazine 7.4% 0.0% 1.4%
Consumer advice website (e.g., TripAdvisor, etc.) 8.7% 9.1% 0.0%
Tour operator or travel agent 2.0% 0.0% 2.8%
SantaBarbaraCA.com 4.7% 0.0% 1.4%
SantaBarbaraCA.com (mobile site) 4.7% 3.0% 0.0%
Santa Barbara Visitor Center 2.7% 0.0% 4.2%
Facebook, Instagram and/or Twitter 2.0% 6.1% 0.0%
Auto Club or other retail guide books 2.7% 3.0% 0.0%
General travel website (e.g., Expedia) 2.0% 0.0% 0.0%
Magazine and/or Newspaper (Lifestyle or travel) 2.7% 0.0% 0.0%
Group discount site (Groupon, etc.) 1.3% 0.0% 0.0%
GoGoleta.com 0.7% 0.0% 0.0%
Visit Santa Barbara official email newsletter 0.0% 0.0% 0.0%
Sample size: 149 66 142
Visit Santa Barbara– Santa Barbara South Coast Area Visitor Profile 2016/2017– Q1 Data (September-November 2016)

Extended Stay in Santa Barbara Area based on Information Accessed In-Market (Intercept Survey)
Questions: 1. Did any information you accessed while in the area cause you to extend your stay in the Santa Barbara South Coast? 2. If YES (above), by how many nights? Base: All respondents. 327 responses (weighted).
A small proportion of visitors to the Santa Barbara area extended their stay in the destination by an average of 1.5 nights in response to information accessed while in the
destination. Visitors surveyed were asked if any information they accessed while in the Santa Barbara area caused them to extend their stay in the destination. In total, 3.8 percent of
respondents said they indeed extended their stay by an average of 1.5 nights. Hotel guests extended their stay an average of 2.4 nights, higher than the 1.0 nights reported by VFR
visitors. (Please note the small sample size. This data should be considered informational not directional.)
Figure 20: Extended Stay in Santa Barbara Area based on Information Accessed In-Market
Detail by Type of Visitor
Page 32
Mean # of nights this group increased their stay in Santa Barbara = 1.5
Hotel Guest VFR Day Trip
Yes 7.4% 7.1% 2.9%
No 92.6% 92.9% 97.1%
Mean # of days SB trip was extended
2.4 1.0 1.0
Sample size: 68 28 70
Yes, 3.8%
No, 96.2%

Number of Visits to the Santa Barbara Area in the Past 12 Months (Intercept Survey)
Question: EXCLUDING THIS VISIT, in the past 12 months, how many visits to Santa Barbara area have you made for each of the following reasons?
The Santa Barbara South Coast area appears to draw a significant amount of repeat visitation. The average Santa Barbara area visitor surveyed between September and
November of 2016 made 5.9 trips to the Santa Barbara area in the past twelve months, primarily for leisure or personal reasons (5.3 trips). Repeat visitation is largely driven by day-
trip visitors (6.6 trips) and VFRs (4.8 trips). Hotel guests report an average of 2.7 visits to the area in the past twelve months , which has increased from 1.6 visits in 2012.
Base: All respondents. 220 responses (weighted).
Figure 21: Number of Visits to the Santa Barbara Area in the Past 12 Months
Detail by Type of Visitor
Page 33
0.0
0.1
0.5
5.3
0.0 2.0 4.0 6.0
Conference or group meeting
Weddings
Business reasons
Leisure or personal reasons
Mean = 5.9
Hotel Guest VFR Day Trip
Leisure or personal reasons 2.2 4.5 5.9
Business reasons 0.4 0.1 0.6
Weddings 0.1 0.2 0.1
Conference or group meeting 0.0 0.0 0.0
Mean # of trips 2.7 4.8 6.6
Sample size: 38 52 94
Visit Santa Barbara– Santa Barbara South Coast Area Visitor Profile 2016/2017– Q1 Data (September-November 2016)

Most Liked Aspects of the Santa Barbara Area (Intercept Survey)
Question: What aspects of your experience in the Santa Barbara area did you like best?
The Santa Barbara South Coast area’s beaches was the most liked aspects of the destination in the minds of visitors surveyed (29.6%). Survey respondents were asked, in an open-
ended format, what they liked best about their experience in the Santa Barbara area. The chart and table below list the top cited responses. In addition to the areas beaches, 19.1
percent said the ”good weather” was the best part of their experience in the Santa Barbara area. Area visitors also liked the Santa Barbara zoo (11.9%) and the scenic beauty (10.3%).
Base: All respondents. 326 responses.
Figure 22: Most Liked Aspects of the Santa Barbara Area (Unaided) Detail by Type of Visitor
Page 34
0.6%
1.3%
1.7%
1.9%
2.4%
4.2%
4.4%
4.6%
5.4%
10.3%
11.9%
19.1%
29.6%
0% 10% 20% 30% 40%
Friendly people
Lots to do
Family friendly
Ambiance & Atmosphere
Architecture
Laid back/Relaxing
Restaurants/Food scene
Downtown area
Easily accessible/Walkability
The scenic beauty
Santa Barbara Zoo
Good weather
The beach/Harbor Hotel Guest VFR Day TripThe beach/Harbor 23.9% 32.3% 30.4%
Good weather 15.5% 16.1% 18.8%Santa Barbara Zoo 2.8% 6.5% 14.5%The scenic beauty 7.0% 6.5% 11.6%
Easily accessible/Walkability 7.0% 0.0% 5.8%Downtown area 4.2% 6.5% 4.3%
Restaurants/Food scene 4.2% 0.0% 4.3%Laid back/Relaxing 2.8% 3.2% 4.3%
Architecture 1.4% 0.0% 2.9%Ambiance & Atmosphere 11.3% 6.5% 0.0%
Family friendly 2.8% 3.2% 1.4%Lots to do 1.4% 0.0% 1.4%
Friendly people 1.4% 6.5% 0.0%Sample size: 71 62 138
Visit Santa Barbara– Santa Barbara South Coast Area Visitor Profile 2016/2017– Q1 Data (September-November 2016)

Attractions/Services that Would Enhance the Santa Barbara Experience(Intercept Survey)
Question: In your opinion, what attractions or services would have most enhanced your experience in the Santa Barbara South Coast?
When asked what attractions or services would have most enhanced visitors’ experience in the Santa Barbara area, nearly one-in-three respondents said there was
“nothing” the destination needed (32.2%). Of the specific responses provided, more parking/free parking (19.9%) and making the area more affordable (13.6%) were cited as
the most desired services that would have enhanced the Santa Barbara area experience.
Base: All respondents. 123 responses.
Figure 23: Attractions/Services that Would Enhance the Santa Barbara Experience (Unaided)
Detail by Type of Visitor
Page 35
Hotel Guest VFR Day Trip
Nothing 33.3% 8.3% 36.0%
More parking/free parking 10.0% 0.0% 24.0%
Make the area more affordable 20.0% 16.7% 12.0%
Alleviate traffic/congestion 0.0% 8.3% 8.0%
“You are here” maps 0.0% 16.7% 4.0%
Increased trolley service 3.3% 8.3% 4.0%
An amusement park 0.0% 8.3% 4.0%
Upscale jazz lounge 0.0% 0.0% 4.0%
Boating access 0.0% 0.0% 4.0%
Improved public transportation 3.3% 0.0% 0.0%
Sample size: 30 24 50
Visit Santa Barbara– Santa Barbara South Coast Area Visitor Profile 2016/2017– Q1 Data (September-November 2016)
1.8%
3.0%
3.0%
3.5%
4.0%
4.0%
6.4%
13.6%
19.9%
32.2%
0% 10% 20% 30% 40%
Improved public transportation
Boating access
Upscale jazz lounge
An amusement park
Increased trolley service
"You are here" maps
Alleviate traffic/congestion
Make the area more affordable
More parking/free parking
Nothing

How Expectations of Visitor Experience Aspects were Met (Intercept Survey)
Question: Thinking about your experience on this trip, how did Santa Barbara South Coast compare to what you expected before arriving?
Santa Barbara’s overall friendliness, food scene and scenic beauty were the top destination attributes that exceeded visitors’ expectations. Survey respondents were asked to
think about their experience in Santa Barbara and compare their actual experience in the destination to their expectations before arrival. The chart and table below show the top
two box score (“Better than I expected” and “Much better than expected”) for each attribute tested. Nearly half said Santa Barbara’s friendliness (45.4%), food scene (44.9%) and
scenic beauty (43.8%) were better or much better than they had initially expected. (The full data on all aspects tested is presented on the next page.)
Base: All respondents. 382 responses (weighted).
Figure 24: How Expectations of Visitor Experience Aspects were Met Detail by Type of Visitor
Page 36
Top 2 box score (Better than expected & Much better than expected)
Hotel Guest VFR Day Trip
Friendliness 44.7% 66.7% 43.1%Food scene 44.0% 72.7% 43.1%
Scenic beauty 48.9% 75.8% 38.9%Relaxing ambiance 42.6% 75.8% 38.9%Lots to see and do 41.1% 54.5% 37.5%Outdoor activities 38.3% 63.6% 37.5%
Family friendly 31.2% 78.8% 38.9%Romantic ambiance 27.7% 69.7% 27.8%
Shopping 24.8% 45.5% 29.2%Arts & culture 27.0% 54.5% 23.6%
Wine experiences 20.6% 45.5% 22.2%Affordability 17.0% 18.2% 19.4%Sample size: 141 66 144
Visit Santa Barbara– Santa Barbara South Coast Area Visitor Profile 2016/2017– Q1 Data (September-November 2016)
15.0%
16.8%
22.1%
21.9%
23.8%
31.8%
28.9%
30.1%
28.6%
26.3%
34.4%
26.9%
3.9%
6.3%
4.1%
7.2%
6.7%
7.3%
10.6%
9.5%
13.3%
17.5%
10.5%
18.4%
0% 20% 40% 60%
Affordability
Wine experiences
Arts & culture
Shopping
Romantic ambiance
Family friendly
Outdoor activities
Lots to see and do
Relaxing ambiance
Scenic beauty
Food scene
Friendliness
Better than I expected Much better than I expected

How Expectations of Visitor Experience Aspects were Met – Full Detail
Question: Thinking about your experience on this trip, how did Santa Barbara South Coast compare to what you expected before arriving? Base: All respondents. 382 responses (weighted).
Page 37
Total aggregateMuch better than I
expectedBetter than I
expectedExactly what I
expectedWorse than I
expectedMuch worse than I
expected
Friendliness 20.1% 29.3% 48.0% 0.4% 0.0%
Food scene 12.8% 35.2% 46.9% 2.9% 0.0%
Scenic beauty 22.3% 28.6% 46.5% 0.4% 0.0%
Relaxing ambiance 18.3% 28.2% 49.1% 0.4% 0.0%
Lots to see and do 13.2% 29.7% 49.8% 2.6% 0.4%
Outdoor activities 13.9% 28.6% 47.3% 1.5% 0.0%
Family friendly 9.5% 30.8% 51.3% 0.4% 0.0%
Romantic ambiance 12.1% 22.7% 53.1% 1.8% 0.0%
Shopping 9.2% 21.2% 56.4% 3.7% 1.1%
Arts & culture 6.2% 23.8% 55.3% 2.6% 0.0%
Wine experiences 7.3% 17.2% 54.2% 1.1% 0.4%
Affordability 4.0% 15.4% 65.2% 10.3% 4.0%
Sample size: 382
Visit Santa Barbara– Santa Barbara South Coast Area Visitor Profile 2016/2017– Q1 Data (September-November 2016)
Detail by Level of Expectations

Visitor Experience Ratings (Intercept Survey)
Question: Using a scale of 1 to 10, where 10 is "Excellent" and 1 is "Very poor," please rate the Santa Barbara South Coast area as a place to visit for each of the following experiences:
Of the visitor experiences tested, the Santa Barbara area shows the greatest strength as a destination for outdoor recreation (8.9), family fun (8.7) and food & wine (8.7). Using
a ten-point scale from 1 to 10 in which “1” represents “Very poor” and “10” represents “Excellent,” survey respondents were asked to rate the Santa Barbara area as a destination
for six travel experiences. The destination received a mean score above 8 for every experience tested. Both hotel guest and VFR visitors scored Santa Barbara higher in romance,
with an average rating of 8.6 and 8.7, respectively.
Base: All respondents. 340 responses (weighted).
Figure 25: Visitor Experience Ratings Detail by Type of Visitor
Page 38
8.3
8.4
8.4
8.7
8.7
8.9
0.0 2.0 4.0 6.0 8.0 10.0
Shopping
Romance
Arts and culture
Food and wine
Family fun
Outdoor recreationHotel Guest VFR Day Trip
Outdoor recreation 8.8 9.0 8.9
Family fun 8.4 8.7 8.8
Food and wine 8.8 8.6 8.8
Arts and culture 8.4 8.4 8.4
Romance 8.6 8.7 8.3
Shopping 7.8 8.4 8.4
Sample size: 73 64 144
Visit Santa Barbara– Santa Barbara South Coast Area Visitor Profile 2016/2017– Q1 Data (September-November 2016)
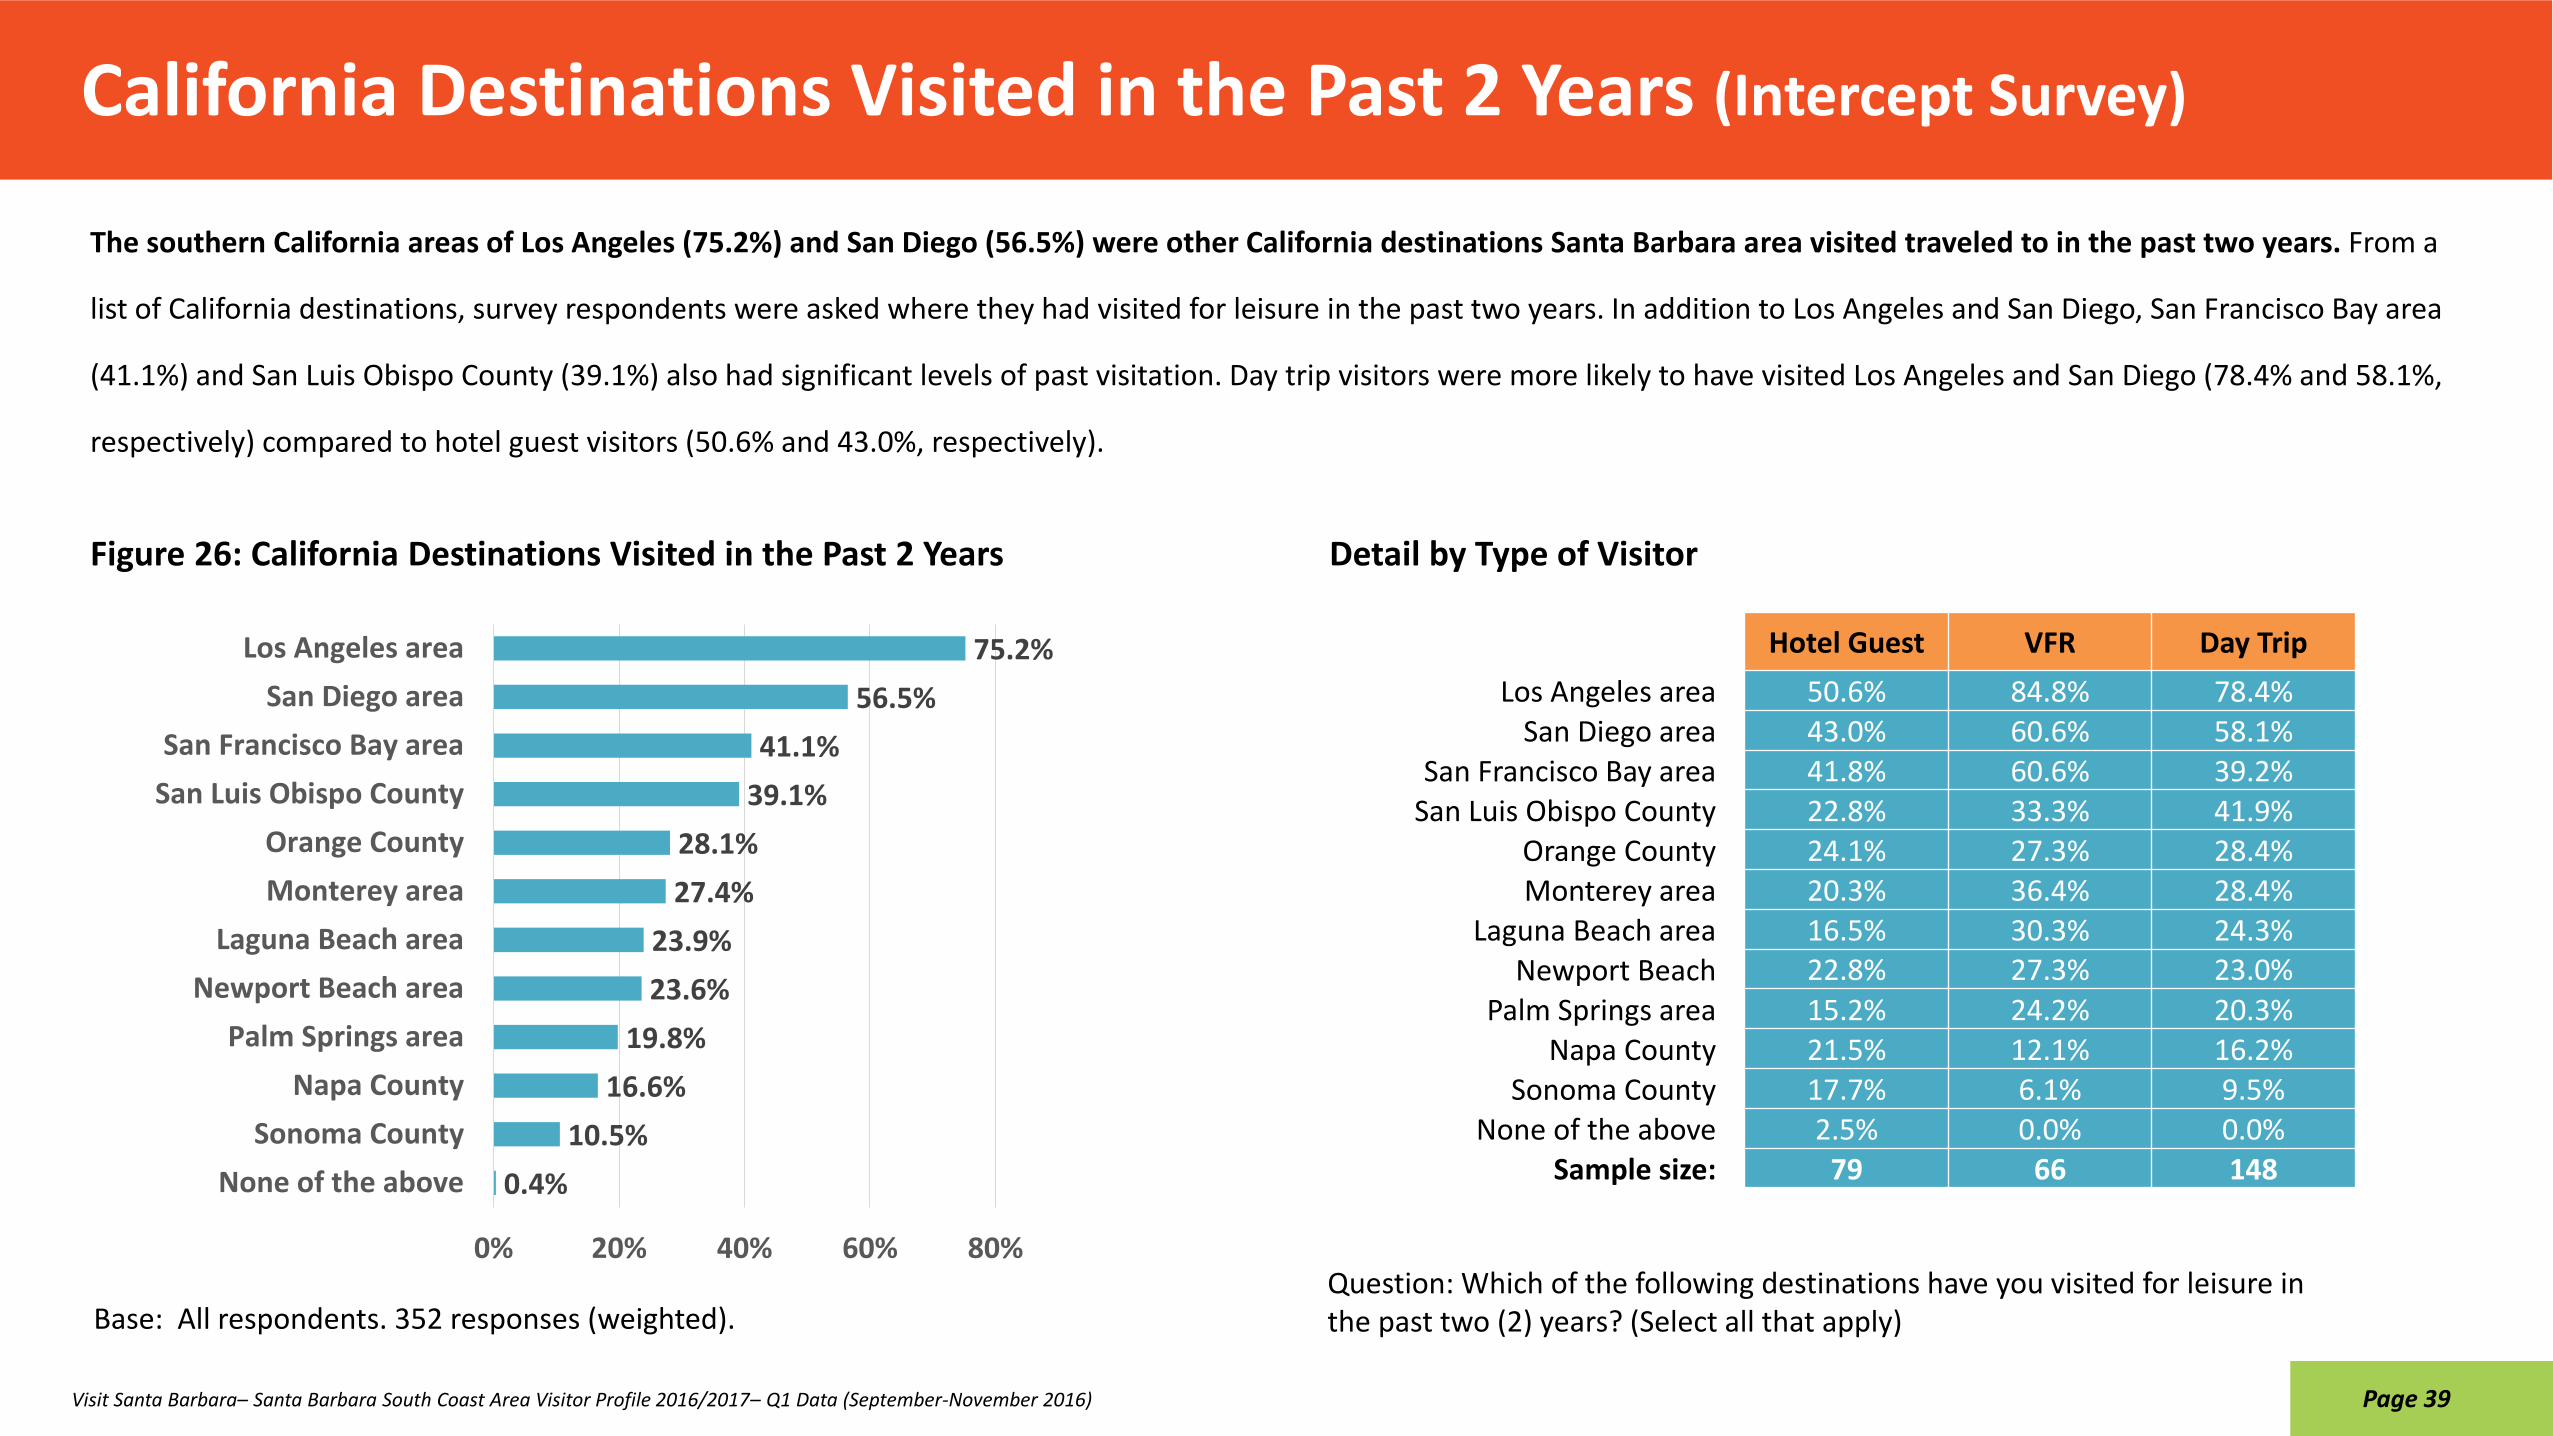
California Destinations Visited in the Past 2 Years (Intercept Survey)
Question: Which of the following destinations have you visited for leisure in the past two (2) years? (Select all that apply)
The southern California areas of Los Angeles (75.2%) and San Diego (56.5%) were other California destinations Santa Barbara area visited traveled to in the past two years. From a
list of California destinations, survey respondents were asked where they had visited for leisure in the past two years. In addition to Los Angeles and San Diego, San Francisco Bay area
(41.1%) and San Luis Obispo County (39.1%) also had significant levels of past visitation. Day trip visitors were more likely to have visited Los Angeles and San Diego (78.4% and 58.1%,
respectively) compared to hotel guest visitors (50.6% and 43.0%, respectively).
Base: All respondents. 352 responses (weighted).
Figure 26: California Destinations Visited in the Past 2 Years Detail by Type of Visitor
Page 39
0.4%
10.5%
16.6%
19.8%
23.6%
23.9%
27.4%
28.1%
39.1%
41.1%
56.5%
75.2%
0% 20% 40% 60% 80%
None of the above
Sonoma County
Napa County
Palm Springs area
Newport Beach area
Laguna Beach area
Monterey area
Orange County
San Luis Obispo County
San Francisco Bay area
San Diego area
Los Angeles area Hotel Guest VFR Day Trip
Los Angeles area 50.6% 84.8% 78.4%San Diego area 43.0% 60.6% 58.1%
San Francisco Bay area 41.8% 60.6% 39.2%San Luis Obispo County 22.8% 33.3% 41.9%
Orange County 24.1% 27.3% 28.4%Monterey area 20.3% 36.4% 28.4%
Laguna Beach area 16.5% 30.3% 24.3%Newport Beach 22.8% 27.3% 23.0%
Palm Springs area 15.2% 24.2% 20.3%Napa County 21.5% 12.1% 16.2%
Sonoma County 17.7% 6.1% 9.5%None of the above 2.5% 0.0% 0.0%
Sample size: 79 66 148
Visit Santa Barbara– Santa Barbara South Coast Area Visitor Profile 2016/2017– Q1 Data (September-November 2016)

SAMPLE DEMOGRAPHICS
Q1 (SEPTEMBER-NOVEMBER 2016)

Gender
Question: What is your gender?
Through September and November of 2016, there was nearly an even gender split amongst survey respondents. 52.7 percent of the sample were male and 47.2 percent
were female.
Base: All respondents. 322 responses (weighted).
Figure 27: Gender Detail by Type of Visitor
Page 41
Female, 47.2%
Male, 52.7%
I prefer not to answer, 0.2%
Hotel Guest VFR Day Trip
Female 58.1% 41.4% 43.9%
Male 41.2% 58.6% 56.1%
I prefer not to answer 0.7% 0.0% 0.0%
Sample size: 136 58 114
Visit Santa Barbara– Santa Barbara South Coast Area Visitor Profile 2016/2017– Q1 Data (September-November 2016)
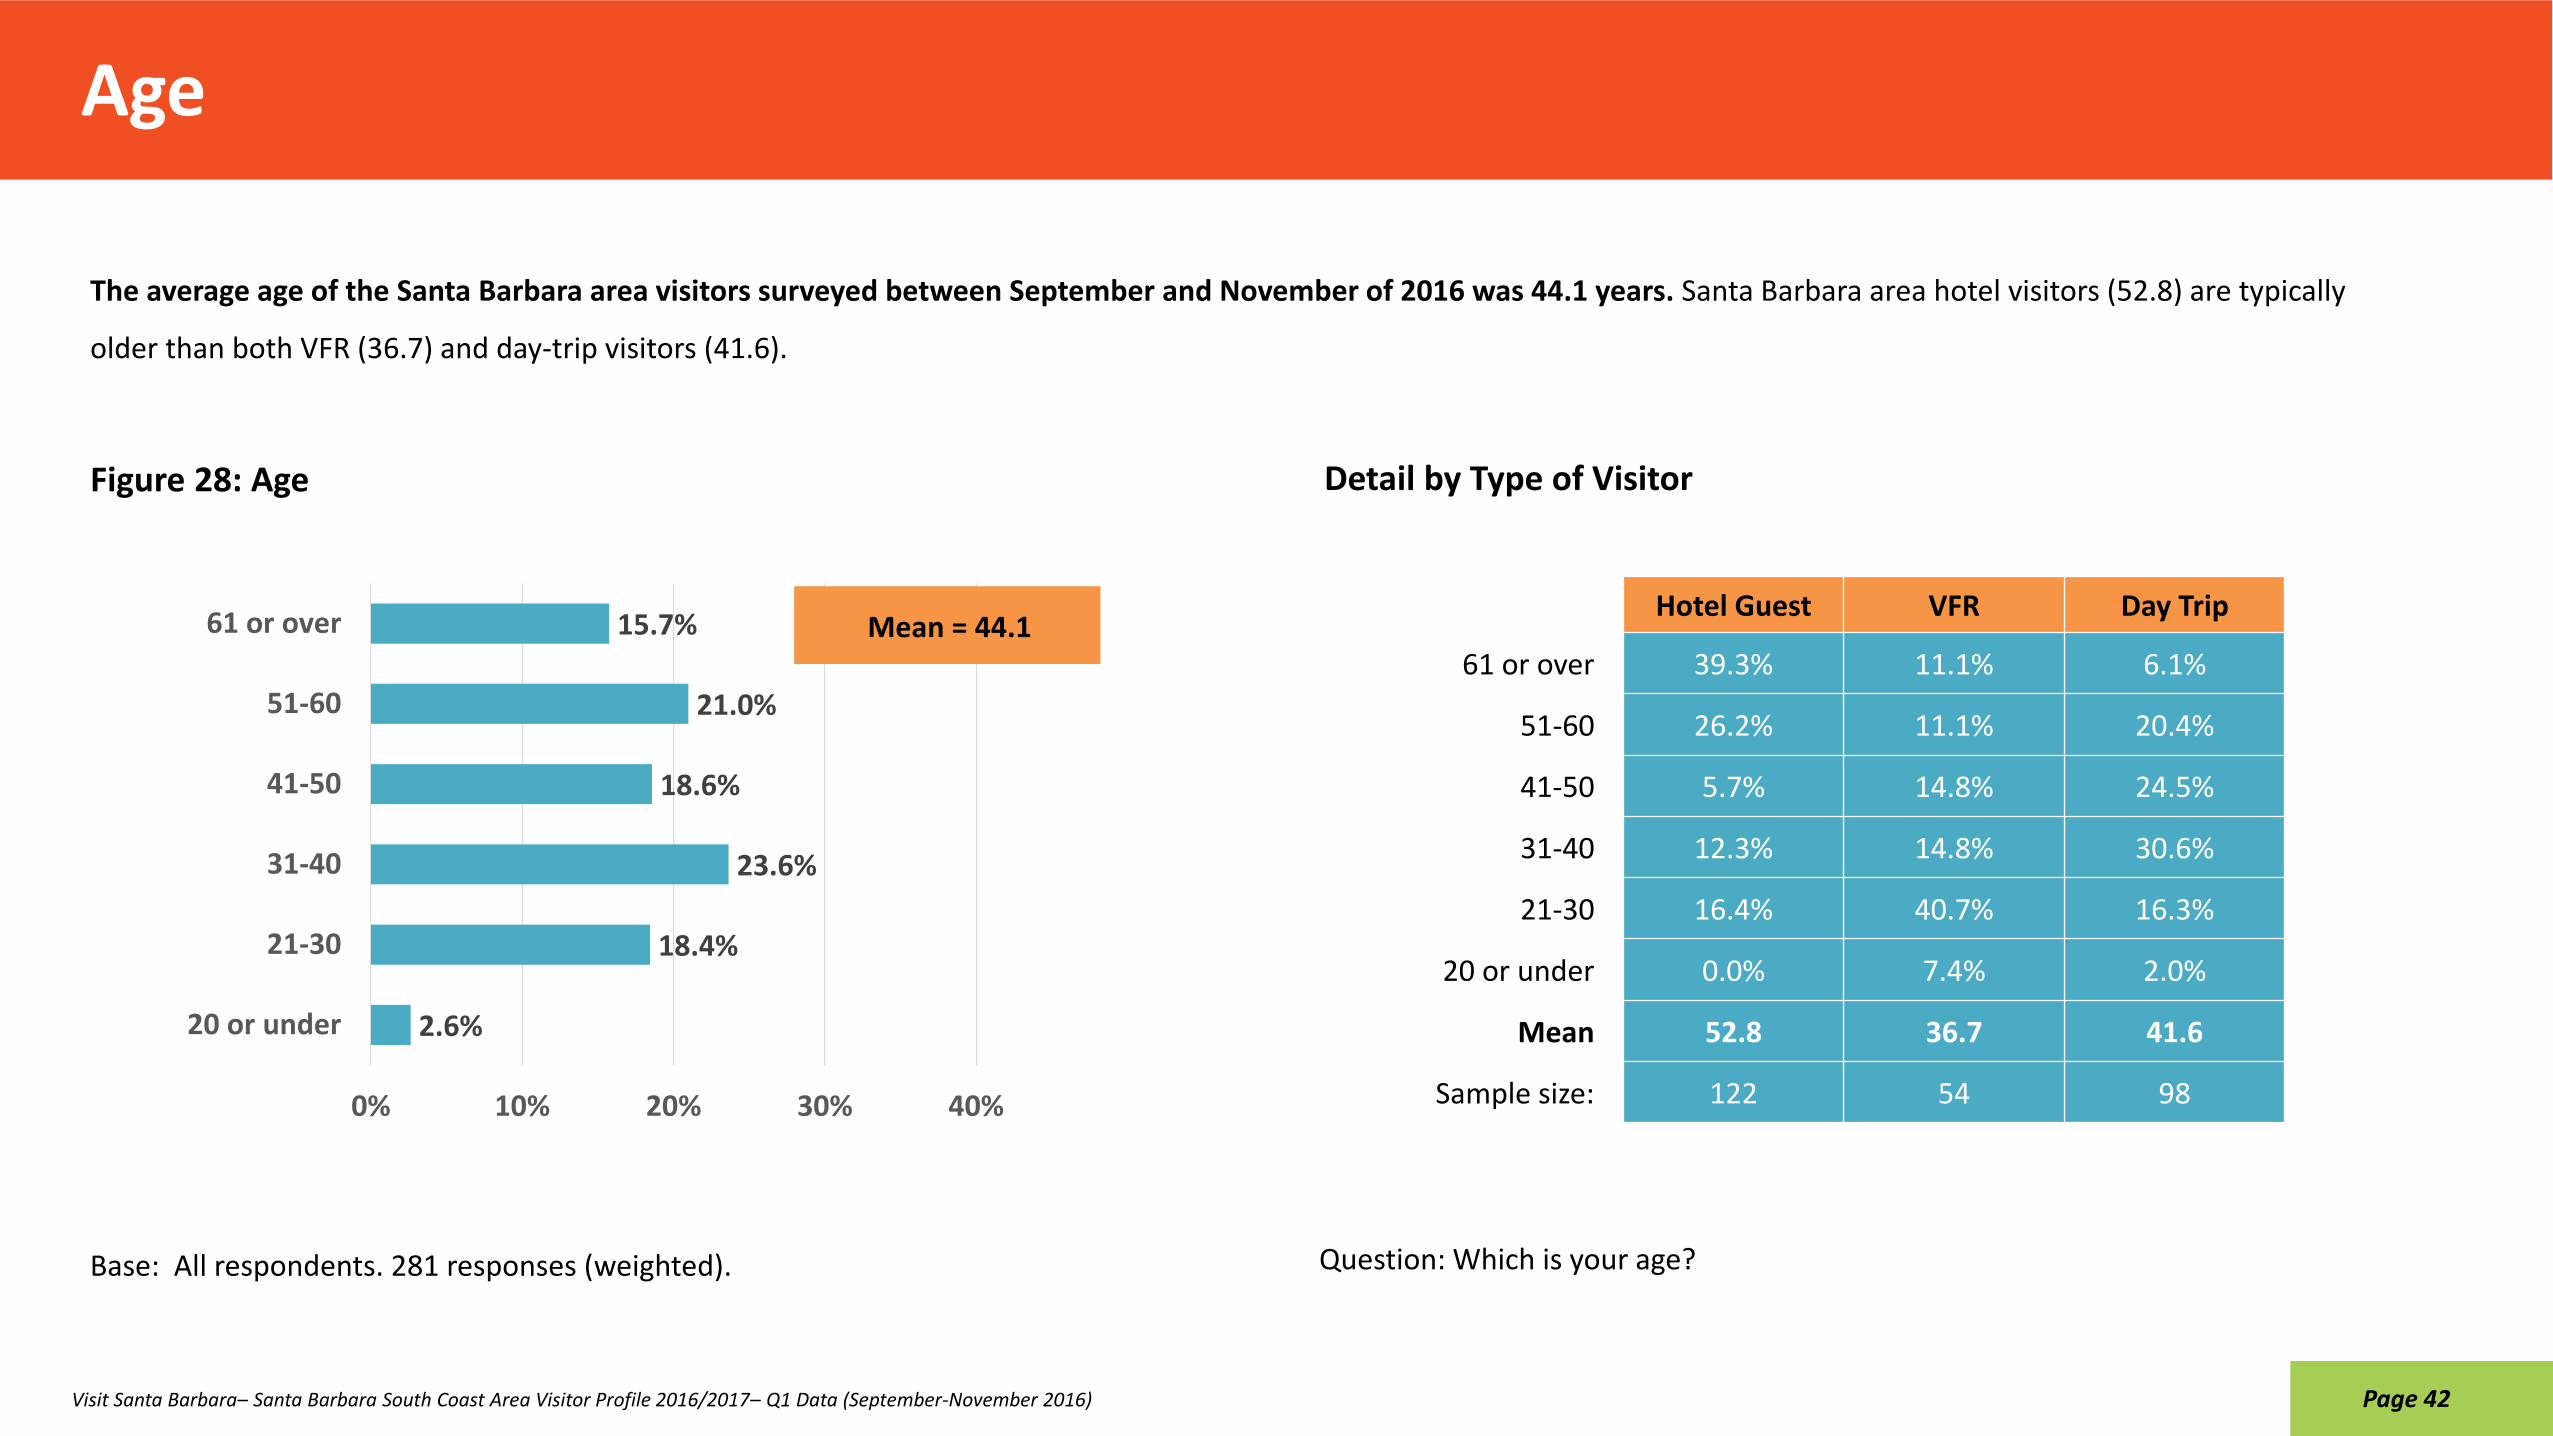
Age
Question: Which is your age?
The average age of the Santa Barbara area visitors surveyed between September and November of 2016 was 44.1 years. Santa Barbara area hotel visitors (52.8) are typically
older than both VFR (36.7) and day-trip visitors (41.6).
Base: All respondents. 281 responses (weighted).
Figure 28: Age Detail by Type of Visitor
Page 42Visit Santa Barbara– Santa Barbara South Coast Area Visitor Profile 2016/2017– Q1 Data (September-November 2016)
2.6%
18.4%
23.6%
18.6%
21.0%
15.7%
0% 10% 20% 30% 40%
20 or under
21-30
31-40
41-50
51-60
61 or over Mean = 44.1Hotel Guest VFR Day Trip
61 or over 39.3% 11.1% 6.1%
51-60 26.2% 11.1% 20.4%
41-50 5.7% 14.8% 24.5%
31-40 12.3% 14.8% 30.6%
21-30 16.4% 40.7% 16.3%
20 or under 0.0% 7.4% 2.0%
Mean 52.8 36.7 41.6
Sample size: 122 54 98

17.5%
7.7%
8.0%
29.2%
14.8%
13.0%
8.9%
1.0%
0% 10% 20% 30% 40%
I prefer not to answer
Less than $25,000
$25,001 to $50,000
$50,001 to $100,000
$100,001 to $150,000
$150,001 to $200,000
$200,001 to $500,000
Over $500,000
Mean = $92,317
Annual Household Income
Question: Which of the following best describes the combined annual income of all members of your household?
Santa Barbara area visitors surveyed through the first quarter have an average annual household income of $92,317. Hotel guests report a slightly higher household income
compared to day-trip visitors ($98,193 vs. $92,330).
Base: All respondents. 317 responses (weighted).
Figure 29: Annual Household Income Detail by Type of Visitor
Page 43
Hotel Guest VFR Day Trip
Over $500,000 2.2% 6.9% 0.0%
$200,001 to $500,000 16.4% 6.9% 5.4%
$150,001 to $200,000 12.7% 3.4% 14.3%
$100,001 to $150,000 15.7% 20.7% 14.3%
$50,001 to $100,000 21.6% 24.1% 33.9%
$25,001 to $50,000 5.2% 10.3% 8.9%
Less than $25,000 6.7% 13.8% 7.1%
I prefer not to answer 19.4% 13.8% 16.1%
Mean $98,193 $76,786 $92,330
Sample size: 134 58 112
Visit Santa Barbara– Santa Barbara South Coast Area Visitor Profile 2016/2017– Q1 Data (September-November 2016)

Marital Status
Question: Which of the following best describes your current marital status?
Nearly three-quarters of Santa Barbara area visitors surveyed are married or partnered (72.8%), while 22.6 percent are single. In total, 16.2 percent of survey respondents
have children under the age of 18.
Base: All respondents. 323 responses (weighted).
Figure 30: Marital Status Detail by Type of Visitor
Page 44
Hotel Guest VFR Day Trip
Single 12.9% 44.8% 15.8%
Single with children under age 18 1.4% 0.0% 7.0%
Married 66.9% 37.9% 50.9%
Domestic partnership 6.5% 10.3% 8.8%
Married or domestic partnership with children under age 18
5.8% 0.0% 14.0%
Other 1.4% 0.0% 3.5%
I prefer not to answer 5.0% 6.9% 0.0%
Sample size: 139 58 114
Visit Santa Barbara– Santa Barbara South Coast Area Visitor Profile 2016/2017– Q1 Data (September-November 2016)
2.0%
2.6%
8.2%
10.8%
53.7%
5.4%
17.2%
0% 20% 40% 60%
I prefer not to answer
Other
Domestic partnership
Married or domestic partnershipwith children under age 18
Married
Single with children under age 18
Single

Education
Question: What is your highest level of formal education? (Select one)
Santa Barbara area visitors surveyed are highly educated. 72.5 percent have at least a bachelor’s degree, including 24.0 percent who have completed graduate school.
Base: All respondents. 319 responses (weighted).
Figure 31: Education Detail by Type of Visitor
Page 45
3.5%
1.5%
5.8%
16.7%
45.0%
3.4%
24.0%
0% 20% 40% 60%
I prefer not to answer
Some high school or less
High school graduate
Some college
College graduate
Some graduate school
Completed graduate schoolHotel Guest VFR Day Trip
Completed graduate school 31.9% 17.2% 21.4%
Some graduate school 6.5% 0.0% 1.8%
College graduate 40.6% 34.5% 48.2%
Some college 9.4% 34.5% 17.9%
High school graduate 7.2% 6.9% 5.4%
Some high school or less 0.7% 3.4% 1.8%
I prefer not to answer 3.6% 3.4% 3.6%
Sample size: 138 58 112
Visit Santa Barbara– Santa Barbara South Coast Area Visitor Profile 2016/2017– Q1 Data (September-November 2016)

Ethnicity
Question: Which best describes your ethnicity?
While 61.7 percent of respondents identify as Caucasian, 34.3 percent identify as other ethnicities. The largest non-Caucasian visitor groups were Latino/Hispanic (20.3%) and
Asian, Pacific Islander (6.3%).
Base: All respondents. 322 responses (weighted).
Figure 32: Ethnicity Detail by Type of Visitor
Page 46
4.0%
6.1%
0.4%
1.3%
6.3%
20.3%
61.7%
0% 20% 40% 60% 80%
I prefer not to answer
Other
Native American, Aleut, Eskimo
Black, African-American
Asian, Pacific Islander
Latino/Hispanic
Caucasian Hotel Guest VFR Day Trip
Caucasian 79.0% 55.2% 54.4%
Latino/Hispanic 3.6% 27.6% 26.3%
Asian, Pacific Islander 4.3% 10.3% 7.0%
Black, African-American 0.0% 3.4% 1.8%
Native American, Aleut, Eskimo 1.4% 0.0% 0.0%
Other 5.1% 3.4% 7.0%
I prefer not to answer 6.5% 0.0% 3.5%
Sample size: 138 58 114
Visit Santa Barbara– Santa Barbara South Coast Area Visitor Profile 2016/2017– Q1 Data (September-November 2016)

LGBT
Question: Which best describes you? (Select one)
In total, 89.9 percent of visitors surveyed between September and November of 2016 were heterosexual and 3.4 percent were LGBT.
Base: All respondents. 260 responses (weighted).
Figure 33: LGBT Detail by Type of Visitor
Page 47
6.1%
0.6%
3.4%
89.9%
0% 20% 40% 60% 80% 100%
I prefer not to answer
Other
Gay/Lesbian/Bisexual/Transgender
HeterosexualHotel Guest VFR Day Trip
Heterosexual 82.0% 75.9% 92.7%
Gay/Lesbian/Bisexual/ Transgender
4.0% 17.2% 1.8%
Other 2.0% 0.0% 0.0%
I prefer not to answer 12.0% 6.9% 5.5%
Sample size: 50 58 110
Visit Santa Barbara– Santa Barbara South Coast Area Visitor Profile 2016/2017– Q1 Data (September-November 2016)

Point of Origin: Top Countries of Residence
Question: In what country do you reside?
A majority of visitors surveyed reside within the United States (83.2%) while the remaining 18.3 percent were international residents. The top international markets represented
within the sample were United Kingdom (3.3%) and Canada (3.0%).
Figure 34: Point of Origin - Top Countries of Residence
Base: All respondents. 313 responses (weighted).
Detail by Type of Visitor
Page 48
0.4%
0.4%
0.4%
0.6%
0.8%
1.2%
1.2%
1.4%
1.4%
1.6%
3.0%
3.3%
83.2%
0% 20% 40% 60% 80% 100%
Italy
Germany
Sweden
Australia
Switzerland
Vietnam
Ukraine
Spain
Israel
Netherlands
Canada
United Kingdom
United States Hotel Guest VFR Day Trip
United States 79.6% 88.9% 85.5%United Kingdom 5.8% 0.0% 1.8%
Canada 0.7% 3.7% 3.6%Netherlands 1.5% 0.0% 1.8%
Israel 0.7% 0.0% 1.8%Spain 0.7% 0.0% 1.8%
Ukraine 0.0% 0.0% 1.8%Vietnam 0.0% 0.0% 1.8%
Switzerland 2.9% 0.0% 0.0%Australia 2.2% 0.0% 0.0%Sweden 0.7% 3.7% 0.0%
Germany 1.5% 0.0% 0.0%Italy 1.5% 0.0% 0.0%
Sample size: 137 54 110
Visit Santa Barbara– Santa Barbara South Coast Area Visitor Profile 2016/2017– Q1 Data (September-November 2016)

Point of Origin: Countries of Residence – Full Data
Question: In what country do you reside?Base: All respondents. 313 responses (weighted).
Page 49Visit Santa Barbara– Santa Barbara South Coast Area Visitor Profile 2016/2017– Q1 Data (September-November 2016)
Q1 Total Hotel Guest VFR Day Trip
United States 83.2% 79.6% 88.9% 85.5%
United Kingdom 3.3% 5.8% 0.0% 1.8%
Canada 3.0% 0.7% 3.7% 3.6%
Netherlands 1.6% 1.5% 0.0% 1.8%
Israel 1.4% 0.7% 0.0% 1.8%
Spain 1.4% 0.7% 0.0% 1.8%
Ukrane 1.2% 0.0% 0.0% 1.8%
Vietnam 1.2% 0.0% 0.0% 1.8%
Switzerland 0.8% 2.9% 0.0% 0.0%
Australia 0.6% 2.2% 0.0% 0.0%
Sweden 0.4% 0.7% 3.7% 0.0%
Germany 0.4% 1.5% 0.0% 0.0%
Italy 0.4% 1.5% 0.0% 0.0%
Brazil 0.3% 0.0% 0.0% 0.0%
Chile 0.3% 0.0% 0.0% 0.0%
India 0.2% 0.0% 3.7% 0.0%
China 0.2% 0.7% 0.0% 0.0%
France 0.2% 0.7% 0.0% 0.0%
New Zealand 0.2% 0.7% 0.0% 0.0%
Sample size: 313 137 54 110

Point of Origin: Top States of Residence
Question: What is your zip/postal code?
Three-quarters of Santa Barbara area visitors surveyed through the first quarter were California residents (74.5%). In total, 25.5 percent of survey respondents were out-
of-state residents with top visitation from Nevada (5.2%), Florida (2.3%), Arizona (2.0%) and Connecticut (2.0%).
Figure 35: Point of Origin - Top States of Residence
Base: All respondents. 246 responses (weighted).
Detail by Type of Visitor
Page 50
0.5%
0.8%
0.8%
0.8%
1.3%
1.5%
1.7%
1.7%
2.0%
2.0%
2.3%
5.2%
74.5%
0% 20% 40% 60% 80%
Illinois
Pennsylvania
Virginia
New York
Colorado
Tennessee
Massachusetts
Minnesota
Connecticut
Arizona
Florida
Nevada
California Hotel Guest VFR Day Trip
California 66.0% 52.4% 80.0%
Nevada 1.0% 9.5% 6.7%
Florida 2.0% 0.0% 2.2%
Arizona 2.0% 0.0% 2.2%
Connecticut 2.0% 0.0% 2.2%
Minnesota 0.0% 4.8% 2.2%
Massachusetts 1.0% 0.0% 2.2%
Tennessee 0.0% 0.0% 2.2%
Colorado 5.0% 0.0% 0.0%
New York 1.0% 4.8% 0.0%
Virginia 2.0% 4.8% 0.0%
Pennsylvania 3.0% 0.0% 0.0%
Illinois 1.0% 4.8% 0.0%
Sample size: 100 42 90
Visit Santa Barbara– Santa Barbara South Coast Area Visitor Profile 2016/2017– Q1 Data (September-November 2016)

Point of Origin: Top MSAs of Residence
Question: What is your zip/postal code?
The highest proportions of domestic Santa Barbara area visitors surveyed between September and November of 2016 reside in the Los Angeles-Riverside-Orange County, CA MSA
(28.6%) or the Ventura, CA MSA (17.7%). These was followed by San Luis Obispo-Atascadero-Paso Robles, CA at 5.9 percent. Top out-of-state markets included Las Vegas, NV-AZ MSA
(5.4%), Minneapolis-St. Paul, MN-WI MSA (1.8%), Boston, MA MSA (1.8%) and Phoenix-Mesa, AZ MSA (1.8%). Comparing this to findings in the 2012 Visitor Profile we see that Los
Angeles-Riverside-Orange County, CA continues to be the top feeder market and interestingly the Ventura and Las Vegas markets are emerging as significant contributors to visitation in
2016 (these markets were not top MSAs in 2012).
Figure 36: Point of Origin - Top MSAs of Residence
Base: All respondents. 236 responses (weighted).
Detail by Type of Visitor
Page 51Visit Santa Barbara– Santa Barbara South Coast Area Visitor Profile 2016/2017– Q1 Data (September-November 2016)
1.5%
1.5%
1.5%
1.5%
1.8%
1.8%
1.8%
1.9%
3.1%
3.4%
5.4%
5.9%
17.7%
28.6%
0% 10% 20% 30% 40%
Salinas, CA
Orlando, FL
Fresno,CA
Bridgeport-Milford, CT
Phoenix-Mesa, AZ
Boston, MA
Minneapolis-St. Paul, MN-WI
San Diego, CA
San Francisco-Oakland-San Jose, CA
Bakersfield, CA
Las Vegas, NV-AZ
San Luis Obispo-Atascadero-Paso Robles, CA
Ventura, CA
Los Angeles-Riverside-Orange County, CA
Hotel Guest VFR Day TripLos Angeles-Riverside-Orange
County, CA42.6% 30.0% 22.7%
Ventura, CA 3.2% 0.0% 25.0%San Luis Obispo-Atascadero-Paso
Robles, CA4.3% 5.0% 6.8%
Las Vegas, NV-AZ 1.1% 10.0% 6.8%Bakersfield, CA 0.0% 5.0% 4.5%
San Francisco-Oakland-San Jose, CA 5.3% 5.0% 2.3%
San Diego, CA 6.4% 0.0% 0.0%Minneapolis-St. Paul, MN-WI 0.0% 5.0% 2.3%
Boston, MA 1.1% 0.0% 2.3%Phoenix-Mesa, AZ 1.1% 0.0% 2.3%
Bridgeport-Milford, CT 0.0% 0.0% 2.3%Fresno, CA 0.0% 0.0% 2.3%
Orlando, FL 0.0% 0.0% 2.3%Salinas, CA 0.0% 0.0% 2.3%
Sample size: 94 20 44