vista group international limited annual...
TRANSCRIPT

vistagroup.co
VISTA GROUP INTERNATIONAL LIMITED
ANNUAL FINANCIAL
2017STATEMENTS

01 Management Commentary
04 Statement of Comprehensive Income
05 Statement of Changes in Equity
06 Statement of Financial Position
07 Statement of Cashflows
08 Notes to the Financial Statements
TABLE OF
CONTENTS

MANAGEMENT COMMENTARY
The Executive and Management are pleased to present the following highlights and full year financial statements,
for Vista Group International Limited (the ‘Company’ and its subsidiaries, collectively the ‘Vista Group’), for the
year ended 31 December 2017.
FINANCIAL HIGHLIGHTS
• 20% Revenue growth over FY2016 of $106.6m – The 4th consecutive year of 20%+ revenue growth
• 42% EBITDA(1) growth to $25.0m
• 104% Increase in operating cashflow to $11.0m
• 37% Revenue growth in Movio to $15.5m. 150% Revenue growth in Movio Media was exceptional
• 71% Revenue growth in China business over FY2016
• 21% growth in Group annuity/recurring revenue to $64.3m – representing 60% of total revenue
• 28% increase in FY2017 dividend with a final dividend of 1.74 cents per share representing a total pay-out at the
top end of the policy range at 50% NPAT
OPERATIONAL HIGHLIGHTS
• Further advanced the Vista global leadership position in the cinema industry
• 793 new Vista Cinema sites - another very strong year of site growth to a cumulative 6,350 sites
• 112 new Veezi sites to a cumulative 643 sites
• 10% increase in average license revenue per site for Vista Cinema & Veezi
• Strong growth in Movio from the closure of several long-term agreements (Epsilon, Fox, Viacom)
• 44% Growth in Movio total revenue per 1,000 active moviegoers in the US market to $449
• Strategy to increase investments to achieve control to enable consolidation into Vista Group results
- Completion of strategic acquisition of Senda, our long-term business partner in Mexico
- Increase in Vista Group’s shareholding in Vista China to enable consolidation from the date the transaction
closes (post balance date event)
• Entry into new countries such as Brazil, Italy, Austria providing new growth opportunities for FY18 onwards
• Powster continuing to build momentum as 87 of the top 100 grossing films in 2017 used the Powster platform
• Further development and innovation on core platform and new emerging technologies
SEGMENT OVERVIEW
Vista Group is pleased to provide greater transparency into the key business elements through new segment reporting.
Cinema Segment
Vista Cinema delivered another impressive performance in 2017 with 793 new cinema sites added. Revenue growth of
22% (excluding the China consolidated revenue in FY2016 of $6.7m) and a 34% improvement in EBITDA(1) performance
to $19.8m. Most pleasingly was the quality improvement in EBITDA(1), up 5.5 percentage points to 29.3% of revenue.
The growth momentum continued in FY2017 through the entry to 11 new countries, most notable being Brazil (first
live site up and running), Italy (first live site up and running) and Austria (largest circuit converted to Vista). These
countries together with China, Japan and Saudi Arabia represent some of the largest markets for Vista in FY18 and
beyond. This together with the increase in average customer spend provides confidence in the ongoing growth
aspirations of Vista Cinema in the future.
Key strategic initiatives came to fruition in 2017 with the completion of the migration of Ticketsoft customers,
the acquisition of a majority stake in our Latin American business partner Senda which accelerated our presence
in Brazil (the 5th largest cinema market globally), and the establishment of Vista South Africa to address the
developing African market.
On the product side, the transition to a fully cloud Vista Cinema product continued to gather momentum with the
release of re-imagined products in key areas of Film Programming and Cinema Management. In addition, we were
delighted with the development of our advanced Food & Beverage offerings.
01ANNUAL FINANCIAL STATEMENTS 2017

Veezi continues to build momentum with 112 additional sites added (including 10 in China, our key Asia Pacific
focus for 2018), and 20 in each of France and Sweden – key European growth markets in 2018. Revenue growth
remained solid at 34% with an increase in average revenue per site driven by a substantial increase in other
revenue streams, primarily 3rd party fee revenue and revenue from additional module uptake.
Movio Segment
Movio delivered a terrific result with revenue up 37% to $15.5m in total and EBITDA(1) up 111% to $3.6m.
Movio Cinema revenue grew 18% over FY2016. LATAM and EMEA regions provided growth with new customers
from Argentina, Brazil, Germany, France, Estonia and Russia. Email and connection volumes increased by 28% to
1.8 billion from 1.4 billion in FY16.
Movio Media revenue increased 150% in FY2017, driven by the successful launch of the digital media campaign
offerings. Long-term agreements were secured with Twentieth Century Fox, Epsilon, Viacom and STX. This revenue
in 2017 is derived exclusively from the US market.
Movio continues to be one of the key growth engines for Vista Group. With the recent success in signing new
long term agreements, confidence remains strong that Movio will continue to capture strong market share of the
increasing “digital” marketing spend.
Additional Group Companies Segment
The Additional Group Companies segment comprises the businesses of Powster, MACCS, and Flicks, none of which
individually make up the more than 10% of revenue or profit threshold required for separate disclosure.
Powster continued its strong performance in terms of both revenue growth and EBITDA(1). During 2017 Powster
created over 1,300 movie destinations representing growth of 46% on FY2016, attracting 422m total visitors to its
sites, an increase of 290% from FY2016. During 2017 Powster opened a LA studio office to facilitate market entry
into the US. Powster now works globally with 91 movie distributors.
MACCS has had a challenging year based on delivering a significant project which is both large and complex.
We have been fully committed to deploying our Warner Bros. contract in the USA, however we have had to apply
additional resources to this project with a negative impact on the FY2017 result.
Flicks has had a pleasing result with significant growth in its Australian site and it is now the largest independent
movie review site in Australasia.
Early Stage Investments
This segment comprises the businesses of Cinema Intelligence, Stardust and MovieXchange, all of which are
characterised as being in start-up phase. This segment represents businesses that are yet to generate positive
EBITDA(1) as Vista Group invests to bring them to market.
This segment generated revenues of $1.2m and negative EBITDA(1) of $1.7m reflecting the early stage nature of the
businesses in this segment.
In FY2017 Vista Group continued to innovate and invest in new opportunities that we believe present strong
potential for the future. The cost of the investment in this segment in FY2017 for internally generated software
development was $2.2m.
Cinema Intelligence has seen strong momentum in 2017. Cinema Intelligence achieved close to a 200% increase in
new active cinema sites to 283 with customers onboarded in Europe, North America, South Africa and Indonesia. Two
significant new European customers have contracted for a 2018 rollout which will provide further uplift in revenues
and increase the pressure on other customers to take advantage of the value being created within this solution.
Stardust (www.stardust.co) is an exciting entry into the world of social media for the film industry. While it is
not expected to generate revenue for some time, we are well advanced in our initial target of attracting 50,000
monthly active members, with 24,000 already using the Stardust platform. This has been achieved in just 6 months
since the product was released to the Apple and Google application stores.
02VISTA GROUP INTERNATIONAL LIMITED
The MovieXchange platform presently has 2 product lines; MovieXchange Films (MXF) and MovieXchange
Tickets (MXT).
MXF is a platform for exchanging the digital media assets (posters, stills, trailers etc) relating to a film between the
IP owners (typically film distributors) and the users of these – at present cinema exhibitors. MovieXchange Films
(MXF) has 10 customers in the USA and Australia and commercial returns are now being achieved. Vista and Veezi
customers are the first targets for this service but the potential customer set is very broad.
MXT is a Software as a Service product that enables cinema owners to connect to a wide range of 3rd party
ticket selling channels. The service assists clients with online and mobile ticket processing for which Vista receives
a payment based on a per ticket rate from the 3rd party sellers. The platform generated $0.2m of revenue for
FY2017. This exceeded expectations due to higher volumes of transactions processed than expected. Currently
MXT operates only in the USA, however it is planned to launch in additional markets in 2018.
FINANCIAL OVERVIEW
With the achievements in FY2017, Vista Group has achieved four consecutive years of 20% plus revenue growth.
Trading performance for FY2017 represents that continuation of growth with a 20% increase in revenue over
FY2016 and EBITDA(1) 42%showing strength across the business and improvements in operating leverage.
Annuity revenue continued to grow with annual maintenance, annual license income and 3rd party transaction fees
all showing good increases
Administrative and operational expenses were well constrained and managed by the executive team.
Based on the increasing diversity of countries in which Vista Group does business, and upcoming changes to
accounting standards, management have decided to take a more conservative approach to providing for doubtful
debts. Vista has a very strong history of customer commitment to paying invoices and this is not expected to change
however, in light of our increased diversity in markets an increase in the provision is seen as prudent at this stage.
The new segment reporting provides additional insight in to the performance of key segments of Vista Group’s
operations. This highlights the continued improvement of the major business contributors in the Cinema and Movio
segments through exceptional new customer wins, an increase in average customer annual spend, and the opening
of new markets.
Improvements are required in the MACCS business which impacted on the result of the Additional Group
Businesses segment.
The ongoing innovation and investment in core products and our early stage investments continue to be at the
cornerstone of building a stronger future for Vista Group.
Vista Group continues to maintain a very strong balance sheet. Receivables and current liabilities have been held
at FY2016 levels despite the 20% lift in revenue. This shows increased focus and improvement in receivables
management. Intangibles have increased through the acquisition of the controlling stake in Senda and the continued
investment in internal software projects which have been capitalised ($4.9m). Borrowings have increased by $6.5m
to $10.7m due to the USD loan taken to help fund, and act as a partial FX hedge, on the Senda investment.
Vista Group continues to produce positive cash flow from operating activities with operating cash flow up 104%
to $11.0m. Cash reserves finished the year largely at the same level as FY2016 at $21.0m primarily due to acquisition
and investment activity and the payment of the FY2016 final and FY2017 interim dividends.
With the positive operating result, balance sheet and cash position Vista Group will pay a final dividend of
1.74 cents per share ($2.9m) bringing the full FY2017 dividend to 2.94 cents per share ($4.8m) which is up 28%
on the FY2016 dividend.
(1) EBITDA is defined earnings before net finance expense, income tax, depreciation, amortisation and offer costs. The expense accrual related to the VCL deferred consideration is also excluded. This is consistent with the measure used in the Prospectus date 3 July 2014.
03ANNUAL FINANCIAL STATEMENTS 2017

STATEMENT OF COMPREHENSIVE INCOMEFOR THE YEAR ENDED 31 DECEMBER 2017
2017 2016
SECTION NZ$’000 NZ$’000
Revenue 106,623 88,589
Total revenue 3 106,623 88,589
Sales and marketing expenses 7,669 7,100
Operating expenses 51,676 42,849
Administration expenses 26,689 22,949
Acquisition expenses 960 1,338
Foreign currency (gains)/losses (770) 1,378
Total expenses 86,224 75,614
Operating Profit 20,399 12,975
Finance costs (680) (580)
Finance income 350 480
Share of loss from associates 4.4 (3,256) (914)
Capital gain on sale of Vista China - 41,069
Profit before tax 16,813 53,030
Tax expense 8.1 (6,830) (3,550)
Profit for the period 9,983 49,480
Profit for the period is attributable to:
Owners of the parent 9,676 48,620
Non-controlling interests 307 860
9,983 49,480
Other comprehensive income/(loss)
Items that may be reclassified to profit or loss:
Exchange differences on translation of foreign operations, net of tax 3,146 (1,779)
Total comprehensive income for the period 13,129 47,701
Total comprehensive income for the period is attributable to:
Owners of the parent 12,768 47,201
Non-controlling interests 361 500
13,129 47,701
Earnings per share for profit attributable to the equity holders of the parent
Basic (cents per share) 6.2 $0.06 $0.30
Diluted (cents per share) 6.2 $0.06 $0.30
The above statement should be read in conjunction with the accompanying notes.
04VISTA GROUP INTERNATIONAL LIMITED

ATTRIBUTABLE TO THE OWNERS OF THE PARENT
NON-CONTROLLING
INTERESTSTOTAL
EQUITYCONTRIBUTED
EQUITYRETAINED EARNINGS
FOREIGN CURRENCY
RESERVE
SHARE-BASED PAYMENT RESERVE TOTAL
SECTION NZ$’000 NZ$’000 NZ$’000 NZ$’000 NZ$’000 NZ$’000 NZ$’000
Balance at 1 January 2017 55,654 71,281 (991) 1,695 127,639 10,728 138,367
Profit for the period - 9,676 - - 9,676 307 9,983
Other comprehensive income - - 3,092 - 3,092 54 3,146
Total comprehensive income - 9,676 3,092 - 12,768 361 13,129
Issue of equity 1,107 - - - 1,107 - 1,107
Share-based payments 6.3 249 - - 466 715 37 752
Dividends paid 6.2 - (5,751) - - (5,751) (699) (6,450)
VCL share based payment 4.2 811 - - (412) 399 - 399
Acquisition of non-controlling interests
4.1 - - - - - 797 797
Balance at 31 December 2017 57,821 75,206 2,101 1,749 136,877 11,224 148,101
Balance at 1 January 2016 45,952 22,661 164 2,296 71,073 7,979 79,052
Profit for the period - 48,620 - - 48,620 860 49,480
Other comprehensive loss - - (1,419) - (1,419) (360) (1,779)
Total comprehensive income - 48,620 (1,419) - 47,201 500 47,701
Issue of share capital 7,983 - - - 7,983 - 7,983
Share-based payments 75 - - 1,043 1,118 - 1,118
Disposal of Vista China - - 264 - 264 - 264
VCL contingent consideration 1,644 - - (1,644) - - -
Acquisition of non-controlling interests
- - - - - 2,249 2,249
Balance at 31 December 2016 55,654 71,281 (991) 1,695 127,639 10,728 138,367
The above statement should be read in conjunction with the accompanying notes.
STATEMENT OF CHANGES IN EQUITYFOR THE YEAR ENDED 31 DECEMBER 2017
05ANNUAL FINANCIAL STATEMENTS 2017
2017 2016
SECTION NZ$’000 NZ$’000
CURRENT ASSETS
Cash 5.1 20,954 15,798
Short term deposits 5.1 - 5,540
Trade and other receivables 7.1 71,119 73,392
Income tax receivable 212 449
Total current assets 92,285 95,179
NON-CURRENT ASSETS
Property, plant and equipment 7.3 4,637 4,162
Investment in associates 4.4 26,066 27,669
Goodwill 4.3 62,844 50,285
Other intangible assets 7.2 16,061 12,789
Deferred tax asset 8.2 2,342 1,541
Total non-current assets 111,950 96,446
Total assets 204,235 191,625
CURRENT LIABILITIES
Trade and other payables 7.5 14,769 14,519
Deferred revenue 23,751 22,473
Contingent consideration - 3,122
Borrowings related party 5.3 614 -
Income tax payable 2,069 2,315
Total current liabilities 41,203 42,429
NON-CURRENT LIABILITIES
Borrowings 5.3 10,709 4,848
Deferred revenue 1,379 3,444
Employee benefits – VCL acquisition - 343
Contingent consideration 4.1 908 -
Provisions 292 279
Deferred tax liability 8.2 1,643 1,915
Total non-current liabilities 14,931 10,829
Total liabilities 56,134 53,258
Net assets 148,101 138,367
EQUITY
Contributed equity 6.1 57,821 55,654
Retained earnings 75,206 71,281
Foreign currency revaluation reserve 2,101 (991)
Share based payment reserve 6.3 1,749 1,695
Total equity attributable to owners of the parent 136,877 127,639
Non-controlling interests 4.4 11,224 10,728
Total equity 148,101 138,367
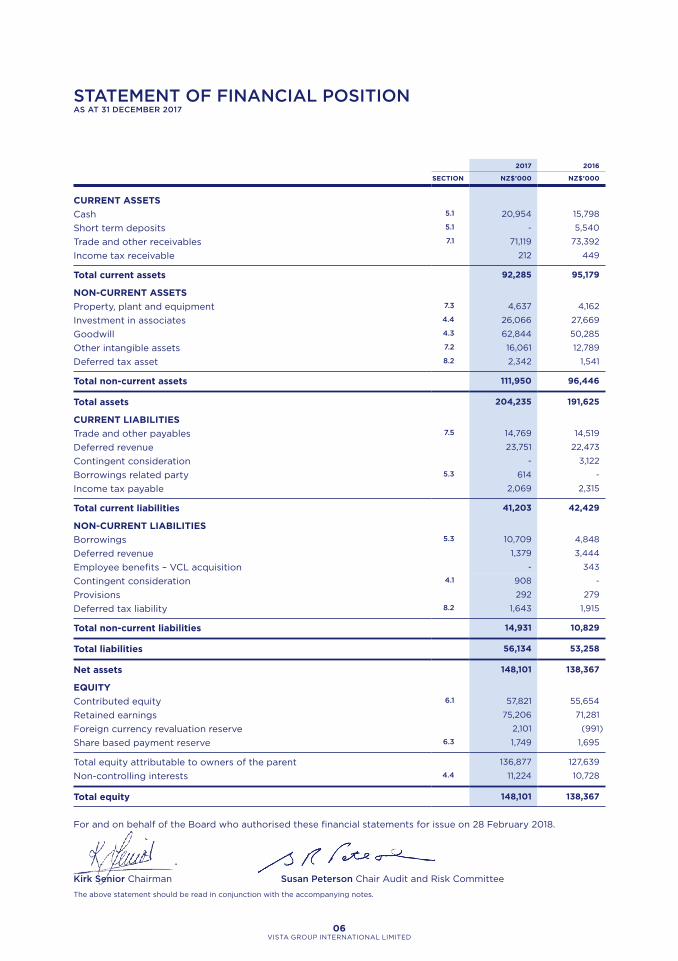
For and on behalf of the Board who authorised these financial statements for issue on 28 February 2018.
Kirk Senior Chairman Susan Peterson Chair Audit and Risk Committee
The above statement should be read in conjunction with the accompanying notes.
STATEMENT OF FINANCIAL POSITIONAS AT 31 DECEMBER 2017
06VISTA GROUP INTERNATIONAL LIMITED

2017 2016
SECTION NZ$’000 NZ$’000
CASHFLOWS FROM OPERATING ACTIVITIES
Receipts from customers 105,143 69,247
Interest received 86 476
Payments to suppliers (87,141) (58,502)
Taxes paid (6,784) (5,484)
Interest paid (259) (317)
Net cash inflow from operating activities 11,045 5,420
CASHFLOWS FROM INVESTING ACTIVITIES
Purchase of property, plant and equipment 7.3 (1,629) (3,353)
Internally generated software and other intangibles 7.2 (5,005) (4,890)
Related party loan – Numero 4.4 - (1,121)
Related party advance – Numero 4.4 (1,703) -
Acquisition of a business, net of cash acquired 4.1 (7,545) (7,163)
Contingent consideration paid 4.2 (2,824) -
Disposal of Vista China - (1,439)
Proceeds from Vista China transaction 8,301 -
Net cash (applied to) investing activities (10,405) (17,966)
CASHFLOWS FROM FINANCING ACTIVITIES
Issue of ordinary shares - 7,983
Loans and borrowings 5.3 6,475 -
Dividends paid to non-controlling interest (699)
Dividends paid to the owners of the parent 6.2 (5,751) -
Net cash inflow from financing activities 25 7,983
Net increase/(decrease) in cash and short term deposits 665 (4,563)
Cash and short term deposits at the beginning of the year 21,338 27,300
Foreign exchange differences (1,049) (1,399)
Cash and short term deposits at end of period 20,954 21,338
The above statement should be read in conjunction with the accompanying notes.
STATEMENT OF CASHFLOWSFOR THE YEAR ENDED 31 DECEMBER 2017
07ANNUAL FINANCIAL STATEMENTS 2017

General information
The notes are consolidated into nine sections. Each section contains an introduction which is indicated by the
symbol above. The first section outlines general information about Vista Group and guidance on how to navigate
through this document.
Accounting policies
The principal accounting policies adopted in the preparation of these financial statements are set out throughout
the document where they are applicable. These policies have been consistently applied to all years presented,
unless otherwise stated.
Accounting policies are identified by the symbol above.
Critical judgements and estimates in applying the accounting policies
Further details of the nature of these Critical Judgements and estimates may be found throughout the financial
statements as they are applicable and are identified by the symbol above.
1.GENERALINFORMATIONThese consolidated financial statements are for Vista Group International Limited (the ‘Company’ and its
subsidiaries, collectively ‘Vista Group’) which is a company incorporated and domiciled in New Zealand, and
whose shares are publicly traded on the New Zealand Stock Exchange (NZX) and the Australian Securities
Exchange (ASX).
The Company is registered under the Companies Act 1993 and is an FMC reporting entity under Part 7 of the
Financial Markets Conduct Act 2013. The financial statements of Vista Group have been prepared in accordance
with the requirements of Part 7 of the Financial Markets Conduct Act 2013 and the NZX Main Board Listing Rules.
In accordance with the Financial Markets Conduct Act 2013, because financial statements are prepared and
presented for Vista Group, separate financial statements for the Company are not presented.
The principal activity of Vista Group is the sale, support and associated development of software for the
film industry.
These financial statements were approved by the Directors on 28 February 2018.
2.BASISOFPREPARATIONThis section outlines the legislation and accounting standards which have been followed in the preparation
of these financial statements along with explaining how the information has been aggregated.
2.1 KEY LEGISLATION AND ACCOUNTING STANDARDS
The consolidated financial statements of Vista Group have been prepared in accordance with Generally Accepted
Accounting Practice in New Zealand (NZ GAAP). Vista Group is a for-profit entity for the purposes of complying
with NZ GAAP. The consolidated financial statements comply with New Zealand equivalents to International
Financial Reporting Standards (NZ IFRS), other New Zealand financial reporting standards and authoritative
notices that are applicable to entities that apply NZ IFRS. The consolidated financial statements also comply
with International Financial Reporting Standards (IFRS) and interpretations issued by the IFRS Interpretations
Committee (IFRS IC) applicable to companies reporting under IFRS.
The financial statements have been prepared on the basis of historical cost except for contingent consideration
which is measured at fair value.
NOTES TO THE FINANCIAL STATEMENTS
08VISTA GROUP INTERNATIONAL LIMITED

2.2 ADOPTION OF NEW ACCOUNTING STANDARDS
Certain new accounting standards and interpretations have been published that are not mandatory for
31 December 2017 reporting period and have not been early adopted by Vista Group. The key items applicable
to Vista Group are:
NZ IFRS 15: Revenue from Contracts with Customers
(Effective date: annual periods beginning on or after 1 January 2018)
NZ IFRS 15 deals with revenue recognition and establishes principles for reporting useful information to users
of financial statements about the nature, amount, timing and uncertainty of revenue and cash flows arising from
an entity’s contracts with customers. Revenue is recognised when a customer obtains control of a good or service
and thus has the ability to direct the use and obtain the benefits from the good or service. The standard replaces
NZ IAS 18 ‘Revenue’ and NZ IAS 11 ‘Construction contracts’ and related interpretations. The standard is effective for
annual periods beginning on or after 1 January 2018. Vista Group intends to adopt NZ IFRS 15 on its effective date.
Vista Group has worked through the Cinema segment’s contracts, being the most material part of Vista Group
with reference to this new standard. The impact of the new standard on Cinema contracts is understood however a
quantitative assessment has not yet been completed. NZ IFRS 15 is not expected to cause a significant adjustment
to how revenue will be recognised within the Cinema segment. For other segments the impact of the standard will
be assessed in early 2018.
NZ IFRS 9: Financial Instruments
(Effective date: annual periods beginning on or after 1 January 2018)
NZ IFRS 9 addresses the classification, measurement and derecognition of financial assets and financial liabilities
and introduces new rules for hedge accounting. In July 2014, the IASB made further changes to the classification
and measurement rules and also introduced a new impairment model. These latest amendments now complete
the new financial instruments standard. The standard is effective for accounting periods beginning on or after
1 January 2018. Vista Group intends to adopt NZ IFRS 9 on its effective date and has yet to assess its full impact.
NZ IFRS 16: Leases
(Effective date: periods beginning on or after 1 January 2019)
NZ IFRS 16, ‘Leases’, which replaces the current guidance in NZ IAS 17, was published by the International
Accounting Standards Board (IASB) in January 2016. Under NZ IFRS 16, a contract is, or contains, a lease if
the contract conveys the right to control the use of an identified asset for a period of time in exchange for
consideration. Under NZ IAS 17, a lessee was required to make a distinction between a finance lease (on balance
sheet) and an operating lease (off balance sheet). NZ IFRS 16 now requires a lessee to recognise a lease liability
reflecting future lease payments and a ‘right-of-use asset’ for virtually all lease contracts. The IASB has included
an optional exemption for certain short-term leases and leases of low-value assets; however, this exemption can
only be applied by lessees. The standard is effective for accounting periods beginning on or after 1 January 2019.
Early adoption is permitted but only in conjunction with NZ IFRS 15, ‘Revenue from Contracts with Customers’.
Vista Group intends to adopt NZ IFRS 16 on its effective date and has yet to assess its full impact.
There are no other standards that are not yet effective and that would be expected to have a material impact
on Vista Group.
2.3 BASIS OF CONSOLIDATION
Vista Group’s financial statements consolidate those of the Company, and its subsidiaries as at 31 December 2017.
A subsidiary is an entity over which Vista Group has control. Control is achieved when Vista Group is exposed,
or has rights, to variable returns from its involvement with the investee and has the ability to affect those returns
through its power to direct the activities of the investee.
Consolidation of a subsidiary begins when Vista Group obtains control over the subsidiary and ceases when
Vista Group loses control of the subsidiary. Income and expenses of a subsidiary acquired or disposed of during
the year are included within the statement of comprehensive income from the date Vista Group gains control
until the date Vista Group ceases to control the subsidiary. All subsidiaries have a reporting date of 31 December.
In preparing the consolidated financial statements, all inter entity balances and transactions and unrealised profits
and losses arising within the consolidated entity have been eliminated in full. A change in the ownership interest
of a subsidiary without a loss of control is accounted for as an equity transaction.
09ANNUAL FINANCIAL STATEMENTS 2017
NOTES TO THE FINANCIAL STATEMENTSCONTINUED

Non-controlling interests, presented as part of equity, represent the portion of a subsidiary’s profit or loss and net
assets that is not held by Vista Group. Vista Group attributes total comprehensive income or loss of subsidiaries
to the amounts of the Company and the non-controlling interests based on their ownership interests.
Vista Group treats transactions with non-controlling interests that do not result in a loss of control as transactions with
equity owners of the group. A change in ownership interest results in an adjustment between the carrying amounts of
the controlling and non-controlling interests to reflect their relative interests in the subsidiary. Any difference between
the amount of the adjustment to non-controlling interests and any consideration paid or received is recognised in
a separate reserve within equity attributable to the owners of the Company.
2.4 FOREIGN CURRENCY
Functional and presentation currency
Items included in the financial statements of each of Vista Group’s entities are measured using the currency
of the primary economic environment in which the entity operates (‘the functional currency’). The consolidated
financial statements are presented in New Zealand Dollars (NZD), which is Vista Group’s presentation currency.
All financial information has been presented rounded to the nearest thousand dollars ($000).
Transactions and balances
Foreign currency transactions are translated into the functional currency using the exchange rates prevailing at
the dates of the transactions. Foreign exchange gains and losses resulting from the settlement of such transactions and
from the translation at year-end exchange rates of monetary assets and liabilities denominated in foreign currencies are
recognised in the statement of comprehensive income.
Foreign Currency Translation Reserve (FCTR)
The FCTR is used to record exchange differences arising from the translation of the financial statements of foreign
subsidiaries for consolidation purposes.
Group companies
The results and financial position of all Vista Group entities (none of which has the currency of a hyper-inflationary
economy) that have a functional currency different from the presentation currency are translated into the presentation
currency as follows:
(a) assets and liabilities for each balance sheet presented are translated at the closing rate at the date of that
balance sheet;
(b) income and expenses for each income statement and statement of other comprehensive income, are
translated at average exchange rates (unless this average is not a reasonable approximation of the cumulative
effect of the rates prevailing on the transaction dates, in which case income and expenses are translated at the
rate on the dates of the transactions);
(c) all resulting exchange differences are recognised in other comprehensive income;
(d) goodwill and fair value adjustments arising on the acquisition of a foreign entity are treated as assets and
liabilities of the foreign entity and translated at the closing rate. Exchange differences arising are recognised
in other comprehensive income.
Foreign exchange gains and losses that relate to borrowings are presented in the statement of comprehensive
income, within finance costs. All other foreign exchange gains and losses are presented in the statement of
comprehensive income on a net basis within other expenses.
2.5 INVESTMENT IN ASSOCIATE
Associates are those entities over which Vista Group is able to exert significant influence but which are not
subsidiaries or jointly controlled entities. Vista Group’s investment in an associate is accounted for using the equity
method. Under the equity method, the investment in an associate is initially recognised at cost. In the event of loss
of control of a subsidiary, resulting in an associate company, this is recognised initially at fair value. The carrying
amount of the investment in an associate is increased or decreased to recognise Vista Group’s share of the profit
or loss and other comprehensive income of the associate after the acquisition date. Dividends received or receivable
from associates and joint ventures are recognised as a reduction in the carrying amount of the investment.
10VISTA GROUP INTERNATIONAL LIMITED
NOTES TO THE FINANCIAL STATEMENTSCONTINUED

When Vista Group’s share of losses in an equity-accounted investment equals or exceeds its interest in the entity,
including any other unsecured long-term receivables, Vista Group does not recognise further losses, unless it has
incurred obligations or made payments on behalf of the other entity. Unrealised gains on transactions between
Vista Group and its associates are eliminated to the extent of Vista Group’s interest in these entities. Unrealised
losses are also eliminated unless the transaction provides evidence of an impairment of the asset transferred.
The carrying amount of equity-accounted investments are tested for impairment in accordance with the policy
described in section 7.4.
The financial statements of the associate are prepared for the same reporting period as Vista Group.
When necessary, adjustments are made to bring the accounting policies in line with those of Vista Group.
2.6 GROUP INFORMATION
The financial statements include the following subsidiaries:
NAME PRINCIPAL ACTIVITYCOUNTRY OF INCORPORATION
SHARE- HOLDING
2017
SHARE- HOLDING
2016
Vista Entertainment Solutions Limited Software development and licensing New Zealand 100% 100%
Virtual Concepts Limited Holding company New Zealand 100% 100%
Movio Limited Provision of online loyalty data analytics and marketing
New Zealand 100% 100%
Movio Inc Provision of online loyalty data analytics and marketing
USA 100% 100%
MACCS International BV Software development and licensing Netherlands 50.1% 50.1%
MACCS US Software licensing USA 50.1% 50.1%
Vista Entertainment Solutions (UK) Limited
Software licensing United Kingdom 100% 100%
Vista Entertainment Solutions (USA) Inc Software licensing USA 100% 100%
Vista Entertainment Solutions (Canada) Limited
Non-active Canada 100% 100%
Vista Group Limited Non-active New Zealand 100% 100%
Senda Direccion Technologica SA DE CV Software licensing Mexico 60% 0%
Senda DO Brasil servicos de tecnología LTDA
Software licensing Brazil 60% 0%
Book My Show Limited Online cinema ticketing website New Zealand 74% 74%
Book My Show (NZ) Limited Online cinema ticketing website New Zealand 74% 74%
Share Dimension BV Software development and licensing Netherlands 50% 50%
SC Share Dimension SRL Software development Romania 50% 50%
Flicks Limited Advertising sales New Zealand 100% 100%
Powster Limited Marketing and creative solutions United Kingdom 50% 50%
Powster Inc Marketing and creative solutions USA 50% 0%
Stardust Solutions Limited Application development and licensing
New Zealand 74.85% 75.1%
Stardust Entertainment Inc Application licensing USA 74.85% 75.1%
MovieXchange International Limited Web platform development and licensing
New Zealand 100% 0%
MovieXchange Limited Web platform licensing New Zealand 100% 0%
Vista International Entertainment Solutions South Africa (PTY) Limited
Software licensing South Africa 100% 0%
11ANNUAL FINANCIAL STATEMENTS 2017
NOTES TO THE FINANCIAL STATEMENTSCONTINUED

3.FINANCIALPERFORMANCEThis section outlines further details of Vista Group’s financial performance by building on information presented in the statement of comprehensive income.
3.1 REVENUE
Revenue is recognised to the extent that it is probable that the economic benefits will flow to Vista Group and the revenue can be reliably measured. The following specific recognition criteria must also be met before revenue is recognised.
Products
Product revenue comprises the fees for the license to use software or packaged created content. Revenue is recognised when the significant risks and rewards of ownership have been transferred by making the software usable to the licensee. No revenue is recognised if there are significant uncertainties regarding recovery of the consideration due, associated costs or the possible non-implementation and return of the software.
Maintenance
Maintenance services are billed in advance for a fixed term. Revenue is recorded within deferred revenue on the statement of financial position and recognised on a straight-line basis over the term of the contract billing period, as services are provided.
Services
Services comprise of service fees which are one-off charges. Revenue is recognised when the service is complete or on a stage of completion basis.
Development
Development revenue comprises the revenue associated with development effort as requested and paid for by customers. This category includes revenue associated with development services to deliver the localisation of Vista Group software under the reseller agreement with Vista China. See section 4.4. This revenue is recognised on a stage of completion basis as the performance obligations are delivered.
Other revenue
Other revenue comprises revenue earned from primarily advertising, hardware sales and variable processing fees.
2017 2016
NZ$’000 NZ$’000
Product 42,455 39,153
Maintenance 39,405 35,124
Services 9,947 9,534
Development 11,882 4,321
Other 2,934 457
Revenue 106,623 88,589
No individual customer exceeded 10% of revenue in 2017 or 2016.
Critical judgements used in applying accounting policies and estimation uncertainty
As disclosed in section 4.4, during FY2016 Vista Group entered into a reseller agreement with Vista China which included a number of performance obligations to localise software products made by Vista Group. Management has applied judgement and estimation in determining the stage of completion for each software product being localised for the China market and the associated revenue for each obligation.
3.2 OPERATING SEGMENTS
Vista Group operates in the vertical cinema/film market via four operating segments and a corporate segment. The Chief Executive and the Board of Vista Group are considered to be the Chief Operating Decision Maker (CODM) in terms of NZ IFRS 8 Operating Segments. These segments have been defined based on the reports regularly reviewed by the CODM to make strategic decisions.
As a result of an alteration to internal management reporting during FY2017, Vista Group’s operating segments have changed as described below. Management have also restated the comparative information for the prior year.
12VISTA GROUP INTERNATIONAL LIMITED
NOTES TO THE FINANCIAL STATEMENTSCONTINUED

The Cinema segment includes software associated with cinema management via the Vista software suite
of products, plus the cloud based VEEZI product for smaller scale cinemas. The newly acquired Mexican
business partner Vista Latin America is reported within the Cinema segment. Refer to section 4.1 for further
detail. The Movio segment includes Movio Cinema and Movio Media that provide data analytics and campaign
management. The Additional Group Companies segment is an aggregation of the MACCS, Powster and
Flicks businesses, none of which individually exceed the 10% threshold for segment revenue or profitability
that would require disclosure under NZ IFRS 8 Operating Segments. Early Stage Investments as a segment
includes businesses that are in the start-up phase of their life cycle. In FY2017 this segment includes Stardust,
MovieXchange and Share Dimension (Cinema Intelligence). Similar to the Additional Group Companies segment,
none of the businesses included in this segment individually exceed the 10% threshold for segment revenue or
profitability that would require disclosure under NZ IFRS 8 Operating Segments. The Corporate segment contains
the shared services functions associated with Vista Group International, being legal, finance, senior management
and facilities. Revenue related to the Associate company Vista China is recognised within the Corporate segment.
2017
CINEMA MOVIO
ADDITIONAL GROUP
COMPANIESEARLY STAGE
INVESTMENTS CORPORATE TOTAL
NZ$’000 NZ$’000 NZ$’000 NZ$’000 NZ$’000 NZ$’000
Revenue 67,632 15,490 12,325 1,178 9,998 106,623
Operating expenses (35,259) (7,575) (7,066) (1,357) (419) (51,676)
Sales, general & administration expenses (14,221) (4,361) (4,513) (1,572) (6,063) (30,730)
Foreign currency (losses)/gains 1,684 38 (115) (15) (822) 770
EBITDA(1) 19,836 3,592 631 (1,766) 2,694 24,987
Depreciation & Amortisation (3,628)
EBIT(2) 21,359
Finance income 350
Finance expense (680)
Acquisition costs (960)
Share of loss from associates (3,256)
Tax expense (6,830)
Net profit 9,983
2016 RESTATED
CINEMA MOVIO
ADDITIONAL GROUP
COMPANIESEARLY STAGE
INVESTMENTS CORPORATE TOTAL
NZ$’000 NZ$’000 NZ$’000 NZ$’000 NZ$’000 NZ$’000
Revenue 62,128 11,302 12,117 580 2,462 88,589
Operating expenses (30,697) (6,529) (4,670) (945) (8) (42,849)
Sales, general & administration expenses (14,086) (3,072) (3,831) (879) (4,829) (26,697)
Foreign currency (losses)/gains (2,494) (39) 1 (8) 1,162 (1,378)
EBITDA(1) 14,851 1,662 3,617 (1,252) (1,213) 17,665
Depreciation & Amortisation (3,352)
EBIT(2) 14,313
Finance income 480
Finance expense (580)
Acquisition costs (1,338)
Share of loss from associates (914)
Tax expense (3,550)
Capital gain on sale of Vista China 41,069
Net profit 49,480
(1) EBITDA is a non GAAP measure and is defined as earnings before net finance costs, income tax, depreciation and amortisation, acquisition costs, capital gains/losses and equity accounted results from associate companies.
(2) EBIT is a non GAAP measure and is defined as earnings before net finance costs, income tax, acquisition costs, capital gains/losses and equity accounted results from associate companies.
13ANNUAL FINANCIAL STATEMENTS 2017
NOTES TO THE FINANCIAL STATEMENTSCONTINUED

Revenue by domicile of entity
Vista Group recognises revenue across several jurisdictions. Revenue is allocated to geographical regions on the
basis of where the sale is recorded by each operating entity within Vista Group. Independent resellers are used
to promote the Vista Group’s products in multiple jurisdictions. The revenues recognised via these independent
resellers are not allocated geographically, rather they are shown within the New Zealand and United Kingdom
jurisdictions on the basis of the location of the transacting Vista Group entity.
DOMICILE OF ENTITY2017 RESTATED 2016
NZ$’000 NZ$’000
New Zealand 36,404 27,351
United States 33,722 26,791
United Kingdom 24,090 19,549
China - 6,546
Other 12,407 8,352
Revenue 106,623 88,589
The Other category above includes entities in the Netherlands, Germany, Romania, South Africa and Mexico.
Revenue recognised in 2016 within the China jurisdiction relates to consolidated revenue from Vista China up until
31 August 2016, at which point this entity became an associate company. Refer to section 4.4 for further detail.
Non-current assets by domicile of entity
Non-current operating assets by location of the reporting entity are presented in the following table.
DOMICILE OF ENTITY2017
RESTATED 2016
NZ$’000 NZ$’000
New Zealand 35,492 31,138
United States 8,589 9,153
United Kingdom 9,789 9,716
Other 32,014 18,770
Note that investment in associates are excluded from the non-current assets balance presented.
14VISTA GROUP INTERNATIONAL LIMITED
NOTES TO THE FINANCIAL STATEMENTSCONTINUED

4.BUSINESSCOMBINATIONSThis section outlines how Vista Group has accounted for transactions to acquire new businesses and dispose
of an existing subsidiary and how this has impacted the financial statements.
Business combinations
The acquisition method of accounting is used to account for all business combinations, regardless of whether
equity instruments or other assets are acquired. The consideration transferred for the acquisition of a subsidiary
comprises cash and the fair value of any asset or liability resulting from a contingent consideration arrangement.
Identifiable assets acquired and liabilities and contingent liabilities assumed in a business combination are,
with limited exceptions, measured initially at their fair values at the acquisition date. Vista Group recognises
any non-controlling interest in the acquired entity on an acquisition-by-acquisition basis either at fair value
or at the non-controlling interest’s proportionate share of the acquired entity’s net identifiable assets.
Acquisition-related costs are expensed as incurred.
The excess of the:
• consideration transferred,
• amount of any non-controlling interest in the acquired entity; and
• acquisition-date fair value of any previous equity interest in the acquired entity
over the fair value of the net identifiable assets acquired is recorded as goodwill. If those amounts are less than
the fair value of the net identifiable assets of the subsidiary acquired, the difference is recognised directly in the
statement of comprehensive income as a bargain purchase.
Where settlement of any part of cash consideration is deferred, the amounts payable in the future are discounted
to their present value as at the date of exchange. The discount rate used is the entity’s incremental borrowing rate,
being the rate at which a similar borrowing could be obtained from an independent financier under comparable
terms and conditions.
Contingent consideration is classified either as equity or a financial liability. Amounts classified as a financial liability
are subsequently remeasured to fair value with changes recognised in the statement of comprehensive income.
If the business combination is achieved in stages, the acquisition date carrying value of the acquirer’s previously
held equity interest in the acquiree is remeasured to fair value at the acquisition date. Any gains or losses arising
from such remeasurement are recognised in the statement of comprehensive income
4.1 SENDA DIRECCION TECHNOLOGICA, SA DE CV
Transaction description
On 21 August 2017, Vista Group announced the signing of an agreement to take a controlling 60% stake in its
long-term Latin American business partner Senda Direccion Technologica SA De CV (renamed and referred to as
‘Vista Latin America’ post-acquisition). The effective date of the transaction is defined as 31 August 2017, being the
closest balance date to the execution of agreements. Control is achieved via the Board constitution that allocates
three out of five Board seats to Vista Group and hence Vista controls the majority of voting rights. Accordingly,
Vista Group has consolidated Vista Latin America from 1 September 2017.
This acquisition emphasises the strategic importance of Central and Latin America to Vista Group and its commitment
to continue expansion in the region. Vista Latin America has recently begun to represent Vista Group in Brazil, the fifth
largest cinema market in the world.
15ANNUAL FINANCIAL STATEMENTS 2017
NOTES TO THE FINANCIAL STATEMENTSCONTINUED

Details of the purchase consideration, the net assets acquired and provisional goodwill are as follows:
NZ$’000
Cash 9,956
Shares – Vista Group 684
Contingent consideration 881
Total purchase consideration 11,521
The provisional assets and liabilities recognised as a result of the acquisition are as follows:
NZ$’000
Property, plant and equipment 57
Intangible assets 52
Cash on hand 2,411
Trade and other receivables 4,576
Other assets 1,207
Trade and other payables (262)
Other liabilities (6,048)
Net identifiable assets acquired 1,993
Net assets acquired at 60% 1,196
Provisional goodwill 10,325
Total purchase consideration 11,521
Due to the recency of the transaction, the amounts presented above related to the acquisition of Vista Latin America
are provisional.
Contingent consideration
The purchase agreement includes contingent consideration. Contingent consideration is payable in cash within
10 days of the finalisation of the FY2018 accounts for Vista Latin America, expected to be in March 2019. Contingent
consideration is calculated based on achievement of EBITDA(1) performance over the FY2017 and FY2018 financial
periods against specified performance targets. For the purpose of quantifying the amount payable, an estimate has
been developed based on the expected performance of the Vista Latin America business for these financial years.
The assumptions used have been validated by senior management.
At the acquisition date, the fair value of the contingent consideration was estimated to be $0.9m. The maximum
amount payable under the purchase agreement is uncapped, based on financial performance.
Provisional goodwill
Provisional goodwill is attributable to the strength of Vista Latin America’s business experience and capability
in the Latin American market. Goodwill is not deductible for tax purposes.
Vista Group elected to measure the non-controlling interest in the acquiree as a proportion of net assets acquired.
Vista Group has recognised revenue included in the statement of comprehensive income from 1 September 2017
to 31 December 2017 of $5.5m. Vista Latin America contributed net profit before tax of $2.2m for the same period.
Due to the complexities in aligning the fiscal based accounting policies employed by Vista Latin America with
IFRS, it is not practical for Vista Group to present the full year impact on this newly acquired subsidiary.
(1) EBITDA is defined as earnings before net finance expenses, income tax, depreciation and amortisation
16VISTA GROUP INTERNATIONAL LIMITED
NOTES TO THE FINANCIAL STATEMENTSCONTINUED

4.2 CONTINGENT CONSIDERATION ON ACQUISITIONS
The acquisition of the remaining 43% of Virtual Concepts Limited (VCL) (trading as Movio) in August 2014 included
contingent consideration that was payable to the former owners in the form of cash and shares. Contingent
consideration is payable in three tranches on 1 April 2016, 1 April 2017 and 1 April 2018. As at 31 December 2017, the
first two tranches had been paid and amounted to $1.1m in cash and $2.5m in shares. At the reporting date, the fair
value of the remaining contingent consideration to be paid in the third tranche in 2018 is $1.7m.
The table summarises the changes in estimates in the contingent consideration for VCL:
CONTINGENT CONSIDERATION AT 31 DECEMBER 20172017 2016
NZ$’000 NZ$’000
Amounts Paid
– Cash (current) 348 705
– Shares – Vista Group 811 1,719
1,159 2,424
Estimated liability
– Cash (current) 1,240 1,063
– Cash (non current) - 343
– Shares – Vista Group 524 936
Total estimated liability 1,764 2,342
Vista Group has recognised $0.5m within the share based payment reserve in regard to amounts to be settled in
shares. This will be settled by a variable number of shares depending upon the share price at exercise. The number
of shares will be based upon the average share price for the 30 days preceding exercise date.
During the year Vista Group settled the following amounts in contingent consideration:
2017 2016
CASH SHARES CASH SHARES
NZ$’000 NZ$’000 NZ$’000 NZ$’000
Powster Limited (Powster) 1,955 423 - -
Ticketsoft 729 - - -
Flicks.co.nz (Flicks) 140 - - -
Total contingent consideration 2,824 423 - -
Previous acquisitions
For further details of previous acquisitions made by Vista Group refer to the 2015 and 2016 Annual Reports.
17ANNUAL FINANCIAL STATEMENTS 2017
NOTES TO THE FINANCIAL STATEMENTSCONTINUED

4.3 GOODWILL
2017 2016
SECTION NZ$’000 NZ$’000
Gross carrying amount
Balance 1 January 53,839 44,663
Acquisition through business combinations 4.1 10,325 10,466
Exchange differences 2,234 (1,290)
66,398 53,839
Accumulated impairment
Balance 1 January (3,554) (3,554)
(3,554) (3,554)
Goodwill at period end 62,844 50,285
Goodwill can be analysed by Cash Generating Unit (CGU) as follows:
2017 2016
NZ$’000 NZ$’000
Vista Entertainment Solutions Limited (VESL) 23,384 12,865
Virtual Concepts Limited (VCL) – (Movio) 16,970 16,970
MACCS International BV (MACCS) 12,459 11,165
Share Dimension BV (Cinema Intelligence) 1,959 1,762
Powster Limited (Powster) 7,468 6,919
Flicks.co.nz Limited (Flicks) 604 604
Goodwill at period end 62,844 50,285
The Directors have carried out an annual impairment review of goodwill allocated to the CGU’s, in order to ensure
that recoverable amounts exceed aggregate carrying amounts (see section 7.4 for key assumptions and sensitivity
analysis). The VESL CGU includes $10.3m of goodwill related to the acquisition of Vista Latin America.
18VISTA GROUP INTERNATIONAL LIMITED
NOTES TO THE FINANCIAL STATEMENTSCONTINUED

4.4 OTHER RELATED PARTIES
ASSOCIATE COMPANIES
Vista China
Vista Group has a 39.5% interest in Vista China, an associate company that has been accounted for using the equity
method in the consolidated financial statements. Vista Group commenced equity accounting for Vista China upon
the completion of the sale of a controlling stake to Beijing Weying Technology Co. Ltd (WePiao) on 25 August
2016. Further details related to the transaction are included in the 2016 Annual Report.
Related party transactions have been undertaken during FY2017 as defined under the reseller agreement. The reseller
agreement specifies transactions related to localisation work, support and maintenance fees and payment for an
exclusive 10 year distribution right for all Vista Group software with a right of renewal for another 10 year period.
ENTITY NATURE OF TRANSACTIONS
RECEIVABLES/(PAYABLE)
RECEIVABLES/(PAYABLE)
2017 2016
NZ$’000 NZ$’000
Vista Entertainment Solutions Shanghai Limited Related party receivable 12,780 19,010
Vista Entertainment Solutions Shanghai Limited Related party payable (3,199) (2,691)
Total exposure 9,581 16,319
Related party transactions for the 12 months ended 31 December 2017 were as follows:
2017
FOUR MONTHS ENDED
31 DECEMBER 2016
NZ$’000 NZ$’000
License fees - 2,462
Development fees 7,931 272
Maintenance fees 2,067 688
Recoverable expenses 62 -
Total 10,060 3,422
During 2017 Vista Group recognised $10.0m of revenue from Vista China (2016: $3.4m). The Statement of Financial
Position includes $7.3m (2016: $11.0m) as deferred revenue for development and maintenance which is estimated
to be recognised over the next one and two years respectively.
The related party receivable of $12.8m (2016: $19.0m) includes $5.4m (2016: $5.2m) for receivables owing prior
to the sale of a controlling stake in Vista China and $7.3m (2016: $13.8m) relates to amounts owing under the
reseller agreement between Vista Group and Vista China.
All of the related party transactions during the period were made on normal commercial terms and no amounts
owed by related parties have been provided for, written off or forgiven during the period.
19ANNUAL FINANCIAL STATEMENTS 2017
NOTES TO THE FINANCIAL STATEMENTSCONTINUED

A summarised income statement for Vista China and a reconciliation to the equity accounted loss recognised
in Vista Group is detailed below for year ended 31 December 2017. This has been amended to reflect adjustments
made to align the associate accounting policies to Vista Group accounting policies.
2017
FOUR MONTHS ENDED
31 DECEMBER 2016
NZ$’000 NZ$’000
Revenue 17,259 3,391
Total expenses (21,370) (5,740)
Operating loss (4,111) (2,349)
Finance income 56 37
Loss for the period (4,055) (2,312)
Vista Group equity accounted interest 39.53% 39.53%
Vista Group equity accounted loss for the period (1,603) (914)
A summarised statement of financial position as at 31 December 2017 is presented below:
2017 2016
NZ$’000 NZ$’000
Cash 31,178 40,173
Trade and other receivables 17,036 8,256
Total current assets 48,214 48,429
Total non-current assets 316 154
Total assets 48,530 48,583
Total liabilities (18,719) (15,803)
Net assets 29,811 32,780
The carrying value of the investment in the associate Vista China held by Vista Group is detailed below:
2017 2016
NZ$’000 NZ$’000
Opening net assets 32,780 1,511
Loss for the period (4,055) (2,312)
WePiao investment - 33,581
Closing net assets 28,725 32,780
Vista Group interest 39.53% 39.53%
Vista Group’s share 11,355 12,958
Goodwill 14,711 14,711
Carrying amount 26,066 27,669
20VISTA GROUP INTERNATIONAL LIMITED
NOTES TO THE FINANCIAL STATEMENTSCONTINUED

Numero Limited
Vista Group has a 50% interest in Numero Limited (Numero), an associate that is accounted for using the equity
method in the consolidated financial statements. Vista Group ceased to recognise further losses in FY2015 related
to Numero as accumulated losses would exceed Vista Group’s equity interest.
All of the related party transactions during the period were made on normal commercial terms.
The types of related party transactions undertaken during the period relate to recharges for development work
undertaken and advances made.
ENTITY NATURE OF TRANSACTIONS
RECEIVABLES/(PAYABLE)
RECEIVABLES/(PAYABLE)
2017 2016
NZ$’000 NZ$’000
Numero Limited Related party loan 2,621 2,621
Numero Limited Constructive obligation - (50)
Numero Limited Related party receivable 2,792 2,792
Total 5,413 5,363
During the year a provision for $1.7m (2016: Nil) was recognised in relation to advances made to Numero.
During 2017 Vista Group derecognised the constructive obligation related to Numero.
The related party transactions incurred during the year include:
2017 2016
NZ$’000 NZ$’000
Recharges – license fees 329 396
Recharges – development fees 459 523
Recharges – other advances 653 (353)
Recharges – interest on loan 262 316
Total 1,703 882
The amounts receivable are unsecured and no guarantees are in place. Vista Group can call the debt recognised as an
intercompany receivable at any time. Interest of 10% is charged against the intercompany loan per the loan agreement.
Vista Group ceased to recognise further losses related to Numero in 2015. Losses were previously recognised to
the extent of the value held in equity for Numero, however this has now been offset by Vista Group’s share of
losses. During the year Numero made a loss of $2.0m, Vista Group’s share being $1.0m (2016: $0.63m).
TRANSACTIONS WITH KEY MANAGEMENT PERSONNEL
Key management personnel include Vista Group’s Board of Directors (executive and non-executive) and senior
management. Senior management are defined as personnel that report directly to Vista Group’s Chief Executive.
Key management personnel include: 14 individuals (6 Directors and 8 Senior Management) (2016: 13 being
5 Directors and 8 Senior Management).
The compensation paid to key management personnel includes the following amounts:
2017 2016
NZ$’000 NZ$’000
Salaries including bonuses 3,411 2,730
Share based payments 131 -
Directors fees 233 236
Total 3,775 2,966
Transactions with key management personnel also included dividends paid to them as shareholders of $0.6m (2016: Nil).
21ANNUAL FINANCIAL STATEMENTS 2017
NOTES TO THE FINANCIAL STATEMENTSCONTINUED
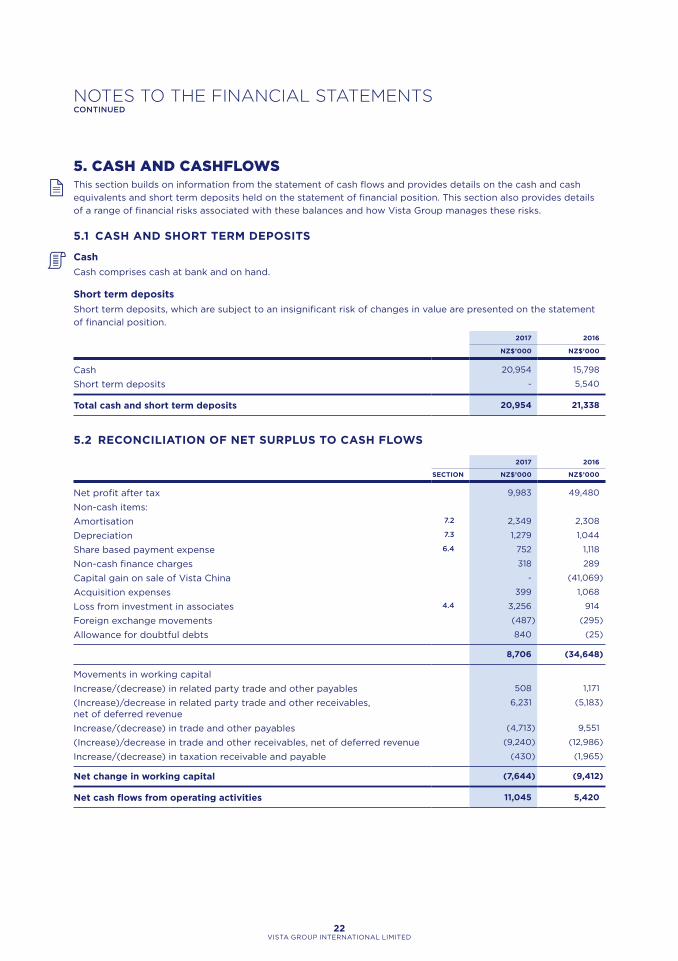
5.CASHANDCASHFLOWSThis section builds on information from the statement of cash flows and provides details on the cash and cash
equivalents and short term deposits held on the statement of financial position. This section also provides details
of a range of financial risks associated with these balances and how Vista Group manages these risks.
5.1 CASH AND SHORT TERM DEPOSITS
Cash
Cash comprises cash at bank and on hand.
Short term deposits
Short term deposits, which are subject to an insignificant risk of changes in value are presented on the statement
of financial position.
2017 2016
NZ$’000 NZ$’000
Cash 20,954 15,798
Short term deposits - 5,540
Total cash and short term deposits 20,954 21,338
5.2 RECONCILIATION OF NET SURPLUS TO CASH FLOWS
2017 2016
SECTION NZ$’000 NZ$’000
Net profit after tax 9,983 49,480
Non-cash items:
Amortisation 7.2 2,349 2,308
Depreciation 7.3 1,279 1,044
Share based payment expense 6.4 752 1,118
Non-cash finance charges 318 289
Capital gain on sale of Vista China - (41,069)
Acquisition expenses 399 1,068
Loss from investment in associates 4.4 3,256 914
Foreign exchange movements (487) (295)
Allowance for doubtful debts 840 (25)
8,706 (34,648)
Movements in working capital
Increase/(decrease) in related party trade and other payables 508 1,171
(Increase)/decrease in related party trade and other receivables, net of deferred revenue
6,231 (5,183)
Increase/(decrease) in trade and other payables (4,713) 9,551
(Increase)/decrease in trade and other receivables, net of deferred revenue (9,240) (12,986)
Increase/(decrease) in taxation receivable and payable (430) (1,965)
Net change in working capital (7,644) (9,412)
Net cash flows from operating activities 11,045 5,420
22VISTA GROUP INTERNATIONAL LIMITED
NOTES TO THE FINANCIAL STATEMENTSCONTINUED

5.3 BORROWINGS
Borrowings are initially recognised at fair value less directly attributable transactions costs and subsequently
measured at amortised cost using the effective interest method. Borrowing costs are expensed as incurred.
In November 2017, Vista Group established a senior facility agreement with the ASB. The new facility includes the
previously established NZD $2.0m commercial credit overdraft facility and the EUR ¤3.0m term loan as well as
adding a USD $4.0m term loan facility. The USD term loan was established to fund part of the Vista Latin America
acquisition. See section 4.1 for more detail.
The NZD $2.0m commercial credit overdraft facility is used to fund working capital as required. The interest rate
is floating at 6.18% (2016: 6.1%) per annum with no set expiry date. At balance date, there was no draw down
against this facility.
The EUR ¤3.0m term loan was initially established in March 2014 to acquire 25.1% of the share capital of MACCS
International BV. The loan matures on 12 March 2020 and the current interest rate is 3.03% (2015: 2.85%)
per annum.
The USD $4.0m term loan was established to fund part of the acquisition of Vista Latin America. The loan matures
on 31 October 2021 and the current interest rate is 4.44% per annum.
Security for both the senior facility agreement with ASB Bank Limited is secured by a general security agreement
under which the Bank has a security interest in all Vista Group’s tangible assets. Covenants in place include a total
equity and EBITDA covenant which are reported quarterly. Vista Group has been fully compliant with all covenants
for the year.
The loan from Tanasescu Holdings is presented as a related party loan in the table below. The loan is in place to
contribute towards the working capital requirements for Share Dimension. The loan matures on 23 December 2018
and the current interest rate is 5% per annum.
2017 2016
NZ$’000 NZ$’000
Borrowings related party 614 303
Borrowings 10,709 4,545
Total borrowings 11,323 4,848
5.4 FINANCIAL RISK MANAGEMENT
Vista Group is exposed to three main types of risks in relation to financial instruments, which are market (foreign
currency risk and interest rate risk), credit and liquidity.
Vista Group’s risk management framework is set by the Board and implemented by management. Its focus includes
actively monitoring and securing Vista Group’s short to medium-term cash flows by minimising the exposure to
financial markets. The most significant financial risks to which Vista Group is exposed are described below.
Foreign currency risk
Most of Vista Group’s transactions carry a component that is ultimately repatriated back to NZD. Exposures
to currency exchange rates arise from overseas sales, which are primarily denominated in US dollars (USD),
Pounds Sterling (GBP), Australian dollars (AUD), Chinese Yuan Renminbi (CNY) and Euros (EUR).
To mitigate exposure to foreign currency risk, non-NZD cash flows are monitored in accordance with the
Vista Group’s risk management policies. Vista Group’s risk management policies include treasury management
and foreign exchange policies, the implementation of which is set and reviewed regularly by the Board. Vista
Group’s risk management procedures distinguish short-term foreign currency cash flows (due within 6 months) from
longer-term cash flows (due after 6 months). Where the amounts to be paid and received in a specific currency are
expected to largely offset one another, no further hedging activity is undertaken. The foreign exchange policy allows
for the use of hedging activity however no financial instruments were in use at balance date.
23ANNUAL FINANCIAL STATEMENTS 2017
NOTES TO THE FINANCIAL STATEMENTSCONTINUED

Foreign currency denominated financial assets and liabilities which expose Vista Group to currency risk are disclosed
below. The amounts shown are those reported to key management translated into NZD at the closing rate:
USD GBP EUR CNY AUD
NZ$’000 NZ$’000 NZ$’000 NZ$’000 NZ$’000
31 DECEMBER 2017
Financial assets
Cash 14,731 3,648 1,339 - 388
Trade receivables 22,985 4,519 3,814 11,934 1,269
Sundry receivables - - 510 8,664 -
Financial liabilities
Trade payables (3,385) (88) (162) (1,375) -
Sundry accruals (872) (157) (5) (980) -
Borrowings (5,637) - (5,686) - -
Contingent consideration (908) - - - -
Net exposure 26,914 7,922 (190) 18,243 1,657
31 DECEMBER 2016
Financial assets
Cash 6,390 3,220 2,835 - 984
Trade receivables 14,912 4,676 3,978 13,827 979
Sundry receivables - - - 16,510 -
Financial liabilities
Trade payables (677) (260) (376) (2,197) (188)
Borrowings - - (4,848) - -
Contingent consideration (735) (2,250) - - -
Net exposure 19,890 5,386 1,589 28,140 1,775
The following table illustrates the sensitivity of profit or loss and equity in regards to Vista Group’s financial assets
and liabilities affected by USD/NZD exchange rate, the GBP/NZD exchange rate, the EUR/NZD exchange rate,
the CNY/NZD exchange rate and AUD/NZD exchange rate ‘all other things being equal’. It assumes a +/ – 10%
change of the NZD/USD exchange rate for the year ended at 31 December 2017 (2016: 10%). A +/ – 10% change
is considered for the NZD/GBP exchange rate (2016: 10%). A +/ – 10% change is considered for the NZD/AUD
exchange rate (2016: 10%). A +/ – 10% change is considered for the NZD/EUR exchange rate (2016: 10%).
A +/ – 10% change is considered for the CNY/NZD exchange rate (2016: 10%). These percentages have been
determined based on the average market volatility in exchange rates in the previous 12 months. The sensitivity
analysis is based on Vista Group’s foreign currency financial instruments held at each reporting date.
PROFIT/EQUITY
USD GBP EUR CNY AUD
NZ$’000 NZ$’000 NZ$’000 NZ$’000 NZ$’000
31 December 2017
10% strengthening in NZD (2,447) (720) 17 (1,658) (151)
10% weakening in NZD 2,991 880 (21) 2,027 184
31 December 2016
10% strengthening in NZD (1,808) (490) (144) (2,558) (161)
10% weakening in NZD 2,210 598 177 3,127 197
Exposures to foreign exchange rates vary during the year depending on the volume of overseas transactions.
Nonetheless, the analysis above is considered to be representative of Vista Group’s exposure to market risk.
24VISTA GROUP INTERNATIONAL LIMITED
NOTES TO THE FINANCIAL STATEMENTSCONTINUED

Interest rate risk
Vista Group’s interest rate risk primarily arises from long-term borrowing, cash, short term deposits and advances
to associates. Borrowings and deposits at variable rates expose Vista Group to cash flow interest rate risk.
Borrowings and deposits at fixed rates expose Vista Group to fair value interest rate risk.
The following tables set out the interest rate repricing profile and current interest rate of the interest bearing
financial assets and liabilities.
AS AT 31 DECEMBER 2017
EFFECTIVE INTEREST
RATE
FLOATINGFIXED UP TO
3 MONTHSFIXED UP TO
6 MONTHSFIXED UP TO
5 YEARS TOTAL
NZ$’000 NZ$’000 NZ$’000 NZ$’000 NZ$’000
Assets
Related party loan – Numero 10.0% - - - 2,621 2,621
Cash 20,954 - - - 20,954
20,954 - - 2,621 23,575
Liabilities
Borrowings 3.8% (10,709) (10,709)
Borrowings related party 5.0% (614) (614)
- - - (11,323) (11,323)
Total exposure 20,954 - - (8,702) 12,252
Profit or loss is sensitive to higher/lower interest income/expense from cash and short term deposits as a result of
changes in interest rates.
AS AT 31 DECEMBER 2017
EFFECTIVE INTEREST RATE
+1%
EFFECTIVE INTEREST RATE
– 1%
NZ$’000 NZ$’000
Assets
Cash 210 (210)
Related party loan – Numero (26) 26
Borrowings (107) 107
Borrowings related party (6) 6
Total exposure 71 (71)
25ANNUAL FINANCIAL STATEMENTS 2017
NOTES TO THE FINANCIAL STATEMENTSCONTINUED

Credit risk
Credit risk is the risk that a counterparty fails to discharge an obligation to Vista Group. Vista Group is exposed
to this risk for various financial instruments, for example trade and sundry receivables and deposits with financial
institutions and related parties. The maximum exposure to credit risk is limited to the carrying amount of financial
assets recognised at 31 December, as summarised in section 9.3.
Vista Group continuously monitors defaults of customers and other counterparties, identified either individually
or by Vista Group, and incorporates this information into its credit risk controls. Vista Group’s policy is to deal only
with creditworthy counterparties.
At 31 December Vista Group has certain trade receivables that have not been settled by the contractual due
date but are not considered to be impaired because of the nature of contracts and/or the longevity of ongoing
customer relationships. The amounts at 31 December, analysed by the length of time past due, are:
2017 2016
NZ$’000 NZ$’000
Not more than 3 months 6,664 10,881
Between 3 months and 4 months 8,202 580
Over 4 months 16,150 4,241
31,016 15,702
As at 31 December 2017, Vista Group holds a receivable from its associate company, Vista China, amounting
to $12.8m, all of which is over 4 months past due.
In respect of trade receivables, Vista Group is not exposed to any significant credit risk exposure to any single
counterparty or any group of counterparties having similar characteristics. Trade receivables consist of a large
number of customers in various industries and geographical areas. Based on historical information about customer
default rates, management considers the credit quality of trade receivables that are not past due or impaired
to be good.
Judgement has been applied to the recoverability of all receivables, with senior management confirming that
all amounts are deemed recoverable and are not impaired.
The credit risk for cash and short term deposits is considered negligible, since the counterparties are reputable
banks with high quality external credit ratings.
Included within sundry receivables is $8.7m (2016: $16.5m) from WePiao related to the equity purchase of 18.3%
of Vista China. See section 9.4.
Advances to Numero are subject to credit risk and the extent of the recovery of the advances is dependent on
Numero achieving budgeted and forecasted growth.
26VISTA GROUP INTERNATIONAL LIMITED
NOTES TO THE FINANCIAL STATEMENTSCONTINUED

Liquidity risk
Liquidity risk is the risk that Vista Group might be unable to meet its obligations. Vista Group’s objective is to maintain
a balance between continuity of funding and flexibility through monitoring of cash and short term deposits and the
use of bank overdrafts and bank loans (see section 5.3). Vista Group’s policy is that not more than 25% of borrowings
should mature in the next 12-month period. The related party borrowings of $0.6m (2016: Nil) will mature in less than
one year at 31 December 2017. Vista Group assessed the concentration of risk with respect to refinancing its debt as
being low. Access to sources of funding is sufficiently available and debt maturing within 12 months can be rolled over
with existing lenders.
Vista Group has significant cash balances held as cash on hand of $20.95m (refer section 5.1). Vista Group’s
dividend policy is to distribute between 30% to 50% of net profit after tax subject to immediate and future growth
opportunities and identified capital expenditure requirements. At balance date Vista Group has a NZD $2m on call
credit facility with the ASB, against which there has been no draw down.
The table below summarises the maturity profile of Vista Group’s non-derivative financial liabilities based
on contractual undiscounted payments.
ON DEMANDLESS THAN 3 MONTHS
3 TO 12 MONTHS
1 TO 5 YEARS > 5 YEARS
SECTION NZ$’000 NZ$’000 NZ$’000 NZ$’000 NZ$’000
2017
Trade payables 7.5 - 4,413 - - -
Sundry accruals 7.5 - 3,988 - - -
Borrowings 5.3 - - 614 10,709 -
Interest on borrowings - 77 232 824 -
Contingent consideration 4.1 - - - 908 -
- 8,478 846 12,441 -
2016
Trade payables - 6,229 - - -
Sundry accruals - 4,231 - - -
Borrowings - - - 4,848 -
Interest on borrowings - 32 97 308 -
Contingent consideration - - 3,122 - -
- 10,492 3,219 5,156 -
27ANNUAL FINANCIAL STATEMENTS 2017
NOTES TO THE FINANCIAL STATEMENTSCONTINUED

6.CAPITALSTRUCTUREThis section outlines Vista Group’s capital structure and details of share based employee incentives which have
an impact on Vista Group’s equity.
Equity, reserves and dividend payments
Share capital represents the value of shares that have been issued. Incremental costs directly attributable to the
issue of ordinary shares are recognised as a deduction from equity. Retained earnings include all current and prior
period retained profits and losses. Dividend distributions payable to equity shareholders are included in trade and
other payables when the dividends have been approved by the Board on or before the end of the reporting period
but not yet distributed. All transactions with owners of the parent are recorded separately within equity.
All shares are ordinary authorised, issued and fully paid shares. They all have equal voting rights and share equally
in dividends and any surplus on winding up. The shares have no par value.
On 10 November 2017, Vista Group announced a two for one share split with a record date of 24 November 2017.
As a result of the share split, total shares on issue increased to 164,756,926.
6.1 CONTRIBUTED EQUITY
During the 2017 financial year, 438,170 shares were issued (2016: 1.97m). A total of 115,764 shares were issued
as part of total consideration for the acquisition of 60% of Vista Latin America (refer section 4.1). A total of
144,901 shares were issued for no consideration in respect to share-based payments related to VCL contingent
consideration (refer section 4.2). A total of 75,534 shares were issued for no consideration in respect to share-
based payments related to Powster contingent consideration. A total of 101,971 shares were issued in respect
to an employee incentive agreement for no consideration (2016: 14,323).
2017 2016
NO. OF SHARES NO. OF SHARES 2017 2016
SECTION 000’S 000’S NZ$’000 NZ$’000
Shares issued and fully paid:
Beginning of the year 81,940 79,973 55,654 45,952
Ordinary shares issued during the year
Powster contingent consideration 75 - 423 -
VCL contingent consideration 4.2 145 314 811 1,645
Employee incentives 6.4 102 14 249 75
WePiao – Vista China transaction - 1,639 - 7,982
Vista Latin America acquisition 4.1 116 - 684 -
Total shares prior to share split 82,378 81,940 57,821 55,654
Impact of two for one share split 82,378 - - -
Total shares authorised as 31 December 164,757 81,940 57,821 55,654
28VISTA GROUP INTERNATIONAL LIMITED
NOTES TO THE FINANCIAL STATEMENTSCONTINUED

6.2 EARNINGS PER SHARE AND DIVIDENDS
Earnings per share
Vista Group presents basic and diluted earnings per share (EPS) data for its ordinary shares. Basic EPS is calculated
by dividing the profit or loss attributable to ordinary shareholders of the Parent by the weighted average number of
ordinary shares in issue during the year.
Diluted EPS reflects any commitments Vista Group has to issue shares in the future that would decrease EPS. In 2017,
these are in the form of share based payments and performance rights. To calculate the impact it is assumed that
share based payments related to FY2017 earning targets are achieved and all the performance rights are taken,
therefore adjusting the weighted average number of shares.
The following reflects the income and share data used in the basic and diluted EPS computations:
2017RESTATED
2016
NZ$’000 NZ$’000
Profit attributable to ordinary shareholders of the Parent for basic earnings 9,676 48,620
Profit attributable to ordinary shareholders of the Parent adjusted for the effect of dilution
9,676 48,620
Weighted average number of shares in basic earnings per share 164,448 160,712
Shares deemed to be issued for no consideration in respect of share-based payments 1,082 868
Weighted average number of shares used in diluted earnings per share 165,530 161,580
EPS $0.06 $0.30
Diluted EPS $0.06 $0.30
The weighted average number of shares for 2016 has been restated to include the impact of the 2017 two for one
share split.
Dividends
During 2017 Vista Group paid two dividends. In March 2017 Vista Group paid a final dividend of 4.61 cents per share
related to FY2016. In September 2017, Vista Group paid an interim dividend of 2.4 cents per share.
6.3 SHARE BASED PAYMENTS
Equity settled long term incentive scheme
During the 2017 financial year, the Directors issued the 2017 Long Term Incentive Scheme (LTI Scheme), under
identical terms and conditions to the schemes approved for 2015 and 2016. The LTI Scheme is intended to focus
performance on achievement of key long-term performance metrics, refer to section 6.4 for more details.
Share based payment reserve
The share based payment reserve is used to record any equity share based incentives. The reserve value represents
the difference between the value at the time of allocation and the cash received incentives plus the equity component
of contingent consideration payable.
29ANNUAL FINANCIAL STATEMENTS 2017
NOTES TO THE FINANCIAL STATEMENTSCONTINUED

6.4 EQUITY SETTLED LONG TERM INCENTIVE SCHEME
During 2017, the Directors approved the third annual issue of an equity settled LTI Scheme implemented in 2015 for
selected key management personnel (‘Participants’). The plan is intended to focus performance on achievement of
key long-term performance metrics.
The allocation of performance rights is based on a percentage of annual base salary, adjusted by a risk factor
calculated using the Monte Carlo valuation model. Performance rights are granted under the plan for no consideration
and carry no dividend or voting rights. Participation in the LTI Scheme is at the Board’s discretion and participants
in the LTI Scheme are not guaranteed participation from year to year.
The amount of performance rights that will vest depends on Vista Group’s relative Total Shareholder Return (‘TSR’)
to shareholders. Vesting of performance rights is dependent upon Vista Group achieving relative TSR targets over a
two and three year performance period, against all other NZX50 companies (excluding Vista Group), with 50% of the
value of rights allocated under each target. Vesting of the performance rights is defined by the following table:
PERCENTILE PERFORMANCE AGAINST NZX50 COMPANIES VESTING PERFORMANCE RIGHTS
Less than 50th percentile Zero
50th – 75th percentile 50% to 100% pro-rata on a straight line basis
Greater than 75th percentile 100%
TSR is measured by the change in TSR from the start date of the grant period until the end of the performance
period (two years and three years). The LTI Scheme allows the carry forward of any performance rights that do not
vest in the first vesting period to be eligible to vest in the vesting period for the second tranche of performance
rights. The scale at which carried over rights may vest at the end of the tranche two vesting period shall
commence at the TSR percentile achieved in respect of the tranche one vesting period.
The fair value of rights granted is recognised as an employee expense in the statement of comprehensive income
with a corresponding increase in the employee share based payments reserve. The fair value is measured at grant
date and amortised over the vesting periods. Vista Group has recognised $0.8m of employee expenses during the
year ended 31 December 2017 (2016: $0.55m) related to the three active LTI Schemes.
The fair value of the rights granted is measured using Vista Group share price as at the grant date less the present
value of the dividends forecast to be paid prior to each vesting date. When performance rights vest, the amount
in the share based payments reserve relating to those rights are transferred to share capital. When any vested
performance rights lapse upon employee termination, the amount in the share based payments reserve relating
to those rights is transferred to retained earnings.
Set out below are summaries of performance rights granted under the plan:
GRANT DATE EXPIRY DATE
TOTAL VALUE OF GRANTED PERFORMANCE RIGHTS
PERFORMANCE RIGHTS GRANTED AT 31 DECEMBER 2017
$000’S 000’S
1 January 2015 1 April 2018 248 200
1 January 2016 1 April 2018 413 232
1 January 2016 1 April 2019 413 232
1 January 2017 1 April 2019 364 209
1 January 2017 1 April 2020 364 209
1,802 1,082
30VISTA GROUP INTERNATIONAL LIMITED
NOTES TO THE FINANCIAL STATEMENTSCONTINUED

GRANT DATE
AVERAGE EXERCISE PRICE PER
PERFORMANCE RIGHT
2017
AVERAGE EXERCISE PRICE PER
PERFORMANCE RIGHT
2016
NUMBER OF PERFORMANCE RIGHTS
NUMBER OF PERFORMANCE RIGHTS
000’S 000’S
As at 1 January $1.56 868 $1.22 412
Granted during the year $1.70 418 $1.81 462
Exercised during the year $1.22 (204) - -
Forfeited during the year - - $1.81 (6)
As at 31 December $1.68 1,082 $1.56 868
Following the two for one share split in November 2017 the number of performance rights has doubled.
Virtual Concepts Limited (VCL) incentive scheme
Certain employees of VCL receive remuneration in the form of share based payments contingent upon achieving
certain annual milestones as part of the acquisition of VCL. The cost is recognised within acquisition expenses in
the statement of comprehensive income, refer to section 4.2 for more details of the scheme.
Expenses arising from share based payment transactions
The expense recognised for employee services received during the year is shown in the following table and are
included within operating expenses:
2017 2016
NZ$’000 NZ$’000
Expenses arising from VCL acquisition 538 1,564
Equity settled LTI scheme 715 551
Stardust equity settled scheme 37 -
Total expense 1,290 2,115
6.5 CAPITAL MANAGEMENT POLICIES AND PROCEDURES
Vista Group’s capital management objective is to provide an adequate return to its shareholders. This is achieved
by pricing products and services commensurately within the level of risk.
Vista Group monitors capital requirements to ensure that it meets its lending covenant obligations and to maintain
an efficient overall financing structure. At balance date Vista Group maintains low levels of debt.
The amounts managed as capital by Vista Group for the reporting periods under review are summarised as follows:
2017 2016
NZ$’000 NZ$’000
Consolidated shareholders’ funds 148,101 138,367
Consolidated assets 204,235 191,625
Capital ratio 73% 72%
31ANNUAL FINANCIAL STATEMENTS 2017
NOTES TO THE FINANCIAL STATEMENTSCONTINUED

7.ASSETSANDLIABILITIESThis section outlines further details of Vista Group’s financial performance by building on information presented
in the Statement of Financial Position.
7.1 TRADE AND OTHER RECEIVABLES2017 2016
SECTION NZ$’000 NZ$’000
Trade receivables 45,618 45,440
Sundry receivables 11,414 19,979
Accrued revenue 6,193 987
Prepayments 2,481 1,573
Related party loan – Numero 4.4 2,621 2,621
Related party receivables – Numero 4.4 2,792 2,792
Total trade and other receivables 71,119 73,392
Vista Group has recognised a loss of $122,000 (2016: $5,000) in respect of bad debts during the year ended
31 December 2017. The impairment allowance included in trade receivables as at 31 December 2017 was
$976,000 (2016: $110,000). Sundry receivables include a receivable of $8.7m (2016: $16.5m) from WePiao
related to the equity purchase of 18.3% of Vista China. See section 9.4. Trade receivables include a receivable of
$12.8m (2016: $19.0m) from Vista China. See section 4.4 for more detail.
Assessment of the doubtful debt provision
The assessment of providing for doubtful debts involves judgement. The collectability of trade receivables
and sundry receivables is reviewed on an on-going basis. A provision for impairment is established when there
is objective evidence that Vista Group will not be able to collect an amount due according to the original terms
of the receivable. See section 5.4 for detail.
7.2 INTANGIBLE ASSETS
Intangible assets
Intangible assets are measured on initial recognition at cost. The cost of intangible assets acquired in a business
combination is their fair value at the date of acquisition. Following initial recognition, intangible assets are carried
at cost less any accumulated amortisation and accumulated impairment losses.
Intangible assets with finite lives are amortised over the useful economic life. The amortisation period and the
amortisation method for an intangible asset with a finite life are reviewed at least at the end of each reporting period.
The amortisation expense on intangible assets with finite lives is recognised in the statement of comprehensive
income in the expense category that is consistent with the function of the intangible assets.
Development costs and internally generated software
Costs associated with maintaining computer software programmes are recognised as an expense within the
statement of comprehensive income as incurred. Development costs that are directly attributable to the design
and testing of identifiable and unique software products controlled by Vista Group are recognised as intangible
assets only when all of the following criteria are met:
• it is technically feasible to complete the software product so that it will be available for use;
• management intends to complete the software product and use or sell it;
• there is an ability to use or sell the software product;
• it can be demonstrated how the software product will generate probable future economic benefits;
• adequate technical, financial and other resources to complete the development and to use or sell the software
product are available; and
• the expenditure attributable to the software product during its development can be reliably measured.
Other development expenditures that do not meet this criteria are recognised as an expense as incurred within
operating expenses. Development costs previously recognised as an expense are not recognised as an asset in
a subsequent period.
32VISTA GROUP INTERNATIONAL LIMITED
NOTES TO THE FINANCIAL STATEMENTSCONTINUED

Other intangible assets
Intellectual property has been acquired through business combinations and amounts spent subsequently.
Customer relationships include the purchase of existing customer bases via an existing license agreement
or business combination. Software licenses include the purchase of third party software in the normal course
of business. Internally generated software is recognised on the basis described above.
Intangible assets are amortised on a straight-line basis over the following useful economic lives:
• Intellectual property 4 to 15 years;
• Customer relationships 4 to 15 years;
• Software licenses 2.5 to 15 years;
• Internally generated software 3 to 5 years based on their estimated useful life
Refer to section 7.4 for policies on goodwill measurement and impairment testing.
31 DECEMBER 2017
INTERNALLY GENERATED SOFTWARE
SOFTWARE LICENSES
INTELLECTUAL PROPERTY
CUSTOMER RELATIONSHIPS TOTAL
NZ$’000 NZ$’000 NZ$’000 NZ$’000 NZ$’000
Gross carrying amount
Balance 1 January 4,814 2,362 1,940 7,275 16,391
Acquisition through business combinations (section 4.1)
- 52 - - 52
Internally generated software 4,937 - - - 4,937
Additions - 52 16 - 68
Exchange differences 11 179 180 533 903
Balance 31 December 2017 9,762 2,645 2,136 7,808 22,351
Accumulated amortisation
Balance 1 January (96) (675) (673) (2,158) (3,602)
Accumulated amortisation reclassification - (141) 224 (83) -
Current year amortisation (529) (212) (340) (1,268) (2,349)
Exchange differences (1) (40) 64 (362) (339)
Balance 31 December 2017 (626) (1,068) (725) (3,871) (6,290)
Carrying amount 31 December 2017 9,136 1,577 1,411 3,937 16,061
31 DECEMBER 2016
INTERNALLY GENERATED SOFTWARE
SOFTWARE LICENSES
INTELLECTUAL PROPERTY
CUSTOMER RELATIONSHIPS TOTAL
NZ$’000 NZ$’000 NZ$’000 NZ$’000 NZ$’000
Gross carrying amount
Balance 1 January 643 2,260 1,608 6,469 10,980
Acquisition through business combinations - 38 419 - 457
Internally generated software 4,171 - - - 4,171
Additions - 64 - 1,117 1,181
Exchange differences - - (87) (311) (398)
Balance 31 December 2016 4,814 2,362 1,940 7,275 16,391
Accumulated amortisation
Balance 1 January - (523) (211) (1,094) (1,828)
Current year amortisation (96) (152) (624) (1,436) (2,308)
Exchange differences - - 162 372 534
Balance 31 December 2016 (96) (675) (673) (2,158) (3,602)
Carrying amount 31 December 2016 4,718 1,687 1,267 5,117 12,789
33ANNUAL FINANCIAL STATEMENTS 2017
NOTES TO THE FINANCIAL STATEMENTSCONTINUED

7.3 PROPERTY, PLANT AND EQUIPMENT
Property, plant and equipment
Items of property, plant and equipment are measured at cost less accumulated depreciation and impairment
losses. Cost includes expenditure that is directly attributable to the acquisition of the asset.
The cost of replacing part of an item of property, plant and equipment is recognised in the carrying amount
of the item if it is probable that the future economic benefits embodied within the asset will flow to Vista Group
and its cost can be measured reliably. The costs of the day-to-day servicing of property, plant and equipment
are recognised within the statement of comprehensive income as incurred.
Depreciation is provided on fixtures, fittings and computers. Depreciation is recognised in the profit or loss to write
off the cost of an item of property, plant and equipment, less any residual value, over its expected useful life:
• Fixtures and fittings 6 to 14 years straight line
• Computer equipment 2.5 to 6 years straight line
2017
FIXTURES & FITTINGS
COMPUTER EQUIPMENT TOTAL
NZ$’000 NZ$’000 NZ$’000
Gross carrying amount
Balance 1 January 4,200 3,665 7,865
Assets no longer in use (219) (1,432) (1,651)
Acquisition through business combinations (section 4.1) - 57 57
Additions 429 1,200 1,629
Exchange differences 180 25 205
Balance 31 December 2017 4,590 3,515 8,105
Accumulated depreciation
Balance 1 January (1,255) (2,448) (3,703)
Assets no longer in use 372 1,288 1,660
Current year depreciation (443) (836) (1,279)
Exchange differences (73) (73) (146)
Balance 31 December 2017 (1,399) (2,069) (3,468)
Carrying amount 31 December 2017 3,191 1,446 4,637
2016
FIXTURES & FITTINGS
COMPUTER EQUIPMENT TOTAL
NZ$’000 NZ$’000 NZ$’000
Gross carrying amount
Balance 1 January 2,441 2,761 5,202
Divestment of Vista China assets (87) (78) (165)
Acquisition through business combinations 24 97 121
Additions 1,873 955 2,828
Exchange differences (51) (70) (121)
Balance 31 December 2016 4,200 3,665 7,865
Accumulated depreciation
Balance 1 January (824) (1,998) (2,822)
Current year depreciation (474) (570) (1,044)
Divestment of Vista China assets 10 29 39
Exchange differences 33 91 124
Balance 31 December 2016 (1,255) (2,448) (3,703)
Carrying amount 31 December 2016 2,945 1,217 4,162
34VISTA GROUP INTERNATIONAL LIMITED
NOTES TO THE FINANCIAL STATEMENTSCONTINUED

7.4 IMPAIRMENT TESTING
Impairment testing of goodwill and other assets
Goodwill is not amortised and is tested for impairment annually irrespective of whether there is any indication
of impairment. If any such indication exists, then the asset’s recoverable amount is estimated. After initial
recognition goodwill is measured at cost less any accumulated impairment losses.
Other assets are tested for impairment whenever events or changes in circumstances indicate that the carrying
amount may not be recoverable.
An impairment loss is recognised if the carrying amount of an asset exceeds its recoverable amount. Impairment
losses are recognised in the statement of comprehensive income.
The recoverable amount of an asset is the greater of its value in use and its fair value less cost to sell. For the
purposes of assessing impairment, assets are grouped at the lowest levels for which there are separately
identifiable cash inflows which are largely independent of the cash inflows from other assets or groups of assets
(cash-generating units). The allocation is made to those cash generating units that are expected to benefit from
the business combination in which goodwill arose. In assessing value in use, the estimated future cash flows are
discounted to their present value using a pre-tax discount rate that reflects current market assessments of the
time value of money and the risks specific to the asset.
Critical judgements used in applying accounting policies and estimation uncertainty
Information about estimates and judgements that have the most significant effect on recognition and
measurement of goodwill and intangible assets are provided below. Actual results may be substantially different.
Goodwill and other intangible assets
The amount of goodwill initially recognised is dependent on the allocation of the purchase price to the fair value
of the identifiable assets acquired and the liabilities assumed. The determination of the fair value of the assets and
liabilities, particularly intangible assets is based, to a considerable extent, on management’s judgement.
Judgement is applied specifically to assumptions in the value in use calculation for impairment testing purposes,
as detailed below.
Goodwill has been allocated to the following Cash Generating Units (CGU):
– Vista Entertainment Solutions Limited – Powster Limited
– Virtual Concepts Limited – Share Dimension BV
– MACCS International BV – Flicks.co.nz Limited
This is the lowest level at which goodwill is monitored for internal management reporting purposes. Value in use
calculations are used in determining the recoverable amount of each CGU. Management has projected the cash flows
for each CGU over a five-year period based on approved budgets for the first year. Determination of appropriate post
tax cash flows, terminal growth rates and discount rates for the calculation of value in use is subjective and requires a
number of assumptions and estimates to be made, including growth in revenue and net profit, timing and quantum of
future capital expenditure, working capital, long term growth rates and the selection of discount rates to reflect the
risks involved.
The key assumptions used for the value in use calculation are as follows:2017 2016
NZ$’000 NZ$’000
Revenue growth average over 5 years 9% – 38% 13% – 50%
Terminal growth rate 2.5% 2.5%
CGU post-tax WACC rate
Vista Entertainment Solutions Limited 9.0% 9.0%
Virtual Concepts Limited 9.0% 16.0%
Flicks.co.nz 9.0% 9.0%
MACCS International BV 11.5% 9.0%
Powster Limited 12.0% 12.0%
Share Dimension BV 12.6% 16.0%
35ANNUAL FINANCIAL STATEMENTS 2017
NOTES TO THE FINANCIAL STATEMENTSCONTINUED

Other factors considered when testing goodwill for impairment include:
• actual financial performance against budgeted financial performance;
• any material unfavourable operational and regulatory factors; and
• any material unfavourable economic outlook and market competition.
Impairment testing results
The calculations confirmed that there was no impairment of goodwill during the year (2016: Nil). The Board
believes that any reasonable possible change in the key assumptions used in the calculations for all CGU’s,
with the exception of MACCS International BV and Share Dimension BV, would not cause the carrying amount
to exceed the recoverable amount.
The MACCS International BV CGU impairment test is sensitive to WACC discount rate, sales growth and terminal
growth assumptions. Detailed below is the amount by which each assumption would have to change to result
in the recoverable amount being equal to the carrying value. The relevant sensitivities in key assumptions are
as follows:
• WACC discount rate: 50 basis points increase
• Sales growth: 390 basis points reduction
• Terminal value sales growth: 230 basis points reduction
The Share Dimension BV CGU demonstrates sensitivity to revenue assumptions. Assumptions used for the purpose
of assessing the value in use are premised upon the penetration of Share Dimension software across Vista Cinema
sites over the next five years. Should the long term penetration rate be lower than assumed, such that average
sales growth over the 5 year period reduced by 200 basis points, then this would result in its value in use amount
being equal to its carrying value.
7.5 TRADE AND OTHER PAYABLES2017 2016
SECTION NZ$’000 NZ$’000
Trade payables 4,413 6,229
Sundry accruals 3,988 4,231
Deferred lease incentives 419 510
Constructive obligations – associates 4.4 - 50
Employee benefits 4,709 2,436
Employee benefits – VCL contingent consideration 4.2 1,240 1,063
Total trade and other payables 14,769 14,519
Included in trade and other payables is a balance of $3.2m (2016: $2.7m) payable to the associate company Vista China.
See section 4.4 for detail.
36VISTA GROUP INTERNATIONAL LIMITED
NOTES TO THE FINANCIAL STATEMENTSCONTINUED

7.6 EMPLOYEE BENEFIT PAYABLES AND ACCRUALS
Short-term employee benefits
Accruals for wages, salaries, including non-monetary benefits, commissions and annual leave expected to be
settled within 12 months of the reporting date are recognised in respect of employees’ services up to the reporting
date. They are measured at the amounts expected to be paid using the remuneration rate expected to apply at the
time of settlement, on an undiscounted basis. Expenses for non-accumulating sick leave are recognised when the
leave is taken and are measured at the rates paid or payable.
Vista Group has pension obligations in respect of various defined contribution plans. Vista Group pays contributions
to publicly or privately administered pension insurance plans on a mandatory or contractual basis. Vista Group
has no further payment obligations once the contributions have been paid. The contributions are recognised
as an employee entitlement expense when they are due.
Employee benefits expense included in total expenses2017 2016
NZ$’000 NZ$’000
Wages and salaries 52,190 40,324
Share-based payment expense 752 551
Defined contribution plans 2,987 3,716
Total employee benefits 55,929 44,591
37ANNUAL FINANCIAL STATEMENTS 2017
NOTES TO THE FINANCIAL STATEMENTSCONTINUED

8.TAX
8.1 INCOME TAX EXPENSE
Income tax
The income tax expense for the period comprises current and deferred tax. Tax is recognised in profit or loss
in the Statement of Comprehensive Income, except to the extent that it relates to items recognised in other
comprehensive income or directly in equity. In this case, the tax is also recognised in other comprehensive
income or directly in equity, respectively.
The current income tax expense is calculated on the basis of the tax laws enacted or substantively enacted at
the balance sheet date in the countries where Vista Group’s subsidiaries operate and generate taxable income.
Management periodically evaluates positions taken in tax returns with respect to situations in which applicable
tax regulations are subject to interpretation and establishes provisions where appropriate on the basis of amounts
expected to be paid to the tax authorities.
2017 2016
NZ$’000 NZ$’000
Income tax expense comprises:
Current tax expense 7,977 5,326
Deferred tax expense (section 8.2) (1,147) (1,776)
Tax expense 6,830 3,550
Reconciliation of income tax expense
The relationship between the expected tax expense based on the domestic effective tax rate of the Company at 28%
(2016: 28%) and the reported tax expense in the statement of comprehensive Income can be reconciled as follows:
2017 2016
NZ$’000 NZ$’000
Profit before tax 16,813 53,030
Taxable income 16,813 53,030
Domestic tax rate for Vista Group International Limited 28% 28%
Expected tax expense 4,708 14,848
Foreign subsidiary company tax 99 (358)
Non-assessable income/non-deductible expenses 1,713 (10,579)
Prior period adjustment 127 (314)
Deferred taxation not previously recognised - 4
Impairment of foreign tax credits - -
Other 183 (51)
Actual tax expense 6,830 3,550
As at 31 December 2017, Vista Group has $8,881,478 (2016: $5,839,264) of imputation credits available for use
in subsequent reporting periods.
8.2 DEFERRED TAX ASSETS AND LIABILITIES
Deferred income tax
Deferred income tax is provided in full, using the liability method, on temporary differences arising between tax
bases of assets and liabilities and their carrying amounts in the consolidated financial statements. However, the
deferred income tax is not accounted for if it arises from initial recognition of an asset or liability in a transaction
other than a business combination that at the time of the transaction affects neither accounting nor taxable profit
or loss. Deferred income tax is determined using tax rates (and laws) that have been enacted or substantially
enacted by the balance sheet date and are expected to apply when the related deferred income tax asset is
realised or the deferred income tax liability is settled.
38VISTA GROUP INTERNATIONAL LIMITED
NOTES TO THE FINANCIAL STATEMENTSCONTINUED

Deferred income tax assets are recognised to the extent that it is probable that future taxable profit will be available
against which the temporary differences can be utilised.
Deferred income tax is provided on temporary differences arising on investments in subsidiaries and associates,
except where the timing of the reversal of the temporary difference is controlled by Vista Group and it is probable
that the temporary difference will not reverse in the foreseeable future.
Deferred income tax assets and liabilities are offset when there is a legally enforceable right to offset current tax
assets against current tax liabilities and when the deferred income taxes assets and liabilities relate to income
taxes levied by the same taxation authority on either the same taxable entity or different taxable entities where
there is an intention to settle the balances on a net basis.
Deferred taxes arising from temporary differences and unused tax losses can be summarised as follows:
2017
OPENING BALANCE
ACQUIRED AS PART OF A BUSINESS
COMBINATION
RECOGNISED IN INCOME
STATEMENTCLOSING
BALANCE
NZ$’000 NZ$’000 NZ$’000 NZ$’000
Trade and sundry receivables 28 - 196 224
Employee benefits 422 - 52 474
Property, plant and equipment (194) - 86 (108)
Other 59 - 113 172
Intangible assets (1,686) (74) 225 (1,535)
Unused tax losses 997 - 475 1,472
Deferred tax temporary asset/(liability) (374) (74) 1,147 699
2016
OPENING BALANCE
ACQUIRED AS PART OF A BUSINESS
COMBINATION
RECOGNISED IN INCOME
STATEMENTCLOSING
BALANCE
NZ$’000 NZ$’000 NZ$’000 NZ$’000
Trade and sundry receivables 15 - 13 28
Employee benefits 324 - 98 422
Property, plant and equipment (185) - (9) (194)
Other (513) - 572 59
Intangible assets (1,884) (89) 287 (1,686)
Unused tax losses 182 - 815 997
Deferred tax temporary asset/(liability) (2,061) (89) 1,776 (374)
The analysis of deferred tax assets and liabilities is as follows:
2017 2016
NZ$’000 NZ$’000
Deferred tax assets:
Deferred tax assets to be recovered after more than 12 months 1,472 1,105
Deferred tax assets to be recovered within 12 months 870 436
Deferred tax liabilities:
Deferred tax liability to be recovered after more than 12 months (1,643) (1,880)
Deferred tax liability to be recovered within 12 months - (35)
39ANNUAL FINANCIAL STATEMENTS 2017
NOTES TO THE FINANCIAL STATEMENTSCONTINUED

9.OTHERINFORMATION
9.1 EXPENSES
Government grants
Government grants are recognised where there is reasonable assurance that the grant will be received and
all attached conditions will be complied with. When the grant relates to an expense item it is recognised as a
deduction against that cost on a systematic basis over the periods that the related costs, for which it is intended
to compensate, are expensed. When the grant relates to an asset, it is recognised as income in equal amounts
over the expected useful life of the related asset.
During the year, Vista Group recognised a total of $3.6m (2016: $1.86m) of grants from Callaghan Innovation in
New Zealand and Ministry of Economic Affairs (WBSO) in the Netherlands to assist with Research and Development.
At balance date, there is a 10% retention amount related to 2017 grants of $0.3m yet to be paid and subject to
independent auditor review. Government grants are recognised within the statement of comprehensive income
as other income within operating expenses.
Auditor’s remuneration included in administration expenses2017 2016
NZ$’000 NZ$’000
Audit of financial statements
Audit and review of financial statements – PwC 314 239
Audit and review of financial statements – Scrutton Bland 30 -
Other services
Performed by PwC:
IFRS accounting advice - 10
Review of R&D growth grant 7 8
Advice on long-term employee incentive scheme 8 7
FRS 101 conversion accounting advice for UK subsidiary - 12
iXBRL financial statement tagging - 4
Due diligence agreed upon procedures 13 19
Total other services 28 60
Total fees paid to auditor(s) 372 299
Other expenses2017 2016
NZ$’000 NZ$’000
Included in administration expenses:
Depreciation (section 7.3) 1,279 1,044
Amortisation of intangible assets (section 7.2) 2,349 2,308
Lease payments recognised as an operating lease expense 2,880 2,572
Vista Group has expensed $14.7m of aggregated research and development expenditure associated with software
research and development for 2017 (2016: $8.1m) within operating expenses in the statement of comprehensive income.
40VISTA GROUP INTERNATIONAL LIMITED
NOTES TO THE FINANCIAL STATEMENTSCONTINUED

9.2 OPERATING LEASES
Leased assets
All leases are operating leases. Leases in which a significant portion of the risks and rewards of ownership are
not transferred to Vista Group as a lessee are classified as an operating lease. Payments made under operating
leases (net of any incentives received from the lessor) are charged to the statement of comprehensive income
on a straight-line basis over the period of the lease. Associated costs, such as maintenance and insurance, are
expensed as incurred in the statement of comprehensive income.
Operating lease commitments
Vista Group has operating lease commitments in respect of property and equipment. The total future minimum
payments under non-cancellable operating leases were payable as follows:
2017 2016
NZ$’000 NZ$’000
Less than one year 2,923 2,552
Between one and five years 3,758 5,451
More than five years – -
6,681 8,003
9.3 FINANCIAL INSTRUMENTS
Financial instruments
The classification of financial assets and liabilities depends on the purpose for which the financial assets were
acquired. Management determines the classification of Vista Group’s financial assets and liabilities at initial recognition.
Vista Group’s financial assets for the periods covered by these financial statements consist only of loans
and receivables.
Vista Group measures all financial liabilities, with the exception of contingent consideration, at amortised cost in
the periods covered by these financial statements. Contingent consideration is measured at fair value. Contingent
consideration is classified as equity or a financial liability. Amounts classified as a financial liability are subsequently
remeasured to fair value with changes in the fair value recognised in the statement of comprehensive income.
(a) Loans and receivables
Loans and receivables are non-derivative financial assets with fixed or determinable payments that are not quoted
in an active market. They are included in current assets, except for loans and receivables with maturities greater
than 12 months after the balance sheet date. These are classified as non-current assets. Vista Group’s loans and
receivables comprise ‘trade and other receivables’ in the statement of financial position.
(b) Financial liabilities measured at amortised cost
Financial liabilities measured at amortised cost are non-derivative financial liabilities with fixed or determinable
payments that are not quoted in an active market. Trade and other payables, employee benefits, related party
loans and borrowings are classified as financial liabilities measured at amortised cost.
Recognition and derecognition
Financial assets are derecognised when the rights to receive cash flows from the financial assets have expired
or have been transferred and Vista Group has transferred substantially all the risks and rewards of ownership.
Financial liabilities are derecognised if Vista Group’s obligations specified in the contract expire or are discharged
or cancelled.
Measurement
At initial recognition, Vista Group measures a financial asset and liability at its fair value plus transaction costs
that are directly attributable to the acquisition of the financial asset.
After initial recognition, loans and receivables are subsequently carried at amortised cost using the effective
interest method. After initial recognition, financial liabilities are measured at amortised cost using the effective
interest method.
41ANNUAL FINANCIAL STATEMENTS 2017
NOTES TO THE FINANCIAL STATEMENTSCONTINUED

Impairment
Vista Group assesses at the end of each reporting period whether there is objective evidence that a financial
asset or group of financial assets is impaired. A financial asset or a group of financial assets is impaired and
impairment losses are incurred only if there is objective evidence of impairment as a result of one or more events
that occurred after the initial recognition of the asset (a ‘loss event’) and that loss event (or events) has an impact
on the estimated future cash flows of the financial asset or group of financial assets that can be reliably estimated.
Evidence of impairment may include indications that the debtor or group of debtors is experiencing significant
financial difficulty, default or delinquency in interest or principal payments, the probability that they will enter
bankruptcy or other financial reorganisation and observable data indicating that there is a measurable decrease
in the estimated future cashflows, such as changes in arrears or economic conditions that correlate with defaults.
For loans and receivables, the amount of the loss is measured as the difference between the asset’s carrying
amount and the present value of estimated future cash flows (excluding future credit losses that have not been
incurred) discounted at the financial asset’s original effective interest rate. The carrying amount of the asset is
reduced and the amount of the loss is recognised in the statement of comprehensive income.
If, in a subsequent period, the amount of the impairment loss decreases and the decrease can be related objectively
to an event occurring after the impairment was recognised (such as an improvement in the debtor’s credit rating),
the reversal of the previously recognised impairment loss is recognised in the statement of comprehensive income.
Fair value of financial assets and liabilities
Vista Group’s financial assets and liabilities by category are summarised as follows:
Cash and short term deposits
These are short term in nature and carrying value is equivalent to their fair value.
Trade, related party and other receivables
These assets are short term in nature and are reviewed for impairment; the carrying value approximates their
fair value.
Trade, related party and other payables
These liabilities are mainly short term in nature with the carrying value approximating their fair value.
Related party loans
Fair value is estimated based on current market interest rates available for receivables of similar maturity and risk.
The interest rate is used to discount future cash flows.
Borrowings
Borrowings have fixed and floating interest rates. Fair value is estimated using the discounted cash flow model
based on a current market interest rate for similar products; the carrying value approximates their fair value.
Fair values
Vista Group’s financial instruments that are measured subsequent to initial recognition at fair values and are
grouped into levels based on the degree to which the fair value is observable:
Level 1 – fair value measurements derived from quoted prices in active markets for identical assets.
Level 2 – fair value measurements derived from inputs other than quoted prices included within level 1 that are
observable for the asset or liability, either directly or indirectly.
Level 3 – fair value measurements derived from valuation techniques that include inputs for the asset or liability
which are not based on observable market data.
There have been no transfers between levels or changes in the valuation methods used to determine the fair value
of the Group’s financial instruments during the period. As at 31 December 2017 Vista Group has $0.9m (2016: $3.1m)
of level 3 financial instruments related to contingent consideration.
42VISTA GROUP INTERNATIONAL LIMITED
NOTES TO THE FINANCIAL STATEMENTSCONTINUED

Financial instruments by category
2017 2016
SECTION NZ$’000 NZ$’000
Loans and receivables
Cash 5.1 20,954 15,798
Short term deposits - 5,540
Trade receivables 7.1 45,618 45,440
Sundry receivables 7.1 11,414 19,979
Related party loan – Numero 4.4 2,621 2,621
Related party receivable – Numero 4.4 2,792 2,792
83,399 92,170
Financial liabilities measured at amortised cost
Trade payables 7.5 4,413 6,229
Sundry accruals 7.5 3,988 4,231
Borrowings 5.3 11,323 4,848
Financial liabilities measured at fair value
Contingent consideration 4.1 908 3,122
20,632 18,430
9.4 OTHER DISCLOSURES
Contingent liabilities
There were no contingent liabilities for Vista Group at 31 December 2017 (2016: Nil).
Capital commitments
There were no capital commitments for Vista Group at 31 December 2017 (2016: Nil).
Events after balance date
On 20 February 2018, Vista Group announced that it had signed an equity transfer agreement and a shareholder
agreement which re-establish Vista China as a consolidated entity of Vista Group. The equity transfer
agreement signed with Beijing Weying Technology Co, Limited (WePiao) is to acquire 7.9% of the equity in Vista
Entertainment Solutions Limited, Shanghai Limited (Vista China), bringing Vista Group’s equity holding to 47.5%.
Through the shareholder agreement Vista Group achieves effective control of Vista China and will therefore
consolidate its results from the date regulatory approval is obtained. The amount payable by Vista Group under
the agreements have been offset against the outstanding receivable from WePiao.
On 23 February 2018, the directors approved a fully imputed final dividend of 1.74 cents per share. The dividend
record date and payment date will be confirmed in an announcement in early March 2018.
There have been no other events subsequent to 31 December 2017 which materially impact on the results
reported (2016: Nil).
43ANNUAL FINANCIAL STATEMENTS 2017
NOTES TO THE FINANCIAL STATEMENTSCONTINUED

PricewaterhouseCoopers, 188 Quay Street, Private Bag 92162, Auckland 1142, New ZealandT: +64 9 355 8000, F: +64 9 355 8001, pwc.co.nz
Independent auditor’s reportTo the shareholders of Vista Group International Limited
The financial statements comprise:
the statement of financial position as at 31 December 2017;
the statement of comprehensive income for the year then ended;
the statement of changes in equity for the year then ended;
the statement of cashflows for the year then ended; and
the notes to the financial statements, which include the principal accounting policies.
Our opinionIn our opinion, the financial statements of Vista Group International Limited (the Company),including its subsidiaries (the Group), present fairly, in all material respects, the financial position ofthe Group as at 31 December 2017, its financial performance and its cash flows for the year then endedin accordance with New Zealand Equivalents to International Financial Reporting Standards (NZIFRS) and International Financial Reporting Standards (IFRS).
Basis for opinionWe conducted our audit in accordance with International Standards on Auditing (New Zealand) (ISAsNZ) and International Standards on Auditing (ISAs). Our responsibilities under those standards arefurther described in the Auditor’s responsibilities for the audit of the consolidated financialstatements section of our report.
We believe that the audit evidence we have obtained is sufficient and appropriate to provide a basis forour opinion.
We are independent of the Group in accordance with Professional and Ethical Standard 1 (Revised)Code of Ethics for Assurance Practitioners (PES 1) issued by the New Zealand Auditing and AssuranceStandards Board and the International Ethics Standards Board for Accountants’ Code of Ethics forProfessional Accountants (IESBA Code), and we have fulfilled our other ethical responsibilities inaccordance with these requirements.
Our firm carries out other services for the Group in the areas of related assurance services andadvisory services. These services include assurance over R&D grants, advice in relation to the longterm employee incentive scheme and agreed upon procedures in relation to acquisition completionaccounts. The provision of these other services has not impaired our independence as auditor of theGroup.
44VISTA GROUP INTERNATIONAL LIMITED

PwC 2
Our audit approachOverview
An audit is designed to obtain reasonable assurance whether the financialstatements are free from material misstatement.
Overall group materiality: $1.0 million, which represents approximately 0.9%of total revenues.
We chose total revenues as the benchmark because, in our view, it is a keyfinancial statement metric used in assessing the performance and growth of theGroup. It is also, in our view, the most reliable benchmark and is a generallyaccepted benchmark. We used a materiality threshold of 0.9% of revenuebased on our professional judgement, noting that it is also within the range ofcommonly accepted revenue related thresholds.
We agreed with the Audit and Risk Committee that we would report to themmisstatements identified during our audit above $50,000 as well asmisstatements below that amount that, in our view, warranted reporting forqualitative reasons.
We have determined that there are three key audit matters:
Investment in Vista Entertainment Solutions Shanghai Limited (“VistaChina”) and receivables due from Vista China and Bejing WeyingTechnology Co. (“WePaio”);
Impairment testing of goodwill; and
Recoverability of trade receivables and other receivables.
MaterialityThe scope of our audit was influenced by our application of materiality.
Based on our professional judgement, we determined certain quantitative thresholds for materiality,including the overall Group materiality for the financial statements as a whole as set out above. These,together with qualitative considerations, helped us to determine the scope of our audit, the nature,timing and extent of our audit procedures and to evaluate the effect of misstatements, bothindividually and in aggregate on the financial statements as a whole.
Audit scopeWe designed our audit by assessing the risks of material misstatement in the financial statements andour application of materiality. As in all of our audits, we also addressed the risk of managementoverride of internal controls including among other matters, consideration of whether there wasevidence of bias that represented a risk of material misstatement due to fraud.
We tailored the scope of our audit in order to perform sufficient work to enable us to provide anopinion on the financial statements as a whole, taking into account the structure of the Group, theaccounting processes and controls, and the industry in which the Group operates.
We performed full scope audits of the financially significant subsidiaries of the Group, as well as theholding company. In addition, we also performed specific audit procedures over certain balances andtransactions of other subsidiaries and associates.
45ANNUAL FINANCIAL STATEMENTS 2017
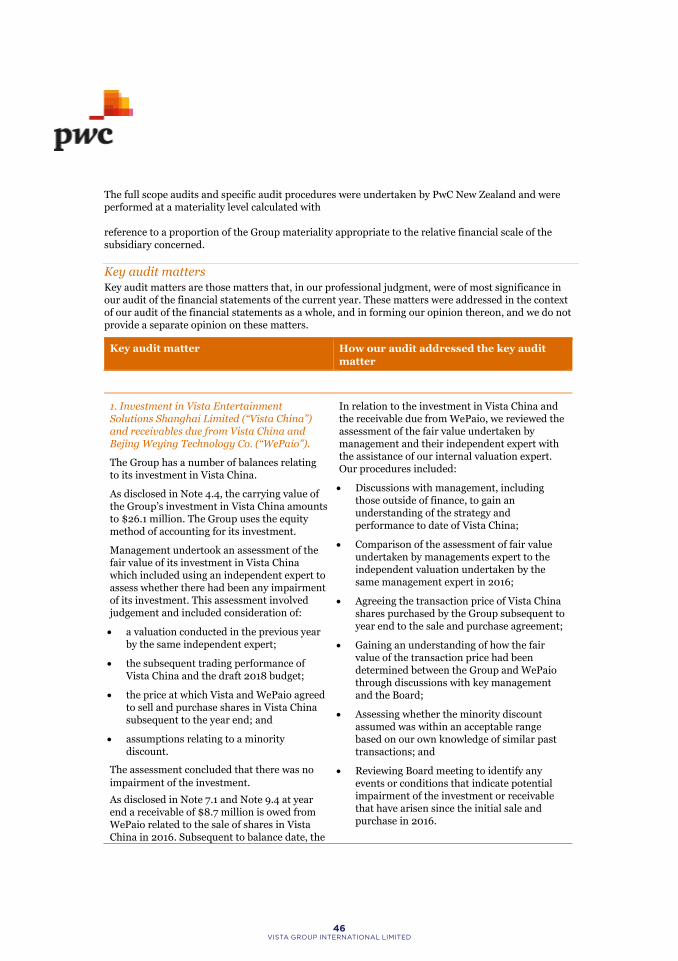
PwC 2
The full scope audits and specific audit procedures were undertaken by PwC New Zealand and wereperformed at a materiality level calculated with
reference to a proportion of the Group materiality appropriate to the relative financial scale of thesubsidiary concerned.
Key audit mattersKey audit matters are those matters that, in our professional judgment, were of most significance inour audit of the financial statements of the current year. These matters were addressed in the contextof our audit of the financial statements as a whole, and in forming our opinion thereon, and we do notprovide a separate opinion on these matters.
Key audit matter How our audit addressed the key auditmatter
1. Investment in Vista EntertainmentSolutions Shanghai Limited (“Vista China”)and receivables due from Vista China andBejing Weying Technology Co. (“WePaio”).
The Group has a number of balances relatingto its investment in Vista China.
As disclosed in Note 4.4, the carrying value ofthe Group’s investment in Vista China amountsto $26.1 million. The Group uses the equitymethod of accounting for its investment.
Management undertook an assessment of thefair value of its investment in Vista Chinawhich included using an independent expert toassess whether there had been any impairmentof its investment. This assessment involvedjudgement and included consideration of:
a valuation conducted in the previous yearby the same independent expert;
the subsequent trading performance ofVista China and the draft 2018 budget;
the price at which Vista and WePaio agreedto sell and purchase shares in Vista Chinasubsequent to the year end; and
assumptions relating to a minoritydiscount.
The assessment concluded that there was noimpairment of the investment.
As disclosed in Note 7.1 and Note 9.4 at yearend a receivable of $8.7 million is owed fromWePaio related to the sale of shares in VistaChina in 2016. Subsequent to balance date, the
In relation to the investment in Vista China andthe receivable due fromWePaio, we reviewed theassessment of the fair value undertaken bymanagement and their independent expert withthe assistance of our internal valuation expert.Our procedures included:
Discussions with management, includingthose outside of finance, to gain anunderstanding of the strategy andperformance to date of Vista China;
Comparison of the assessment of fair valueundertaken by managements expert to theindependent valuation undertaken by thesame management expert in 2016;
Agreeing the transaction price of Vista Chinashares purchased by the Group subsequent toyear end to the sale and purchase agreement;
Gaining an understanding of how the fairvalue of the transaction price had beendetermined between the Group and WePaiothrough discussions with key managementand the Board;
Assessing whether the minority discountassumed was within an acceptable rangebased on our own knowledge of similar pasttransactions; and
Reviewing Board meeting to identify anyevents or conditions that indicate potentialimpairment of the investment or receivablethat have arisen since the initial sale andpurchase in 2016.
46VISTA GROUP INTERNATIONAL LIMITED

PwC 4
Group entered into a conditional agreement topurchase 7.9% of the shares in Vista ChinafromWePiao for $8.7 million. This is to besettled through the extinguishment of thereceivable owed by WePiao together with cash.
As disclosed in Note 4.4 at year end the Groupis owed $5.4 million from Vista China relatingto receivables owing prior to the sale of sharesin Vista China in 2016 and $7.3 million owingunder the terms of the Reseller Agreement.
Management has applied judgement indetermining the recoverability of thesereceivables and have determined that nodoubtful debt provision is required.
Our audit procedures in relation to amountsowing from Vista China under the ResellerAgreement and 2016 Sale and PurchaseAgreement included:
Obtaining written confirmations from VistaChina of the amounts owing to the Group atbalance date and that the performanceobligations under the Reseller Agreement hadbeen met;
Obtaining the Vista China Board of Directormeeting minutes where amounts had beenapproved for payment by the Directors ofVista China; and
Assessing Vista China’s ability to payamounts owing through reviewing thefinancial performance and position of VistaChina and confirming the cash position tobank statements at year end and at 27February 2018.
We have no material matters to report.
Impairment testing of goodwill
Note 4.3 provides details of the goodwillbalance of $62.8 million as at 31 December2017.
Management perform an annual assessment todetermine whether there is any impairment ofgoodwill. This is disclosed in Note 7.4.
The value in use methodology was used tovalue each cash generating unit (CGU) andthen these values are compared to the carryingvalue of the associated net assets, includinggoodwill, of each CGU, as at 31 December 2017.
The valuations involve the application ofsignificant judgment in determining certainkey assumptions and estimates, specifically:
Revenue growth rates for the 5 year periodforecast;
Determining the long term growth rates forcash flows beyond the 5 year forecastperiod; and
Estimating an appropriate discount rate foreach CGU.
Our audit procedures in relation to impairmenttesting of goodwill included the following.
We gained an understanding of the businessprocesses and controls applied by managementin assessing whether there was any impairmentof goodwill.
We held discussions with management, includingthose outside of the finance team, about theperformance of each CGU and whether therewere any events or circumstances that indicatedthat the carrying value of the CGU, includinggoodwill, was impaired.
We assessed the reasonableness of the keyestimates and assumptions made bymanagement in the various valuations, byperforming the following procedures with theassistance of our internal valuation expert:
Obtaining an understanding of howmanagement prepared its budgets andforecast and the associated review andapproval processes;
Assessing the reliability of management’sability to budget and forecast;
47ANNUAL FINANCIAL STATEMENTS 2017

PwC 5
Management’s assessment concluded thatgoodwill was not impaired as at 31 December2017. However, the valuations of ShareDimension BV and MACCS International BVwere sensitive to reasonably possible changesin revenue growth assumptions, long termgrowth and the discount rate, and suchchanges could result in an impairment, asdisclosed in Note 7.4 of the financialstatements.
Comparing the growth rates used over the 5year period to historical growth rates, boardapproved budgets and other strategic andoperational initiatives being undertaken, aswell as challenging whether the historicalgrowth rates are sustainable as the businessesmature;
Comparing the terminal growth rates toindustry growth rates for similar marketparticipants;
Evaluating the discount rates used andcomparing these discount rates againstsimilar market participants; and
Performing our own sensitivity analysis onthe impact of changing key assumptions toconsider whether any reasonably possiblechanges could result in impairment ofgoodwill.
We have no material matters to report.
Recoverability of trade receivables and otherreceivables
Trade and other receivables are disclosed inNote 7.1. The Group had $18.2 million of tradereceivables (excluding Vista China) that arepast due but not impaired at 31 December2017, as disclosed in Note 5.4.
Management assessed the recoverability oftrade and other receivables, which involvedjudgements in relation to assessing the creditrisk of the associated customers orcounterparty and expected future cash flowsbased on, payment history, age of the debt andthe nature of the customer relationship.
Management concluded that it was appropriateto recognise an impairment provision of $1.0million at 31 December 2017, as disclosed inNote 7.1 and a provision relating to advances toan associate of $1.7 million, as disclosed inNote 4.4.
Our audit procedures in relation to recoverabilityof trade receivables and other receivablesincluded the following.
We gained an understanding of the businessprocesses and controls over managing overduetrade and other receivables, and thedetermination of doubtful debt provisions.
We considered the historical recoverability of theaged debt as well as the Group’s experience ofbad debts.
We tested on sample basis the aging ofreceivables back to invoices to assess theaccuracy of the aged trade receivable report usedin determining doubtful debts.
On a sample basis, we performed the followingprocedures to assess the recoverability of tradeand other receivables:
gained an understanding of the customer orcounterparty terms and conditions;
validated whether any payments had beenreceived from customers or counterpartysubsequent to balance date and confirmedthese payments to bank statements andremittance advices;
48VISTA GROUP INTERNATIONAL LIMITED

PwC 6
assessed the customer or counterparties,ability to pay through reviewing financialinformation of the counterparty; and
through discussions with management andcredit controllers, review of correspondencewith customers or counterparty, and a reviewof past payment history we assessed theappropriateness of the year end impairmentprovision.
We have no material matters to report.
Information other than the financial statements and auditor’s reportThe Directors are responsible for the annual report. Our opinion on the financial statements does notcover the other information included in the annual report and we do not express any form of assuranceconclusion on the other information.
In connection with our audit of the financial statements, our responsibility is to read the otherinformation and, in doing so, consider whether the other information is materially inconsistent withthe financial statements or our knowledge obtained in the audit, or otherwise appears to be materiallymisstated. If, based on the work we have performed on the other information that we obtained prior tothe date of this auditor’s report, we conclude that there is a material misstatement of this otherinformation, we are required to report that fact. We have nothing to report in this regard, except thatnot all other information to be included in the annual report, was available to us at the date of oursigning as this has not yet been approved by the Board.
Responsibilities of the Directors for the financial statementsThe Directors are responsible, on behalf of the Company, for the preparation and fair presentation ofthe financial statements in accordance with NZ IFRS and IFRS, and for such internal control as theDirectors determine is necessary to enable the preparation of financial statements that are free frommaterial misstatement, whether due to fraud or error.
In preparing the financial statements, the Directors are responsible for assessing the Group’s ability tocontinue as a going concern, disclosing, as applicable, matters related to going concern and using thegoing concern basis of accounting unless the Directors either intend to liquidate the Group or to ceaseoperations, or have no realistic alternative but to do so.
Auditor’s responsibilities for the audit of the financial statementsOur objectives are to obtain reasonable assurance about whether the financial statements, as a whole,are free from material misstatement, whether due to fraud or error, and to issue an auditor’s reportthat includes our opinion. Reasonable assurance is a high level of assurance, but is not a guaranteethat an audit conducted in accordance with ISAs NZ and ISAs will always detect a materialmisstatement when it exists. Misstatements can arise from fraud or error and are considered materialif, individually or in the aggregate, they could reasonably be expected to influence the economicdecisions of users taken on the basis of these financial statements.
A further description of our responsibilities for the audit of the financial statements is located at theExternal Reporting Board’s website at:
https://www.xrb.govt.nz/standards-for-assurance-practitioners/auditors-responsibilities/audit-report-1/
This description forms part of our auditor’s report.
49ANNUAL FINANCIAL STATEMENTS 2017

PwC 7
Who we report toThis report is made solely to the Company’s shareholders, as a body. Our audit work has beenundertaken so that we might state those matters which we are required to state to them in an auditor’sreport and for no other purpose. To the fullest extent permitted by law, we do not accept or assumeresponsibility to anyone other than the Company and the Company’s shareholders, as a body, for ouraudit work, for this report or for the opinions we have formed.
The engagement partner on the audit resulting in this independent auditor’s report is Julian Prior.
For and on behalf of:
Chartered Accountants Auckland28 February 2018
50VISTA GROUP INTERNATIONAL LIMITED

VISTAGROUPINTERNATIONALLIMITEDLevel 3, 60 Khyber Pass Road
Newton, Auckland 1023
Phone: +64 9 984 4570 Fax: +64 9 379 0685
Email: [email protected] Website: www.vistagroup.co